

Abstract
Purpose:
We evaluated effects of asparaginase dosage, schedule, and formulation on CSF asparagine in children with acute lymphoblastic leukemia (ALL).
Methods:
We evaluated CSF asparagine (2114 samples) and serum asparaginase (5007 samples) in 482 children with ALL treated on the Total XVI study (NCT00549848). Patients received one or two 3,000 IU/m2 IV pegaspargase doses during induction and were then randomized in continuation to receive 2,500 IU/m2 or 3,500 IU/m2 IV intermittently (4 doses) on the low-risk (LR) or continuously (15 doses) on the standard/high risk (SHR) arms. A pharmacokinetic-pharmacodynamic model was used to estimate the duration of CSF asparagine depletion below 1 uM.
Results:
During induction, CSF asparagine depletion after two doses of pegaspargase was twice as long as one dose (median 30.7 vs 15.3 days, p<0.001). During continuation, the higher dose increased the CSF asparagine depletion duration by only 9% on the LR and 1% in the SHR arm, consistent with the nonlinear pharmacokinetics of serum asparaginase. Pegaspargase caused a longer CSF asparagine depletion duration (1.3 to 5.3-fold) compared to those who were switched to erwinase (p<0.001). The median (quartile range) serum asparaginase activity needed to maintain CSF asparagine below 1 μM was 0.44 (0.20, 0.99) IU/mL. Although rare, CNS relapse was higher with decreased CSF asparagine depletion (p=0.0486); there was no association with relapse at any site (p = 0.3).
Conclusions:
The number of pegaspargase doses has a stronger influence on CSF asparagine depletion than did dosage, pegaspargase depleted CSF asparagine longer than erwinase, and CSF asparagine depletion may prevent CNS relapses.
Keywords: pegylated asparaginase, erwinia asparaginase, asparagine, cerebrospinal fluid, acute lymphoblastic leukemia, pediatric, pharmacokinetics, pharmacodynamics
Introduction
Asparaginase, one of the primary components in the treatment of pediatric acute lymphoblastic leukemia (ALL), acts by catalyzing the hydrolysis of asparagine into L-aspartic acid and ammonia. Asparaginase is selective for lymphoblastic leukemia cells because they have a relative defect in synthesizing asparagine. The extent to which asparagine should be depleted for effective therapy has been evaluated, and some have speculated that depleting asparagine levels in the CSF below 1 μM leads to better outcomes [1,2]. Also, more extensive asparaginase treatments have led to fewer relapses [3–6]. However, several studies showed that additional pegaspargase doses after remission induction therapy did not improve outcome in standard risk patients [7,8]. Moreover, data suggested that pegaspargase may not deplete CSF asparagine as well as native asparaginase formulations [2,9–11]. Therefore, the most effective dose or schedule of asparaginase is not clear.
To better understand the effects of asparaginase dose on CSF asparagine depletion, we prospectively evaluated the effects of 2,500 IU/m2 vs 3,500 IU/m2 IV pegaspargase in the St. Jude Children’s Research Hospital Total XVI protocol for newly diagnosed pediatric ALL [12–14]. We used pharmacokinetic and pharmacodynamic modeling approaches to quantify the extent of depletion of CSF asparagine by asparaginase treatment, to evaluate differences in CSF asparagine depletion due to frequency of dosing, dosage, formulation, and route of administration, and to test the association of CSF asparagine depletion with relapse.
Materials and Methods
Patients
Children (N = 598) with newly diagnosed ALL were enrolled in St Jude Children’s Research Hospital Total XVI protocol study from September 2007 to March 2017 (ClinicalTrials.gov identifier: NCT00549848). Consent was obtained from patients and parents/guardians, and details have been described [12].
Asparaginase dosing, CSF Asparagine, data collection, and quantification
Dosages of pegaspargase have been described (Figure S1) [13]. Briefly, all individuals received 3,000 IU/m2 on day 3 of therapy, and those with minimal residual disease ≥ 1% on day 15 received an additional dose of 3,000 IU/m2. During continuation therapy, patients were randomized to receive either 2,500 or 3,500 IU/m2 pegaspargase. Patients on the low risk (LR) arm received two doses of pegaspargase during both reinduction I (weeks 7 and 9 of continuation) and reinduction II (weeks 17 and 19) while patients on the standard risk or high risk (SHR) arms received 15 doses of pegaspargase every other week for the first 30 weeks of continuation therapy. Patients with adverse effects from pegaspargase (e.g. allergy) were switched to erwinase with 5 erwinase doses (30,000 or 42,000 IU/m2 either IV or IM) given every 3 to 4 days over 2 weeks substituted for each pegaspargase dose.
Asparaginase activity was assayed in serum collected on days 1, 8, and 15 of induction therapy, day 1 of consolidation, and day 1 of weeks 7, 8, 9, 17, and 19 of continuation therapy (Figure S1). Details of the asparaginase activity assay were described previously [13,15]; the lower limit of quantification of the assay was 0.05 IU/mL. CSF asparagine samples were prospectively planned to be timed to coincide with therapeutic lumbar punctures planned per protocol, and were collected on days 1, 8, and 15 of induction, day 1 of consolidation, and day 1 of continuation week 7, were placed in sulfosalicylic acid-containing tubes, and frozen until assay by high performance liquid chromatography with fluorescence detection following precolumn derivatization with o-phthalaldehyde [16]. The lower limit of quantification for asparagine in the assay was 0.1 μM.
Asparaginase Pharmacokinetics
The pharmacokinetics of pegaspargase and erwinase have been previously described [14,17] and the methods are summarized in the Supplemental Methods. The individual post-hoc pharmacokinetic estimates, specifically the empirical Bayesian estimates---the conditional mode, were estimated and these individual pharmacokinetic parameter estimates were fixed when evaluating the following CSF asparagine pharmacodynamics.
CSF Asparagine Population Pharmacodynamics
The CSF asparagine population pharmacodynamics were estimated with nonlinear mixed-effects modeling (Monolix 5.1.0; Lixoft, Antony, France) using the stochastic approximation expectation-maximization approach. We used our prior pharmacodynamic model [11] to describe the depletion of CSF asparagine by asparaginase in the current study (Figure S2). These modeling methods were also similar to other prior approaches [2,18].
Specifically, plasma asparagine (ASN) was described by (Equation 1)
| (Equation 1) |
and the CSF asparagine was described by (Equation 2).
| (Equation 2) |
The steady-state condition required to maintain baseline plasma asparagine and CSF asparagine levels in the absence of asparaginase is:
The variables in the asparagine equations are: ASN, the plasma concentration of asparagine (μM); ASNCSF, the CSF concentration of asparagine (μM); and ASP the serum activity (IU/mL) of asparaginase (based on the individual post-hoc asparaginase pharmacokinetic parameters). The model parameters are as follows:
rmax (1/day): endogenous rate of asparagine formation
kin (μM/day): rate of influx of asparagine from plasma to CSF
KmCSF (μM): Michaelis-Menten constant for influx of asparagine from plasma to CSF
Kout (1/day): rate of efflux of asparagine from CSF to plasma
Vmax ((μM/day)/(IU/mL)): maximum rate of deamination of asparagine by asparaginase
Km (μM): Michaelis-Menten constant for deamination of asparagine by asparaginase
ASN0 and ASNCSF0: Steady-state concentrations of plasma and CSF asparagine (in the absence of asparaginase).
When the population pharmacodynamics were estimated, the asparaginase pharmacokinetic parameters were fixed to each individual’s empirical Bayesian estimate.
The asparagine model parameters rmax, Km, and ASN0 could not be explicitly estimated given plasma asparagine was not measured in this study and only sparse CSF asparagine data were available. Therefore, these parameters were fixed to the following literature values: rmax=4.8 (1/day), Km=29.0 (μM), and ASN0=40.0 (μM) [2,11,18].
The pharmacodynamic model variability and random effects were classified as inter-individual variability (IIV), inter-occasion variability (IOV), and residual unexplained variability (RUV) where the IIV and IOV were assumed log-normally distributed according to Equation 3
| (Equation 3) |
and the RUV was modeled with a proportional error model (Equation 4).
| (Equation 4) |
CSF asparagine data below the lower limit of quantification (0.01 μM) were treated as censored and the M3 method of handling these values [19] was used as implemented in Monolix.
Covariate Analysis
Patient covariates were evaluated for their influence on CSF asparagine pharmacodynamics. Covariates considered included: patient demographics, protocol risk group (low vs standard/high), asparaginase dosage randomization arm (2,500 IU/m2 vs 3,500 IU/m2), presence or absence of prior pegaspargase dose (within 14 days of the pharmacokinetic study; this included individuals who received a second dose of pegaspargase during induction and all standard/high risk individuals in continuation), allergy to pegaspargase or erwinase, antibodies to pegaspargase or erwinase, and serum chemistries. All continuous covariates were evaluated using the following power model
and all categorical covariates were evaluated the following exponential model.
Forward addition was utilized to identify significant covariates. A decrease in the objective function value ≥ 3.84 was considered significant for one degree of freedom at p = 0.05 based on the χ2 distribution.
The quality of the final models was evaluated using goodness-of-fit plots including: observed vs population predicted; observed vs individual predicted; population weighed residuals vs time; individual weighted residual vs time; and simulation-based visual predictive checks.
Uncertainty in parameter estimates was quantitatively assessed by calculating standard error estimates (using the stochastic approximation approach provided by Monolix) and using bootstraps based on 100 resampled data sets.
Simulations of CSF asparagine
The post-hoc individual parameter estimates for CSF asparagine, specifically samples from the individual conditional distributions (n=3 per individual/occasion for a total of 2799 parameter sets), were used to estimate the time that CSF asparagine was below 1 μM (a threshold speculated to lead to improved outcomes [1,2]), accounting for dosing, route, and formulation, for each individual phase (induction, reinduction I, and reinduction II) as well as cumulatively for the entire duration of the Total XVI protocol. Specifically, for pegaspargase dosing, estimates of CSF asparagine deamination were simulated using each individual’s pharmacokinetic/pharmacodynamic parameters and their expected dosage/schedule for the course. Estimates of CSF asparagine deamination given a fixed dosage/schedule of pegaspargase or erwinase were also simulated, again based on the individual pharmacokinetic/pharmacodynamic parameters. Specifically, CSF asparagine deamination was simulated given pegaspargase IV (both 2,500 and 3,500 IU/m2 Q14D for 2 doses), erwinase IV, and erwinase IM (both 30,000 and 42,000 IU/m2 every 3 days for 10 doses for IV and IM erwinase). In these simulations, we assumed that the CSF asparagine parameters were independent of the formulation of asparaginase (pegaspargase vs erwinase).
Additionally, for each patient, the cumulative number of days that CSF asparagine was < 1 uM was estimated based on simulations using individual asparaginase/asparagine pharmacokinetic and pharmacodynamic parameters as well as the actual dosages of pegaspargase and erwinase that were administered to each patient.
CSF asparagine vs relapse
Relapse and competing risk definitions were as published [20]. For those patients who completed reinduction II, the cumulative incidence of any CNS relapse (isolated plus combined) or of any relapse (any site) was estimated by the method of Kalbfleisch and Prentice [21]. Effect of the cumulative duration of CSF asparagine depletion on any CNS relapse or any relapse adjusted for risk arm was analyzed using the Fine and Gray regression model [22], to investigate whether the cumulative duration that CSF asparagine was depleted (< 1 uM) was related to the risk of CNS relapse or of any relapse.
All p values are nominal and not corrected for multiple comparisons.
Results
Pegaspargase Pharmacokinetics
Pegaspargase activity from 596 of the 598 patients enrolled on the T16 study were available and used to establish the population pharmacokinetics [17], of whom a subset (see below) had CSF asparagine measures available. A summary of the patients, samples, and demographics are described in Table S1. The population pharmacokinetic model parameters are summarized in Table S2 and diagnostic plots (Figure S3) demonstrated reasonable agreement between predicted and observed serum activity.
Erwinase Pharmacokinetics
Erwinase serum activity from 61 of the 598 patients enrolled on the T16 study was available, and estimation of pharmacokinetic parameters has been described[14]. A summary of the patients, samples, and demographics are described in Table S3. The population pharmacokinetic model parameters are summarized in Table S4 and diagnostic plots (Figure S4) demonstrated reasonable agreement between predicted and observed activity.
CSF Asparagine Population Pharmacodynamics
Of 598 patients enrolled in the T16 study (Figure S5), 482 patients had 1856 CSF asparagine samples (between 3 and 4 samples per patient) available during induction therapy and 248 patients had 258 CSF asparagine samples (approximately 1 sample per patient) available during reinduction I/II therapy. A summary of the patients, samples, and demographics are described in Table S5 and Figure S5.
When evaluating the population pharmacodynamics of CSF asparagine, the asparaginase pharmacokinetic parameters were fixed to each individual’s empirical Bayesian estimate. The population pharmacodynamic model parameters for the base model with the dose BSA normalized are summarized in Table 1. In addition, risk group, prior dosing of pegaspargase, BSA (via a power model), and creatinine were included and each significantly improved the model (Table S6).
Table 1:
Population pharmacodynamic, inter-individual, inter-occasion, and residual error estimates. (RSE %): Relative Standard Error. The parameters rmax, Km, and ASN0 were fixed. The parameter kout was a function of kin, Km-CSF, ASN0, and ASNCSF0 due to the steady-state conditions.
| Parameter | Base Model (RSE %) | Risk and BSA (RSE %) | Bootstrap median, (5th–95th percentile) |
|---|---|---|---|
| Population Estimate | |||
| Vmax ((μM/day)/(IU/mL)) | 1352.9 (11.3) | 1403.7 (28.5) | 1585.1 (770.1–3613.5) |
| B: BSA | −1.16 (23.6) | −1.65 (−2.52– −0.50) | |
| B: Risk (reference: Low) | −1.16 (27.2) | −0.37 (−1.27–0.61) | |
| Km-CSF (μM) | 1.10 (11.7) | 0.61 (29.2) | 0.56 (0.22–1.12) |
| B: BSA | 1.86 (17.0) | 2.20 (1.07–3.25) | |
| B: Risk (reference: Low) | 2.12 (15.5) | 1.24 (0.22–2.23) | |
| kin (μM/day) | 4.89 (0.0016) | 5.40 (0.4) | 4.98 (4.20–6.39) |
| ASNCSF0 (μM) | 5.67 (1.4) | 5.68 (1.2) | 5.69 (5.55–5.81) |
| Fixed Parameters | |||
| rmax (1/day) | 4.8 | ||
| Km (μM) | 29.0 | ||
| ASN0 (μM) | 40.0 | ||
| Inter-Individual Variability (CV%) | |||
| Vmax | 34 (38.7) | 23 (56.8) | 23 (17–34) |
| Km-CSF | 37 (41.4) | 45 (32.8) | 33 (25–44) |
| kin | 76 (11.1) | 59 (12.7) | 67 (48–93) |
| ASNCSF0 | 17 (7.7) | 17 (7.5) | 17 (14–19) |
| Inter-Occasion Variability (CV%) | |||
| Vmax | 65 (12.4) | 69 (11.6) | 69 (53–85) |
| Km-CSF | 89 (9.8) | 82 (12.7) | 84 (60–104) |
| Residual Error | |||
| proportional (%) | 35 (3.1) | 35 (3.1) | 34 (32–37) |
Diagnostic plots were visually inspected to confirm the selection of the final model (Figure 1; Figure S6). Additionally, Figure S7 shows several representative patients’ CSF asparagine and asparaginase activity vs time plots and demonstrate reasonable agreement between predicted and observed CSF concentrations. Furthermore, the bootstrap procedure yielded similar parameter estimates as the base model (Table 1).
Figure 1:

CSF asparagine Visual Predictive Check. Black dots: measured CSF asparagine concentration. Red dots: measured CSF asparagine below the LLOQ. These values were plotted at the LLOQ. Solid black curve and blue shaded region: population simulated median and 95% confidence interval. Dashed black curves and grey shaded regions: population simulated 10th and 90th percentiles and 95% confidence intervals. Green solid and dotted curves: individual estimated median, 10th and 90th percentiles. Yellow dashed curve: median estimated serum asparaginase activity; yellow shaded regions 25th-75th and 5th-95th percentiles estimated serum asparaginase activity. A: Induction 3,000 IU/m2 on day 3; B: Induction 3,000 IU/m2 on day 3 and day 15; C: Reinduction I Low Risk (LR), 2,500 IU/m2 pegaspargase; D: Reinduction I LR, 3,500 IU/m2 pegaspargase; E: Continuation Week 1 to end of Reinduction I Std/High Risk (SHR), 2,500 IU/m2 pegaspargase; F: Continuation Week 1 to end of Reinduction I (SHR), 3,500 IU/m2 pegaspargase.
In all the following model analyses, the individual pharmacodynamic parameter estimates derived from this population pharmacodynamic model were used to estimate the time that CSF asparagine was below 1 μM for each individual.
CSF Asparagine Depletion: Induction
The median estimated duration of CSF asparagine depletion below 1 μM was longer in patients who received 2 doses of pegaspargase compared to those received 1 dose (median [range] depletion time: 30.4 [0, 46.9] vs 14.5 [0, 32.7] days respectively; p<0.001; Figure 2). In addition, we estimated that 79% of patients who received a single dose and 95% of patients who received two doses of pegaspargase during induction had their CSF asparagine depleted below 1 μM for at least 7 days (p<0.001). Finally, based on these pharmacokinetic and pharmacodynamic results, we estimated the median (quartile range) asparaginase activity needed to maintain CSF asparagine below 1 μM to be 0.44 (0.20, 0.99) IU/mL; at lower serum asparaginase concentrations, CSF concentrations are predicted to be above 1 μM.
Figure 2:

Induction Time below CSF asparagine Threshold. Estimated time CSF asparagine was depleted below 1 μM given a dose of 3,000 IU/m2 pegaspargase in those who received only day 3 pegaspargase (n=331) vs those who received day 3 and day 15 pegaspargase (n=151) during Induction. Shown as medians: horizontal bar; 25th-75th quartiles: box; and, non-outlier range (1.5 times the quartile range): whiskers.
CSF Asparagine Depletion: Continuation
Among patients on the low risk arm who received all 4 doses of pegaspargase, the median estimated time CSF asparagine was depleted below 1 μM was 9% longer in patients who received 3,500 compared to patients who received 2,500 IU/m2 pegaspargase (median [range] depletion time: 88.6 [40.4, 111.8] vs 81.1 [52.3, 101.9] days respectively; p<0.001; Figure S8). Among patients on the standard or high risk arms who received all 15 pegaspargase doses, the median estimated time CSF asparagine was depleted below 1 μM was slightly (1%) longer in patients who received 3,500 compared to those who received 2,500 IU/m2 pegaspargase (median [range] depletion time: 220 [0, 235] vs 218 [0, 236] days respectively; p=0.034; Figure S8). Consistent with our prior report [17] that both chronicity of dosing schedule and dosage impacted pegaspargase serum clearance, we observed no significant difference in the median week 7 measured CSF asparagine concentration in individuals who received 2,500 vs 3,500 IU/m2 (0.17 vs 0.12 μM, respectively; p=0.12), although we acknowledge there was a trend toward greater CSF asparagine depletion with the higher dose.
CSF Asparagine Depletion: Erwinase
We estimated CSF asparagine depletion in patients who had erwinase substituted for pegaspargase due to adverse effects. In the LR arm, patients who switched to erwinase during continuation (n=23) received a median of 2 pegaspargase and 12 erwinase doses (4 to 6 erwinase doses every 3 to 4 days for each pegaspargase dose), and those who remained on pegaspargase received 4 pegaspargase doses. In the SHR arms, patients who switched to erwinase during continuation (n=35) received a median of 2 pegaspargase and 56 erwinase doses; and those who remained on pegaspargase received 15 doses.
Using simulations, we compared the CSF asparagine depletion with either 2 pegaspargase doses, each given every 14 days (2,500 or 3,500 IU/m2) or 10 erwinase doses (either IV or IM), each given every 3 days (30,000 or 42,000 IU/m2). For the LR arm, the median time of depletion below 1 μM was longer with pegaspargase vs erwinase (including both IV and IM) for both low (5.3-fold, p<0.001) and high dose asparaginase (1.9-fold, p<0.001), respectively (Figure 3A). Likewise, in the SHR arms, the median time of depletion was 1.3-fold (p<0.001) and 1.3-fold (p<0.001) longer with pegaspargase vs erwinase for low and high dose asparaginase respectively (Figure 3B).
Figure 3:
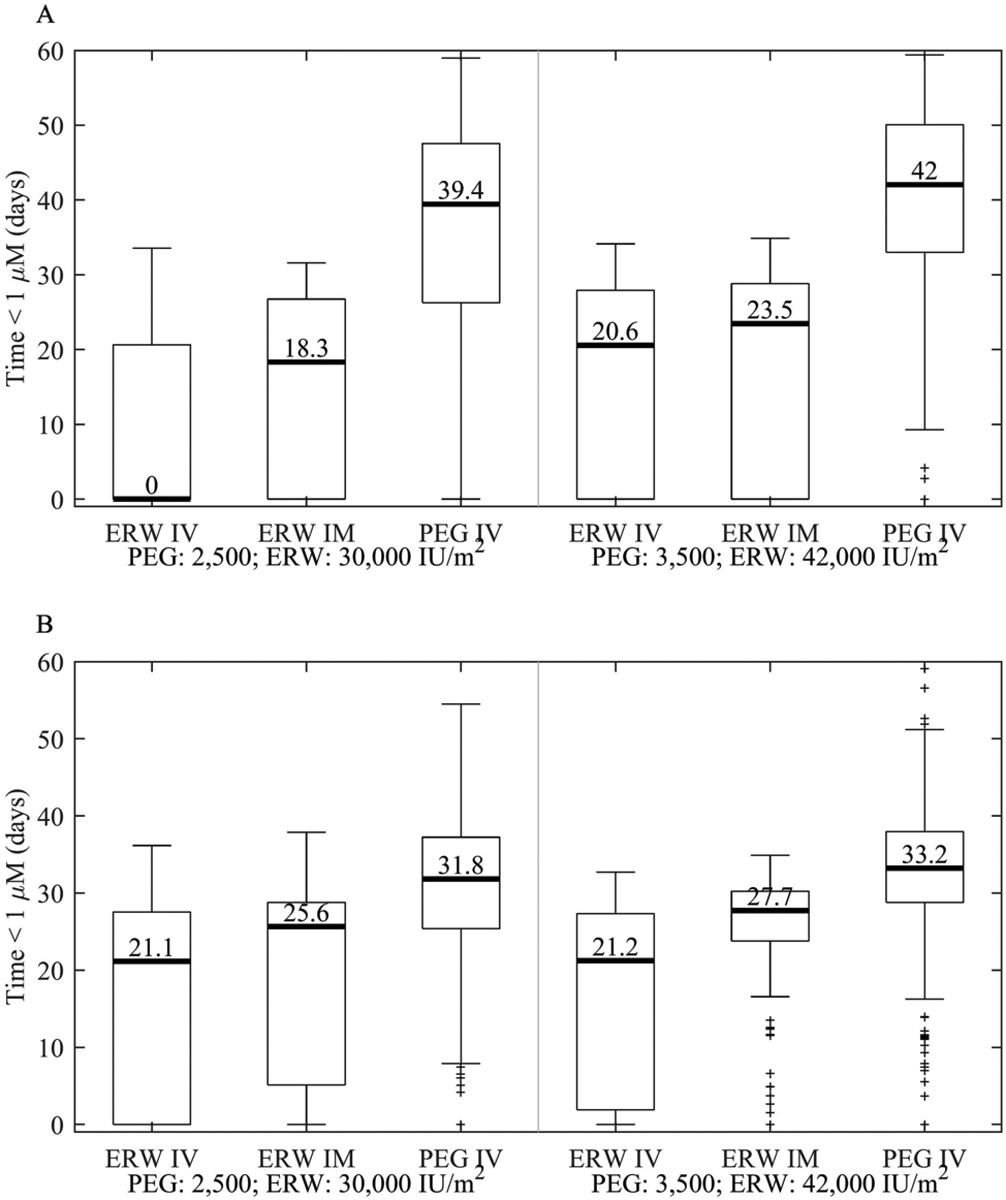
Time below CSF asparagine threshold subdivided by formulation and route given the following hypothetical doses and schedules. Simulated time CSF asparagine was depleted below 1 μM given either 10 erwinase doses every 3 days (either 30,000 or 42,000 IU/m2 and either IV or IM) or 2 pegaspargase IV doses Q14D (either 2,500 or 3,500 IU/m2). A.) Low Risk. B.) Standard/High Risk. Shown as medians: horizontal bar; 25th-75th quartiles: box; and, non-outlier range (1.5 times the quartile range): whiskers.
CSF Asparagine Depletion: IV vs IM Erwinase
Patients received erwinase either as an IV infusion or IM. We have previously shown that serum asparaginase activity above 0.1 IU/ml was significantly longer with the IM than the IV route [14]. Simulations of 1 month of therapy based on erwinase every 3 days for 10 doses showed that these differences in erwinase activity translated into differences in the time CSF asparagine was depleted below 1 μM (Figure 4). Specifically, for patients in the LR arm, the median time of CSF asparagine depletion was 18.3 days longer when erwinase was given IM vs IV at the dose of 30,000 IU/m2 (Figure 3A). Similarly, for the SHR arm, the median time of depletion was longer for IM vs IV dosing of erwinase at either dosage (4.5 days longer at 30,000 IU/m2, p<0.001; 6.5 days longer at 42,000 IU/m2, p<0.001; Figure 3B).
Figure 4:

Population Estimated CSF asparagine and serum asparaginase activity vs time given the following hypothetical doses and schedules. Simulated CSF asparagine activity based on 10 erwinase doses every 3 days. Black curve: median estimated CSF asparagine; Green dashed curve: median estimated serum asparaginase activity; shaded regions 25th-75th and 5th-95th percentiles. A: 30,000 IU/m2 IV erwinase, LR; B: 30,000 IU/m2 IM erwinase, LR; C: 30,000 IU/m2 IV erwinase, SHR; D: 30,000 IU/m2 IM erwinase, SHR; E: 42,000 IU/m2 IV erwinase, LR; F: 42,000 IU/m2 IM erwinase, LR; G: 42,000 IU/m2 IV erwinase, SHR; H: 42,000 IU/m2 IM erwinase, SHR.
Cumulative CSF asparagine depletion and relapse
The median (range) duration of time that CSF asparagine was depleted for the entire course of Total XVI was 93 (12, 135) days for LR and 234 (16, 293) days for SHR, with the number of administered doses being the major driver of this duration (Figure S9). Among the subset of 451 patients who completed reinduction II, there were 37 relapses of which 4 were CNS relapses (all isolated). Adjusting for risk arm, and accounting for competing risks (any other relapse, 2nd cancer, or died in complete remission), there was a 20% increase in the probability of CNS relapse for every 14-day decrease in CSF asparagine depletion (p=0.0486, Figure S10). We did not find a significant relationship between any type of relapse (all sites) and CSF asparagine depletion (p=0.3).
Discussion
Using pharmacokinetic and pharmacodynamic modeling and simulation, we have shown that the schedule and number of pegaspargase doses has a stronger influence on the extent of CSF asparagine depletion than the magnitude of the dosage. Specifically, a larger number of pegaspargase doses given every 2 weeks increased the time of CSF asparagine depletion proportionally, while increases in the pegaspargase dosage did not. There are several reasons why increases in the pegaspargase dosage did not result in a proportional increase in the depletion of CSF asparagine. These include the non-linear pharmacokinetics of pegaspargase [23] and the saturable dynamics (i.e. Michaelis-Menten kinetics) of asparaginase hydrolysis of asparagine. This lack of difference in CSF asparagine depletion by dosage (2,500 vs 3,500 IU/m2) corresponded well with the fact that there was no difference in relapses or toxicity between the two different dosages [12].
The estimated duration of CSF asparagine depletion was shorter for erwinase than pegaspargase and was shorter after IV vs IM erwinase dosing. These differences were primarily due to the differences in the serum asparaginase pharmacokinetics of each formulation; pegaspargase (2,500 IU/m2) yielded serum activity above 0.1 IU/ml longer than IM erwinase (30,000 IU/m2 IM every 3 days × 10), which in turn was longer than with IV erwinase (30,000 IU/m2 IV every 3 days × 10).
There have been several previous studies evaluating CSF asparagine after asparaginase therapy [10,24–30]. Though most of these studies only presented their results qualitatively, they supported our current results in several ways. For example, during induction therapy of the AIEOP-BFM ALL 2009 study [30] 82% and 61% of individuals’ CSF asparagine levels were below 1 μM on days 7 and 19 after the second of two 2,500 IU/m2 doses of pegaspargase, whereas we estimated the percentage in our study to be 92% and 60% (at day 7 and 19, respectively) given two 3,000 IU/m2 doses of pegaspargase. Additionally, in previous studies the length of time CSF asparagine was depleted below 1 μM after a 2,500 IU/m2 pegaspargase dose (around 28 days) [27,28] was similar to what we observed, and others have also observed a correlation between asparaginase activity in serum and asparagine depletion in CSF [27,28,30–32]. Furthermore, these studies suggested that an asparaginase activity of greater than 0.02 to 0.7 IU/mL is needed to maintain adequate depletion of asparagine, whereas our current results estimated the threshold serum activity to be 0.44 (quartile range: 0.20, 0.99) IU/mL. It should be acknowledged that our estimates are based on a small number of CSF samples per patient per dose. While our estimates of a threshold asparaginase activity are mostly higher than the commonly accepted threshold of 0.1 IU/mL, our data show that with 2,500 IU/m2 IV pegaspargase, we maintained asparaginase activity greater than 0.44 IU/mL for 14 days in 97% of the patients. It will be important to study whether the lower duration of sustained serum concentrations that would result from using lower dosages of pegaspargase in some currently used ALL regimens are adequate for CSF asparagine depletion.
Although the number of CNS relapses was very low, there was a trend toward a shorter duration of CSF asparagine depletion in those who relapsed than in those who did not (Figure S10). This finding is consistent with the idea that despite very poor penetration of asparaginase into the central nervous system, asparaginase still contributed to control of CNS leukemia [33].
One limitation of this study was the very sparse CSF asparagine data available when erwinase was dosed. Because of this, we assumed that the CSF asparagine model parameters were independent of the formulation. This allowed us to simulate the effects of erwinase on CSF asparagine using patients’ pharmacodynamic parameters without regard to the formulation they received. Another limitation was that several of the pharmacodynamic parameters (rmax, Km, and ASN0) were fixed due to lack of plasma asparagine data. However, we observed that CSF asparagine model sensitivity to variability in these parameters was low (a ±50% variability in the parameters led to less than a 25% variability in the estimated time of CSF asparagine depletion).
This study demonstrated that standard dosing of pegaspargase (2,500 IU/m2 every 2 weeks) was sufficient to maintain depletion of CSF asparagine and that the frequency or dosage of erwinase may need to be increased in patients with lower asparaginase activity, particularly if erwinase is given IV, to maintain CSF asparagine depletion.
Supplementary Material
Funding:
This research was supported by NIH grant(s) NIH NCI P30 CA 21765, R01 CA 142665, investigator-initiated research funding from Servier, and ALSAC. The content is solely the responsibility of the authors and does not necessarily represent the official views of the National Institutes of Health
Conflict of Interest:
MVR, JCP, HI and SJ and St. Jude received investigator-initiated research funding from Servier.
Footnotes
Publisher's Disclaimer: This Author Accepted Manuscript is a PDF file of an unedited peer-reviewed manuscript that has been accepted for publication but has not been copyedited or corrected. The official version of record that is published in the journal is kept up to date and so may therefore differ from this version.
References
- 1.Jarrar M, Gaynon PS, Periclou AP, Fu C, Harris RE, Stram D, Altman A, Bostrom B, Breneman J, Steele D, Trigg M, Zipf T, Avramis VI (2006) Asparagine depletion after pegylated E. coli asparaginase treatment and induction outcome in children with acute lymphoblastic leukemia in first bone marrow relapse: a Children’s Oncology Group study (CCG-1941). Pediatr Blood Cancer 47 (2):141–146. doi: 10.1002/pbc.20713 [DOI] [PubMed] [Google Scholar]
- 2.Avramis VI, Sencer S, Periclou AP, Sather H, Bostrom BC, Cohen LJ, Ettinger AG, Ettinger LJ, Franklin J, Gaynon PS, Hilden JM, Lange B, Majlessipour F, Mathew P, Needle M, Neglia J, Reaman G, Holcenberg JS, Stork L (2002) A randomized comparison of native Escherichia coli asparaginase and polyethylene glycol conjugated asparaginase for treatment of children with newly diagnosed standard-risk acute lymphoblastic leukemia: a Children’s Cancer Group study. Blood 99 (6):1986–1994. doi: 10.1182/blood.v99.6.1986 [DOI] [PubMed] [Google Scholar]
- 3.Abshire TC, Pollock BH, Billett AL, Bradley P, Buchanan GR (2000) Weekly polyethylene glycol conjugated L-asparaginase compared with biweekly dosing produces superior induction remission rates in childhood relapsed acute lymphoblastic leukemia: a Pediatric Oncology Group Study. Blood 96 (5):1709–1715 [PubMed] [Google Scholar]
- 4.Silverman LB, Gelber RD, Dalton VK, Asselin BL, Barr RD, Clavell LA, Hurwitz CA, Moghrabi A, Samson Y, Schorin MA, Arkin S, Declerck L, Cohen HJ, Sallan SE (2001) Improved outcome for children with acute lymphoblastic leukemia: results of Dana-Farber Consortium Protocol 91–01. Blood 97 (5):1211–1218. doi: 10.1182/blood.v97.5.1211 [DOI] [PubMed] [Google Scholar]
- 5.Pession A, Valsecchi MG, Masera G, Kamps WA, Magyarosy E, Rizzari C, van Wering ER, Lo Nigro L, van der Does A, Locatelli F, Basso G, Arico M (2005) Long-term results of a randomized trial on extended use of high dose L-asparaginase for standard risk childhood acute lymphoblastic leukemia. J Clin Oncol 23 (28):7161–7167. doi: 10.1200/JCO.2005.11.411 [DOI] [PubMed] [Google Scholar]
- 6.Wetzler M, Sanford BL, Kurtzberg J, DeOliveira D, Frankel SR, Powell BL, Kolitz JE, Bloomfield CD, Larson RA (2007) Effective asparagine depletion with pegylated asparaginase results in improved outcomes in adult acute lymphoblastic leukemia: Cancer and Leukemia Group B Study 9511. Blood 109 (10):4164–4167. doi: 10.1182/blood-2006-09-045351 [DOI] [PMC free article] [PubMed] [Google Scholar]
- 7.Mattano LA, Devidas M, Friedmann AM, Raetz EA, Loh M, Buckley P, Borowitz MJ, Carroll AJ, Gastier-Foster J, Heerema NA, Kadan-Lottick N, Matloub Y, Marshall DT, Stork LC, Wood BL, Winick NJ, Hunger S, Carroll WL, Maloney K (2014) Outstanding Outcome for Children with Standard Risk-Low (SR-Low) Acute Lymphoblastic Leukemia (ALL) and No Benefit to Intensified Peg-Asparaginase (PEG-ASNase) Therapy: Results of Children’s Oncology Group (COG) Study AALL0331. Blood 124 (21):793–793. doi: 10.1182/blood.V124.21.793.793 [DOI] [Google Scholar]
- 8.Albertsen BK, Grell K, Abrahamsson J, Lund B, Vettenranta K, Jonsson OG, Frandsen TL, Wolthers BO, Heyman M, Schmiegelow K (2019) Intermittent Versus Continuous PEG-Asparaginase to Reduce Asparaginase-Associated Toxicities: A NOPHO ALL2008 Randomized Study. J Clin Oncol 37 (19):1638–1646. doi: 10.1200/JCO.18.01877 [DOI] [PubMed] [Google Scholar]
- 9.Appel IM, Pinheiro JP, den Boer ML, Lanvers C, Reniers NC, Boos J, Pieters R (2003) Lack of asparagine depletion in the cerebrospinal fluid after one intravenous dose of PEG-asparaginase: a window study at initial diagnosis of childhood ALL. Leukemia 17 (11):2254–2256. doi: 10.1038/sj.leu.2403143 [DOI] [PubMed] [Google Scholar]
- 10.Hak LJ, Relling MV, Cheng C, Pei D, Wang B, Sandlund JT, Rubnitz J, Pui CH (2004) Asparaginase pharmacodynamics differ by formulation among children with newly diagnosed acute lymphoblastic leukemia. Leukemia 18 (6):1072–1077. doi: 10.1038/sj.leu.2403351 [DOI] [PubMed] [Google Scholar]
- 11.Panetta JC, Gajjar A, Hijiya N, Hak LJ, Cheng C, Liu W, Pui CH, Relling MV (2009) Comparison of native E. coli and PEG asparaginase pharmacokinetics and pharmacodynamics in pediatric acute lymphoblastic leukemia. Clin Pharmacol Ther 86 (6):651–658. doi: 10.1038/clpt.2009.162 [DOI] [PMC free article] [PubMed] [Google Scholar]
- 12.Jeha S, Pei D, Choi J, Cheng C, Sandlund JT, Coustan-Smith E, Campana D, Inaba H, Rubnitz JE, Ribeiro RC, Gruber TA, Raimondi SC, Khan RB, Yang JJ, Mullighan CG, Downing JR, Evans WE, Relling MV, Pui CH (2019) Improved CNS Control of Childhood Acute Lymphoblastic Leukemia Without Cranial Irradiation: St Jude Total Therapy Study 16. J Clin Oncol:JCO1901692. doi: 10.1200/JCO.19.01692 [DOI] [PMC free article] [PubMed] [Google Scholar]
- 13.Liu Y, Smith CA, Panetta JC, Yang W, Thompson LE, Counts JP, Molinelli AR, Pei D, Kornegay NM, Crews KR, Swanson H, Cheng C, Karol SE, Evans WE, Inaba H, Pui CH, Jeha S, Relling MV (2019) Antibodies Predict Pegaspargase Allergic Reactions and Failure of Rechallenge. J Clin Oncol 37 (23):2051–2061. doi: 10.1200/JCO.18.02439 [DOI] [PMC free article] [PubMed] [Google Scholar]
- 14.Panetta JC, Liu Y, Swanson HD, Karol SE, Pui CH, Inaba H, Jeha S, Relling MV (2020) Higher plasma asparaginase activity after intramuscular than intravenous Erwinia asparaginase. Pediatr Blood Cancer:e28244. doi: 10.1002/pbc.28244 [DOI] [PMC free article] [PubMed] [Google Scholar]
- 15.Fernandez CA, Cai X, Elozory A, Liu C, Panetta JC, Jeha S, Molinelli AR, Relling MV (2013) High-throughput asparaginase activity assay in serum of children with leukemia. Int J Clin Exp Med 6 (7):478–487 [PMC free article] [PubMed] [Google Scholar]
- 16.Zhang M, Zhang Y, Ren S, Zhang Z, Wang Y, Song R (2018) Optimization of a Precolumn OPA Derivatization HPLC Assay for Monitoring of l-Asparagine Depletion in Serum during l-Asparaginase Therapy. J Chromatogr Sci 56 (9):794–801. doi: 10.1093/chromsci/bmy053 [DOI] [PubMed] [Google Scholar]
- 17.Liu Y, Panetta JC, Yang W, Karol SE, Cheng C, Yang JJ, Evans WE, Inaba H, Pui C-H, Jeha S, Relling MV (2020) Dosing-related Saturation of Toxicity and Accelerated Drug Clearance with Pegaspargase Treatment. Blood. doi: 10.1182/blood.2020006214 [DOI] [PMC free article] [PubMed] [Google Scholar]
- 18.Avramis VI, Spence SA (2007) Clinical pharmacology of asparaginases in the United States: asparaginase population pharmacokinetic and pharmacodynamic (PK-PD) models (NONMEM) in adult and pediatric ALL patients. J Pediatr Hematol Oncol 29 (4):239–247. doi: 10.1097/MPH.0b013e318047b79d [DOI] [PubMed] [Google Scholar]
- 19.Beal SL (2001) Ways to Fit a PK Model with Some Data Below the Quantification Limit. Journal of Pharmacokinetics and Pharmacodynamics 28 (5):481–504. doi: 10.1023/A:1012299115260 [DOI] [PubMed] [Google Scholar]
- 20.Yang JJ, Cheng C, Devidas M, Cao X, Fan Y, Campana D, Yang W, Neale G, Cox NJ, Scheet P, Borowitz MJ, Winick NJ, Martin PL, Willman CL, Bowman WP, Camitta BM, Carroll A, Reaman GH, Carroll WL, Loh M, Hunger SP, Pui CH, Evans WE, Relling MV (2011) Ancestry and pharmacogenomics of relapse in acute lymphoblastic leukemia. Nat Genet 43 (3):237–241. doi: 10.1038/ng.763 [DOI] [PMC free article] [PubMed] [Google Scholar]
- 21.Kalbfleisch JD, Prentice RL (2011) The statistical analysis of failure time data. John Wiley & Sons, [Google Scholar]
- 22.Fine JP, Gray RJ (1999) A proportional hazards model for the subdistribution of a competing risk. Journal of the American statistical association 94 (446):496–509 [Google Scholar]
- 23.Hempel G, Muller HJ, Lanvers-Kaminsky C, Wurthwein G, Hoppe A, Boos J (2010) A population pharmacokinetic model for pegylated-asparaginase in children. Br J Haematol 148 (1):119–125. doi: 10.1111/j.1365-2141.2009.07923.x [DOI] [PubMed] [Google Scholar]
- 24.Dibenedetto SP, Di Cataldo A, Ragusa R, Meli C, Lo Nigro L (1995) Levels of L-asparagine in CSF after intramuscular administration of asparaginase from Erwinia in children with acute lymphoblastic leukemia. J Clin Oncol 13 (2):339–344. doi: 10.1200/JCO.1995.13.2.339 [DOI] [PubMed] [Google Scholar]
- 25.Gentili D, Conter V, Rizzari C, Tschuemperlin B, Zucchetti M, Orlandoni D, D’Incalci M, Masera G (1996) L-Asparagine depletion in plasma and cerebro-spinal fluid of children with acute lymphoblastic leukemia during subsequent exposures to Erwinia L-asparaginase. Ann Oncol 7 (7):725–730. doi: 10.1093/oxfordjournals.annonc.a010722 [DOI] [PubMed] [Google Scholar]
- 26.Woo MH, Hak LJ, Storm MC, Gajjar AJ, Sandlund JT, Harrison PL, Wang B, Pui CH, Relling MV (1999) Cerebrospinal fluid asparagine concentrations after Escherichia coli asparaginase in children with acute lymphoblastic leukemia. J Clin Oncol 17 (5):1568–1573. doi: 10.1200/JCO.1999.17.5.1568 [DOI] [PubMed] [Google Scholar]
- 27.Vieira Pinheiro JP, Wenner K, Escherich G, Lanvers-Kaminsky C, Wurthwein G, Janka-Schaub G, Boos J (2006) Serum asparaginase activities and asparagine concentrations in the cerebrospinal fluid after a single infusion of 2,500 IU/m(2) PEG asparaginase in children with ALL treated according to protocol COALL-06–97. Pediatr Blood Cancer 46 (1):18–25. doi: 10.1002/pbc.20406 [DOI] [PubMed] [Google Scholar]
- 28.Angiolillo AL, Schore RJ, Devidas M, Borowitz MJ, Carroll AJ, Gastier-Foster JM, Heerema NA, Keilani T, Lane AR, Loh ML, Reaman GH, Adamson PC, Wood B, Wood C, Zheng HW, Raetz EA, Winick NJ, Carroll WL, Hunger SP (2014) Pharmacokinetic and pharmacodynamic properties of calaspargase pegol Escherichia coli L-asparaginase in the treatment of patients with acute lymphoblastic leukemia: results from Children’s Oncology Group Study AALL07P4. J Clin Oncol 32 (34):3874–3882. doi: 10.1200/JCO.2014.55.5763 [DOI] [PMC free article] [PubMed] [Google Scholar]
- 29.Hawkins DS, Park JR, Thomson BG, Felgenhauer JL, Holcenberg JS, Panosyan EH, Avramis VI (2004) Asparaginase pharmacokinetics after intensive polyethylene glycol-conjugated L-asparaginase therapy for children with relapsed acute lymphoblastic leukemia. Clin Cancer Res 10 (16):5335–5341. doi: 10.1158/1078-0432.CCR-04-0222 [DOI] [PubMed] [Google Scholar]
- 30.Rizzari C, Lanvers-Kaminsky C, Valsecchi MG, Ballerini A, Matteo C, Gerss J, Wuerthwein G, Silvestri D, Colombini A, Conter V, Biondi A, Schrappe M, Moericke A, Zimmermann M, von Stackelberg A, Linderkamp C, Fruhwald MC, Legien S, Attarbaschi A, Reismuller B, Kasper D, Smisek P, Stary J, Vinti L, Barisone E, Parasole R, Micalizzi C, Zucchetti M, Boos J (2019) Asparagine levels in the cerebrospinal fluid of children with acute lymphoblastic leukemia treated with pegylated-asparaginase in the induction phase of the AIEOP-BFM ALL 2009 study. Haematologica 104 (9):1812–1821. doi: 10.3324/haematol.2018.206433 [DOI] [PMC free article] [PubMed] [Google Scholar]
- 31.Douer D, Yampolsky H, Cohen LJ, Watkins K, Levine AM, Periclou AP, Avramis VI (2007) Pharmacodynamics and safety of intravenous pegaspargase during remission induction in adults aged 55 years or younger with newly diagnosed acute lymphoblastic leukemia. Blood 109 (7):2744–2750. doi: 10.1182/blood-2006-07-035006 [DOI] [PubMed] [Google Scholar]
- 32.Grigoryan RS, Panosyan EH, Seibel NL, Gaynon PS, Avramis IA, Avramis VI (2004) Changes of amino acid serum levels in pediatric patients with higher-risk acute lymphoblastic leukemia (CCG-1961). In Vivo 18 (2):107–112 [PubMed] [Google Scholar]
- 33.Kawedia JD, Liu C, Pei D, Cheng C, Fernandez CA, Howard SC, Campana D, Panetta JC, Bowman WP, Evans WE, Pui CH, Relling MV (2012) Dexamethasone exposure and asparaginase antibodies affect relapse risk in acute lymphoblastic leukemia. Blood 119 (7):1658–1664. doi: 10.1182/blood-2011-09-381731 [DOI] [PMC free article] [PubMed] [Google Scholar]
Associated Data
This section collects any data citations, data availability statements, or supplementary materials included in this article.