

Abstract
Adaptive optics scanning light ophthalmoscopy (AOSLO) allows non-invasive visualization of the living human eye at the microscopic scale; but even with correction of the ocular wavefront aberrations over a large pupil, the smallest cells in the photoreceptor mosaic cannot always be resolved. Here, we synergistically combine annular pupil illumination with sub-Airy disk confocal detection to demonstrate a 33% improvement in transverse resolution (from 2.36 to 1.58 μm) and a 13% axial resolution enhancement (from 37 to 32 μm), an important step towards the study of the complete photoreceptor mosaic in heath and disease. Interestingly, annular pupil illumination also enhanced the visualization of the photoreceptor mosaic in non-confocal detection schemes such as split detection AOSLO, providing a strategy for enhanced multimodal imaging of the cone and rod photoreceptor mosaic.
1. INTRODUCTION
In the living human body, the eye provides a unique opportunity for non-invasive optical access to neurons in the retina (an integral part of the central nervous system). Within the retina, the cone and rod photoreceptors, responsible for initiating vision, vary in size and density [1,2]. Rod photoreceptors and cone photoreceptors in the foveal region (foveal cones) have the smallest cross-sectional diameters—typically ranging from 1 to 3 μm [1,3], near the resolution limit of current in-vivo retinal imaging techniques when using near-infrared (NIR) light (~2–3 μm at 800 nm). The overall goal of this study is to achieve transverse resolution beyond the diffraction limit to improve non-invasive imaging of the complete photoreceptor mosaic.
In the living human eye, scanning light ophthalmoscopy (SLO), a type of confocal microscopy specifically designed for in-vivo retinal imaging, has become an essential tool for the diagnosis and study of retinal diseases [4,5]. However, the resolution of conventional SLO systems is not usually sufficient to routinely resolve the photoreceptor mosaic. Resolution can potentially be improved using real-time correction of ocular aberrations over a large pupil (>7 mm) with adaptive optics (AO) [6] SLO (AOSLO) [7,8] to achieve in-vivo cellular-level imaging of cone and rod photoreceptors [3].
Recently, strategies for surpassing the diffraction limit in the living human eye have been demonstrated, including the use of sub-Airy disk diameter (ADD) confocal pinholes [9] as well as the use of annular pupil illumination [10] for improved AOSLO-based imaging of photoreceptors. In the latter case, improvement in transverse resolution comes at the cost of axial elongation and increased point spread function (PSF) side lobes. In this study, we demonstrate a further resolution improvement by combining sub-ADD confocal detection with annular pupil illumination. We show that with proper selection of parameters, the sub-ADD confocal detection can cancel out the axial elongation and mitigate the side lobes of the PSF caused by annular illumination, which improves photoreceptor imaging.
In addition to confocal imaging, non-confocal AOSLO imaging modalities such as split detection have also been demonstrated for imaging the inner segments of cone photoreceptors [11–13]. Whereas the confocal modality collects light primarily originating from the focus, non-confocal detectors collect light that is typically rejected by confocal pinholes, highlighting structures that are otherwise invisible or difficult to observe in confocal imaging. In our implementation of non-confocal split detection, which uses sample-plane light from 2 to 10 ADD, the sub-ADD pinhole detection approach is inherently not compatible. In our hands, it is even more difficult to resolve rod photoreceptors and foveal cones using non-confocal split detection than using confocal detection. Improving the ability to image inner segments in non-confocal split detection for these smaller photoreceptors is an essential step towards routine assessment of the complete photoreceptor mosaic in the human eye.
Importantly, we validated experimental observations with theoretical predictions showing a net recovery of the loss of axial resolution that would have resulted from using annular pupil illumination alone. In-vivo imaging shows more clearly resolved rod photoreceptors, foveal cones, and even sub-cellular features within large cones. Direct PSF measurements further corroborated our results. These findings indicate that the combined use of annular pupil illumination and sub-Airy disk confocal detection provides a straightforward method to achieve sub-diffraction limited resolution in point-scanning-based microscopy and imaging approaches.
2. MATERIALS AND METHODS
A. Subjects
Five subjects with no signs of ocular disease based on comprehensive eye examinations performed prior to imaging were recruited (Subject 1 = 23, Subject 2 = 28, Subject 3 = 26, Subject 4 = 47, and Subject 5 = 39 years old). This study was approved by the Institutional Review Board of the National Institutes of Health (NCT02317328), and the study was conducted in compliance with the tenets of the Declaration of Helsinki. Written, informed consent was obtained from all participants after the nature of the research and possible consequences of the study were explained prior to participation. Prior to imaging, eyes were dilated with 2.5% phenylephrine hydrochloride (Akorn, Inc) and 1% tropicamide (Sandoz, A Novartis Division).
B. Instrumentation and Optical Alignment
Imaging was performed using a custom-built AOSLO [8,12,14–16]. Briefly, four pairs of afocal relays consisting of concave spherical mirrors conjugate the annular mask (AM), resonant (horizontal) scanner, piezo (vertical) scanner, deformable mirror, and the pupil plane of the eye. To minimize astigmatism, spherical mirrors with long focal lengths arranged in a non-planar folding pattern were used [8].
Superluminescent diodes (SLDs) with peak wavelengths near 790 nm (Superlum S-790-G-I-15-M, Ireland) and 880 nm (Superlum SLD-mCS-341-HP1-SM-880, Ireland) were used for imaging and AO wavefront sensing, respectively. The full width at half-maximum (FWHM) bandwidth of the 790 nm light source was 16.1 nm and was reduced to ~15 nm after passing through a clean-up filter (Chroma ET775/50x, Bellow Falls, VT, USA) placed in front of the light source. The measured power of 790 nm light at the corneal pupil plane was 123 μW with a 1.43 mm thick neutral density filter of 0.1 optical density and full pupil illumination (the power was 156 μW without the neutral density filter). For annular pupil illumination, the neutral density filter was removed for Subjects 1–3, but not for Subjects 4 and 5. The measured power without the neutral density filter was 113 μW (72.4% of the power with full pupil illumination), 103 μW (66.0%), and 78 μW (50%) for ε (inner/outer diameter) = 0.4, 0.5, and 0.6, respectively. The power of the 880 nm light source, measured at the same plane, was 40 μW. Combined, these light levels were below the maximum permissible exposure limit according to the American National Standards Institute standard Z136.1 2014.
An annular reflective mask was placed at a de-scanned retinal (i.e., image) conjugate plane, so that the light within the central 2ADD circular area was reflected and further spatially filtered by a confocal pinhole before reaching the confocal photomultiplier tube (PMT), as described previously [12]. Light within the annular region between 2 to 10 ADD was transmitted and then split using a D-shaped mirror into two parts, one for the “direct” channel and the other for the “reflect” channel. To align the non-confocal split detection pathway using a model eye, the D-shaped mirror was first moved out of the optical path to allow the adjustment of the elliptical beamsplitter (EBS) position to establish a darkfield image [17]. The D-shaped mirror was then moved back into the optical path such that the signal reaching direct and reflect pathways were balanced.
The annular pupil mask was custom manufactured as a low reflective chrome coating on quartz with 1.524 mm thickness (Photo Sciences, Inc., Torrance, CA, USA). Mask plates were cut into 1 in. diameter circles and then mounted on an XY translation mount with quick release plates (Thorlabs CXY1Q, Newton, NJ, USA). The outer diameter of the AMs was set to 8 mm or larger, which was reduced to ~7.5 to 7.7 mm at the pupil plane closest to the eye, either equal to or slightly smaller than the beam diameter of the full pupil illumination condition (measured to be 7.7 mm). We centered the AM with respect to the optical axis using a camera placed to the right side of dichroic mirror D1 with a pair of relay lenses, to facilitate swapping and alignment of masks.
Three pupil illumination patterns (ε = 0.4, 0.5, and 0.6) and three confocal pinholes (0.4, 0.8, and 1.2 ADD) were chosen. In theory, a bigger ε and a smaller confocal pinhole produce a better lateral resolution. However, these would also reduce the illumination power, potentially degrading the signal-to-noise ratio (SNR).
C. Image Acquisition and Processing
Videos were acquired as described previously [16] using the following acquisition parameters. For in-vivo human data, 150 frame videos (~9 s long) of confocal reflectance and non-confocal direct and reflect channels were simultaneously acquired. Non-confocal split detection images were generated by taking the difference between direct and reflect channels and dividing by their sum [12]. Images were acquired with 1° square field of view (750 × 605 pixels) at two locations selected to obtain images of foveal cones and rod photoreceptors: fovea and 10° temporal from fixation. At each location, combinations of four pupil illumination patterns (ε = 0, 0.4, 0.5, and 0.6) and three confocal pinholes (0.4, 0.8, and 1.2 ADD) were tested (1 ADD corresponds to ~11 pixels), for Subjects 1–3. For Subjects 4 and 5 (replicating results in relatively older subjects), only combinations of two pupil illumination patterns (ε = 0 and 0.5) and two confocal pinholes (0.8 and 1.2 ADD) were tested. During image acquisition, the focal plane was subjectively selected by changing the defocus added to the deformable mirror to achieve best cone focus in the non-confocal split detection using the full pupil illumination and 1.2 ADD confocal pinhole detection. This focal plane was kept the same for all subsequent conditions at each location. One to three videos were collected for each condition. The total imaging time was about 1–3 h per subject, including numerous breaks to allow for exchange of illumination masks and detection apertures. Usually, the longer the subject sat in front of the system, the more fatigued the subject became, which could potentially affect the AOSLO imaging. When the subject felt tired, or the fixation became unstable, we asked the subject to take a break. The baseline condition ε = 0 and 1.2 ADD confocal pinhole was imaged first in four out of the five subjects, when the subject was least fatigued (see Table S1 of Supplement 1 for detailed sequences of imaging conditions). A strip-based normalized cross-correlation algorithm was used to correct for eye motion on the confocal reflectance channel, and then the same eye motion correction was applied to the non-confocal split detection channel to preserve the pixel-to-pixel correspondence between simultaneously acquired confocal and non-confocal split detection images [18]. All AOSLO photoreceptor images shown in this study were obtained by averaging up to 150 registered frames. Gamma correction of 0.7, followed by histogram stretching (“Enhance Contrast”, “saturated = 0.35”, in Fiji), was applied to all confocal reflectance images (except images of the resolution target) shown in this study to facilitate visualization of both the bright and dark photoreceptors.
We employed a three-surfaced simplified eye model updated with measurements of axial length, corneal curvature, and anterior chamber depth for each subject obtained using an IOL Master (Carl Zeiss Meditec, Dublin, CA, USA) to compute the retinal scaling factor from angle (degrees) to millimeters [19]. After scaling, the pixel size was 0.429 μm in Subject 1, 0.441 μm in Subject 2, 0.441 μm in Subject 3, 0.4393 μm in Subject 4, and 0.4561 μm in Subject 5.
To quantitatively compare the power spectra of images, first, we computed the two-dimensional (2D) discrete Fourier transform on images. Next, we took the square of absolute values. Finally, Cartesian coordinates were converted to 2D polar coordinates. The azimuthal average was used to convert 2D polar power spectra into one-dimensional (1D) spectrum curves. The relative power spectra were obtained by dividing spectrum curves with the reference spectrum curve.
D. Empirical Measurements of Resolution
Polystyrene NIR fluorescent beads with 0.5 μm diameter (Phosphorex 4003, Hopkinton, MA, USA; peak excitation/emission wavelengths: 780/820 nm) were used to characterize the spatial resolution. The 790 nm light source was used for both the confocal reflectance channel as well as the excitation light for the NIR fluorescence channel. A custom 855 nm dichroic beamsplitter was used to collect the fluorescence light of beads between 810–850 nm, and an emission filter (Semrock FF01-832/37, Rochester, NY, USA) was used to block the excitation light.
Beads were suspended by dilution with deionized water by a factor of 500×, thoroughly mixed, and then a few drops were transferred onto filter paper. The filter paper with the beads after the water dried was taped to a z-axis translation mount and placed near the focal plane of a lens with 19 mm focal length (Thorlabs AC127-019-B-ML, Newton, NJ, USA). After focusing the filter paper using the z-axis stage, AO correction was briefly turned on to correct for wavefront aberrations in the AOSLO and the 19 mm achromatic lens, after which the deformable mirror shape was kept. The rough surface of the filter paper scattered photons and enabled direct wavefront sensing to be performed. The sample was moved 40 times along the z axis in 5 μm steps to acquire a threedimensional (3D) stack of AOSLO confocal fluorescence images, from which the PSF could be measured. At each axial location, 50 frame (3 s long) images of beads were collected using a 0.75° square field of view. The 3D fluorescence images of 11 individual beads were transversely and axially registered before averaging.
A 1951 USAF reflective resolution target (Edmund Optics, #58-198, Barrington, NJ, USA) was used to confirm the lateral resolution in the confocal channel; for this target, the AO correction was established by replacing the resolution target with filter paper, freezing the AO wavefront correction, and then replacing the filter paper with the resolution target.
E. Theoretical Resolution Simulation in Three Dimensions
We assume that the light distribution within the annular pupil is uniform, and the vector nature of the light near the focus can be ignored due to the relatively small NA. The coherence length of the broadband light source was estimated to be around 13.7 μm [2ln2λ2/(nπΔλ), where λ = 790 nm, Δλ = 15 nm, and n = 1.336]. It has been shown that using a broadband light source for photoreceptor imaging effectively mitigates interference artifacts observed when using coherent light sources [20,21]. For the purposes of the simulation, we do not consider mutual interference between light from adjacent photoreceptors (see Supplement 1 for a detailed comparison between coherent and incoherent conditions). We built the 2D theoretical simulation based on previous work [22–24] and then extended it to a 3D scenario. MATLAB simulation codes were provided in Code1, Ref. [25]. We begin with the 2D condition with the sample located exactly on the focal plane. We define (x1, y1) and (x2, y2) as coordinates on the sample plane and on the plane of the confocal pinhole, respectively. At the scanning position (xo, yo), the corresponding light intensity distribution on the sample is given by Hi(x1 − x0, y1 − y0)S(x1, y1), where Hi and S are the intensity PSF and the intensity reflectance ratio of the sample, respectively. The light reflected from the sample is de-scanned by the scanners. When it reaches the confocal pinhole, the intensity of the electrical field can be expressed as
| (1) |
By replacing (x1, y1) with (x1 + xo, y1 + yo), Eq. (1) becomes
| (2) |
Note that Eq. (1) represents the strategy of scanning a focused spot of light across the sample and then collecting the returning light in a de-scanned manner, whereas Eq. (2) represents moving the sample instead. These two strategies are mathematically equivalent, except that the direction that the sample is moved is opposite the direction the focused spot of light is scanned on the sample. Incorporating the confocal pinhole as D(x2, y2), the photons that pass through this pinhole are integrated by the detector [22]:
| (3) |
Note the order of integrals is switched, and ⊗ denotes convolution. The overall intensity PSF of the system is [9,10]
| (4) |
Next, we consider the 3D case. Equation (2) becomes
| (5) |
The confocal pinhole is assumed to be infinitely thin, expressed as
| (6) |
where δ(z2) is the Dirac delta function. The 3D version of Eq. (3) becomes
| (7) |
Generalizing Eq. (4), this leads to the overall 3D intensity system PSF:
| (8) |
Here, ⊗ denotes a 3D convolution. In practice, only 2D convolutions implemented in the x − y plane are needed due to the presence of δ(z2) (Dirac delta function) in the definition of P. Note that if the confocal pinhole is infinitely small, P becomes a Dirac delta function in three dimensions, resulting in a system PSF of HiHd. With uniform illumination within the annular pupil on the back focal plane of the objective, the intensity PSF is governed by [24]
| (9) |
where ε is the ratio of the inner diameter to the outer diameter of the annular pupil illumination, and ν and u are dimensionless radial and axial coordinates:
| (10) |
In Eq. (10), λ is the wavelength of the light, l is the effective focal length of the eye, and a is the outer radius of the annular pupil illumination.
3. RESULTS
A. Confocal Reflectance Imaging of Rods and Foveal Cone Photoreceptors
The combination of annular pupil illumination (based on ε = 0.5, where ε is the inner to outer diameter ratio) with sub-ADD confocal pinhole detection (based on 0.4 ADD) produced superior resolution of both rod and foveal cone photoreceptors in the confocal reflectance images (Fig. 1 and Visualization1). This improvement was greater than that achieved using either sub-ADD confocal detection [9] or annular pupil illumination [10] alone. Four imaging conditions were compared: (1) full pupil illumination (no mask was used, ε = 0) with a 1.2 ADD confocal pinhole detection; (2) ε = 0 with a sub-ADD confocal pinhole (0.4 ADD); (3) annular pupil illumination (ε = 0.5) with a 1.2 ADD confocal pinhole; and (4) ε = 0.5 with a sub-ADD confocal pinhole (0.4 ADD). Overall, conditions 2 and 3 provided comparable improvements for identification of rods [Fig. 1(b)] and foveal cones [Fig. 1(h)], while condition 4 offered the best improvement in rod and foveal cone identifications. Relative power spectra (see Methods for definition) in Figs. 1(f) and 1(l) and FWHMs (Table 1) of the autocorrelation of the images in Fig. 1 corroborated this observation.
Fig. 1.
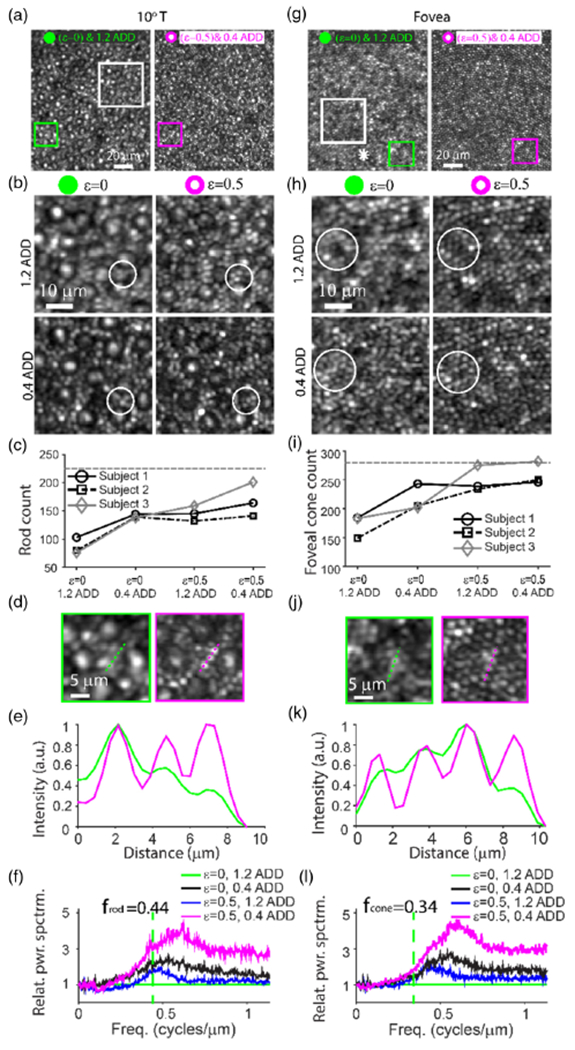
Rod photoreceptors and foveal cones are improved in confocal reflectance images. Confocal AO images of photoreceptors in the living human eye at retinal locations of (a)–(f) 10° temporal (T) from the locus of fixation and (g)–(l) at the fovea. (a) and (g) Comparison of confocal images sequentially acquired using either (left) full pupil illumination (ε, inner diameter/outer diameter, = 0) and 1.2 Airy disk diameter (ADD) confocal pinhole detection or (right) annular pupil illumination (ε = 0.5) and sub-ADD (0.4 ADD) confocal pinhole detection. The asterisk in (g) denotes the foveal center (estimated based on highest cone density). (b) and (h) Comparison of four imaging conditions: ε = 0 (full pupil illumination) and 1.2 ADD confocal pinhole detection, ε = 0 and 0.4 ADD, ε = 0.5 and 1.2 ADD, and ε = 0.5 and 0.4 ADD. The locations of images in (b) and (h) are specified by the white squares in (a) and (g), respectively. (c) and (i) The total number of rods and foveal cones that could be identified using each modality, respectively, within a 43 μm × 43 μm region of interest (ROI) from three subjects. The horizontal dashed lines in (c) and (i) indicate the expected normal histologic numbers [1] of (c) rods and (i) foveal cones within a 43 μm × 43 μm ROI at retinal locations of 10° T from fixation and 50 μm temporal from the point of the highest density. The actual locations of the foveal ROIs were 40, 42, and 0 μm away from the location corresponding to peak cone density for Subjects 1, 2, and 3, respectively. (d) and (j) Zoom of green and magenta squares in (a) and (g), respectively. (e) and (k) Intensity profiles along green and magenta dashed lines in (d) and (j), respectively. (f) and (l) Relative power spectrum ratio. All retinal images shown here are from Subject 1. Images from all subjects are shown in Figs. S1–S3, S5, and S6 of Supplement 1.
Table 1.
Improvement of FWHM Observed using the Combination of Annular Pupil Illumination and Sub-ADD Pinhole Detection Based on Normalized Autocorrelation of the Images in Fig. 1a
| Normalized Autocorrelation FWHM Changes Corresponding to Images in Fig. 1 | ||||
|---|---|---|---|---|
| None | 0.4 ADD | e = 0.5 | Both | |
| 10 T° (%) | 0.0 | −16.9 | −17.7 | −22.4 |
| Fovea (%) | 0.0 | −28.9 | −21.5 | −31.6 |
The negative sign indicates the reduction of the FWHM (i.e., sharpening of image features).
To further characterize the effect of these parameters on imaging, different combinations of annular pupils (ε = 0, 0.4, 0.5, and 0.6) and confocal pinholes (0.4, 0.8, and 1.2 ADD) were performed (Fig. S1–S3, Supplement 1). Both qualitative comparisons between the resulting image quality as well as quantitative assessment of power spectra (see Methods and Fig. S4 of Supplement 1 for definition) indicate that the combination of ε = 0.5 annular pupil illumination and 0.4 or 0.8 ADD confocal detection provided the best balance between resolution and SNR. In particular, the condition ε = 0.6 sometimes resulted in reduced qualitative image contrast of the photoreceptor mosaic, likely due to the reduced illumination power (see Methods). We replicated combinations of two pupil illumination patterns (ε = 0 and 0.5) and two confocal pinholes (0.8 and 1.2 ADD) in the two older subjects. Similar to the results shown in Fig. 1, ε = 0.5 annular pupil illumination or 0.8 ADD confocal pinhole alone improved the detection of foveal cones (Fig. S5, Supplement 1) or rod photoreceptors (Fig. S6, Supplement 1), while the combination of ε = 0.5 annular pupil illumination and 0.8 ADD confocal pinhole provided further improvement (Figs. S5 and S6).
B. Improved Photoreceptor Imaging Demonstrated with Non-Confocal Split Detection
Using non-confocal split detection [12], it is difficult to visualize the inner segments of foveal cones [26]. This limitation occurs even in situations in which simultaneously captured confocal reflectance images resolve the same foveal cones. Here, we find that annular illumination improved visualization of foveal cones in non-confocal split detection (Fig. 2 and Fig. S5 of Supplement 1). Qualitatively, foveal cones were increasingly resolvable with increasing ε, with corresponding relative power spectrum ratios that also increased accordingly. Importantly, the resolution enhancement appears to arise from the direct and reflect images prior to their combination to generate the non-confocal split detection images (Fig. S7, Supplement 1).
Fig. 2.
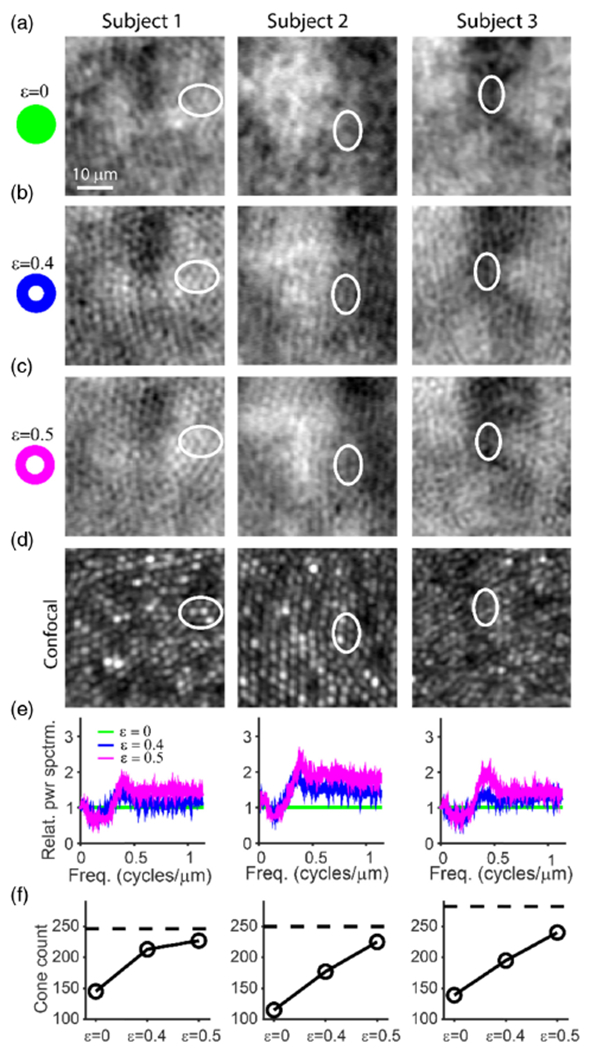
Annular pupil illumination improves the detection of the foveal cones in non-confocal split detection. (a)–(c) Non-confocal split detection images with the ratio of the inner/outer diameter ε = 0 (full pupil illumination), 0.4, and 0.5, respectively. (d) Co-registered confocal images of the same retinal structures acquired concurrently with those in (c) (ε = 0.5, 1.2 ADD). The visibility of foveal cones was improved as ε increased from 0 to 0.5, validated against confocal images of foveal cones (e.g., white ellipses). (e) Relative power spectrum ratio of non-confocal split detection images with respect to the image acquired using full pupil illumination. (f) The total number of identifiable foveal cones in non-confocal split detection images for the three conditions: ε = 0, 0.4, and 0.5. The black horizontal lines indicate the highest foveal cone count from the corresponding confocal images (i.e., the maximum cone count in Fig. 1(i) for each subject). These images are located 40, 42 and 0 μm away from the estimated foveal center (based on location of highest cone density) for Subjects 1, 2, and 3, respectively.
Rod photoreceptor inner segments are also not typically visible in non-confocal split detection [12]. Following the demonstration that foveal cones could be resolved using non-confocal split detection (Fig. 2 and Fig. S6 of Supplement 1), we observed that rods also became increasingly resolvable as we increased ε from 0 (full pupil illumination) to 0.4 and then 0.5 (white arrows in Fig. 3). Images of rods on the non-confocal split detection modality were consistent with the same rods visible on the simultaneously acquired confocal reflectance images [3]. Similar to the foveal imaging data, visualization of rods improved in the direct and reflect imaging channels, prior to the computation of the non-confocal split detection images (Fig. S7, Supplement 1).
Fig. 3.
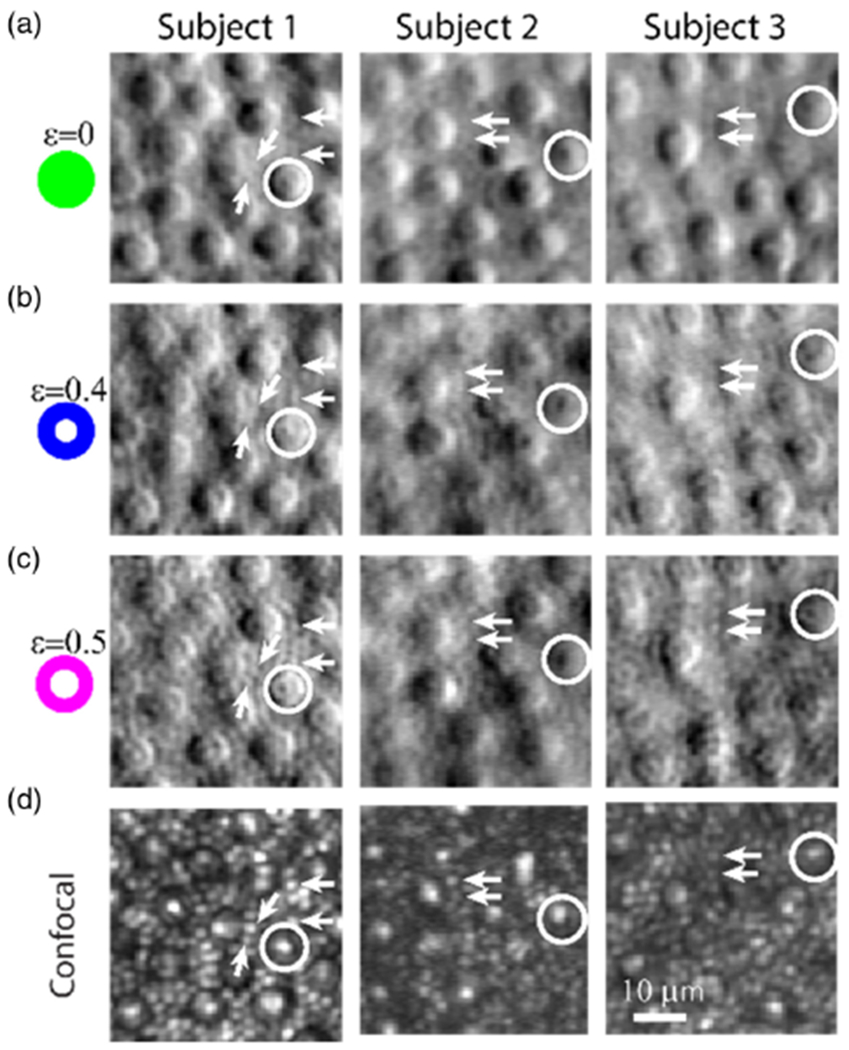
Annular pupil illumination allows for clearer delineation of rods and sub-cellular features of cones in the non-confocal split detection channel. (a), (b), and (c) are images collected from the non-confocal split detection channel, corresponding to ε = 0, 0.4, and 0.5, respectively. White arrows point to examples of rods, and white circles illustrate sub-cellular features of cones. (d) Co-registered confocal images that were collected simultaneously with those in (c) (ε = 0.5, 1.2 ADD confocal pinhole for Subjects 1 and 3, and 0.4 ADD for Subject 2).
C. Subcellular Features of Peripheral Cones Revealed using Non-Confocal Imaging
Non-confocal split detection with annular pupil illumination also revealed subcellular cone photoreceptors features that co-localize with features in the simultaneously captured and co-registered confocal reflectance images (see white circles in Figs. 3 and 4). Close examination of the non-confocal split detection images with full pupil illumination also shows these subcellular features, albeit with much weaker contrast.
Fig. 4.
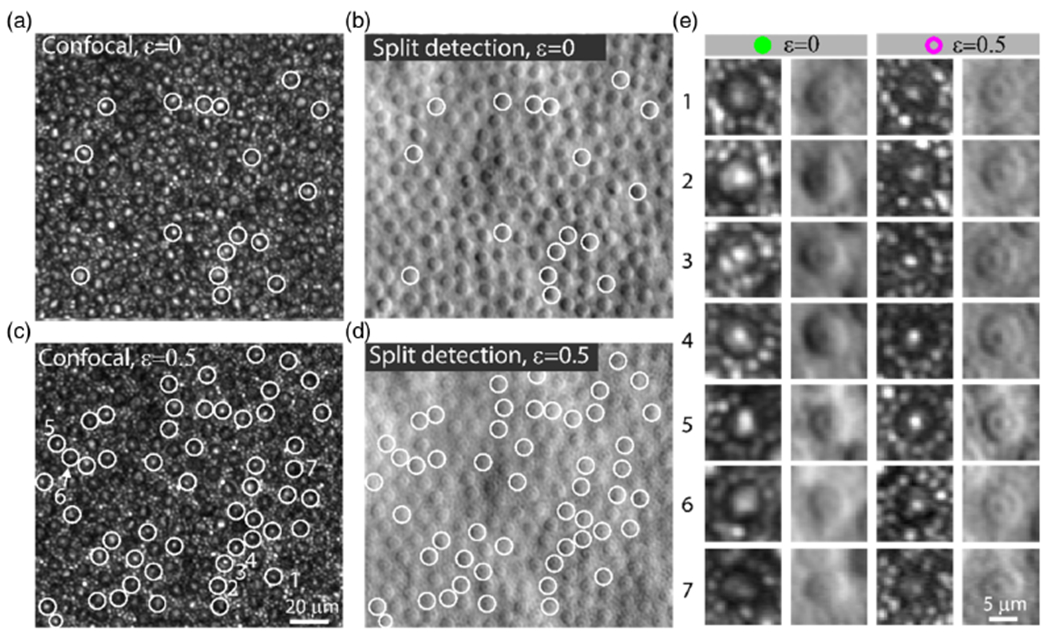
Subcellular features of the cones in the non-confocal split detection channel are associated with bright spots in the confocal channel. (a) Confocal and (b) non-confocal split detection images acquired using full pupil illumination (ε = 0). (c) Confocal and (d) non-confocal split detection images acquired using annular pupil illumination ε = 0.5. The white circles show examples of cones that have bright spots in the confocal channel that correspond well to the subcellular features that are observed using non-confocal split detection acquired with annular pupil illumination. (e) Enlarged views of cones in the confocal channel and non-confocal split detection with full pupil and annular pupil illumination. Subcellular features of cells in non-confocal split detection are more easily visible with annular pupil illumination compared to full pupil illumination, especially in cells 6 and 7. Data from Subject 1 is shown.
D. Validation of Theoretical Resolution Enhancement Through PSF Measurement
Direct measurements of the PSF were performed using the single-photon fluorescent channel using sub-diffraction NIR fluorescent beads to verify the impact of annular pupil illumination and sub-ADD confocal detection on lateral and axial resolution (Fig. 5).
Fig. 5.
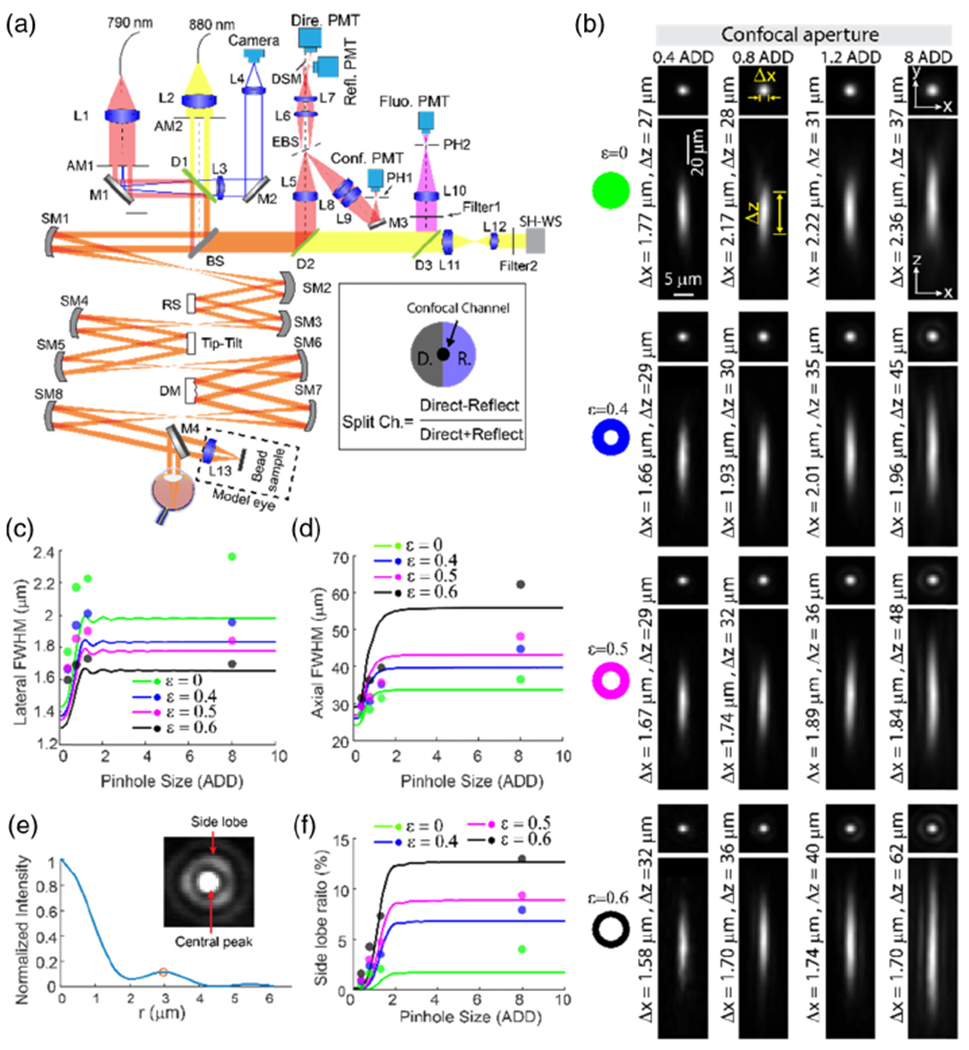
Optical diagram of the AOSLO and PSF characterization of the confocal fluorescence channel using fluorescent beads. (a) Optical diagram. For wavefront sensing, 880 nm light was used, and 790 nm light was used for illumination for the confocal channel, non-confocal split detection channel, and excitation for the fluorescence channel. AM1 and AM2, annular mask. AM1 was used for ring illumination, while AM2 was employed to reduce corneal reflections to improve the performance of the AO correction. L1–L13, lenses; SM1–SM8, spherical mirrors; M1–M4, mirrors; BS, beamsplitter (R:T = 2:8); EBS, elliptical beamsplitter that reflects the center (2 ADD) of the light toward the confocal channel and transmits the rest (from 2 ADD to 10 ADD) for non-confocal split detection; RS, resonant scanner; DM, deformable mirror. Mirror M4 is mounted on a motorized translation stage (not shown) to switch between the model eye and the human subject. (b) PSF measurements using 0.5 μm fluorescent beads. PSF images shown were generated by averaging aligned images of 11 beads. (c) Lateral and (d) axial FWHM. (e) Intensity radial profile of image in the inset. Inset: PSF measurement with ε = 0.6 and 8.0 ADD confocal pinhole. The central peak was saturated to show the side ring clearly. (f) Side lobe ratios. In (c), (d), and (e), curves are simulation results, and dots are mean empirical measurements of 11 beads.
As expected, confocal pinhole size reduction from 8.0 ADD to 0.4 ADD alone resulted in an improvement of PSF lateral FWHM from 2.36 μm to 1.77 μm, in agreement with previously reported values [9]. Likewise, annular pupil illumination alone also resulted in a narrowing of the lateral extent of the PSF with a corresponding elongation in the axial direction with increasing ε [Figs. 5(b)–5(d)]. The combined use of annular pupil illumination and sub-ADD pinhole detection provided further lateral resolution improvement, reaching 1.67 μm and 1.58 μm when using a 0.4 ADD pinhole, where ε = 0.5 and ε = 0.6 were used, respectively [Figs. 5(b), 5(c), and S8].
The 3D image stacks also show that the elongation of the axial FWHM due to annular pupil illumination is mitigated through the use of sub-ADD pinholes. Starting with the case of 8.0 ADD confocal pinhole detection, when ε was increased from 0 to 0.6, the axial FWHM was worsened from 37 to 62 μm. However, while maintaining ε at 0.6, the axial FWHM was shortened from 62 to 32 μm (Fig. S8, Supplement 1), by reducing the confocal pinhole from 8.0 to 0.4 ADD. Importantly, the sub-ADD confocal detection substantially attenuated the side lobes generated by the annular pupil illumination [Figs. 5(e) and 5(f)].
Although the achieved resolution improvement was slightly lower than predicted for a few of the conditions, there was overall agreement between theoretical and experimental values [mean ± standard deviation (SD) of differences: 13 ± 6% for lateral FWHMs, and 11 ± 6% for axial FWHMs, calculated from the average of 11 beads, i.e., the points in Figs. 5(c) and 5(d)].
To verify that annular pupil illumination and sub-ADD confocal pinhole detection improves lateral resolution not only in the confocal fluorescence channel but also in the confocal reflectance channel, we carried out two additional characterizations. First, we imaged a resolution target (Fig. 6). With 1.2 ADD confocal pinhole and full pupil illumination, the confocal channel was able to resolve the third to the smallest gratings (Group 9, Element 1), which had 512 line pairs/mm (period: 1.95 μm). Either using ε = 0.5 annular pupil illumination or 0.4 ADD confocal pinhole, the second to the smallest vertical gratings (Group 9, Element 2) were resolvable (575 line pairs/mm and 1.74 μm period). Combining ε = 0.5 annular pupil illumination and 0.4 ADD confocal pinhole yielded the best resolution and could distinguish the smallest vertical gratings (Group 9, Element 3, 645 line pairs/mm, and 1.55 μm period). Although the horizontal lateral resolution was slightly worse than the vertical (only the second to the smallest horizontal gratings could be resolved), the overall trend of resolution improvement was maintained [Fig. 6(c)]. For the last condition (ε = 0.5 annular pupil illumination and 0.4 ADD confocal pinhole), the smallest and the second to the smallest gratings have contrasts around 6% and 13%, respectively. Comparing these measurements with simulations suggests that our confocal AOSLO imaging system is consistent with an incoherent imaging condition (see Fig. S9 and Supplement 1). Second, we simultaneously imaged filter paper stained with indocyanine green (ICG) dye for concurrent confocal reflectance, non-confocal split detection, and confocal fluorescence imaging. Based on the power spectrum analysis in Fig. S10 of Supplement 1, we observed similar findings between confocal reflectance and fluorescence: (1) either annular pupil illumination or sub-ADD confocal pinhole detection boosted the high spatial frequencies, and (2) combining annular pupil illumination and sub-ADD confocal pinhole detection further enhanced the high spatial frequencies.
Fig. 6.
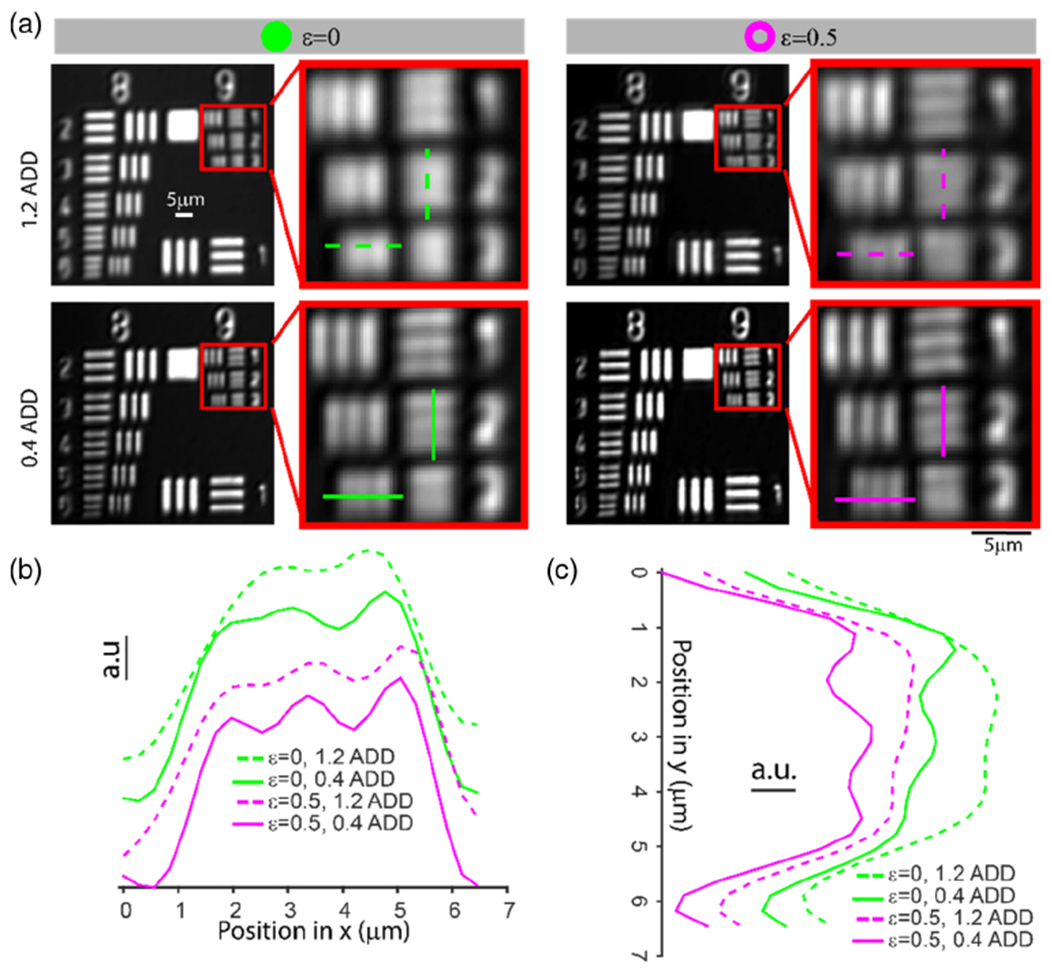
Resolution characterization of the confocal reflectance channel using a resolution target. (a) Comparison of confocal images of the positive reflective resolution target in four conditions: ε = 0 (full pupil illumination) and 1.2 ADD confocal pinhole detection, ε = 0 and 0.4 ADD, ε = 0.5 and 1.2 ADD, and ε = 0.5 and 0.4 ADD. (b) and (c) Normalized intensity profiles of horizontal (Group 9, Element 3) and vertical lines (Group 9, Element 2) specified in (a), respectively. Gratings in Group 9 and Elements 1, 2, and 3 have line periods of 1.95 μm, 1.74 μm, and 1.55 μm, respectively. Curves in (b) and (c) are displaced to have a better view of each curve.
4. DISCUSSION
AOSLO enables the investigation of disease at the cellular level, non-invasively [27,28]. In this study, we demonstrate that the combination of annular pupil illumination and sub-ADD confocal pinhole detection yields superior resolution than each of these independently. The improved images facilitate the assessment of individual photoreceptors.
Interestingly, the use of annular pupil illumination also improved non-confocal imaging. This could be due to an improvement in the resolution or other factors such as an extended depth of focus (DOF) or the juxtaposition of a portion of the confocal component of light returning from other portions of the photoreceptors inner and/or outer segments [29]. However, despite the potential increased DOF, it is not clear if out of plane light contributes to the non-confocal split detection signal. In our setup, the separation of the confocal and non-confocal split detection channels was carried out by an annular reflective mask that reflects light between 2 to 10 ADD [AM in Fig. 5(a)]. This might not be sufficient to separate the confocal and non-confocal signals [30]. On the one hand, the narrowing of the lateral extent of the PSF with ring illumination would be expected to further shrink the relative amount of confocal light available for non-confocal detection. However, on the other hand, considering the elongation of the focus resulting from annular pupil illumination, it is also possible that the light at the two axial ends of the elongated illumination focus could have resulted in increased leakage of the confocal component of the light into the non-confocal split detection channel, as these are less likely to be rejected by the confocal pinhole. Nonetheless, the incorporation of annular pupil illumination seems to improve the contrast of photoreceptors in the non-confocal split detection channel.
Depending on the application, different ratios of inner/outer diameters (ε) for implementing annular illumination may be desirable. In some cases, a longer axial FWHM could be useful for extending the DOF for capillary imaging with AOSLO [31], optical coherence tomography [32], multiphoton microscopy [33,34], light sheet microscopy [35], photoacoustic microscopy [36], or for imaging samples with axial motion [33,37]. Given a fixed outer diameter, a thinner annular ring generates a longer and narrower focus. As the thickness of the ring approaches zero, the resulting illumination focus approaches an ideal Bessel beam, which has the best lateral FWHM (Fig. S11, Supplement 1) but is impractical to use in ophthalmology. For retinal imaging, an additional consideration comes into play: eyelids that are only partially open (e.g., due to ptosis or fatigue) can rapidly diminish the SNR. Because the light is redistributed to the outer portion of the beam, the obscuration of light at any of the edges of the annulus at the pupil plane leads to more severe loss of illumination light at the retina in comparison to full pupil illumination. Slight misalignment of the imaging beam and the pupil being imaged could also obscure portions of the annulus in a similar manner, thus establishing a practical tradeoff between thinner annuli and robust human subject imaging. Indeed, our empirical results indicate that the use of a more aggressive annulus (ε = 0.6), which resulted in a lower SNR of images, was inferior to a more moderate annulus (ε = 0.5). The use of an annular pupil mask can degrade the SNR by requiring a higher PMT gain to compensate for lower power delivered to the eye. This can be further exacerbated by the use of a sub-ADD confocal pinhole. For eyes with poor SNR or fixation, a more moderate combination (e.g., ε = 0.5 with 0.8 ADD or ε = 0.4 with 0.8 ADD) is recommended. Annular pupil illumination and sub-ADD confocal pinholes allow for easy modifications to existing AOSLO systems to improve the resolution of retinal imaging. Image scanning microscopy or pixel reassignment [38,39], in principle, could also provide an alternate method for resolution enhancement.
The identity of the subcellular cone features in both confocal reflectance and non-confocal split detection remains to be explored. The possible origins might be related to the waveguiding of light through a central core [40–42] or due to a subcellular structure within cone photoreceptor inner segments.
Several reasons could contribute to the differences observed between PSF measurements and simulations. First, simulations were carried out assuming that the illumination and detection wavelengths were identical, while the measurements were performed using fluorescence light, which had longer wavelengths than the excitation light. Second, non-common path aberrations may exist [43], which could explain why the measured lateral FWHM was 2.22 μm using fluorescent beads in the fluorescence channel, while the confocal channel could resolve the reflective grating with line periods of 1.95 μm (full pupil illumination and 1.2 ADD for both). Third, 11 fluorescent beads were randomly selected within the field of view, and dynamic distortion arising from the use of resonant galvanometric scanners is known to degrade resolution in areas that are not at the image center [44].
The empirical PSF measurements and simulations suggest that the proposed approaches for improved resolution are generalizable to other types of microscopy including phase contrast, differential phase contrast, confocal [22], and non-linear [37] microscopy. The improved visualization of rods and cones in non-confocal split detection with annular pupil illumination suggests that this approach would also benefit techniques such as offset aperture [45], knife-edge [46], darkfield [17], or multi-offset aperture [47], which are in principle similar to the direct and reflect channels from which non-confocal split detection is generated (Fig. S7, Supplement 1). In principle, fluorescence confocal-based AO techniques such as fluorescein angiography [48], ICG [14], infrared autofluorescence [49], and visible light autofluorescence [50] could also benefit from combined annular pupil illumination and sub-ADD pinhole detection. In the case of two-photon fluorescence microscopy (photons collected without confocal pinholes), it has been shown that the focus generated by annular pupil illumination (effective NA = 0.4) was similar to that generated using a Gaussian focus (effective NA = 0.6) [37], which suggests that annular illumination for the purposes of surpassing the diffraction limit of resolution is compatible with multiphoton microscopy. Although the improvement in resolution is moderate compared to super-resolution techniques [51] such as stimulated emission depletion (STED) microscopy [52] or single-molecule localization microscopy (SMLM) [53–55], there are limitations to what can be performed in the living human eye that make it difficult to utilize specific fluorophores, long imaging times, strong excitation powers, or requirements for a sample that is not in motion (e.g., due to eye motion). These considerations withstanding, we have demonstrated a clear improvement in the ability to obtain in-vivo higher resolution multimodal images of the smallest neurons in the retina, an important step towards observing how the central nervous system works in the living human body.
Supplementary Material
Acknowledgment.
The authors thank L. Huryn, W. Zein, and C. Cukras for assistance with clinical assessments and D. Claus, A. Bamji, W. Holland, and G. Babilonia-Ayukawa for assistance with clinical coordination and clinical procedures.
Funding.
Research to Prevent Blindness (Departmental Award); Glaucoma Research Foundation (Catalyst for a Cure Initiative); Alcon Research Institute; National Institutes ofHealth (Intramural Research Program, R01 EY025231,U01 EY025477).
Footnotes
Disclosures. The authors declare no conflict of interests.
REFERENCES
- 1.Curcio CA, Sloan KR, Kalina RE, and Hendrickson AE, “Human photoreceptor topography,” J. Comparative Neurol 292, 497–523 (1990). [DOI] [PubMed] [Google Scholar]
- 2.Liu J, Jung H, Dubra A, and Tam J, “Cone photoreceptor cell segmentation and diameter measurement on adaptive optics images using circularly constrained active contour model,” Invest. Ophthalmol. Vis. Sci 59, 4639–4652(2018). [DOI] [PMC free article] [PubMed] [Google Scholar]
- 3.Dubra A, Sulai Y, Norris JL, Cooper RF, Dubis AM, Williams DR, and Carroll J, “Noninvasive imaging of the human rod photoreceptor mosaic using a confocal adaptive optics scanning ophthalmoscope,” Biomed. Opt. Express 2,1864–1876(2011). [DOI] [PMC free article] [PubMed] [Google Scholar]
- 4.Webb RH, Hughes GW, and Delori FC, “Confocal scanning laser ophthalmoscope,” Appl. Opt 26,1492–1499 (1987). [DOI] [PubMed] [Google Scholar]
- 5.Elsner AE, Burns SA, Hughes GW, and Webb RH, “Reflectometry with a scanning laser ophthalmoscope,” Appl. Opt 31, 3697–3710 (1992). [DOI] [PubMed] [Google Scholar]
- 6.Liang J, Williams DR, and Miller DT, “Supernormal vision and high-resolution retinal imaging through adaptive optics,” J. Opt. Soc. Am. A 14, 2884–2892(1997). [DOI] [PubMed] [Google Scholar]
- 7.Roorda A, Romero-Borja F, Donnelly WJ III, Queener H, Hebert TJ, and Campbell MC, “Adaptive optics scanning laser ophthalmoscopy,” Opt. Express 10, 405–412 (2002). [DOI] [PubMed] [Google Scholar]
- 8.Dubra A and Sulai Y, “Reflective afocal broadband adaptive optics scanning ophthalmoscope,” Biomed. Opt. Express 2, 1757–1768 (2011). [DOI] [PMC free article] [PubMed] [Google Scholar]
- 9.Sredar N, Fagbemi OE, and Dubra A, “Sub-Airy confocal adaptive optics scanning ophthalmoscopy,” Transl. Vis. Sci. Technol 7, 17 (2018). [DOI] [PMC free article] [PubMed] [Google Scholar]
- 10.Sulai YN and Dubra A, “Adaptive optics scanning ophthalmoscopy with annular pupils,” Biomed. Opt. Express 3,1647–1661 (2012). [DOI] [PMC free article] [PubMed] [Google Scholar]
- 11.Elsner AE, Miura M, Burns SA, Beausencourt E, Kunze C, Kelley L, Walker J, Wing G, Raskauskas P, and Fletcher D, “Multiply scattered light tomography and confocal imaging: detecting neovascularization in age-related macular degeneration,” Opt. Express 7, 95–106 (2000). [DOI] [PubMed] [Google Scholar]
- 12.Scoles D, Sulai YN, Langlo CS, Fishman GA, Curcio CA, Carroll J, and Dubra A, “In vivo imaging of human cone photoreceptor inner segments,” Invest. Ophthalmol. Vis. Sci 55,4244–4251 (2014). [DOI] [PMC free article] [PubMed] [Google Scholar]
- 13.Walters S, Schwarz C, Sharma R, Rossi EA, Fischer WS, DiLoreto DA, Strazzeri J, Nelidova D, Roska B, and Hunter JJ, “Cellular-scale evaluation of induced photoreceptor degeneration in the living primate eye,” Biomed. Opt. Express 10,66–82 (2019). [DOI] [PMC free article] [PubMed] [Google Scholar]
- 14.Tam J, Liu J, Dubra A, and Fariss R, “In vivo imaging of the human retinal pigment epithelial mosaic using adaptive optics enhanced indocyanine green ophthalmoscopy,” Invest. Ophthalmol. Vis. Sci 57, 4376–4384(2016). [DOI] [PMC free article] [PubMed] [Google Scholar]
- 15.Jung H, Liu T, Liu J, Huryn LA, and Tam J, “Combining multimodal adaptive optics imaging and angiography improves visualization of human eyes with cellular-level resolution,” Commun. Biol 1,189(2018). [DOI] [PMC free article] [PubMed] [Google Scholar]
- 16.Jung H, Liu J, Tao Liu AG, Smelkinson MG, Cohen S, Sharma R, Schwartz O, Maminishkis A, Bharti K, and Cukras C, “Longitudinal adaptive optics fluorescence microscopy reveals cellular mosaicism in patients,” JCI Insight 4, e124904(2019). [DOI] [PMC free article] [PubMed] [Google Scholar]
- 17.Scoles D, Sulai YN, and Dubra A, “In vivo dark-field imaging of the retinal pigment epithelium cell mosaic,” Biomed. Opt. Express 4, 1710–1723(2013). [DOI] [PMC free article] [PubMed] [Google Scholar]
- 18.Dubra A and Harvey Z, “Registration of 2D images from fast scanning ophthalmic instruments,” in International Workshop on Biomedical Image Registration (Springer, 2010), pp. 60–71. [Google Scholar]
- 19.Bennett A and Rabbetts R, “Proposals for new reduced and schematic eyes,” Ophthalmic. Physiol. Opt 9,228–230(1989). [DOI] [PubMed] [Google Scholar]
- 20.Roorda A and Zhang Y, “Mechanism for cone reflectivity revealed with low coherence AOSLO imaging,” Invest. Ophthalmol. Vis. Sci 46, 2433 (2005).15980232 [Google Scholar]
- 21.Zhang Y, Poonja S, and Roorda A, “AOSLO: from benchtop to clinic,” Proc. SPIE 6306, 63060V (2006). [Google Scholar]
- 22.Wilson T and Sheppard C, Theory and Practice of Scanning Optical Microscopy (Academic, 1984), Vol. 180. [Google Scholar]
- 23.Wilson T and Carlini A, “Size of the detector in confocal imaging systems,” Opt. Lett 12,227–229(1987). [DOI] [PubMed] [Google Scholar]
- 24.Born M and Wolf E, Principles of Optics: Electromagnetic Theory of Propagation, Interference and Diffraction of Light (Elsevier, 2013), Chap. 8.8. [Google Scholar]
- 25.“Supplemental Matlab Code,” 10.6084/m9.figshare.13182707. [DOI]
- 26.Liu J, Jung H, Dubra A, and Tam J, “Automated photoreceptor cell identification on nonconfocal adaptive optics images using multiscale circular voting,” Invest. Ophthalmol. Vis. Sci 58, 4477–4489 (2017). [DOI] [PMC free article] [PubMed] [Google Scholar]
- 27.Roorda A and Duncan JL, “Adaptive optics ophthalmoscopy,” Annu. Rev. Vis. Sci 1,19–50(2015). [DOI] [PMC free article] [PubMed] [Google Scholar]
- 28.Burns SA, Elsner AE, Sapoznik KA, Warner RL, and Gast TJ, “Adaptive optics imaging of the human retina,” Prog. Retinal Eye Res 68,1–30(2019). [DOI] [PMC free article] [PubMed] [Google Scholar]
- 29.Wang X, Gu B, Lu J, Curcio CA, and Zhang Y, “Confocal adaptive optics differential phase contrast (AODPC) ophthalmoscopy,” Invest. Ophthalmol. Vis. Sci 57, 60 (2016). [Google Scholar]
- 30.Sredar N, Razeen M, Kowalski B, Carroll J, and Dubra A, “Comparison of confocal and non-confocal split-detection cone photoreceptor imaging,” Biomed. Opt. Express 12, 737–755 (2021). [DOI] [PMC free article] [PubMed] [Google Scholar]
- 31.Tam J, Martin JA, and Roorda A, “Noninvasive visualization and analysis of parafoveal capillaries in humans,” Invest. Ophthalmol. Vis. Sci 51,1691 (2010). [DOI] [PMC free article] [PubMed] [Google Scholar]
- 32.Lorenser D, Singe CC, Curatolo A, and Sampson DD, “Energy-efficient low-Fresnel-number Bessel beams and their application in optical coherence tomography,” Opt. Lett 39, 548–551 (2014). [DOI] [PubMed] [Google Scholar]
- 33.Lu R, Sun W, Liang Y, Kerlin A, Bierfeld J, Seelig JD, Wilson DE, Scholl B, Mohar B, Tanimoto M, Koyama M, Fitzpatrick D, Orger MB, and Ji N, “Video-rate volumetric functional imaging of the brain at synaptic resolution,” Nat. Neurosci 20,620–628 (2017). [DOI] [PMC free article] [PubMed] [Google Scholar]
- 34.Rodriguez C, Liang Y, Lu R, and Ji N, “Three-photon fluorescence microscopy with an axially elongated Bessel focus,” Opt. Lett 43, 1914–1917(2018). [DOI] [PMC free article] [PubMed] [Google Scholar]
- 35.Planchon TA, Gao L, Milkie DE, Davidson MW, Galbraith JA, Galbraith CG, and Betzig E, “Rapid three-dimensional isotropic imaging of living cells using Bessel beam plane illumination,” Nat. Methods 8, 417–423(2011). [DOI] [PMC free article] [PubMed] [Google Scholar]
- 36.Shi J, Wang L, Noordam C, and Wang LV, “Bessel beam Grueneisen photoacoustic microscopy with extended depth of field,” Proc. SPIE 9708, 97083H (2016). [DOI] [PMC free article] [PubMed] [Google Scholar]
- 37.Lu R, Liang Y, Meng G, Zhou P, Svoboda K, Paninski L, and Ji N, “Rapid mesoscale volumetric imaging of neural activity with synaptic resolution,” Nat. Methods 17,291–294 (2020). [DOI] [PMC free article] [PubMed] [Google Scholar]
- 38.Müller CB and Enderlein J, “Image scanning microscopy,” Phys. Rev. Lett 104, 198101 (2010). [DOI] [PubMed] [Google Scholar]
- 39.Dubose TB, Larocca F, Farsiu S, and Izatt JA, “Super-resolution retinal imaging using optically reassigned scanning laser ophthalmoscopy,” Nat. Photonics 13, 257–262 (2019). [DOI] [PMC free article] [PubMed] [Google Scholar]
- 40.Roorda A and Williams DR, “Optical fiber properties of individual human cones,” J. Vis 2, 404–412 (2002). [DOI] [PubMed] [Google Scholar]
- 41.Meadway A and Sincich LC, “Light propagation and capture in cone photoreceptors,” Biomed. Opt. Express 9,5543–5565 (2018). [DOI] [PMC free article] [PubMed] [Google Scholar]
- 42.Meadway A and Sincich LC, “Light reflectivity and interference in cone photoreceptors,” Biomed. Opt. Express 10,6531–6554 (2019). [DOI] [PMC free article] [PubMed] [Google Scholar]
- 43.Sulai YN and Dubra A, “Non-common path aberration correction in an adaptive optics scanning ophthalmoscope,” Biomed. Opt. Express 5, 3059–3073(2014). [DOI] [PMC free article] [PubMed] [Google Scholar]
- 44.Akondi V, Kowalski B, Burns SA, and Dubra A, “Dynamic distortion in resonant galvanometric optical scanners,” Optica 7,1506–1513 (2020). [DOI] [PMC free article] [PubMed] [Google Scholar]
- 45.Chui TY, VanNasdale DA, and Burns SA, “The use of forward scatter to improve retinal vascular imaging with an adaptive optics scanning laser ophthalmoscope,” Biomed. Opt. Express 3,2537–2549 (2012). [DOI] [PMC free article] [PubMed] [Google Scholar]
- 46.Guevara-Torres A, Williams D, and Schallek J, “Imaging translucent cell bodies in the living mouse retina without contrast agents,” Biomed. Opt. Express 6,2106–2119(2015). [DOI] [PMC free article] [PubMed] [Google Scholar]
- 47.Rossi EA, Granger CE, Sharma R, Yang Q, Saito K, Schwarz C, Walters S, Nozato K, Zhang J, and Kawakami T, “Imaging individual neurons in the retinal ganglion cell layer of the living eye,” Proc. Natl. Acad. Sci. USA 114, 586–591 (2017). [DOI] [PMC free article] [PubMed] [Google Scholar]
- 48.Pinhas A, Dubow M, Shah N, Chui TY, Scoles D, Sulai YN, Weitz R, Walsh JB, Carroll J, and Dubra A, “In vivo imaging of human retinal microvasculature using adaptive optics scanning light ophthalmoscope fluorescein angiography,” Biomed. Opt. Express 4,1305–1317(2013). [DOI] [PMC free article] [PubMed] [Google Scholar]
- 49.Liu T, Jung H, Liu J, Droettboom M, and Tam J, “Noninvasive near infrared autofluorescence imaging of retinal pigment epithelial cells in the human retina using adaptive optics,” Biomed. Opt. Express 8, 4348–4360(2017). [DOI] [PMC free article] [PubMed] [Google Scholar]
- 50.Morgan JI, Dubra A, Wolfe R, Merigan WH, and Williams DR, “In vivo autofluorescence imaging of the human and macaque retinal pigment epithelial cell mosaic,” Invest. Ophthalmol. Vis. Sci 50,1350–1359 (2009). [DOI] [PMC free article] [PubMed] [Google Scholar]
- 51.Tam J and Merino D, “Stochastic optical reconstruction microscopy (STORM) in comparison with stimulated emission depletion (STED) and other imaging methods,” J. Neurochem 135,643–658(2015). [DOI] [PubMed] [Google Scholar]
- 52.Hell SW and Wichmann J, “Breaking the diffraction resolution limit by stimulated emission: stimulated-emission-depletion fluorescence microscopy,” Opt. Lett 19, 780–782 (1994). [DOI] [PubMed] [Google Scholar]
- 53.Betzig E, Patterson GH, Sougrat R, Lindwasser OW, Olenych S, Bonifacino JS, Davidson MW, Lippincott-Schwartz J, and Hess HF, “Imaging intracellular fluorescent proteins at nanometer resolution,” Science 313, 1642–1645(2006). [DOI] [PubMed] [Google Scholar]
- 54.Rust MJ, Bates M, and Zhuang X, “Sub-diffraction-limit imaging by stochastic optical reconstruction microscopy (STORM),” Nat. Methods 3, 793 (2006). [DOI] [PMC free article] [PubMed] [Google Scholar]
- 55.Hess ST, Girirajan TP, and Mason MD, “Ultra-high resolution imaging by fluorescence photoactivation localization microscopy,” Biophys. J 91,4258–4272(2006). [DOI] [PMC free article] [PubMed] [Google Scholar]
Associated Data
This section collects any data citations, data availability statements, or supplementary materials included in this article.