

Abstract
169Yb has been recently used as an HDR brachytherapy source for cancer treatment. In this paper, dosimetric parameters of a new design of 169Yb HDR brachytherapy source were determined by Monte Carlo (MC) method and film dosimetry. In this new source, the radioactive core has been encapsulated twice for safety purposes. The calculations of dosimetric parameters carried out using MC simulation in water and air phantom. In order to exclude photon contamination's cutoff energy, δ was set at 10 keV. TG‐43U1 data dosimetric, including Sk, Λ, g(r), F(r, θ) was computed using outputs from the simulation and their statistical uncertainties were calculated. Dose distribution around the new prototype source in PMMA phantom in the framework of AAPM TG‐43 and TG‐55 recommendations was measured by Radiochromic film (RCF) Gafchromic EBT3. Obtained air kerma strength, Sk, and the dose rate constant, Λ, from simulation has a value of 1.03U ± 0.03 and 1.21 cGyh−1U−1 ± 0.03, respectively. The radial dose function was calculated at radial distances between 0.5 and 10 cm with a maximum value of 1.15 ± 0.03 at 5–6 cm distances. The anisotropy functions for radial distances of 0.5–7 cm and angle distances 0° to180° were calculated. The dosimetric data of the new HDR 169Yb source were compared with another reference source of 169Yb‐HDR and were found that has acceptable compatibility. In addition, the anisotropy function of the MC simulation and film dosimetry method at a distance of 1 cm from this source was obtained and a good agreement was found between the anisotropy results.
Keywords: 169Yb HDR source, brachytherapy, dosimetric parameters, film dosimetry, Monte Carlo
1. INTRODUCTION
A 169Yb brachytherapy source with a half‐life of 32 days is used in both permanent and temporary implant method and recently has taken into consideration in radiation therapy because 169Yb is an intermediate energy photon emitter (main photon emissions in the range of 50–300 keV, emission probability weighted mean energy of 93 keV).1, 2, 3 Because of its attractive properties including high specific activity and easy radiation protection, this source is emerging as an alternative source in high dose rate (HDR) temporary implant. The very high specific activity leading to the fabrication of the very small 169Yb source,4, 5, 6 by the way, it is easier radiation protection than the other sources such as 137Cs and 192Ir may develop and apply movable shielding instead of permanent room shielding.7, 8, 9, 10 In addition, a shielded applicator then could be designed to modulate the dose distribution of the source to the specific requirements of a patient thereby introducing conformal brachytherapy treatment planning. Gold may be an excellent medium for a ytterbium‐169 conformal applicator since relative to ytterbium‐169; it has an average half‐value thickness of 0.2 mm and an average 10th value thickness of 1 mm.9 Investigations have presented that low energy of this source not only affords to increase the protection of healthy organs due to unnecessary radiation, reduce staff radiation exposure, and costs of shielding but also let a uniform dose distribution in a clinical target. As before mentioned, the 169Yb source is a suitable alternative for another HDR brachytherapy source10, 11; therefore, 169Yb HDR brachytherapy source has designed in source models such as 4140, M42, and X1267 in which model 4140 is the only commercial model.9, 11, 12
A number of studies have already been performed on different models of the 169Yb such as the determination of dosimetry parameters of 169Yb with Monte Carlo (MC) technique; model 4140 HDR by Medich et al,9 Monte Carlo characterization of a 169Yb, model M42 by Cazeca et al,11 and Anjomrouz et al.13 and determination of dosimetric characterization of model X1267 experimentally by Molavi et al,12 Because of these attractive properties, the authors decided to design and manufacture of a prototype of the 169Yb‐HDR source. The material of capsule and technique for manufacturing this sample was similar to the 192Ir‐HDR source reported by Ayoobian et al.14 TG‐43U1 (AAPM) recommends that the dose rate distribution data should be obtained for each new brachytherapy source prior to the clinical use of a proper method, experimental measurement, or/and by Monte Carlo to be used as input in the HDR treatment planning system.14, 15, 16, 17
The purpose of this study was to characterize the dosimetry parameters of the prototype of the 169Yb‐HDR source using MCNP Monte Carlo code and film dosimetry. In this new design, 169Yb as a ceramic core has been encapsulated twice for safety purposes. The TG‐43 dosimetry parameters of this source such as dose‐rate constant, air kerma strength, radial dose function, and anisotropy functions are determinate and the results are compared with other published data for the 169Yb‐HDR sources.
2. MATERIALS AND METHODS
2.1. Brachytherapy source description
A prototype 169Yb‐ HDR source was designed and manufactured that Figure 1 illustrates the cross‐sectional view of the source. The active ytterbium core has been produced from the neutron activation by the 4.5 MW Tehran Research Reactors (TRR). Ytterbium oxide ceramic cylinder has been used for the construction of the internal core of the source. This core was encapsulated by titanium tube by laser welding and then was placed in the external stainless steel 316L tube that has its end hemisphere shape and the other side was connected to a stainless steel 304L cable with a diameter of 0.9 mm by laser welding. Table 1 describes the materials used in the structure of prototype 169Yb‐ HDR source and their elemental composition.
FIGURE 1.

A schematic of the 169Yb‐HDR source. All dimensions are in millimeters
TABLE 1.
The materials used in the structure of the prototype 169Yb‐ HDR source and their elemental composition
| Material | Density (g/cm3) | Zeff | Element | Composition by weight in % |
|---|---|---|---|---|
| Ytterbium | 6.200 | 77 | Yb | |
| Titanium | 4.540 | Ti | ||
| Tube SS 316L | 8.020 | 26 | ||
| Cr | 17.21043 | |||
| Fe | 69.77581 | |||
| Ni | 10.17542 | |||
| Cu | 0.36561 | |||
| Mo | 2.52361 | |||
| Cable SS 304L | 8.000 | 26 | ||
| Cr | 19.03956 | |||
| Fe | 71.82345 | |||
| Ni | 8.32419 | |||
| Cu | 0.22653 | |||
| Mo | 0.62862 | |||
| Tube SS 316L | 8.000 | 26 | ||
| Cr | 17.21043 | |||
| Fe | 69.77581 | |||
| Ni | 10.17542 | |||
| Cu | 0.36561 | |||
| Mo | 2.52361 | |||
| Water at 22 ºC | 0.998 | 7.42 | ||
| H | 0.111894 | |||
| O | 0.888106 | |||
| Air (40% Relative humidity) | 0.0012 | 8 | ||
| H | 0.0732 | |||
| C | 0.0123 | |||
| N | 75.0325 | |||
| O | 23.6077 | |||
| Ar | 1.2743 |
2.2. Dose calculation formalism
American Association of Physicists in Medicine (AAPM) recommends that before using each new source in treatment planning, dosimetry parameters of the brachytherapy source must be calculated according to TG43‐U1.16 The spatial dose rate distribution Ḋ(r, θ) around a sealed brachytherapy source can be determined using the following formula:
| (1) |
where Λ is the dose rate constant at a reference point of (1 cm, 90º), Sk is the air kerma strength of the source, G(r,θ) is the geometry function, g(r) is the line radial dose function, and F(r,θ) is the two‐dimensional anisotropy function. The above quantities are discussed in detail in the AAPM TG‐43 report.16, 17
Air kerma strength, Sk, is a parameter independent of distance with the unit of 1 U = cGy.cm2.h−1. According to Equation (2), the air kerma strength is calculated.16
| (2) |
The relative standard deviation in Sk is calculated from Equation (3).
| (3) |
where is the relative error from MC simulation associated with the air kerma rate and is a 2% uncertainty in the cross‐section database in MC code and is the relative uncertainty in the photon yield.11
The dose rate constant, Λ, with units of cGy.U−1 depends on the type of radionuclides and the source model and is defined according to Equation (4).
| (4) |
Λ is proportional to Ḋ(r, θ) and inversely proportional to Sk. Relative standard deviation in Λ is calculated using Equation (5).
| (5) |
where is the relative error from MC simulation in water phantom, for 1 cm and θ = 90o and is the relative error from MC simulation associated with the air‐ kerma rate.11
Geometry function accounts according to the analytical and mathematical equation that it has absolute value and expresses the variation of dose due disturbing of activity within source ignoring photon absorption and scattering in the source structure.16 For a line source of length L and subtended angle, β is defined according to protocol TG‐43 as below17:
| (6) |
For this source, the active source length, L, is 2.6 mm.
The radial dose function is representation fall off the dose rate along the transverse axis source due absorption and scattering of photons in the medium. For clinical purposes need to fit the fifth degree equation with 2% coefficient from a0 through a5 on radial dose function. Its uncertainty of these parameters is accounted with Equation (8) when .11
| (7) |
| (8) |
Anisotropy function and uncertainty accounts are determined by the following equations when .11
| (9) |
| (10) |
2.3. Monte Carlo calculations
During this investigation to calculate brachytherapy source, dosimetry parameters have been used in the MCNP5 code and to speed up the runtime used in parallel processing systems. The 169Yb photon energy spectrum used in this simulation consists of photons between 50 and 308 keV that have been achieved by excluding photons with intensities below 0.1% and X rays lower 10 keV is given in Table 2. This spectrum has an average energy of photons 93 keV with a total intensity of 332.2% and total uncertainty of 1.5%.9, 10 The photons with energies lower than 10 keV do not have an effect after passing two capsules.
TABLE 2.
169Yb energy spectrum and the related uncertainty
| Energy (keV) | Intensity (%) | Uncertainty (%) |
|---|---|---|
| 49.77 | 53.2 | 2.50 |
| 50.74 | 94.0 | 2.30 |
| 57.60 | 29.5 | 2.50 |
| 59.10 | 8.2 | 2.70 |
| 63.10 | 44.2 | 0.60 |
| 93.62 | 2.6 | 0.04 |
| 109.78 | 17.5 | 0.18 |
| 118.19 | 1.9 | 0.018 |
| 130.52 | 11.3 | 0.09 |
| 177.21 | 22.2 | 0.18 |
| 197.96 | 35.8 | 0.30 |
| 261.08 | 1.7 | 0.011 |
| 307.74 | 10.1 | 0.07 |
| Total | 332.2% | 1.5% |
To calculate dosimetric data Ḋ(r, θ), Λ, g(r) and F(r,θ), source with an active length of 2.6 mm was placed in the center of a 50 cm radius spherical water phantom to photon scattering conditions in the region of interest.17 These data have been achieved from the results of spherical mesh, Rtally (r,θ), is given in units of MeV g−1 photon−1 for the MCNP5 *F8 energy deposition tally. The spherical mesh is in the angular range 0º to 180º and radial range 0.5 cm to 10 cm in photon and electron transport modes (mode: p, e) for the consideration of primary photons and secondary electrons.
The dose rate, ˙D(r, θ), is computed from the Monte Carlo tally output, KMC (r, θ), in units of cGy.mCi−1.h−1 based on Equation (1):
| (11) |
where Iγ is 332.2% as ytterbium‐169 photon intensity in units of photons per disintegration. From this, D˙ (r,θ) may be converted into more conventional units through the relationship 1 MeV g−1 Bq−1 s−1 = 2.134 × 10³ cGy mCi−1 h−1.
The uncertainty of D˙ (r,θ) value also has been calculated from Equation (12).
| (12) |
were is the relative errors from MC simulation associated with the dose rate and is the relative uncertainty in the photon yield. It should be noted that in all uncertainty equations, was considered 2% in the cross‐section database in MC code.11
For the calculation of Sk , the output from the MC calculation, K MC (d, θ), is given in units of MeV g−1 photon−1 for the MCNP5 F6 energy deposition tally.11
2.4. Gafchromic EBT3 film dosimetry
The Gafchromic EBT3 (ISP Technologies Inc., Wayne, NJ) RCF was used to measure dose rates around the source according to the general recommendation outlined by AAPM TG‐55. The film is composed of three layers; the outer layers are made of clear polyester (125 μm) and the inner active layer (28 μm).18, 19
The aim is the verification and comparison of experimental dose rate with calculated dose rate by the Monte Carlo at reference distance (1 cm). As well as, the anisotropy function was obtained at distances of 0.5 and 1 cm from the source. The radiochromic films were exposed to the 6MeV photon beam from a linac accelerator (Elekta 6 MV Linac, Esfahan, Iran). A dose–response curve was obtained in doses ranging from 0.25 to 6 Gy.21 This dose range was selected to cover the dose range that was used.20 In this study, 10 pieces of EBT3 in 2 × 2 cm2 dimensions were exposed. The irradiation was performed with a 20 × 20 cm2 field size and a source‐to‐surface (SSD) distance of 100 cm. Also, to measure the dose around the source, a piece of film was placed in a solid water phantom (PMAA). According to AAPM TG‐55, the exposed films were stored in a dark location for 2 days before processing and analysis. Reading of films was performed by Microtek Scan Maker 9800XL (Microtek International Inc., Hsinchu, Taiwan) in transmission mode and RGB‐ positive mode with spatial resolution of 300 dpi. The scanned images were saved in tagged image file format (tiff) and were processed with Image J 1.46r (64 bit) software.
In order to measure the dose, at first net optical density (net OD) is calculated by the following equation:
| (13) |
where , , and corresponding to the averaged pixel value of defined ROI before irradiation, after irradiation, and zero light transmission, respectively. Then the obtained net OD is placed in Equation (14), the fitted function on the dose–response curve. In this equation, a, b, and n are fitting parameters and Dfit is in terms of Gy.18
| (14) |
Equation (15) corresponds to the total uncertainty of converting the film's response (net OD) into dose.18
| (15) |
3. RESULTS
3.1. Monte Carlo calculation
To calculate air kerma strength in the free air F6 tally was used in photon‐only transport mode and 9×10⁷ photon stories that its statistical error obtained about 0.2%. In order to increase the accuracy of the measurements, the mean air‐kerma strength was calculated in a range of 50 to 150 cm with a step of 10 cm. For this purpose, the source was placed at the center of vacuum sphere with 200 cm radius. Around each of these volumes, is a vacuum and inside them were filled with air at 40% humidity and standard temperature and pressure.16 In this study, the simulation geometry includes two major components: First, source geometry that Figure 1 shown a schematic diagram of the simulation geometry of the source and the second component is related to the tally volumes in the angular range 0° to 180° and radial range 0.5cm to 10 cm.
The tally for MCNP5 calculating of air‐kerma strength includes an intersection of concentric spherical shells with an inner radius of the r‐2.5 cm and outer radius of r+2.5 cm with two concentric cones with an angular aperture of 88°–92°. To calculate air kerma strength, the uncertainty is calculated from Equation (16).
| (16) |
where a and b are inner sphere radius and outer sphere radius, respectively. The highest uncertainty at a radius of 50 to 150 cm has obtained at around 0.04%.
Calculated radial dose function along with its uncertainty of the new Yb169‐HDR source at radial distances from 0.5 to 10 cm is presented in Table 3. As it is observed, the uncertainty of this parameter for r = 1 cm is zero and for other distances by definition of the uncertainty is 0.03. For treatment planning purpose, a fifth‐order polynomial was fitted to the data of gL (r):
| (17) |
TABLE 3.
The radial dose function, gL (r), for the 169Yb‐ HDR sources in this study and those reported in the literature
| r (cm) | gL (r) in this study | gL (r) in Model 41409 | gL (r) in Model M4211 | gL (r) in Model M4213 |
|---|---|---|---|---|
| 0.5 | 0.960 | 0.970 | 0.945 | 0.965 |
| 1.0 | 1.000 | 1.000 | 1.000 | 1.000 |
| 2.0 | 1.070 | 1.070 | 1.081 | 1.071 |
| 3.0 | 1.120 | 1.120 | 1.131 | 1.129 |
| 4.0 | 1.140 | 1.150 | 1.158 | 1.167 |
| 5.0 | 1.150 | 1.170 | 1.168 | 1.195 |
| 6.0 | 1.150 | 1.160 | 1.165 | 1.210 |
| 7.0 | 1.140 | 1.150 | 1.151 | 1.194 |
| 8.0 | 1.110 | 1.120 | 1.128 | 1.159 |
| 9.0 | 1.090 | 1.090 | 1.098 | 1.122 |
| 10.0 | 1.060 | 1.050 | 1.062 | 1.086 |
To comparing purposes, the available radial dose function related to the different 169Yb‐HDR sources are listed in Table 3. As well as, Figure 2 presents a graphical description of the values gL(r) along with its uncertainty and fitted polynomial.
FIGURE 2.

Calculated radial dose function for the new 169Yb‐HDR source at distances between 0.5 cm and 10cm and the fifth‐order polynomial function fit for gL(r)
Values for the resulting geometry function, GL (r, θ) are presented in Table 4. Graphical comparison of F(r,) between the new 169Yb‐HDR source and Model 4140HDR for distances from 1, 2, 3 cm, and 5cm is shown in Figure 3. According to Equations (9) and (10), values of anisotropy function and their uncertainty for radial distances from 1cm to 5cm and angle range between 0° and 180° at 10°increacment were calculated that are presented in Table 5.
TABLE 4.
The geometry factor, GL(r,θ), used to model the 169Yb‐ HDR source in this study
| θ (deg) | 0.5 | 1 | 2 | 3 | 5 | 6 | 7 | 8 | 9 | 10 |
|---|---|---|---|---|---|---|---|---|---|---|
| r(cm) | ||||||||||
| 0 | 4.2900 | 1.0170 | 0.1113 | 0.0625 | 0.0400 | 0.0278 | 0.0204 | 0.0156 | 0.0123 | 0.0100 |
| 10 | 4.2767 | 1.0165 | 0.1113 | 0.0626 | 0.0400 | 0.0278 | 0.0204 | 0.0156 | 0.0123 | 0.0100 |
| 20 | 4.2391 | 1.0144 | 0.1113 | 0.0626 | 0.0400 | 0.0278 | 0.0204 | 0.0156 | 0.0123 | 0.0100 |
| 30 | 4.1837 | 1.0113 | 0.1113 | 0.0625 | 0.0400 | 0.0278 | 0.0204 | 0.0156 | 0.0123 | 0.0100 |
| 40 | 4.1192 | 1.0076 | 0.1112 | 0.0625 | 0.0400 | 0.0278 | 0.0204 | 0.0156 | 0.0123 | 0.0100 |
| 50 | 4.0543 | 1.0036 | 0.1112 | 0.0625 | 0.0400 | 0.0278 | 0.0204 | 0.0156 | 0.0123 | 0.0100 |
| 60 | 3.9965 | 0.9999 | 0.1111 | 0.0625 | 0.0400 | 0.0278 | 0.0204 | 0.0156 | 0.0123 | 0.0100 |
| 70 | 3.9515 | 0.9970 | 0.1111 | 0.0625 | 0.0400 | 0.0278 | 0.0204 | 0.0156 | 0.0123 | 0.0100 |
| 80 | 3.9231 | 0.9951 | 0.1111 | 0.0625 | 0.0400 | 0.0278 | 0.0204 | 0.0156 | 0.0123 | 0.0100 |
| 90 | 3.9134 | 0.9944 | 0.1110 | 0.0625 | 0.0400 | 0.0278 | 0.0204 | 0.0156 | 0.0123 | 0.0100 |
FIGURE 3.
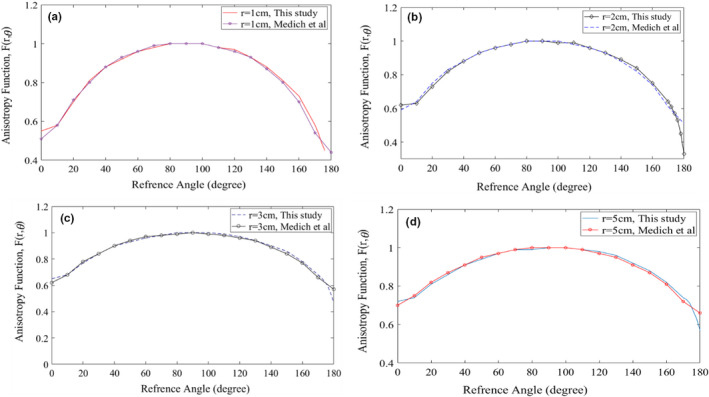
Graphical comparison of F(r,) between the new 169Yb‐HDR source and the Model 4140 of 169Yb‐HDR from Medich et al. (a), (b), (c), and (d) are related to comparison at the radial distances 1cm, 2cm, 3cm, and 5cm, respectively
TABLE 5.
The calculated anisotropy function, F(r,θ), and calculated uncertainties in these date for the 169Yb‐HDR source
| θ (deg) | r (cm) | |||||||
|---|---|---|---|---|---|---|---|---|
| 0.5 | 1.0 | 2.0 | 3.0 | 4.0 | 5.0 | 6.0 | 7.0 | |
| 0 | 0.55 ± 0.03 | 0.55 ± 0.03 | 0.62 ± 0.03 | 0.69 ± 0.03 | 0.65 ± 0.03 | 0.75 ± 0.03 | 0.73 ± 0.03 | 0.72 ± 0.03 |
| 10 | 0.55 ± 0.03 | 0.58 ± 0.03 | 0.63 ± 0.03 | 0.71 ± 0.03 | 0.68 ± 0.03 | 0.78 ± 0.03 | 0.76 ± 0.03 | 0.74 ± 0.03 |
| 20 | 0.68 ± 0.03 | 0.70 ± 0.03 | 0.73 ± 0.03 | 0.78 ± 0.03 | 0.77 ± 0.03 | 0.83 ± 0.03 | 0.82 ± 0.03 | 0.81 ± 0.03 |
| 30 | 0.79 ± 0.03 | 0.81 ± 0.03 | 0.82 ± 0.03 | 0.85 ± 0.03 | 0.84 ± 0.03 | 0.88 ± 0.03 | 0.87 ± 0.03 | 0.86 ± 0.03 |
| 40 | 0.87 ± 0.03 | 0.88 ± 0.03 | 0.88 ± 0.03 | 0.90 ± 0.03 | 0.90 ± 0.03 | 0.92 ± 0.03 | 0.92 ± 0.03 | 0.91 ± 0.03 |
| 50 | 0.93 ± 0.03 | 0.92 ± 0.03 | 0.93 ± 0.03 | 0.94 ± 0.03 | 0.93 ± 0.03 | 0.95 ± 0.03 | 0.95 ± 0.03 | 0.94 ± 0.03 |
| 60 | 0.96 ± 0.03 | 0.96 ± 0.03 | 0.96 ± 0.03 | 0.97 ± 0.03 | 0.96 ± 0.03 | 0.97 ± 0.03 | 0.97 ± 0.03 | 0.97 ± 0.03 |
| 70 | 0.98 ± 0.03 | 0.98 ± 0.03 | 0.98 ± 0.03 | 0.98 ± 0.03 | 0.98 ± 0.03 | 0.99 ± 0.03 | 0.99 ± 0.03 | 0.99 ± 0.03 |
| 80 | 1.00 ± 0.03 | 1.00 ± 0.03 | 1.00 ± 0.03 | 1.00 ± 0.03 | 1.00 ± 0.03 | 1.00 ± 0.03 | 1.00 ± 0.03 | 0.99 ± 0.03 |
| 90 | 1.00 | 1.00 | 1.00 | 1.00 | 1.00 | 1.00 | 1.00 | 1.00 |
| 100 | 0.99 ± 0.03 | 1.00 ± 0.03 | 0.99 ± 0.03 | 1.00 ± 0.03 | 1.00 ± 0.03 | 1.00 ± 0.03 | 1.00 ± 0.03 | 1.00 ± 0.03 |
| 110 | 0.97 ± 0.03 | 0.98 ± 0.03 | 0.99 ± 0.03 | 0.99 ± 0.03 | 0.99 ± 0.03 | 0.99 ± 0.03 | 0.99 ± 0.03 | 0.99 ± 0.03 |
| 120 | 0.95 ± 0.03 | 0.97 ± 0.03 | 0.96 ± 0.03 | 0.97 ± 0.03 | 0.97 ± 0.03 | 0.98 ± 0.03 | 0.98 ± 0.03 | 0.98 ± 0.03 |
| 130 | 0.92 ± 0.03 | 0.93 ± 0.03 | 0.93 ± 0.03 | 0.95 ± 0.03 | 0.94 ± 0.03 | 0.96 ± 0.03 | 0.96 ± 0.03 | 0.96 ± 0.03 |
| 140 | 0.86 ± 0.03 | 0.88 ± 0.03 | 0.89 ± 0.03 | 0.92 ± 0.03 | 0.90 ± 0.03 | 0.93 ± 0.03 | 0.93 ± 0.03 | 0.92 ± 0.03 |
| 150 | 0.79 ± 0.03 | 0.81 ± 0.03 | 0.84 ± 0.03 | 0.87 ± 0.03 | 0.86 ± 0.03 | 0.90 ± 0.03 | 0.89 ± 0.03 | 0.88 ± 0.03 |
| 160 | 0.69 ± 0.03 | 0.73 ± 0.03 | 0.75 ± 0.03 | 0.80 ± 0.03 | 0.78 ± 0.03 | 0.85 ± 0.03 | 0.84 ± 0.03 | 0.82 ± 0.03 |
| 170 | 0.54 ± 0.03 | 0.58 ± 0.03 | 0.64 ± 0.03 | 0.71 ± 0.03 | 0.68 ± 0.03 | 0.78 ± 0.03 | 0.77 ± 0.03 | 0.74 ± 0.03 |
| 172 | 0.51 ± 0.03 | 0.54 ± 0.03 | 0.61 ± 0.03 | 0.70 ± 0.03 | 0.66 ± 0.03 | 0.77 ± 0.03 | 0.75 ± 0.03 | 0.73 ± 0.03 |
| 174 | 0.40 ± 0.03 | 0.49 ± 0.03 | 0.55 ± 0.03 | 0.67 ± 0.03 | 0.63 ± 0.03 | 0.74 ± 0.0 | 0.73 ± 0.03 | 0.71 ± 0.03 |
| 176 | ‐ | 0.45 ± 0.03 | 0.53 ± 0.03 | 0.64 ± 0.03 | 0.60 ± 0.03 | 0.73 ± 0.03 | 0.70 ± 0.03 | 0.67 ± 0.03 |
| 178 | ‐ | ‐ | 0.45 ± 0.03 | 0.59 ± 0.03 | 0.54 ± 0.03 | 0.71 ± 0.03 | 0.66 ± 0.03 | 0.63 ± 0.03 |
| 180 | ‐ | ‐ | 0.33 ± 0.03 | 0.52 ± 0.03 | 0.47 ± 0.03 | 0.64 ± 0.03 | 0.62 ± 0.03 | 0.57 ± 0.03 |
3.2. Gafchromic EBT3 dosimetry
Figure 4 illustrates the calibration curve with uncertainty curve, which is plotted for EBT3 RCFs. The calibration data were fitted to a polynomial curve for EBT3. The net ODs of experimental films were converted to dose in Gy using the fitted polynomial. Figure 5 shows the scan images of the EBT3 exposed with the proto‐type 169Yb‐HDR source. It can be seen that the dose distribution of the HDR brachytherapy source has an elliptical shape. We were able to plot the distribution dose around the source using film dosimetry that is shown in Figure 6.
FIGURE 4.

The calibration curve of the EBT3 RCFs in a dose range up to 6 Gy using optical density change and uncertainty versus error analysis for calibration curve made with netOD. The fitted function is shown as a solid line
FIGURE 5.

Gafchromic EBT3 films, (a) view of EBT3 film on the prototype 169Yb‐HDR source inside the phantom before irradiation and (b) EBT3 film after irradiation exposure
FIGURE 6.
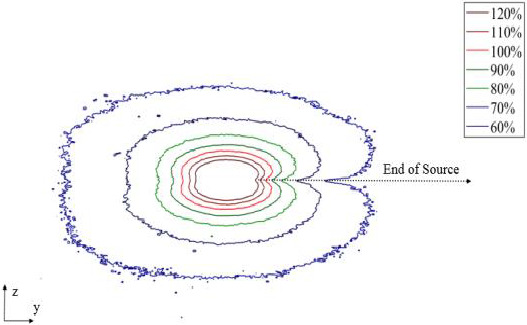
The isodose curves measured in soft tissue phantom for the new model of 169Yb HDR brachytherapy source
Figure 7 shows the PDD variation as a function of distance away from the central source axis. As expected, the dose rate contribution is decreased. Comparison between the anisotropy function of the Monte Carlo and film dosimetry methods at a distance of 1 cm for the new 169Yb‐HDR brachytherapy source is shown in Figure 8.
FIGURE 7.

Comparison of PDD for film dosimetry and MC methods and as a function of distance
FIGURE 8.

Comparison between the anisotropy function of the Monte Carlo and film dosimetry methods at a distance of 1 cm for the new 169Yb‐HDR brachytherapy source
4. DISCUSSION
The dosimetry parameters of the brachytherapy source are essential, as they account for the accurate determination of dose rate distribution around the brachytherapy source. Besides, they can be used as input data for the treatment planning systems used in HDR brachytherapy. The simulation of this source was carried out using MCNP5 and according to TG43‐U1 to determine dosimetric parameters of this source, including Sk, Λ, g(r) and F(r,). And them respective statistical uncertainty using the described method by Medich el al were calculated.9
The mean of air kerma strength and its uncertainty were calculated by Equations (2) and (3) to be 1.03 U 0.03. Moreover, the value of (1, 90) in water phantom was determined to be 1.25 0.03 cGymCi−1.h−1. Therefore, the dose rate constant by Equation (4) has a value of 1.21 cGyh−1 U−1 with an uncertainty of 0.03. The published value of air kerma strength and dose rate constant of the Model 4140HDR is 1.10 U 0.03 and 1.19 U 0.03 cGyh−1 U−1, respectively, and the comparison indicated that there is good agreement with about 1.5%. The dose rate constants of different available models related to 169Yb‐ HDR sources are listed in Table 6 and the results are in good agreement. The insignificant difference between the four studies is due to the type of capsulation, size, and structure of the sources.
TABLE 6.
The calculated dose rate constant values in this study and those reported in the literature, dimensions are in (mm)
| Source model | Active length | Total length | Active diameter | External diameter | Capsule thickness (material) | Λ (cGy h−1 U−1) |
|---|---|---|---|---|---|---|
| Model 41409 | 3.5 | 4.80 | 0.073 | 0.90 | 0.17 (SS) | 1.19 ± 0.03 |
| Model M4211 | 6.0 | 4.90 | 0.070 | 1.15 | 0.20 (SS) | 1.12 ± 0.04 |
| Model M4213 | 6.0 | 4.60 | 0.070 | 1.15 | 0.20 (SS) | 1.14 ± 0.04 |
| A new model (this work) | 2.6 | 4.73 | 0.060 | 0.90 | 0.15 (SS) & 0.06 (Ti) | 1.21 ± 0.03 |
In order to provide validation for the new source, the obtained dosimetric data of Monte Carlo were compared with dosimetric data for those reported in the literature.9, 11, 13 For the radial dose function, the maximum difference between the MC results of this research and Medich et al study is observed 1.7% at the radial distance of 5 cm (Table 3). Also, the maximum difference between this model and Model M42 HDR source in Cazeca et al and Anjomrouz et al are observed 1.6% at r = 8 cm and 5% at r = 5 cm, respectively.
The values of MCNP5 calculated anisotropy function and calculated uncertainty in data related to 169Yb‐HDR source used in this study are shown in Table 5 and the results indicated that the uncertainty is 3%. The result of the comparison showed that there is acceptable compatibility with the Model 4140 and negligible differences between these parameters are due to the design of the source's active element and source's designed capsule. The difference between the results of this study and the reference data is below 4%, which is due to the physical differences in the construction of the source models. Also, graphical comparison of F(r,θ) at the radial distance 1cm between the new 169Yb‐HDR source used in his study and other published data for the 169Yb‐HDR sources is shown in Figure 9. The insignificant difference between the four studies is in the angular of 0º and in the angular range of 160º–180º due to the type of the capsulation.
FIGURE 9.

Graphical comparison of F(r,) at the radial distance 1cm between the new 169Yb‐HDR source (this study) and other published data for the 169Yb‐HDR sources
The detailed step‐by‐step analysis of the uncertainties of the measured doses is reported by Chiu‐Tsao et al.22 Uncertainties reported in TG‐43U1 are both random, statistical (type A), and nonrandom, systematic (type B). The overall uncertainties in dose conversion were estimated, using a simple quadrature sum of individual components, to be 4.1% for EBT RCF.14 Several factors, including error in exposure and lack of uniform exposure to the film calibration as well as the probability of film scratches during the experiment cause errors in measurement. The uncertainty analysis of the percent dose depth (PPD) indicated that the maximum difference between the MC results and EBT3 measurements is 6% at the radial distance of 0.5 cm (Figure 7). The anisotropy function was obtained from the Monte Carlo and film dosimetry methods at a distance of 1 cm from this source. Good agreement was found between the two sets of anisotropy results.
5. CONCLUSIONS
In this study, we introduced a new model of 169Yb‐HDR brachytherapy source with a ceramic radioactive core that has been encapsulated twice for safety purposes. Since a prototype of this source has been manufactured by our department, the dose distribution around the source was obtained with the film dosimetry system which was accompanied by good uniformity. The PDD and anisotropy function were obtained from the Monte Carlo and film dosimetry methods and the results indicated that there is good agreement between the two sets of results and is comparable to the data of the commercial brachytherapy source. Therefore, the double‐capsule design for this seed source is acceptable in terms of dosimetric parameters.
6. ACNOWLEDGMENTS
I need to mention the efforts of our dear coleague, the late Mr. Mohammad Reza Javanshir, who helped us, build the HDR source.
Safaeipour E, Poorbaygi H, Jabbari I, Sheibani S. Evaluation of dosimetric functions for a new 169Yb HDR Brachytherapy Source. J Appl Clin Med Phys. 2021;22:82–93. 10.1002/acm2.13347
REFERENCES
- 1.Lazarescu GR, Battista JJ. Analysis of the radiobiology of ytterbium‐169 and iodine‐125 permanent brachytherapy implants. Phys Med Biol. 1997;42(9):1727‐1736. [DOI] [PubMed] [Google Scholar]
- 2.Granero D, Pérez‐Calatayud J, Ballester F, et al. Broad‐beam transmission data for new brachytherapy sources, Tm‐170 and Yb‐169. Radiat Prot Dosimetry. 2006;118(1):11‐15. [DOI] [PubMed] [Google Scholar]
- 3.Lymperopoulou G, Papagiannis P, Angelopoulos A, et al. A dosimetric comparison of Yb‐169 and Ir‐192 for HDR brachytherapy of the breast, accounting for the effect of finite patient dimensions and tissue inhomogeneities. Med Phys. 2006;33(12):4583‐4589. [DOI] [PubMed] [Google Scholar]
- 4.Perera H, Williamson JF, Li Z, et al. Dosimetric characteristics, air kerma strength calibration and verification of Monte Carlo simulation for a new ytterbium‐169 brachytherapy source. Int J Radiat Oncol Biol Phys. 1994;28(4):953‐970. [DOI] [PubMed] [Google Scholar]
- 5.Flynn RT, Adams QE, Hopfensperger KM, et al. Efficient 169Yb high‐dose‐rate brachytherapy source production using re‐activation. Med Phys. 2019;46(7):2935‐2943. [DOI] [PMC free article] [PubMed] [Google Scholar]
- 6.Piermattei A, Azario L, Rossi G, et al. Dosimetry of 169Yb seed model X1267. Phys Med Biol. 1995;40(8):1317‐1330. [DOI] [PubMed] [Google Scholar]
- 7.Lymperopoulou G, Papagiannis P, Sakelliou L. A dosimetric comparison of 169Yb versus 192Ir for HDR prostate brachytherapy. Med Phys. 2005;32(12):3832‐3842. [DOI] [PubMed] [Google Scholar]
- 8.Mason DLD, Battista JJ, Barnett RB, et al. Ytterbium‐169: Calculated physical properties of a new radiation source for brachytherapy. Med Phys. 1992;19(3):695‐703. [DOI] [PubMed] [Google Scholar]
- 9.Medich DC, Tries MA, Munro JJ III. Monte Carlo characterization of an ytterbium‐169 high dose rate brachytherapy source with analysis of statistical uncertainty. Med Phys. 2006;33(1):163‐172. [DOI] [PubMed] [Google Scholar]
- 10.Papagiannis P, Baltas D, Granero D, et al. Radiation transmission data for radionuclides and materials relevant to brachytherapy facility shielding. Med Phys. 2008;5(11):4898‐4906. [DOI] [PubMed] [Google Scholar]
- 11.Cazeca MJ, Medich DC, Munro JJ III. Monte Carlo characterization of a new Yb‐169 high dose rate source for brachytherapy application. Med Phys. 2010;37(3):1129‐1136. [DOI] [PubMed] [Google Scholar]
- 12.Mowlavi AA, Yazdani M. Dosimetry parameters determination of 169Yb brachytherapy source model X1267. Appl Phys Res. 2010;2(1):118‐124. [Google Scholar]
- 13.Anjomrouz M, Sadeghi H, Haddadi A. Monte Carlo characterization of 169Yb as a high‐dose rate source for brachytherapy application by FLUKA code. Appl Clinl Med Phys. 2013;14(4):196‐205. [DOI] [PMC free article] [PubMed] [Google Scholar]
- 14.Ayoobian N, Sarabi Asl A, Poorbaygi H, Javanshir MR. Gafchromic film dosimetry of a new HDR 192Ir brachytherapy source. Appl Clinl Med Phys. 2016;17(2):194‐205. [DOI] [PMC free article] [PubMed] [Google Scholar]
- 15.Perez‐Calatayud J, Ballester F, Das RK, et al. Dose calculation for photon‐emitting brachytherapy sources with average energy higher than 50 keV: report of the AAPM and ESTRO. Med Phys. 2012;39(5):2904‐2929. [DOI] [PubMed] [Google Scholar]
- 16.Rivard MJ, Coursey BM, DeWerd LA, et al. Update of AAPM Task Group No. 43 Report: a revised AAPM protocol for brachytherapy dose calculations. Med Phys. 2004;31(3):633‐674. [DOI] [PubMed] [Google Scholar]
- 17.Nath R, Anderson LL, Luxton G, et al. Dosimetry of interstitial brachytherapy sources: Recommendations of the AAPM Radiation Therapy Committee Task Group No. 43. Med Phys. 1995;22(2):209‐234 [DOI] [PubMed] [Google Scholar]
- 18.Devic S, Tomic N, Lewis D. Reference radiochromic film dosimetry: Review of technical aspects. Phys Med. 2016;32(4):541‐556. [DOI] [PubMed] [Google Scholar]
- 19.Niroomand‐Rad A, Blackwell CR, Coursey BM, et al. Radiochromic film dosimetry: recommendations of AAPM Radiation Therapy Committee Task Group 55. Med Phys. 1998;25(11):2093‐2115 [DOI] [PubMed] [Google Scholar]
- 20.Palmer AL, Nisbet A, Bradley D. Verification of high dose rate brachytherapy dose distributions with EBT3 Gafchromic film quality control techniques. Phys Med Biol. 2013;58:497‐511. [DOI] [PubMed] [Google Scholar]
- 21.Massillon‐JL G, Chiu‐Tsao S‐T, Domingo‐Munoz I, Chan MF. Energy dependence of the new Gafchromic EBT3 film: Dose response curves for 50 kV, 6 and 15 MV X‐ray beams. Int J Med Phys Clin Eng Radiat Oncol. 2012;1(2):60‐65. 10.4236/ijmpcero.2012.12008 [DOI] [PubMed] [Google Scholar]
- 22.Chiu‐Tsao ST, Medich D, Munro J 3rd. The use of new GAFCHROMIC EBT film for 125I seed dosimetry in Solid Water phantom. Med Phys. 2008;35(8):3787‐3799. [DOI] [PubMed] [Google Scholar]