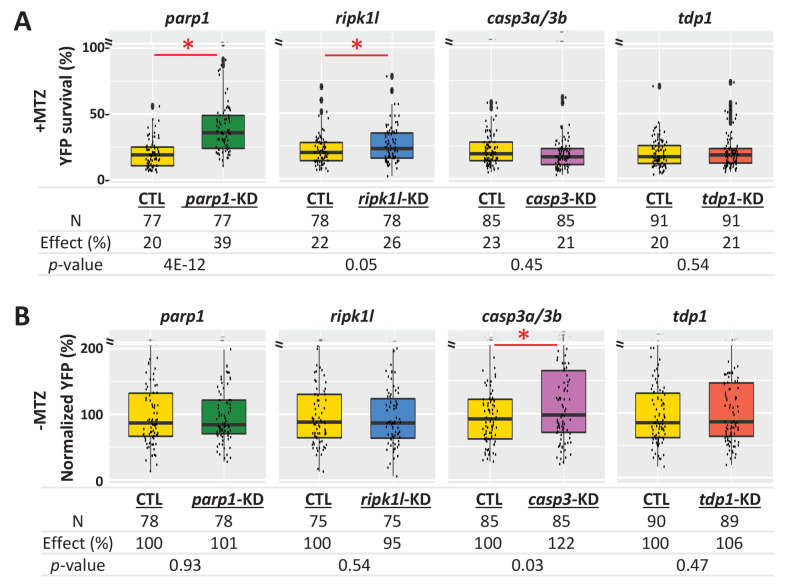
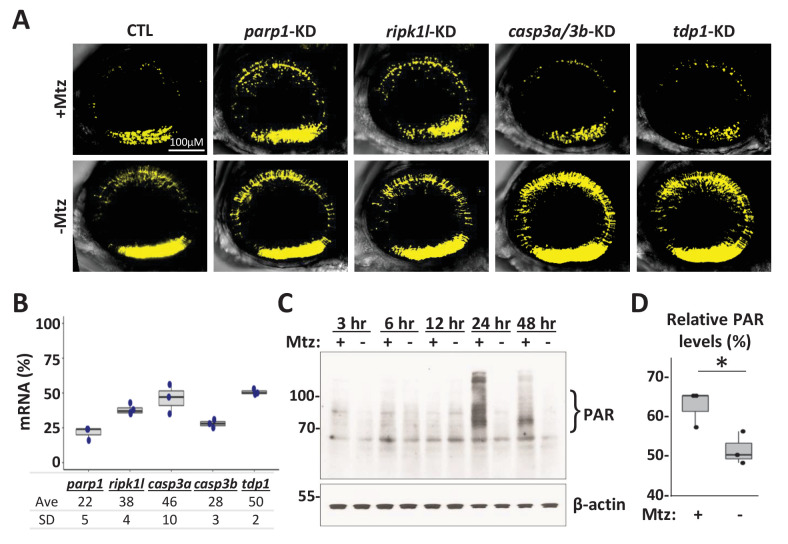
Figure 8. Genetic knockdown analysis of NTR-mediated rod cell death pathways in zebrafish.
(A) Box plots of rod cell survival effects of CRISPR/Cas9-based knockdown of key cell death pathway genes: parp1 (parthanatos), ripk1l (necroptosis), casp3a and casp3b (apoptosis), as well as tdp1 (as a DNA repair pathway control) in Mtz-treated rho:YFP-NTR zebrafish larvae. Cas9 protein and four gRNAs (for parp1, ripk1l and tdp1) or eight gRNAs (for casp3a with casp3b) were co-injected at the one-cell stage. Larvae were raised to 5 dpf and treated with Mtz (2.5 mM) to induce rod cell death. Rod cell survival was quantified at 6 dpf by fluorescence microplate reader assay. Conditions resulting in a statistically significant increase in survival effects relative to non-injected controls are marked with an asterisk. Sample sizes (N), survival effects (YFP % relative to non-ablated control) and p-values are provided in the table below. A minimum of three experimental repeats was performed and data pooled across replicates (Figure 8—source data 1). (B) Box plots of effects on rod cell development in non-ablated rho:YFP-NTR zebrafish larvae (-Mtz) following knockdown of the same genes as in (A). Rod cell numbers were estimated at 6 dpf by microplate reader-based quantification of YFP. Only casp3a/3b knockdown resulted in a statistically significant increase (22%) in rod cell numbers during development. Sample sizes (N), normalized survival effects (% relative to non-injected control) and p-values are provided in the table below. A minimum of three experimental repeats was performed and data pooled across replicates. Abbreviations: parp1, poly (ADP-ribose) polymerase 1; ripk1l, receptor (TNFRSF)-interacting serine-threonine kinase 1, like; casp3a: caspase 3, apoptosis-related cysteine peptidase a; casp3b: caspase 3, apoptosis-related cysteine peptidase b; tdp1, tyrosyl-DNA phosphodiesterase 1; CTL, control; KD, knockdown; PAR, Poly (ADP-ribose).


