Figure 6.

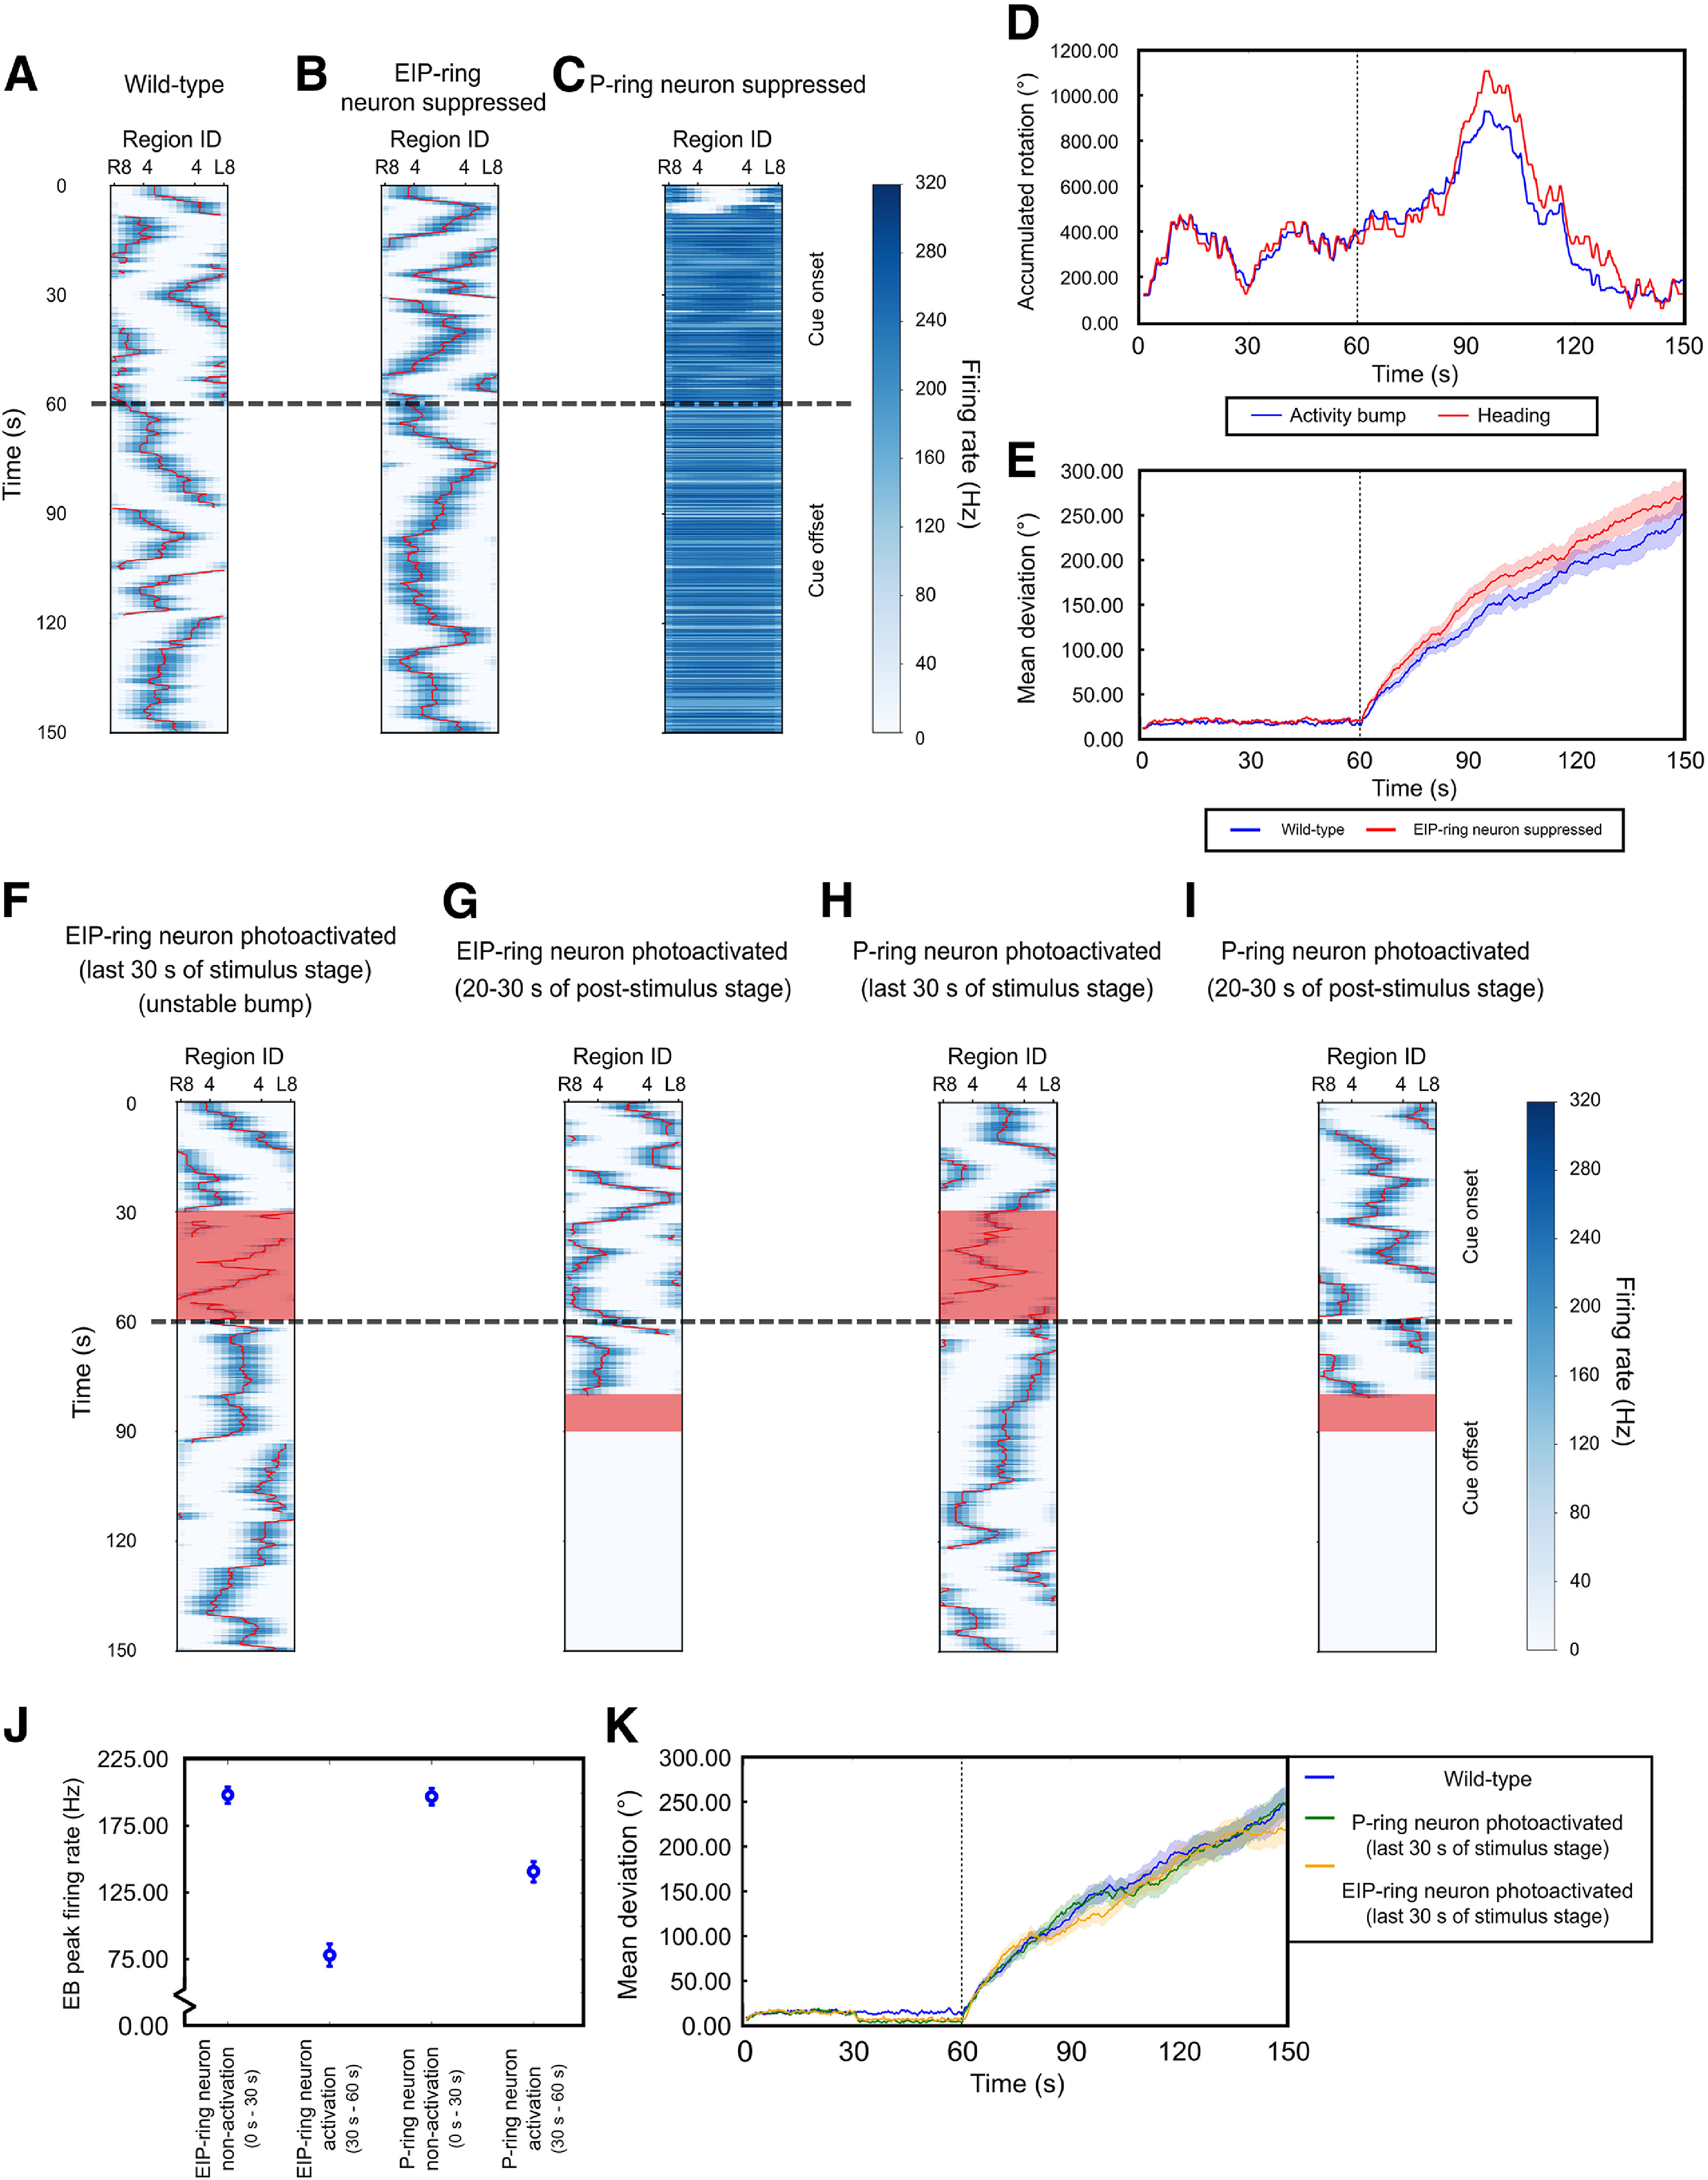
The computer simulations of the EB-PB model (Su et al., 2017) demonstrated the neural mechanisms illustrated in Figure 5, and highlighted the roles of the EIP-ring and P-ring neurons in the spatial orientation working memory. A, The neural activity of EIP neurons in all EB regions as a function of time indicates the existence of activity bump (dark blue) in a simulated wild-type fly. The landmark was on between t = 0 s and t = 60 s (dashed line). B, C, Same as in A, but with simulated EIP-ring (B) and P-ring neurons (C) suppression. The P-ring neuron suppression led to unstable and widespread neural activity. D, The accumulated angles of the true heading and the activity bump of in one example trial for a simulated wild-type fly. E, The trial-averaged angular deviation between the head direction and the bump for simulated wild-type flies (blue) and simulated flies with suppressed EIP-ring neurons (red). Shades represent the SEM. F, G, Same as in A, but with simulated photoactivation (red regions) of the EIP-ring neurons. After the photoactivation in the last 30 s of the stimulus stage (F), the activity bump persisted in all trials. The photoactivation in the poststimulus stage abolished the activity bump (G). H, I, Same as in F, G, but with the photoactivation of the P-ring neurons in the last 30 s of the stimulus stage (H) or during the poststimulus stage (I). J, EB peak firing rate with no-photoactivation and photoactivation of EIP-ring or P-ring neurons in the stimulus stage. K, The trial-averaged angular deviation between the heading and the bump for simulated wild-type flies (blue), P-ring neuron photoactivation (green), and EIP-ring photoactivation (red). Shades represent the SEM. The behavior model used to drive the EP-PB circuit model is shown in Extended Data Figure 6-1.
