Abstract
Purpose
The purpose of the study was to demonstrate the performance and possible applications of an intravital microscopy assay using a standard fluorescence microscope.
Methods
Melanoma and pancreatic ductal adenocarcinoma xenografts were initiated in dorsal window chambers and subjected to repeated intravital microscopy. The entire tumor vasculature as well as the normal tissue surrounding the tumor was imaged simultaneously with high spatial and temporal resolution. Vascular morphology images were recorded by using transillumination, and vascular masks were produced to quantify vessel density, vessel diameter, vessel segment length, and vessel tortuosity. First-pass imaging movies were recorded after an intervenous injection of a fluorescent marker and were used to investigate vascular function. Lymphatics were visualized by intradermal injections of a fluorescent marker.
Results
The intravital microscopy assay was used to study tumor growth and vascularization, tumor vessel morphology and function, tumor-associated lymphatics, and vascular effects of acute cyclic hypoxia and antiangiogenic treatment. The assay was sensitive to tumor-line differences in vascular morphology and function and detected tumor-induced lymphatic dilation. Acute cyclic hypoxia induced angiogenesis and increased the density of small diameter vessels and blood supply times, whereas antiangiogenic treatment selectively removed small-diameter vessels, reduced blood supply times, and induced hypoxia. Moreover, the window chamber was compatible with magnetic resonance imaging (MRI), and parametric images derived by dynamic contrast-enhanced MRI were shown to reflect vascular morphology and function.
Conclusions
The presented assay represents a useful and affordable alternative to intravital microscopy assays using confocal and multi-photon microscopes.
Supplementary Information
The online version contains supplementary material available at 10.1007/s00259-021-05243-0.
Keywords: Intravital microscopy, Window chamber, Vascular morphology, Vascular function, Tumor-associated lymphatics, Hypoxia
Introduction
The vasculature in normal tissues is strictly organized to secure sufficient supply of oxygen and nutrients and effective removal of waste products. In contrast, the vasculature in malignant tissue is highly abnormal and appears strikingly disorganized [1]. Individual tumor vessels are elongated and tortuous, and may show aberrant vessel diameters and vessel wall abnormalities (i.e. discontinuous endothelial lining, and lack of basement membrane and pericyte coverage) [2, 3]. Moreover, the vascular networks in most tumors display limited arterial supply, loss of vessel hierarchy, and highly heterogeneous vessel density [2–4]. These morphological abnormalities collectively increase the geometric resistance to blood flow, and, consequently, many tumors show unstable blood flow and low and heterogeneous blood supply [5–7]. The abnormal tumor vasculature plays a key role in the development of the hostile tumor microenvironment which is characterized by hypoxia, elevated interstitial fluid pressure, and extracelluar acidose [3, 8]. This hostile microenvironment has been shown to cause resistance to several treatment modalities, and has been demonstrated to induce malignant progression, invasive growth, and metastatic spread [8, 9].
Detailed studies of tumor vasculature have been performed by the use of window chamber preparations and intravital microscopy techniques [10–13]. These methods are particularly attractive because they allow high-resolution imaging of vascular morphology and function, and because the imaging can be repeated during growth and during treatments. In most studies, advanced microscopes such as confocal and multi-photon microscopes have been used [10, 11]. These imaging platforms provide excellent images, but the image acquisition and analysis are technically cumbersome and the microscopes are expensive and only available in specialized laboratories. Our laboratory has developed a dorsal window chamber compatible with magnetic resonance imaging (MRI), and an intravital microscopy assay for studying tumors growing in dorsal window chambers as well as the normal tissue surrounding the tumors. Importantly, this assay can be performed with a standard fluorescence microscope available in most laboratories. In the current communication, we present the intravital microscopy assay and describe experiments where we have used the assay to study tumor growth, vascularization, vessel morphology and function, lymphatics, and vascular effects of acute cyclic hypoxia and antiangiogenic treatment. Finally, we report an MRI-experiment demonstrating the potential of the MR-compatible window chamber for dynamic contrast-enhanced MRI (DCE-MRI).
Methods
Window chamber preparation
A technical drawing of our in-house-made window chamber, a schematic illustration of a tumor growing in the window chamber, and a photograph of the window chamber implanted in the dorsal skin of a BALB/c nu/nu mouse are shown in Fig. 1. The surgical implantation procedure has been described in detail previously and was performed on anesthetized mice [14]. Briefly the window chamber consisted of parallel frames that sandwiched an extended double layer of skin. Before the chamber was implanted, a circular hole was made in one of the skin layers. A plastic window was attached to the frame on the surgical side and provided visual access to the fascial side of the opposite skin layer. Tumors were initiated by implanting multicellular spheroids or solid tumor pieces with a diameter of 100 to 400 μm onto the fascial side of the intact skin layer, and grew as hemispheres surrounded by the plastic window and normal skin (Fig. 1b).
Fig. 1a.
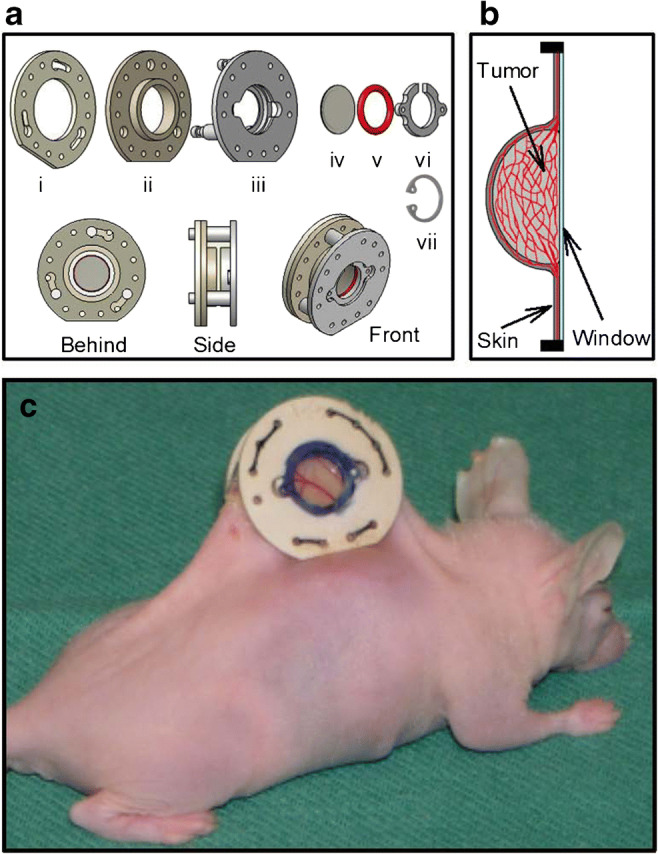
Technical drawing of our in-house made window chamber consisting of three frames (i–iii), a transparent plastic window with a diameter of 6.0 mm (iv), a silicon ring (v), and a plastic clip (vi). The window chamber is made of polymer material and has an outer diameter of 19.0 mm, an outer thickness of 7.0 mm, and a total weight of 1.0 g. In experiments that did not involve magnetic resonance imaging, the plastic clip (vi) was replaced by a c-ring in stainless steel (vii). b A schematic illustration of a transversal section through a tumor growing in the window chamber. The tumor (light gray color) grows as a hemisphere surrounded by the plastic window (light blue color) and normal skin (dark gray color). The vasculature (red color) in the tumor and the surrounding normal skin can be studied by intravital microscopy through the transparent plastic window. c Photograph of the window chamber implanted in the dorsal skin fold of a BALB/c nu/nu mouse. Modified from Gaustad et al. and Simonsen et al. [14, 44]
Intravital microscopy imaging
We used a standard inverted fluorescence microscope (IX-71; Olympus, Munich, Germany) and a black and white CCD camera (C9300–024; Hamamatsu Photonics, Hamamatsu, Japan) to study tumors growing in window chambers. Tumor vasculature was visualized by using transillumination and filters for green light, or fluorescence imaging after a 0.2 mL bolus of tetramethylrhodamine isothiocyanate-labeled dextran (TRITC-dextran; molecular weight 155 kDA; Sigma-Aldrich, Scnelldorf, Germany) was injected into the lateral tail vein as detailed previously [14, 15]. First-pass imaging movies were recorded at a rate of 22.3 frames per second by using a × 2 objective lens, resulting in a time resolution of 44.8 ms, a field of view of 6.0 × 6.0 mm2, and a pixel size of 7.5 × 7.5 μm2, whereas high-resolution images of the tumor vasculature were recorded by using a × 4 objective lens, resulting in a field of view of 3.8 × 3.8 mm2 and a pixel size of 3.7 × 3.7 μm2. Lymphatics were visualized by 3–5 intradermal injections of ~2 μl TRITC-dextran in the normal skin tissue surrounding the window chambers. Mice with window chambers were anesthetized and the window chambers were screwed to the microscope stage during intravital microscopy to avoid movement caused by respiration, and the body core temperature was kept at 37–38 °C by using a hot-air generator.
Immunohistochemical detection of tumor hypoxia
The tumors were resected immediately after the last intravital microscopy examination and fixed in phosphate-buffered 4% paraformaldehyde. Pimonidazole [1-[(2-hydroxy-3-piperidinyl)-propyl]-2-nitroimidazole], administered as described previously [15], was used as a hypoxia marker. An anti-pimonidazole rabbit polyclonal antibody (Professor James A. Raleigh, University of North Carolina, Chapel Hill, NC, USA) was used as primary antibody. Diaminobenzidine was used as chromogen, and hematoxylin was used for counterstaining. Hypoxic fractions were assessed by image analysis and were defined as the area fraction of the viable tissue showing positive pimonidazole staining.
DCE-MRI
Dynamic contrast-enhanced magnetic resonance imaging (DCE-MRI) was performed by using a 1.5 T whole-body scanner (Signa; General Electric, Milwaukee, WI) and a cylindrical slotted tube resonator transceiver coil especially constructed for mice [16]. Gd-DTPA (Schering, Berlin, Germany), diluted to a final concentration of 0.06 M was used as contrast agent and was administered in the tail vein of the mice in a bolus dose of 5.0 ml/kg. Two calibration tubes, one with 0.5 mM Gd-DTPA in 0.9% saline and the other with 0.9% saline only, were placed adjacent to the mice in the coil. The tumors were imaged sagittally in a single scan adjacent to and parallel to the window of the chamber preparations at a voxel size of 310 × 310 × 2000 μm3. T1-weighted images (TR = 200 ms, TE = 3.2 ms, and α = 80°) were recorded at a time resolution of 14 s. Two proton density images (TR = 900 ms, TE = 3.2 ms, and α = 20°) and three T1-weighted images were acquired before Gd-DTPA was administered, and T1-weighted images were recorded for 15 min after the administration of Gd-DTPA. Gd-DTPA concentrations were calculated from signal intensities by using the method described by Hittmair [17], and parametric images of Ktrans were generated from concentration versus time series by using the arterial input function of Benjaminsen et al. [18] and Tofts generalized pharmacokinetic model [19].
Hypoxia treatment
Unanesthetized mice were placed in an in-house-made incubation chamber and exposed to a continuous flow of a humidified gas mixture at room temperature to induce hypoxia. The hypoxia treatment consisted of 12 cycles of 10 min of 8% O2 in N2 followed by 10 min of air for a total of 4 h. Control mice were exposed to a continuous flow of humidified air for 4 h. The hypoxia treatment began on the first day after tumor initiation and was given once per day for 9 days. 8 tumor-bearing mice were included in the treatment and control groups.
Sunitinib treatment
Mice were divided in groups with matched tumor size, and were treated with 40 mg/kg/day sunitinib (treatment group, 8 mice) or vehicle (control group, 6 mice) for 4 days. The treatment started 12 days after tumor initiation, and at that time the tumors had developed vascular networks. Sunitinib and vehicle were administered orally by gavage. Sunitinib L-malate (LC Laboratories, Woburn, MA) was dissolved in hydrochloric acid (1.0 M ratio of sunitinib), polysorbate 80 (0.5%; Sigma-Aldrich, Schnelldorf, Germany), polyethylene glycol 300 (10%; Sigma-Aldrich), sodium hydroxide (to adjust pH to 3.5), and sterile water.
Statistical analysis
Statistical comparisons of data were carried out by using the Student’s t test (single comparisons) or by one-way analysis of variance followed by the Student–Neuman–Keuls test (multiple comparisons) when the data complied with the conditions of normality and equal variance. Under other conditions, comparisons were carried out by non-parametric analysis using the Mann–Whitney rank-sum test (single comparisons) or the Kruskal–Wallis analysis of variance on ranks test followed by the Dunn’s test (multiple comparisons). The Pearson product moment correlation test was used to search for correlations between two parameters. Probability values of p < 0.05, determined from two-sided tests, were considered significant. The statistical analysis was performed by using the SigmaStat statistical software (SPSS Science, Chicago, IL, USA).
Results
Monitoring tumor growth and vascularization
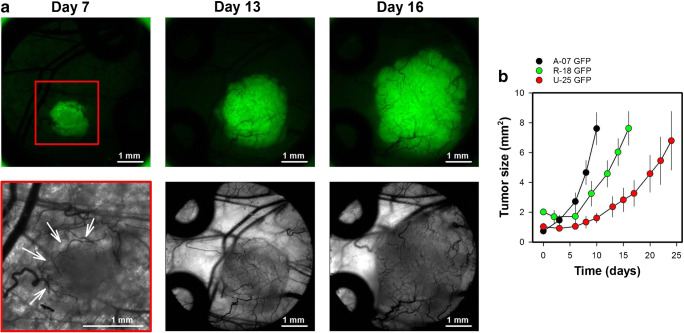
The implanted window chambers allowed repeated intravital microscopy, and were imaged thrice a week to study the growth and the initial vascularization of tumors. Figure 2a shows intravital microscopy images of a representative R-18-GFP melanoma xenograft, and illustrates the first signs of angiogenesis (day 7; novel vessels in the tumor periphery), and the vascular network after the entire tumor was vascularized (day 13 and 16). By using tumor cells transfected with green fluorescent protein (GFP), the tumor cells were easily identified in fluorescence images and the tumor size was assessed by measuring the area showing positive GFP-signal. Fig. 2b shows plots of tumor size versus time for three melanoma xenograft models. The melanoma models differed in growth rate (p < 0.05), and these differences reflected differences in the angiogenic activity. Thus A-07-GFP tumors produced a vessel length of 13.5 mm/day and showed the highest growth rate, R-18-GFP tumors produced a vessel length of 7.5 mm/day and showed the second highest growth rate, and U-25-GFP tumors produced a vessel length of 4.1 mm/day and showed the lowest growth rate. We have studied tumors growing in window chambers for time periods up to four weeks. This period is limited by the time the tumors need to outgrow the window chamber.
Fig. 2a.
Intravital microsopy images of a R-18-GFP melanoma xenograft recorded 7, 13, and 16 days after tumor initiation. The upper row shows fluorescence images of the GFP-expressing tumor cells, and the lower row shows transillumination images of vessels within the tumor mass and in the tissue surrounding the tumor. A red box highlight the area shown in the transillumination image recorded on day 7 and white arrows highlight novel tumor vessels in the tumor periphery. The fluorescence and transillumination images recorded on day 13 and 16 show the same field of view. b Tumor size versus time for A-07-GFP, R-18-GFP, and U-25-GFP melanoma xenografts. Tumor size was depicted from the area showing positive GFP signal. Points, means of 6–13 tumors; bars, standard error. Fig. 2b was modified from Gaustad et al. [15]
Quantitative studies of vascular morphology and function
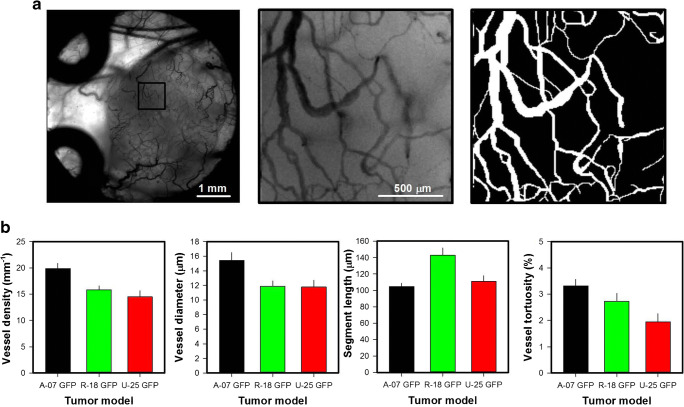
Figure 3a shows intravital microscopy images and the vascular mask of a representative R-18-GFP melanoma xenograft. The microscopy images were recorded by using transillumination and a filter for green light, and visualize vessels perfused with red blood cells because these cells absorb green light. Importantly, the contrast between blood vessels and tissue in the images was sufficient to create accurate vascular masks. The vascular masks were used to calculate morphological parameters describing the tumor vasculature including vessel length densities (i.e., total vessel length per mm2 tumor area) and vessel diameters. Interestingly, the three melanoma xenograft models differed substantially in vascular morphology (Fig. 3b). Thus, A-07-GFP tumors showed higher vessel density and larger vessel diameters than R-18-GFP and U-25-GFP tumors (p < 0.05), R-18-GFP tumors showed longer vessel segments than A-07-GFP and U-25-GFP tumors (p < 0.05), and A-07-GFP tumors showed more tortuous vessels than U-25-GFP tumors (p < 0.05).
Fig. 3a.
Low and high-magnification intravital microscopy images and high-magnification image of the vascular mask of a R-18-GFP melanoma xenograft. b Vessel density, vessel diameter, vessel segment length, and vessel tortuosity in A-07-GFP, R-18-GFP, and U-25-GFP melanoma xenografts. Points, means of 6–13 tumors; bars, standard error. Fig. 3b was modified from Gaustad et al. [15]
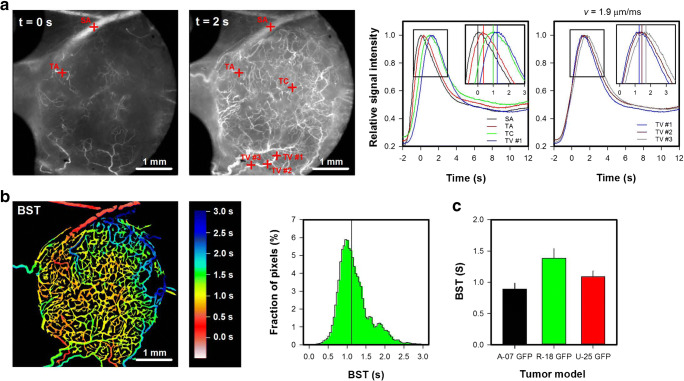
To study vascular function, first-pass imaging movies were recorded. Different vessel types could be identified in the first-pass imaging movies. Tumor arterioles were supplied shortly after the main supplying artery, tumor venules were supplied last and showed high vessel diameters, and tumor capillaries were supplied after the tumor arterioles and before the tumor venules and showed low vessel diameters. A first-pass imaging movie, illustrating how a bolus of TRITC-dextran moves through the vascular network of a representative R-18-GFP tumor and the surrounding normal tissue, is presented in Online Resource 1. Figure 4a shows single frames from the movie and plots of relative signal intensity versus time for the vessels marked in the frames. The first frame was recorded when the bolus reached the main supplying artery, and the second frame was recorded 2 s later when the bolus had reached most tumor vessels. The peak in the signal intensity curve appeared first in the main supplying artery (SA; black curve) and was delayed in the selected tumor arteriole (TA; red curve), tumor capillary (TC; green curve), and tumor venule (TV #1, blue curve). The blood supply time (BST) was determined by measuring the time delay, and thus described the time needed for arterial blood to flow from the main supplying artery to a tumor vessel. A color-coded BST image and a BST histogram of the representative R-18-GFP tumor are shown in Fig. 4b. The sensitivity of the BST measurements is illustrated by the signal intensity curves. Thus, the curves depicted in different tumor vessels (TA, TC, and TV) could easily be separated, and gradients along vessel segments (TV #1–3) could be detected. Gradients along vessel segments were used to calculate the blood flow velocity. The blood flow velocity in the selected TV was 1.9 μm/ms, which is well within the range of tumor blood flow velocities reported by others [6, 11]. R-18-GFP tumors showed higher BST values and thus lower blood flow velocities than A-07 GFP tumors (Fig. 4c; p < 0.01), whereas significant differences in BST were not found between A-07-GFP and U-25GFP tumors or between R-18-GFP and U-25-GFP tumors (Fig. 4c; p > 0.05).
Fig. 4a.
Single frames from a first-pass imaging movie of a R18-GFP melanoma xenograft, and relative signal intensity versus time for the vessels marked in the frames. The entire first-pass imaging movie can be seen in Online Resource 1. The signal intensity curves refer to the main supplying artery (SA; black curve), a tumor arteriole (TA; red curve), a tumor capillary (TC; green curve), and a tumor venule (TV #1–3; blue, dark red, and gray curve). In the tumor venule, three regions of interest were selected. The delay in the signal intensity curves recorded along the tumor venule was used to calculate the blood flow velocity, which was 1.9 μm/ms. b Color-coded blood supply time image (BST) image and BST histogram of the R-18-GFP tumor. BST refer to the time arterial blood needs to flow from the main supplying artery to a tumor vessel, and was calculated from the delay in signal intensity curves for every vessel pixel. The BST scale is given by the color bar. The vertical line in the BST histogram shows median BST. c BST in A-07-GFP, R-18-GFP, and U-25-GFP melanoma xenografts. Columns, means of 7–17 tumors; bars, standard error. Fig. 4c was modified from Gaustad et al. [15]
Imaging lymphatics
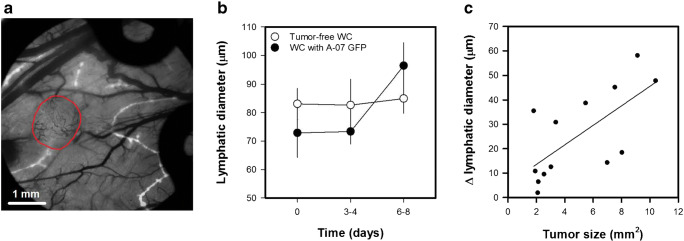
Lymphatics were visualized by multiple intradermal injections of ~2 μl TRITC-dextran in the normal skin tissue surrounding the window chambers (Fig. 5a), and the imaging protocol was repeated for window chambers with and without A-07-GFP melanoma xenografts. The diameter of adjacent lymphatics was increased 6–8 days after tumor implantation (Fig. 5b; p < 0.001), whereas the lymphatic diameters did not change in tumor-free window chambers (Fig. 5b; p > 0.05). Moreover, a positive correlation was found between the increase in lymphatic diameter and tumor size (Fig. 5c; p < 0.05; R2 = 0.46), implying that the A-07-GFP tumors induced lymphatic dilation. Others have shown that tumor cells influence lymphatics by secreting vascular endothelial growth factor C (VEGF C), and increases in the diameter of adjacent lymphatics have been observed after implantation of VEGF-C overexpressing fibrosarcoma xenografts in the tip of the mouse ear [20–22]. Importantly the increase in lymphatic diameters was demonstrated to increase the propensity for lymph node metastasis, and could be inhibited by blocking the VEGF-C pathway [21, 22].
Fig. 5a.
Intravital microscopy image of TRITC-dextran filled lymphatics (white) superimposed on transillumination image of blood vessels (black). The image shows an A-07-GFP melanoma xenograft (delineated by red line) and the surrounding normal tissue. Images of lymphatics were recorded 10–15 min after 3–5 intradermal injections of ~2 μl TRITC-dextran in the skin surrounding the window chambers. b Lymphatic diameter versus time for window chambers with and without A-07-GFP tumors. Points, means of 8–13 window chambers; bars, standard error. c Change in lymphatic diameter versus tumor size. Points, individual window chambers; line, curve fitted to the data by linear regression. Fig. 5b-c was modified from Gaustad et al. [45]
Vascular effects of acute cyclic hypoxia
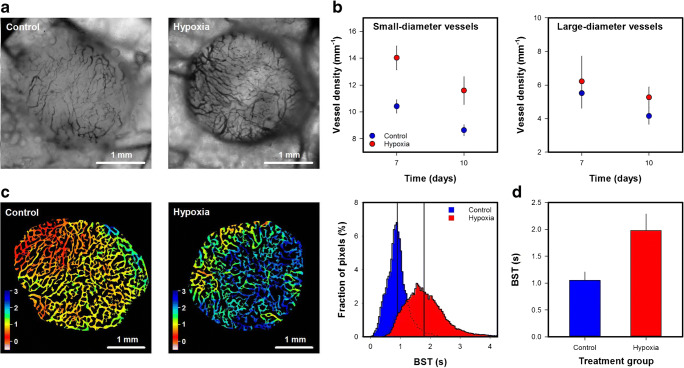
To investigate vascular effects of acute cyclic hypoxia, tumor-bearing mice were periodically exposed to a low oxygen atmosphere. Figure 6a shows intravital microscopy images of an untreated and a hypoxia-treated A-07-GFP melanoma xenograft. Quantitative studies revealed increased density of small-diameter vessels (< 20 μm) in hypoxia-treated tumors (Fig. 6b; p < 0.05), whereas the density of large-diameter vessels (> 20 μm) did not differ between untreated and hypoxia treated tumors (Fig. 6b; p > 0.05). These observations imply that the hypoxia-treatment induced angiogenesis in A-07-GFP window chamber tumors, and corresponds well to a previous study of intradermal A-07 tumors. In the previous study, hypoxia-treatment induced angiogenesis and increased the propensity for pulmonary metastasis by increasing the expression of VEGF-A [23]. Fig. 6c shows the BST image and the BST histogram of an untreated and a hypoxia treated A-07-GFP tumor. The hypoxia-treated tumors showed higher BST values and thus lower blood flow velocities than untreated tumors (Fig. 6d; p < 0.05). The difference in vascular function could most likely be attributed to differences in the geometric resistance to blood flow. When laminar flow can be assumed, the geometric resistance in a single vessel is inversely proportional to the vessel diameter in the fourth power [6]. Small-diameter vessels are thus expected to have high geometric resistance to blood flow, and if a substantial number of vessels become narrower or are replaced by narrower vessels, the geometric resistance in vascular networks can increase.
Fig. 6a.
Intravital microscopy images of an untreated (control) and a hypoxia-treated A-07-GFP melanoma xenograft. The hypoxia treatment consisted of 12 cycles of 10 min of low O2 (8%) followed by 10 min of air. The treatment started the first day after the tumors were implanted in window chambers, and was given daily for 9 days. b Density of small-diameter (< 20 μm) and large-diameter vessels (> 20 μm) in untreated and hypoxia-treated A-07-GFP tumors. c Blood supply time (BST) image and BST histogram of an untreated and a hypoxia-treated A-07-GFP tumor. The BST scale is given by the color bar. The vertical lines in the BST histograms show median BST. d BST in untreated and hypoxia-treated tumors. Points and columns, means of 6–8 tumors; bars, standard error (b and d). Fig. 6b and d was modified from Gaustad et al. [46]
Vascular effects of antiangiogenic treatment
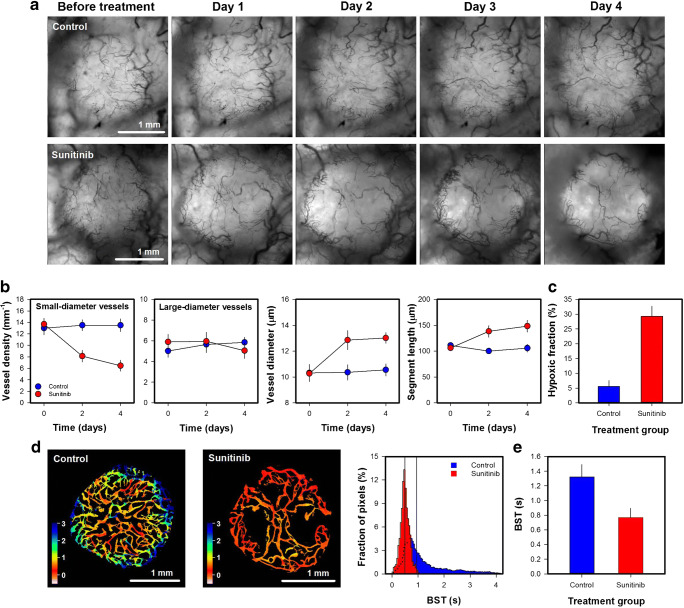
Sunitinib inhibits the VEGF-A pathway by blocking the VEGF receptors [24]. To investigate vascular effects of sunitinib treatment, untreated and sunitinib-treated Capan-2 pancreatic ductal adencarcinoma (PDAC) xenografts were subjected to daily intravital microscopy (Fig. 7a). Sunitinib-treated tumors showed reduced density of small-diameter vessels (< 10 μm; Fig. 7b; p < 0.01), but did not differ from untreated tumors in the density of large-diameter vessels (> 10 μm; Fig. 7b; p > 0.05). The removal of small-diameter vessels resulted in increased vessel diameter and segment length (Fig. 7b; p < 0.01), and increased hypoxic fraction as revealed by immunohistochemistry using pimonidazole as a hypoxia marker (Fig. 7c; p < 0.01). Moreover, sunitinib-treated tumors showed lower BST values than untreated tumors. This is illustrated qualitatively in Fig. 7d which shows the BST image and the BST histogram of representative untreated and sunitinib-treated tumors, and quantitatively in Fig. 7e which shows BST of all the included tumors (p < 0.05). The reduced BST values could probably be attributed to reduced geometric resistance to blood flow. As discussed above, small-diameter vessels are expected to have a high geometric resistance to blood flow, and a selective removal of small-diameter vessels can thus reduce the geometric resistance in vascular networks. Improved vascular function after antiangiogenic treatment has also been reported by others [25, 26]. The phenomenon has been termed vascular normalization and has been shown to increase tumor oxygenation in some but not all tumor models [26–30]. To increase tumor oxygenation, the improved vascular function must outweigh the loss of tumor vessels [26]. In the experiment reported here, sunitinib reduced BST implying that the treatment increased blood flow velocity. Increased blood flow velocity can increase oxygen supply (i.e. increase the flow of oxygen-carrying erythrocytes), but this effect was probably too small to compensate for the loss of tumor vessels as the treatment increased hypoxic fractions (Fig. 7c). It has also been argued that increased blood flow velocity can decrease microvascular transit times which limit the time available for blood-tumor oxygen exchange [31, 32]. Interestingly, Østeergaard et al. demonstrated that reduced microvascular transit times can decrease tumor oxygenation despite increases in blood flow velocities by using mathematical simulations [33]. The sunitinib-induced reduction in BST reported here may thus have contributed to increased hypoxic fraction by decreasing the time available for blood-tumor oxygen exchange.
Fig. 7a.
Intravital microscopy images of an untreated (control) and a sunitinib-treated Capan-2 pancreatic ductal adenocarcinoma xenograft. The tumor-bearing mice were given daily doses of 40 mg/kg sunitinib or vehicle for 4 days. b Density of small-diameter vessels (< 10 μm), density of large-diameter vessels (> 10 μm), vessel diameter, and vessel segment length versus time in untreated and sunitinib-treated Capan-2 tumors. c Hypoxic fraction in untreated and sunitinib-treated Capan-2 tumors. The hypoxic fractions were determined by immuohistochemistry using pimonidazole as a hypoxia marker. d Blood supply time (BST) image and BST histogram of an untreated and a sunitinib-treated Capan-2 tumor. The BST scale is given by the color bar. The vertical lines in the BST histograms show median BST. e BST in untreated and sunitinib-treated tumors. Points and columns, means of 6–8 tumors; bars, standard error (b-c and e). Fig. 6b-c and e was modified from Gaustad et al. [47]
Comparison/combination with MRI
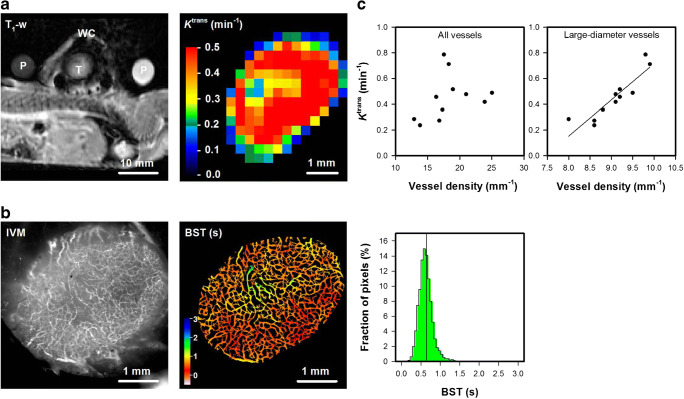
The window chamber was made of polymer material and was thus compatible with MRI. Figure 8a shows a T1-weigthed MR image of a mouse with an A-07-GFP window chamber tumor, and a color-coded Ktrans image of the tumor obtained by DCE-MRI. The MR images were recorded with an in-plane resolution of 310 × 310 μm2 and a slice thickness of 2000 μm, and, consequently, individual tumor vessels could not be distinguished in these images. By subjecting the same tumor to intravital microscopy, the Ktrans image could be compared with morphological and functional images of the tumor vasculature (Fig. 8b; in-plane resolution 7.5 × 7.5 μm2). The A-07-GFP tumor did not display avascular regions and showed low BST values compared to most A-07-GFP, R-18-GFP, and U-25-GFP tumors (Fig. 4). The intravital microscopy images thus implied that the blood supply of the tumor was highly efficient, and accordingly the tumor showed high Ktrans values. Moreover, positive correlations were found between Ktrans and vessel density when all the A-07-GFP tumors were included (Fig. 8c). Interestingly, the strongest correlations were found between Ktrans and the density of large-diameter vessels (> 20 μm; Fig. 8c; p < 0.001; R2 = 0.81), implying that Ktrans was strongly influenced by these vessels.
Fig. 8a.
A T1-weighted magnetic resonance (MR) image of calibration phantoms (P) and a mouse bearing a window chamber (WC) with an A07-GFP melanoma xenograft (T), and a color-coded Ktrans image of the A07-GFP tumor calculated from dynamic contrast-enhanced MR data by using Tofts generalized pharmacokinetic model. The Ktrans scale is given by the color bar. b Intravital microscopy image of TRITC-dextran filled tumor vessels and blood supply time (BST) image of the A-07-GFP tumor. The BST scales are given by the color bar. c Median Ktrans versus the density of all vessels and median Ktrans versus the density of large-diameter vessels (> 20 μm) in A-07-GFP tumors. Points, individual tumors. Fig. 8c was modified from Gaustad et al. [14]
Discussion
The presented intravital microscopy assay used a standard fluorescence microscope to study normal tissue and tumor vasculature, as well as lymphatics in the skin surrounding tumors. Images of vascular morphology were recorded with high in-plane resolution to produce accurate vascular masks for calculating morphological parameters. Although the standard microscope provided excellent in-plane resolution, it did not provide depth resolution. The intravital microscopy images thus showed two-dimensional projections of the three-dimensional vasculature, and are expected to overestimate vessel densities because of contributions of vessels at different depths (from the window surface to a depth of ~1–2 mm determined by the penetration length of light). More advanced microscopes, such as confocal and multi-photon microscopes, provide three-dimensional resolution and do not share this limitation [10, 13]. However, it should be noticed that tumor-line differences as well as treatment-induced changes in vessel density were detected by using the 2-dimensional projections, implying that the assay provided important information on the relative vessel density. Moreover, when comparing intravital microscopy images with MRI-derived images, the depth resolution of the intravital microscopy images is not crucial because the MR-scans have a substantial thickness (2 mm in the current study). Calculations of vessel diameter, vessel segment length, and vessel tortuosity are not expected to be influenced by the lack of depth resolution.
An important advantage with our intravital microscopy assay is that the entire tumor vasculature and the surrounding normal tissue can be imaged simultaneously with high spatial and temporal resolution. To investigate vascular function, first-pass imaging movies were recorded with a temporal resolution of 44.8 ms, a spatial resolution of 7.5 × 7.5 μm2, and a field of view that covered the entire window chamber. These temporal and spatial resolutions were sufficient to identify the majority of the tumor vessels and to calculate accurate BST values for individual vessel pixels. With confocal and multi-photon microscopes, reduced temporal resolution or a smaller field of view must be accepted because scanning at multiple depths is highly time consuming [10, 13].
The intravital microscopy assay was used to investigate vascular effects of acute cyclic hypoxia and antiangiogenic treatment. As discussed above, the hypoxia-treatment induced angiogenesis by increasing VEGF-A expression, and the sunitinib treatment inhibited angiogenesis by targeting the VEGF receptors. Interestingly, the two treatments had opposite effects on vascular morphology and function. Thus the hypoxia treatment increased the number of small-diameter vessels and increased BST, whereas the sunitinib treatment selectively removed small-diameter vessels and reduced BST. The sunitinib treatment also induced hypoxia because the increased blood flow velocities were insufficient to compensate for the loss of tumor vessels and possibly because the reduced BST decreased the time available for blood-tumor oxygen exchange. These experiments demonstrate the strength of assessing both vascular morphology and function, and the feasibility of the intravital microscopy assay to provide such information.
Vascular networks in both normal and tumor tissues show vessel pathways with varying lengths, and if short pathways are enlarged, the blood flow may bypass long pathways and form functional shunts [34]. Functional shunts may deprive the regions that are supplied by the long pathways their supply of oxygen and nutrients, and are prevented in normal tissues by vascular communication and structural adaptation [35, 36]. In tumor tissues, functional shunts are frequently observed possibly because the vascular communication is impaired [37]. Pries et al. suggested that antiangiogenic treatment may restore the vascular communication and prevent functional shunts, and demonstrated that this may increase tumor oxygenation by using mathematical simulations [35]. Our intravital microscopy assay may be used to study the occurrence and consequences of functional shunts in tumor models. Vessel diameters and blood flow directions and velocities can be assessed in first-pass imaging movies to identify functional shunts, and the imaging may be repeated to investigate possible effects of antiangiogenic treatments.
Tumor cells transfected with GFP were used in the experiments reported here. The GFP-signal allowed accurate determination of tumor size and location, and was used to study tumor growth. GFP transfected tumor cells have also been used to study metastatic spread, and several live fluorescent reporters have been established to monitor gene expression and regulation by intravital microscopy [11, 13, 21]. Cao et al. genetically engineered tumor cells with GFP as a reporter for hypoxia inducible factor 1 (HIF-1) activation, and demonstrated that the intitial angiogenesis preceded HIF-1 activation [38]. Interestingly, the HIF-1 activation was monitored by intravital microscopy using a standard fluorescence microscope, suggesting that similar experiments can be performed with the intravital microscopy assay presented here. Intravital microscopy techniques for imaging the metabolic environment of tumors growing in window chambers have also been reported. Thus the extracellular pH has been determined by using molecular probes with a wavelength distribution dependent on pH, tumor oxygenation has been studied by imaging phosphorescence lifetime after administration of porphyrin probes, and the hemoglobin saturation has been determined by hyperspectral imaging [4, 13, 39]. Hyperspectral imaging requires a tunable wavelength filter, and this can be added to standard fluorescence microscopes to facilitate imaging of extracellular pH and hemoglobin saturation [13, 39]. However imaging of phosphorescence lifetime requires a specialized phosphorescence microscope and cannot be performed with the intravital microscopy assay reported here [4].
Our in-house-made window chamber was compatible with MRI. We compared Ktrans images acquired by DCE-MRI with intravital microscopy images, and found that Ktrans images reflected vascular morphology and function. This was an expected finding because Ktrans mainly reflects blood perfusion in tumors with high vessel permeability [19]. We have previously shown that A-07 tumors have high permeability for macromolecules, and that Ktrans reflects blood perfusion in this melanoma model [40, 41]. The MR-compatible window chamber can also be used to validate novel MR-techniques designed to provide information on tumor vasculature such as vessel size imaging and vessel architectural imaging [42, 43]. Moreover, other MR images such as diffusion weighted images and/or spectroscopy images may be combined with intravital microscopy images to provide complimentary information in comprehensive studies of the tumor microenvironment.
Conclusion
An intravital microscopy assay that can be performed with a standard fluorescence microscope was presented, and this assay represents a useful and affordable alternative to intravital microscopy assays using confocal and multi-photon microscopes. The assay allowed quantification of morphological and functional parameters of normal tissue and tumor vasculature, and was used to study tumor growth and vascularization, tumor-associated lymphatics, and vascular effects of acute cyclic hypoxia and antiangiogenic treatment. Acute cyclic hypoxia induced angiogenisis resulting in increased densities of small-diameter vessels and increased BST values, whereas sunitinib treatment selectively removed small-diameter vessels, reduced BST values, and induced tumor hypoxia. The MR-compatible window chamber preparation enabled MRI and intravital microscopy of the same tumor, and DCE-MRI-derived Ktrans images were shown to reflect vascular morphology and function.
Supplementary Information
First-pass imaging movie of a representative R-18-GFP melanoma xenograft illustrating how a 0.2 ml bolus of 155 kDa TRITC-dextran moves through the vascular network of the tumor. The movie was recorded with a temporal resolution of 44.8 ms and a pixel size of 7.5 × 7.5 μm2. Single frames from the movie and relative signal intensity versus time curves for selected vessels are shown in Fig. 4a, and the blood supply time (BST) image and the BST histogram of the tumor are shown in Fig. 4b. (MP4 12.3 MB)
Funding
Open access funding provided by University of Oslo (incl Oslo University Hospital). Financial support was received from the Norwegian Cancer Society and the South-Eastern Norway Regional Health Authority.
Declarations
Ethics approval
The animal experiments were approved by the Institutional Committee on Research Animal Care and the Norwegian Food Safety Authority, and were performed in accordance with the Interdisciplinary Principles and Guidelines for the Use of Animals in Research, Marketing, and Education (New York Academy of Sciences, New York, NY, USA) and the EU Directive 2010/63/EU for animal experiments.
Conflict of interest
The authors declare that they have no competing interests.
Footnotes
This article is part of the Topical Collection on Oncology - General.
Publisher’s note
Springer Nature remains neutral with regard to jurisdictional claims in published maps and institutional affiliations.
References
- 1.Carmeliet P, Jain RK. Principles and mechanisms of vessel normalization for cancer and other angiogenic diseases. Nat Rev Drug Discov. 2011;10(6):417–427. doi: 10.1038/nrd3455. [DOI] [PubMed] [Google Scholar]
- 2.Vaupel P, Kallinowski F, Okunieff P. Blood flow, oxygen and nutrient supply, and metabolic microenvironment of human tumors: a review. Cancer Res. 1989;49(23):6449–6465. [PubMed] [Google Scholar]
- 3.Brown JM, Giaccia AJ. The unique physiology of solid tumors: opportunities (and problems) for cancer therapy. Cancer Res. 1998;58(7):1408–1416. [PubMed] [Google Scholar]
- 4.Dewhirst MW, Ong ET, Braun RD, Smith B, Klitzman B, Evans SM, Wilson D. Quantification of longitudinal tissue pO2 gradients in window chamber tumours: impact on tumour hypoxia. Br J Cancer. 1999;79(11–12):1717–1722. doi: 10.1038/sj.bjc.6690273. [DOI] [PMC free article] [PubMed] [Google Scholar]
- 5.Baish JW, Gazit Y, Berk DA, Nozue M, Baxter LT, Jain RK. Role of tumor vascular architecture in nutrient and drug delivery: an invasion percolation-based network model. Microvasc Res. 1996;51(3):327–346. doi: 10.1006/mvre.1996.0031. [DOI] [PubMed] [Google Scholar]
- 6.Jain RK. Determinants of tumor blood flow: a review. Cancer Res. 1988;48(10):2641–2658. [PubMed] [Google Scholar]
- 7.Dewhirst MW, Kimura H, Rehmus SW, Braun RD, Papahadjopoulos D, Hong K, Secomb TW. Microvascular studies on the origins of perfusion-limited hypoxia. Br J Cancer Suppl. 1996;27:S247–S251. [PMC free article] [PubMed] [Google Scholar]
- 8.Vaupel P. Tumor microenvironmental physiology and its implications for radiation oncology. Semin Radiat Oncol. 2004;14(3):198–206. doi: 10.1016/j.semradonc.2004.04.008. [DOI] [PubMed] [Google Scholar]
- 9.Rofstad EK. Microenvironment-induced cancer metastasis. IntJRadiatBiol. 2000;76(5):589–605. doi: 10.1080/095530000138259. [DOI] [PubMed] [Google Scholar]
- 10.Tozer GM, Ameer-Beg SM, Baker J, Barber PR, Hill SA, Hodgkiss RJ, Locke R, Prise VE, Wilson I, Vojnovic B. Intravital imaging of tumour vascular networks using multi-photon fluorescence microscopy. Adv Drug Deliv Rev. 2005;57(1):135–152. doi: 10.1016/j.addr.2004.07.015. [DOI] [PubMed] [Google Scholar]
- 11.Jain RK, Munn LL, Fukumura D. Dissecting tumour pathophysiology using intravital microscopy. Nat Rev Cancer. 2002;2(4):266–276. doi: 10.1038/nrc778. [DOI] [PubMed] [Google Scholar]
- 12.Dewhirst MW, Shan S, Cao Y, Moeller B, Yuan F, Li CY. Intravital fluorescence facilitates measurement of multiple physiologic functions and gene expression in tumors of live animals. Dis Markers. 2002;18(5–6):293–311. doi: 10.1155/2002/820102. [DOI] [PMC free article] [PubMed] [Google Scholar]
- 13.Fukumura D, Duda DG, Munn LL, Jain RK. Tumor microvasculature and microenvironment: novel insights through intravital imaging in pre-clinical models. Microcirculation. 2010;17(3):206–225. doi: 10.1111/j.1549-8719.2010.00029.x. [DOI] [PMC free article] [PubMed] [Google Scholar]
- 14.Gaustad JV, Brurberg KG, Simonsen TG, Mollatt CS, Rofstad EK. Tumor vascularity assessed by magnetic resonance imaging and intravital microscopy imaging. Neoplasia. 2008;10(4):354–362. doi: 10.1593/neo.08162. [DOI] [PMC free article] [PubMed] [Google Scholar]
- 15.Gaustad JV, Simonsen TG, Andersen LMK, Rofstad EK. Vascular abnormalities and development of hypoxia in microscopic melanoma xenografts. J Transl Med. 2017;15(1):241. doi: 10.1186/s12967-017-1347-9. [DOI] [PMC free article] [PubMed] [Google Scholar]
- 16.Rofstad EK, Steinsland E, Kaalhus O, Chang YB, Høvik B, Lyng H. Magnetic resonance imaging of human melanoma xenografts in vivo: proton spin-lattice and spin-spin relaxation times versus fractional tumour water content and fraction of necrotic tumour tissue. Int J Radiat Biol. 1994;65(3):387–401. doi: 10.1080/09553009414550451. [DOI] [PubMed] [Google Scholar]
- 17.Hittmair K, Gomiscek G, Langenberger K, Recht M, Imhof H, Kramer J. Method for the quantitative assessment of contrast agent uptake in dynamic contrast-enhanced MRI. Magn Reson Med. 1994;31(5):567–571. doi: 10.1002/mrm.1910310516. [DOI] [PubMed] [Google Scholar]
- 18.Benjaminsen IC, Graff BA, Brurberg KG, Rofstad EK. Assessment of tumor blood perfusion by high-resolution dynamic contrast-enhanced MRI: a preclinical study of human melanoma xenografts. Magn Reson Med. 2004;52(2):269–276. doi: 10.1002/mrm.20149. [DOI] [PubMed] [Google Scholar]
- 19.Tofts PS, Brix G, Buckley DL, Evelhoch JL, Henderson E, Knopp MV, Larsson HB, Lee TY, Mayr NA, Parker GJ, et al. Estimating kinetic parameters from dynamic contrast-enhanced T(1)-weighted MRI of a diffusable tracer: standardized quantities and symbols. J Magn Reson Imaging. 1999;10(3):223–232. doi: 10.1002/(SICI)1522-2586(199909)10:3<223::AID-JMRI2>3.0.CO;2-S. [DOI] [PubMed] [Google Scholar]
- 20.Lohela M, Bry M, Tammela T, Alitalo K. VEGFs and receptors involved in angiogenesis versus lymphangiogenesis. CurrOpinCell Biol. 2009;21(2):154–165. doi: 10.1016/j.ceb.2008.12.012. [DOI] [PubMed] [Google Scholar]
- 21.Hoshida T, Isaka N. Hagendoorn J, di TE, Chen YL, Pytowski B, Fukumura D, Padera TP, Jain RK: imaging steps of lymphatic metastasis reveals that vascular endothelial growth factor-C increases metastasis by increasing delivery of cancer cells to lymph nodes: therapeutic implications. Cancer Res. 2006;66(16):8065–8075. doi: 10.1158/0008-5472.CAN-06-1392. [DOI] [PubMed] [Google Scholar]
- 22.Padera TP, Kuo AH, Hoshida T, Liao S, Lobo J, Kozak KR, Fukumura D, Jain RK. Differential response of primary tumor versus lymphatic metastasis to VEGFR-2 and VEGFR-3 kinase inhibitors cediranib and vandetanib. Mol Cancer Ther. 2008;7(8):2272–2279. doi: 10.1158/1535-7163.MCT-08-0182. [DOI] [PMC free article] [PubMed] [Google Scholar]
- 23.Rofstad EK, Gaustad JV, Egeland TA, Mathiesen B, Galappathi K. Tumors exposed to acute cyclic hypoxic stress show enhanced angiogenesis, perfusion and metastatic dissemination. IntJCancer. 2010;127(7):1535–1546. doi: 10.1002/ijc.25176. [DOI] [PubMed] [Google Scholar]
- 24.Roskoski R., Jr Sunitinib: a VEGF and PDGF receptor protein kinase and angiogenesis inhibitor. Biochem Biophys Res Commun. 2007;356(2):323–328. doi: 10.1016/j.bbrc.2007.02.156. [DOI] [PubMed] [Google Scholar]
- 25.Dickson PV, Hamner JB, Sims TL, Fraga CH, Ng CY, Rajasekeran S, Hagedorn NL, McCarville MB, Stewart CF, Davidoff AM. Bevacizumab-induced transient remodeling of the vasculature in neuroblastoma xenografts results in improved delivery and efficacy of systemically administered chemotherapy. Clin Cancer Res. 2007;13(13):3942–3950. doi: 10.1158/1078-0432.CCR-07-0278. [DOI] [PubMed] [Google Scholar]
- 26.Winkler F, Kozin SV, Tong RT, Chae SS, Booth MF, Garkavtsev I, Xu L, Hicklin DJ. Fukumura D, di TE et al: kinetics of vascular normalization by VEGFR2 blockade governs brain tumor response to radiation: role of oxygenation, angiopoietin-1, and matrix metalloproteinases. Cancer Cell. 2004;6(6):553–563. doi: 10.1016/j.ccr.2004.10.011. [DOI] [PubMed] [Google Scholar]
- 27.Jain RK. Normalization of tumor vasculature: an emerging concept in antiangiogenic therapy. Science. 2005;307(5706):58–62. doi: 10.1126/science.1104819. [DOI] [PubMed] [Google Scholar]
- 28.Franco M, Man S, Chen L, Emmenegger U, Shaked Y, Cheung AM, Brown AS, Hicklin DJ, Foster FS, Kerbel RS. Targeted anti-vascular endothelial growth factor receptor-2 therapy leads to short-term and long-term impairment of vascular function and increase in tumor hypoxia. Cancer Res. 2006;66(7):3639–3648. doi: 10.1158/0008-5472.CAN-05-3295. [DOI] [PubMed] [Google Scholar]
- 29.Fenton BM, Paoni SF. The addition of AG-013736 to fractionated radiation improves tumor response without functionally normalizing the tumor vasculature. Cancer Res. 2007;67(20):9921–9928. doi: 10.1158/0008-5472.CAN-07-1066. [DOI] [PubMed] [Google Scholar]
- 30.Horsman MR, Siemann DW. Pathophysiologic effects of vascular-targeting agents and the implications for combination with conventional therapies. Cancer Res. 2006;66(24):11520–11539. doi: 10.1158/0008-5472.CAN-06-2848. [DOI] [PubMed] [Google Scholar]
- 31.Hirst DG, Wood PJ. Could manipulation of the binding affinity of haemoglobin for oxygen be used clinically to sensitize tumours to radiation? Radiother Oncol. 1991;20(Suppl 1):53–57. doi: 10.1016/0167-8140(91)90188-M. [DOI] [PubMed] [Google Scholar]
- 32.Jespersen SN, Ostergaard L. The roles of cerebral blood flow, capillary transit time heterogeneity, and oxygen tension in brain oxygenation and metabolism. J Cereb Blood Flow Metab. 2012;32(2):264–277. doi: 10.1038/jcbfm.2011.153. [DOI] [PMC free article] [PubMed] [Google Scholar]
- 33.Ostergaard L, Tietze A, Nielsen T, Drasbek KR, Mouridsen K, Jespersen SN, Horsman MR. The relationship between tumor blood flow, angiogenesis, tumor hypoxia, and aerobic glycolysis. Cancer Res. 2013;73(18):5618–5624. doi: 10.1158/0008-5472.CAN-13-0964. [DOI] [PubMed] [Google Scholar]
- 34.Secomb TW, Dewhirst MW, Pries AR. Structural adaptation of normal and tumour vascular networks. Basic Clin Pharmacol Toxicol. 2012;110(1):63–69. doi: 10.1111/j.1742-7843.2011.00815.x. [DOI] [PMC free article] [PubMed] [Google Scholar]
- 35.Pries AR. Hopfner M, le NF, Dewhirst MW, Secomb TW: the shunt problem: control of functional shunting in normal and tumour vasculature. Nat Rev Cancer. 2010;10(8):587–593. doi: 10.1038/nrc2895. [DOI] [PMC free article] [PubMed] [Google Scholar]
- 36.Ellis CG, Bateman RM, Sharpe MD, Sibbald WJ, Gill R. Effect of a maldistribution of microvascular blood flow on capillary O(2) extraction in sepsis. Am J Physiol Heart Circ Physiol. 2002;282(1):H156–H164. doi: 10.1152/ajpheart.2002.282.1.H156. [DOI] [PubMed] [Google Scholar]
- 37.Dewhirst MW, Tso CY, Oliver R, Gustafson CS, Secomb TW, Gross JF. Morphologic and hemodynamic comparison of tumor and healing normal tissue microvasculature. Int J Radiat Oncol Biol Phys. 1989;17(1):91–99. doi: 10.1016/0360-3016(89)90375-1. [DOI] [PubMed] [Google Scholar]
- 38.Cao Y, Li CY, Moeller BJ, Yu D, Zhao Y, Dreher MR, Shan S, Dewhirst MW. Observation of incipient tumor angiogenesis that is independent of hypoxia and hypoxia inducible factor-1 activation. Cancer Res. 2005;65(13):5498–5505. doi: 10.1158/0008-5472.CAN-04-4553. [DOI] [PubMed] [Google Scholar]
- 39.Sorg BS, Moeller BJ, Donovan O, Cao Y, Dewhirst MW. Hyperspectral imaging of hemoglobin saturation in tumor microvasculature and tumor hypoxia development. J Biomed Opt. 2005;10(4):44004. doi: 10.1117/1.2003369. [DOI] [PubMed] [Google Scholar]
- 40.Bjørnæs I, Rofstad EK. Microvascular permeability to macromolecules in human melanoma xenografts assessed by contrast-enhanced MRI--intertumor and intratumor heterogeneity. Magn Reson Imaging. 2001;19(5):723–730. doi: 10.1016/S0730-725X(01)00377-0. [DOI] [PubMed] [Google Scholar]
- 41.Graff BA, Benjaminsen IC, Brurberg KG, Ruud EB, Rofstad EK. Comparison of tumor blood perfusion assessed by dynamic contrast-enhanced MRI with tumor blood supply assessed by invasive imaging. J Magn Reson Imaging. 2005;21(3):272–281. doi: 10.1002/jmri.20265. [DOI] [PubMed] [Google Scholar]
- 42.Chakhoyan A, Yao J, Leu K, Pope WB, Salamon N, Yong W, Lai A, Nghiemphu PL, Everson RG, Prins RM, et al. Validation of vessel size imaging (VSI) in high-grade human gliomas using magnetic resonance imaging, image-guided biopsies, and quantitative immunohistochemistry. Sci Rep. 2019;9(1):2846. doi: 10.1038/s41598-018-37564-w. [DOI] [PMC free article] [PubMed] [Google Scholar]
- 43.Emblem KE, Mouridsen K, Bjornerud A, Farrar CT, Jennings D, Borra RJ, Wen PY, Ivy P, Batchelor TT, Rosen BR, et al. Vessel architectural imaging identifies cancer patient responders to anti-angiogenic therapy. Nat Med. 2013;19(9):1178–1183. doi: 10.1038/nm.3289. [DOI] [PMC free article] [PubMed] [Google Scholar]
- 44.Simonsen TG, Gaustad JV, Leinaas MN, Rofstad EK. High interstitial fluid pressure is associated with tumor-line specific vascular abnormalities in human melanoma xenografts. PLoS One. 2012;7(6):e40006. doi: 10.1371/journal.pone.0040006. [DOI] [PMC free article] [PubMed] [Google Scholar]
- 45.Gaustad JV, Simonsen TG, Leinaas MN, Rofstad EK. A novel application of dorsal window chambers: repetitive imaging of tumor-associated lymphatics. Microvasc Res. 2012;83(3):360–365. doi: 10.1016/j.mvr.2012.02.003. [DOI] [PubMed] [Google Scholar]
- 46.Gaustad JV, Simonsen TG, Roa AM, Rofstad EK. Tumors exposed to acute cyclic hypoxia show increased vessel density and delayed blood supply. Microvasc Res. 2013;85:10–15. doi: 10.1016/j.mvr.2012.11.002. [DOI] [PubMed] [Google Scholar]
- 47.Gaustad JV, Simonsen TG, Wegner CS, Rofstad EK. Vascularization, oxygenation, and the effect of Sunitinib treatment in pancreatic ductal adenocarcinoma Xenografts. Front Oncol. 2019;9:845. doi: 10.3389/fonc.2019.00845. [DOI] [PMC free article] [PubMed] [Google Scholar]
Associated Data
This section collects any data citations, data availability statements, or supplementary materials included in this article.
Supplementary Materials
First-pass imaging movie of a representative R-18-GFP melanoma xenograft illustrating how a 0.2 ml bolus of 155 kDa TRITC-dextran moves through the vascular network of the tumor. The movie was recorded with a temporal resolution of 44.8 ms and a pixel size of 7.5 × 7.5 μm2. Single frames from the movie and relative signal intensity versus time curves for selected vessels are shown in Fig. 4a, and the blood supply time (BST) image and the BST histogram of the tumor are shown in Fig. 4b. (MP4 12.3 MB)


