

Abstract
By analyzing newly collected SARS‐CoV‐2 genomes and comparing them with our previous study about SARS‐CoV‐2 single nucleotide variants (SNVs) before June 2020, we found that the SNV clustering had changed remarkably since June 2020. Apart from that the group of SNVs became dominant, which is represented by two nonsynonymous mutations A23403G (S:D614G) and C14408T (ORF1ab:P4715L), a few emerging groups of SNVs were recognized with sharply increased monthly incidence ratios of up to 70% in November 2020. Further investigation revealed sets of SNVs specific to patients' ages and/or gender, or strongly associated with mortality. Our logistic regression model explored features contributing to mortality status, including three critical SNVs, G25088T(S:V1176F), T27484C (ORF7a:L31L), and T25A (upstream of ORF1ab), ages above 40 years old, and the male gender. The protein structure analysis indicated that the emerging subgroups of nonsynonymous SNVs and the mortality‐related ones were located on the protein surface area. The clashes in protein structure introduced by these mutations might in turn affect the viral pathogenesis through the alteration of protein conformation, leading to a difference in transmission and virulence. Particularly, we explored the fact that nonsynonymous SNVs tended to occur in intrinsic disordered regions of Spike and ORF1ab to significantly increase hydrophobicity, suggesting a potential role in the change of protein folding related to immune evasion.
Keywords: age, gender, mortality risk factor, SARS‐CoV‐2, single nucleotide variants
Key Points
There has been a considerable temporal change of the SARS‐CoV‐2 single nucleotide variants (SNVs) clustering since June 2020. Apart from one group of SNVs that became dominant, a few emerging groups of SNVs were recognized with sharply increased monthly occurrence ratios in November 2020. All of these individual SNVs could be traced back to February or March of 2020 when they were identified for the first time, suggesting a potential incubation period of the collectivity of special groups of SNVs.
114 age‐specific SNVs were identified in one or across multiple age groups.
42 SNVs showed significantly high rates in either males or females.
41 and 30 SNVs were observed with at least twofold higher incidence rates in the death and the nondeath group, respectively.
A logistic regression model demonstrated that three critical SNVs, G25088T(S:V1176F), T27484C (ORF7a:L31L), and T25A (upstream of ORF1ab), ages above 40 years old, and the male group contribute to a relatively higher mortality.
The emerging subgroups of nonsynonymous SNVs and the mortality‐related ones were located on the protein surface area. Nonsynonymous SNVs tended to occur in intrinsically disordered regions of Spike and ORF1ab.
1. INTRODUCTION
Since its outbreak in December 2019, COVID‐19 has caused 171,514,450 cases and 3,687,419 deaths worldwide as of June 1, 2021. 1 The global mortality rate of 2.15% greatly exceeded the estimated seasonal flu death rate in the United States, which is less than 0.1% according to the 2018–2019 data from the United States Centers for Disease Control and Prevention (CDC, https://www.cdc.gov/flu/about/burden/2018-2019.html). Since its outbreak, diverse viral genomic mutations of SARS‐CoV‐2 (2019‐nCoV; Family Coronaviridae) have been observed, 2 , 3 including insertions, deletions, and single nucleotide variants (SNVs), 4 , 5 which led to viral protein structure changes that potentially affect the transmission and virulence. SNVs have been extensively detected by massive and daily updated whole‐genome sequencing. SARS‐CoV‐2 SNVs presented clustering characteristics 4 in terms of concurrence 5 , 6 , 7 , 8 that are likely linked to the complex mechanism of epistatic gene interactions in SARS‐CoV‐2 viral evolution. Therefore, timely updates of SARS‐CoV‐2 mutations, especially critical SARS‐CoV‐2 mutations that are associated with patients' clinical information, including age, gender, and mortality status, has become a necessary and important step in the fight against COVID‐19. However, such investigations remain scarce due to limited clinical information along with whole‐genome sequences. 9 , 10 , 11
Following our previous report, 5 we analyzed a total of 146,045 SARS‐CoV‐2 high‐quality complete genomes downloaded from GISAID with collection dates after June 1, 2020. 12 The majority of SARS‐CoV‐2 genomes have evolved with a dominant SNV cluster represented by nonsynonymous mutations A23403G (S:D614G) and C14408T (ORF1ab:P4715L), in addition to C241T at the upstream of ORF1ab and another synonymous mutation C3037T on ORF1ab. According to two‐way clustering analysis on SNVs harbored by over 1% of SARS‐CoV‐2 genomes, additional SNVs were uncovered with increasing occurrence ratios over recent months. Even though two dominant amino acid (AA) changes, ORF1ab:P4715L and S:D614G variants, were reported to be strongly correlated with mortality, 9 their death rates have been relatively stable. Or at least they were not strongly correlated with occurrence ratios of these two mutations which were carried by over 99% of patients now. Therefore, we did a systematic analysis of geographical distributions of SNVs and their corresponding mortality rates. By performing enrichment analysis on 6845 SARS‐CoV‐2 genomes with clinical information, we identified multiple SNVs that were significantly over‐represented in different ages, or gender, or specifically related to COVID‐19‐associated mortality. In the meantime, the protein structure analysis on nonsynonymous SNVs showed clashes caused by mutations, which, in turn, might contribute to viral transmission and mortality. Some SNVs were also found with the tendency to occur in intrinsically disordered regions (IDRs) of Spike (S) protein and ORF1ab. Our findings may be helpful for a better understanding of the pathogenesis of SARS‐CoV‐2 at the genetic level, possibly providing insights into therapeutic intervention and vaccine design in the future.
2. MATERIALS AND METHODS
2.1. Data collection
SARS‐CoV‐2 genome sequencing data and available clinical information were downloaded from GISAID with the collection dates between December 2019 and November 20, 2020. A total of 146,045 high‐quality complete genomes were used for SNV analysis. It turned out that 40,172 and 36,844 samples had gender and age information, separately, while 6845 genomes came with clear death and deceased information after excluding samples marked with the ambiguous status of “unknown” or “cryptic.”
2.2. Enrichment analysis on age/gender/mortality associated SNVs
The samples with age information were divided by 20‐year bins into five groups, for example, “Under 20,” “20–39,” “40–59,” “60–79,” “At least 80.” For each SNV, we calculated its fold enrichment (FE) in individual age groups in the way of
where N i and S i are the total number of samples and the number of genomes carrying the SNV, S, in the ith group of ages, respectively. Using the hypergeometric model, 13 we evaluated the statistical significance of the SNV appearing at least S i times in the ith group. The p values were then modified based on false‐discovery rate (FDR) adjusted multiple test correction. The SNVs harbored by more than 100 samples with FE > 1.1 and FDR < 0.05 in a specific age group were defined as age‐specific SNVs for corresponding age.
Similar enrichment analysis was conducted on samples with gender information (two groups only), but with two‐tails for over‐representation in either the male or female group. The SNV carried by at least 100 samples was determined as a gender‐specific SNV if FDR < 0.05 and its FE > 1.1 in either the male or female group.
Candidate SNVs related to mortality were estimated based on their occurrence rates in the death and nondeath group. Enrichment analysis was conducted for each SNV in the same way that we did for the gender association study as above. The FE was calculated as the ratio of the rate in the death group vs that in the nondeath group for a specific SNV, indicating either over‐representation in the death group (FE > 2) or in the nondeath group (FE < 0.5). The statistical significance (p value) was evaluated based on the hypergeometric distribution model as well. 14
2.3. Logistic regression model
To explore the correlation between different features and mortality status, the logistic regression model was adopted for feature analysis on clinical information and SNVs by using the R glm function. 15 , 16 , 17 , 18 , 19 We selected age, gender, and SNVs related to mortality as the independent variables while the patient mortality status was chosen as the dependent variable in the logistic regression model. The significance cutoff was set as p < 0.001 to identify the variable‐related features with coefficients from the logistic regression model.
2.4. Protein structure analysis
We selected PyMOL 20 , 21 , 22 to analyze and visualize protein structures for WT (Wuhan‐Hu‐1) and mutated proteins with identified nonsynonymous SNVs. Mutagenesis tools in PyMOL were utilized to detect if a clash was generated upon the mutation. Properties of AAs and corresponding hydrophobicity scales were retrieved from the “Table of standard amino acid abbreviations and properties” on Wikipedia accessed on November 20, 2020. The solved structures of S, nsp12, and nsp7 were downloaded from Protein Data Bank (PDB) 23 : 6vyb for S using electron microscopy, 24 6m71 for nsp7, nsp12 using electron microscopy. 25 Structures of other proteins/regions, for example, incomplete regions of S, ORF3a, ORF10, and N, were predicted by the C‐I‐Tasser model 26 , 27 , 28 : QHD43416 for S, QHD43417 for ORF3a, QHI42199 for ORF10, and QHD43423 for N. Hypergeometric test was used to evaluate the statistical significance whether nonsynonymous SNVs tend to occur in IDR compared to the whole protein region. Statistical differences of hydrophobicity scales of residues before and after mutations were calculated using the Wilcoxon test.
3. RESULTS
3.1. Emerging SNV clusters with temporal occurrence patterns
Previously, we discovered four major SNV groups according to the analysis of SNVs in genomes collected before June 2020. 5 Here we analyzed 81,042 more SARS‐CoV‐2 complete genomes from the GISAID database following the exclusion of low‐coverage genomes. Wuhan‐Hu‐1 (NCBI Reference Sequence: NC_045512.2) was used as the reference genome to keep consistency. 5 A total of 20,477 nucleotide sites were identified to carry SNVs in at least one genome. Among them, 52 SNVs occurring in greater than 3% of genomes were used for two‐way clustering in the study.
The clustering pattern of SNVs after June 2020 (Figure 1A) was distinct from the one before June 2020. 5 Before June 2020, four major groups of basically independent SNVs were linked to the majority of SARS‐CoV‐2 genomes. It is not surprising to see that group A of SNVs has prevailed since June 2020, represented by A23403G (S:D614G) and C14408T (OFR1ab:P4715L). 5 This SNV group encompassed over 99% of genomes that harbored at least one of 52 SNVs, confirming continuity of variant D614G on S protein. 29 , 30 , 31 , 32 The group C featured by SNVs G11083T and G26144T disappeared, being detected in only 53 genomes after June 2020. Meanwhile, Group B (T28144C, n = 199) and Group D (G1440A/G2891 A, n = 7) 5 nearly diminished in newly collected SARS‐CoV‐2 genomes. Interestingly, most SNVs in Figure 1A were identified for the first time before June 2020 (black boxes in Figure 1B), but their occurrence ratios gradually increased to higher levels after several months (blue‐filled boxes in Figure 1B). This phenomenon might suggest potential incubation periods of SNVs during SARS‐CoV‐2 evolution.
Figure 1.
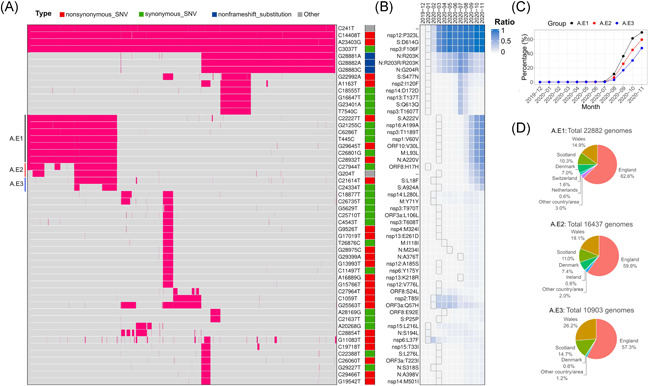
SNVs identified in more than 3% of SARS‐CoV‐2 genomes after June 1, 2020. (A) Two‐way clustering of 52 high frequent SNVs with possible annotated AA changes in 76,926 genomes worldwide. (B) Monthly occurrence ratios of corresponding SNVs. (C) Temporal patterns of the emerging groups A.E1, A.E2, and A.E3. (D) Geographical distributions of emerging SNVs in groups A.E1–3, respectively. AA, amino acid; SNV, single nucleotide variant
A few additional SNVs have become dominant recently (Figure 1B,C). For example, group A.E1 included four other synonymous mutations (G21255C, T445C, C6286T, and C26801G), and three nonsynonymous mutations, C22227T (S:A222V), G29645T (ORF10:V30L), C28932T (N:A220V), on proteins S, N, and ORF10, respectively. All of them were identified in March 2020 for the first time in several countries, for example, Spain, England, Australia, and the United States. This SNV group has gradually become dominant since the summer of 2020 (Figure 1C). Their occurrence ratios were significantly elevated from 10% in August to 70% in November 2020. Almost 88% of 22,882 genomes with this group of SNVs (A.E1) were detected in England, Scotland, and Wales. The remaining 12% were identified in north European countries, for example, Denmark (7%) and Switzerland (1.6%) (Figure 1D).
In group A.E2, synonymous SNV C27944T (ORF8:H17H) was detected in China in January 2020 for the first time, whereas the other one G204T located upstream of ORF1ab was identified in the United States in March 2020. Although C27944T on ORF8 is a synonymous mutation, it falls in a stem‐loop structure of ORF8 messenger RNA which may influence ORF8 translation. 33 , 34 The A.E2 group had a very similar temporal pattern to that of A.E1, both presenting high incidence ratios in November 2020 (Figure 1C,D).
Two more SNVs on S, C21614T (S:L18F) and C24334T (S:A924A), were identified in group A.E3. S:L18F was found lurking in humans since February 2020 in England. The origin of S:A924A can be traced back to Japan in March 2020. Similar to A.E1 and A.E2 groups, the occurrence ratio of A.E3 soared up quickly since August 2020 (Figure 1C). They were carried by about 48% of new SARS‐CoV‐2 genomes collected in November. Although over 98% of these SNVs were found in England, we also observed 0.6% in Denmark.
3.2. Association between SNVs and clinical information
It is worth investigating the preference of SARS‐CoV‐2 mutations in different age groups which can be helpful to understand the transmission of the virus with different variants in age‐diverse communities. We divided samples into five groups, “Under 20,” “20–39," “40–59,” “60–79,” and “At least 80.” Approximately 65% of collected samples were between 20 and 59 years old (Figure 2A). Our analysis revealed that 114 SNVs were significantly over‐represented in different ages (see Section 2 for details, Figure 2B,C). Twenty‐seven SNVs were enriched across two groups of different ages (Figure 2B), for instance, three consecutive SNVs at 28881–28883 were enriched in the population younger than 40 years old, while C12053T (ORF1ab:L3930F) and several other SNVs preferred in the group older than 60. It is interesting to see several SNVs were over‐represented in both the younger group (age: 20–39) and the oldest group (age: at least 80). But the majority of age‐specific SNVs were focused on only one age group (Figure 2C). Only 4 SNVs, including G21724T (S:L54F), C27046T (M:T175M), C2836T (nsp3:C39C), and C22444T (S:D294D), were notably enriched in the age between 40 and 59, even though this group had second largest population. Overall, 47.75% of 40,172 samples were female. We identified 22 and 20 SNVs over‐represented in male and female (Figure 2D), respectively, with FDR < 0.05 (Figure 2E). Surprisingly, 35 out of 42 SNVs were age‐specific as well.
Figure 2.
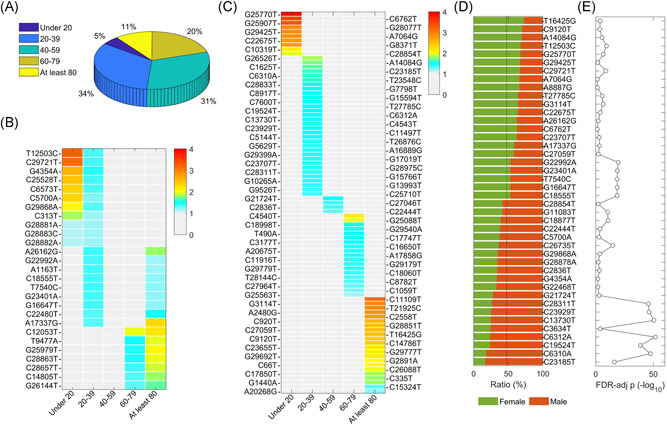
SNVs specific to the age and the gender. (A) Sample distribution for five age groups. (B) SNVs significantly over‐represented in at least two age groups. (C) SNVs enriched in one age group. (D) SNVs specific to the gender with ratios in the female and male. (E) Statistical significances of SNVs specific to the gender in (D) represented by FDR‐adjusted p values (−log 10). FDR, false‐discovery rate; SNV, single nucleotide variant
To investigate the association between SARS‐CoV‐2 SNVs and the mortality rate, we analyzed a total of 6845 genomes with patient death/deceased status retrieved from GISAID. Among them, 665 samples (9.7%) were defined as death group with keywords “death”/“deceased”/“Hospitalized, deceased” in the clinical information, while the nondeath group contains 6180 genomes with all the other patient statuses. The monthly mortality rate kept an increasing tendency from December 2019 to April 2020 with a peak death ratio of 18.5% and mainly decreased in the following months (Figure 3A). The mortality rates seemed independent of the total number of collected patient samples. To avoid bias from countries/areas with fewer cases of death, we analyzed a total of 2765 samples from countries with at least 10 death samples. By comparing SNV occurrence frequencies between the death and nondeath groups, we identified 71 mortality‐related SNVs. Forty and thirty SNVs were identified from at least 10 dead patients and at least twofold significantly (p < 0.01) enriched in the death group (Figure 3B) and the nondeath group (Figure 3C), respectively.
Figure 3.
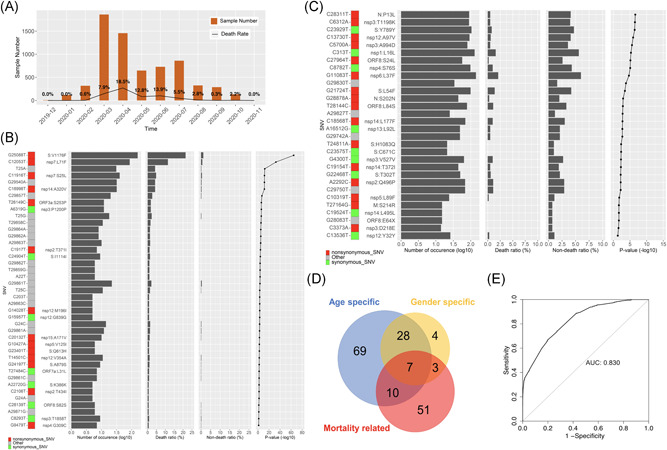
Morality related SNVs. (A) Number of SARS‐CoV‐2 samples and death ratio for each month in the study. (B) Forty‐one SNVs significantly over‐represented in the death group with corresponding total numbers of occurrences, ratios in the death and nondeath groups, and enrichment p value. (C) ThirtySNVs significantly enriched in the nondeath group with corresponding total numbers of occurrences, ratios in the death and nondeath groups, and p value. (D) Overlap of SNVs specific to the age, gender, and mortality. (E) ROC curve of logistic regression model to predict mortality. SNV, single nucleotide variant
It is interesting to see remarkable overlap between three groups of SNVs, which are specific to age, gender, or significantly associated with mortality (Figure 3D). Seven SNVs were identified in all three groups, C5700A (nsp3:A994D), C6312A (nsp3:T1198K), C13730T (nsp12:A97V), C23929T (S:Y789Y), C28311T (ORF9:P13L), C19524T (nsp14:L495L), and G21724T (S:L54F). All of them were enriched in the male and nondeath groups but in different age groups, for example, C5700A (nsp3:A994D) and G21724T (S:L54F) were over‐represented in the group under 20 and 40–59, respectively, while the other five SNVs tended to be in the group of 20–39 years old. There were another three SNVs specific to males with a strong connection to the mortality, G11083T (nsp6:L37F), G28878A (ORF9:S202N), and G22468T (S:T302T), which all were enriched in the nondeath group. Ten SNVs were specific to the age and mortality but independent of the gender, including G25088T (S:V1176F), C12053T (nsp7:L71F), C11916T (nsp7:S25L), C18998T (nsp14:A320V), and G29540A which were enriched in the death group as well as in aged groups from 60 to 79 and at least 80‐year‐old.
The logistic regression model was applied to integrate impacts of SNVs enriched in either the death or nondeath group with those from the age and gender. After nonsignificantly correlated features (p > 0.001) were filtered out, the logit of the death event can be predicted based on the following features: three SNVs enriched in death group, including G25088T(S:V1176F), T27484C (ORF7a:L31L), and T25A (upstream of ORF1ab), three age groups above 40 years old, as well as the gender male in the way that
where stands for the ith feature (either 1 or 0). All these features increase the probability of the death event. Comparing to other features, the gender of male has a significant but minor contribution to the model. The result was in general consistent with our observations. For example, the effect of age at least 80‐year‐old was 1.5 as great as the effect of age between 40 and 59 on the log‐odds. Any single feature can't have a determining effect on death. In other words, at least two or more major features together are expected to remarkably increase the death probability, for example, aged people with mutation T27484C may have a 91% probability of death given such a linear combination of the predictors. The model shows high accuracy with an area under the curve (AUC) of 0.830 (Figure 3E).
3.3. Protein structure variations due to SNVs
Four SNVs in groups A.E1–A.E3 are nonsynonymous variants, including ORF10:V30L (G29645T), N:A220V (C28923T), and two on S protein, A222V (C22227T) and L18F (C21614T) (Figure 1A). The protein structure modeling revealed that all of them were on the surface area of corresponding proteins. Through mutagenesis analysis, the changes in the AAs at these sites were all incurring clashes illustrated by red disks with nearby residues (Figure 4A–D), with potential impacts on protein configuration. For example, N: A220V was located at the bottom of a pocket. Mutation to Valine resulted in a more hydrophobic state which may affect potential binding activity on the site. Such changes in protein conformation may also affect virus pathogenesis or vaccine response through interacting proteins.
Figure 4.
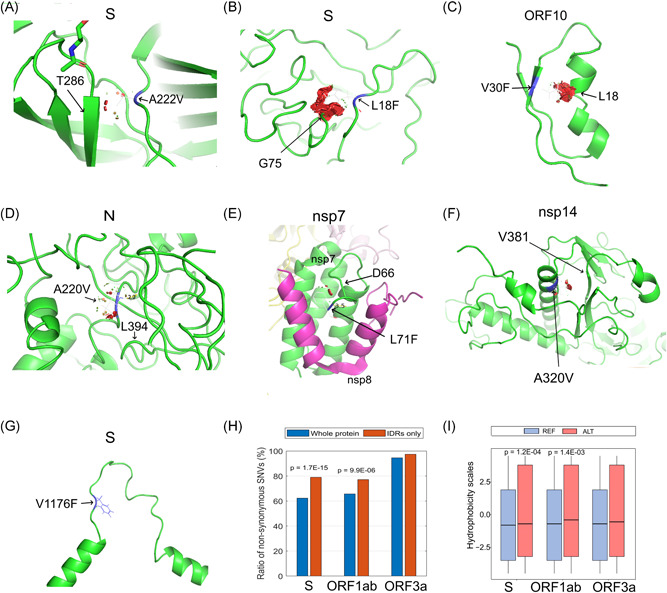
Protein structure variation caused by selected nonsynonymous SNVs. (A) S:A222V, (B) S:L18F, (C) ORF10:V30F, (D) N:A220V, (E) nsp7:L71F, (F) nsp14:A320V, (G) S:V1176F, (H) Ratios of nonsynonymous SNVs in the whole region or IDR of proteins, S, ORF1ab, and ORF3a, (I) Hydrophobic scores before (REF) and after alternations (ALT) of nonsynonymous SNVs in the IDRs of proteins, S, ORF1ab, and ORF3a. SNV, single nucleotide variant
Similarly, some of the nonsynonymous SNVs significantly over‐represented in the death group also caused clashes with nearby residues. For example, the mutation on nsp7:L71F (C12053T) might clash with D66 (Figure 4E), in addition to nsp14:A320V (C18998T) with V381 (Figure 4F), ORF3a:S253P (T26149C) with I249, nsp12:V354A (T14501C) with V299 and L351, and nsp7:S25L (C11916T) with L28. These variants also occurred on protein surface area. Consequently, the clashes may affect their pathogenesis or vaccine response, suggesting contributions to a higher mortality rate. Interestingly, mutation S:V1176F (G25088T) was in the loop structure of two α‐helix in the C‐terminal of S (Figure 4G), causing increased mass. This may have impacts on the protein structure which is necessary for virus entry into the host cell.
IDR in a protein represents an unfixed or disordered three‐dimensional structure due to the lack of sufficient hydrophobic AAs. 35 , 36 The hydrophobic effect is a driving force of protein folding. The AA alternation in the IDR may influence the IDR conformational state, further resulting in variations of functional elements within IDRs and protein function alteration. IDRs determined from experiments cover 28.0% of S protein sequence, 27.6% of ORF3a protein sequence, and 3.8% of ORF1ab polyprotein respectively. 35 , 36 Nonsynonymous SNVs were found on approximately 62.3%, 65.7%, and 94.6% of S, ORF1ab, and ORF3a, respectively (Figure 4H). Significantly higher SNV occurrence ratios were observed in IDRs of S (79.0%, p = 1.7 × 10⁻¹⁵) and ORF1ab (77.1%, p = 9.9 × 10⁻⁶), but not in IDR of ORF3a (97.4%, p = 0.12). Furthermore, these nonsynonymous mutations significantly increased hydrophobicity 37 in IDRs of S (p = 1.2 × 10⁻⁴) and ORF1ab (p = 1.4 × 10⁻³), but not in ORF3a (p = 0.14) (Figure 4I). It has been reported that G22992A (S:S477N) was in the S protein receptor‐binding domain (RBD), which is a flexible and disordered loop in the unbound state but later becomes ordered in all the available ACE2‐bound SARS‐CoV‐2 S structures. 38 The increased mass upon mutation from S to N may affect the flexibility of this region and the binding of S protein to ACE2. Another mutation C21614T (S:L18F) in the emerging group A.E3 SNV is located in N‐linked glycan sites, which likely play a role in protein folding and immune evasion and may have implications in viral virulence and vaccine design. 39 Other mutations in IDRs of S, for example, C21575T (L5F), G25049T (D1163Y), G25062T (G1167V), are located nearby N‐linked glycan sites (11, 1, and 5 residues, respectively). They may have impacts on glycosylation which in turn play a role in protein folding and immune evasion.
4. DISCUSSION
In this study, we monitored group structure changes of SARS‐CoV‐2 SNVs over time by comparing clustering results before and after June 2020. The representative SNVs in group A 5 had become dominant by covering over 99% of detected SARS‐CoV‐2 genomes since June 2020, while two other groups (B and D) were detected in less than 0.3% of the population. The occurrence ratio of group C SNVs was also reduced compared to the previous result before June 2020. 5 Although the majority of groups A and C SNVs were observed to be mutually exclusively with each other before June 2020, 95% of genomes harboring the representative SNV in the group C, G11083T (ORF1ab:L3606F), also carried group A SNVs after June 2020, confirming the ruling role of group A in current SARS‐CoV‐2 genomes. Several emerging SNVs, for example, groups A.E1‐E3, co‐occurred with group A representative SNV, S:D614G, in the UK and other Northern European countries (Figure 1B,C). The incidence rates of these subgroup SNVs had increased quickly since August 2020. For example, the occurrence ratios of group A.E1 SNVs, represented by C22227T (S:A222V), G29645T (ORF10:V30L), and C28932T (N:A220V), increased from 10% in August to 70% in November 2020, while the occurrence ratios of group A.E2, C27944T and G204T, and group A.E3, C21614T (S:L18F) and C24334T, elevated to about 60% and 50%, respectively, during the same time period. However, these SNVs were not new at all because they were observed for the first time during February and March in 2020, several months before when their incidences soared up. This suggests a potential incubation period for SARS‐CoV‐2 dominant SNVs during the evolution. The results also indicate that these SNV groups might make the virus more contiguous. Our systematic study revealed that apart from the A.E1–3, more SNV groups occurred more than 3% of the SARS‐CoV‐2 genomes with distinct temporal patterns, even though some of them did not clearly show an increasing temporal trend until November 2020 (Figure 1). Caution should be taken to monitor these SNVs with collectively dynamic changes.
In December 2020, a set of 23 changes or mutations (VUI‐202012/01) were found to possibly drive infections in the UK. 40 , 41 The set of signature variants includes 8 changes from S protein: deletion 69–70, deletion 144–145, N501Y (A23063T), A570D (C23271A), D614G, P681H (C23604A), T716I (C23709T), S982A (T24506G), D1118H (G24914C). Viruses with these mutations were reported to be up to 70% more transmissible than previous strains, although there was “considerable uncertainty” and “no evidence” that these variants were more lethal or could render vaccines and treatments useless. 42 These SNVs occurred independently before November 2020 without causing significantly higher viral transmission. This might suggest that the collective mutations from these SNVs may speed up COVID‐19 transmission.
With the integration of the clinical information, 114 SNVs were identified to be specific to age groups. Except 27 out of them enriched across two groups of different ages, the majority was specific to one age group. Forty‐two SNVs showed significantly high occurrence rates in either males or females. We further identified 41 and 30 SNVs with at least twofold higher occurrence rates in the death and nondeath group, respectively, including several mutations on the S protein, for example, G25088T (S:V1176F), G23401T (S:Q613H), G24197T (S:A879S), and T24811A (S:1083Q). Moreover, seven SNVs over‐represented in the male were also specific to the age and mortality, including C5700A (nsp3:A994D), C6312A (nsp3:T1198K), C13730T (nsp12:A97V), C23929T (S:Y789Y), C28311T (ORF9:P13L), C19524T (nsp14:L495L), and G21724T (S:L54F).
The logistic regression model used to predict mortality status explored that three critical nonsynonymous SNVs, S:V1176F, ORF7a:L31L, and T25A at the upstream of ORF1ab, in addition to ages above 40 years old, and the gender of male may have significant contributions to the death event. It is not surprising to see that these SNVs enriched in the death group increased the mortality probability. The results of age groups were consistent with observations that elder people had a higher risk of death associated with COVID‐19. The smaller coefficient for the male in the model indicates a minor but un‐neglectable impact on mortality. Of course, the limitation of well‐defined clinical information or even some incorrect details may have and impact on our results. Further studies with more accurate data and evidence collected are under investigation.
The protein structure analysis of emerging SNVs in groups A.E1–3 and selected mortality‐associated SNVs demonstrated that all of these mutations occurred on the protein surface area. Some clashes introduced upon mutation may contribute to a higher level of transmission and even mortality rate. Further investigation of IDRs on S and ORF1ab protein showed that nonsynonymous SNVs tended to appear in IDRs, suggesting the connections between IDRs of S and ORF1ab and their protein conformation and functions. A more in‐depth study to understand these effects may help therapeutic intervention and vaccine design.
CONFLICT OF INTERESTS
The authors declare that there are no conflict of interests.
AUTHOR CONTRIBUTIONS
Sheng Liu, Jikui Shen, Lei Yang, Chang‐Deng Hu, and Jun Wan initiated and designed the studies. Shuyi Fang, Sheng Liu, and Jun Wan performed analyses on sequence alignment, annotation, modeling, and protein structure. Alex Lu, Audrey Wang, Yucheng Zhang, Kailing Li, and Juli Liu conducted data mining on published results and assisted in data analysis. Shuyi Fang, Sheng Liu, Alex Lu, Audrey Wang, Lei Yang, Chang‐Deng Hu, and Jun Wan interpreted the results and wrote the manuscript. Jun Wan supervised the whole research and provided guidance. All authors reviewed/finalized the manuscript and approved the submission of the article.
ACKNOWLEDGEMENTS
Special thanks to researchers for depositing whole genomic sequences of Novel Pneumonia Coronavirus (SARS‐CoV‐2/hCoV‐19/2019‐nCoV) at the Global Initiative on Sharing All Influenza Data (GISAID) EpiFluTM. We are thankful for the technical support from the GISAID in downloading the SARS‐CoV‐2 genomes. We appreciate the helpful discussion with Dr. Yong Zang at Indiana University School of Medicine. This study was partially supported by the National Institutes of Health (P30CA082709 to J.W.); the Walther Cancer Foundation; the Indiana University Precision Health Initiative (PHI); and the Center for Computational Biology and Bioinformatics (CCBB) at the Indiana University School of Medicine (Pilot grant to L.Y. and J.W.).
Fang S, Liu S, Shen J, et al. Updated SARS‐CoV‐2 Single Nucleotide Variants and Mortality Association. J Med Virol. 2021;93:6525‐6534. 10.1002/jmv.27191
Shuyi Fang and Sheng Liu have equal contributions.
DATA AVAILABILITY STATEMENT
The release of original data must be permitted by GISAID based on the agreements. However, analyzed results can be found and downloaded from the website, https://shiny.ph.iu.edu/GESS/
REFERENCES
- 1. Medicine JHU . Coronavirus Resource Center—Global Map. https://coronavirus.jhu.edu/map.html
- 2. van Dorp L, Acman M, Richard D, et al. Emergence of genomic diversity and recurrent mutations in SARS‐CoV‐2. Infect Genet Evol. 2020;83:104351. [DOI] [PMC free article] [PubMed] [Google Scholar]
- 3. Islam MR, Hoque MN, Rahman MS, et al. Genome‐wide analysis of SARS‐CoV‐2 virus strains circulating worldwide implicates heterogeneity. Sci Rep. 2020;10:14004. [DOI] [PMC free article] [PubMed] [Google Scholar]
- 4. Yang HC, Chen CH, Wang JH, et al. Analysis of genomic distributions of SARS‐CoV‐2 reveals a dominant strain type with strong allelic associations. Proc Natl Acad Sci USA. 2020;117:30679‐30686. [DOI] [PMC free article] [PubMed] [Google Scholar]
- 5. Liu S, Shen J, Fang S, et al. Genetic Spectrum and Distinct Evolution Patterns of SARS‐CoV‐2. Front Microbiol. 2020;11:593548. [DOI] [PMC free article] [PubMed] [Google Scholar]
- 6. Ugurel OM, Ata O, Turgut‐Balik D. An updated analysis of variations in SARS‐CoV‐2 genome. Turkish Journal of Biology. 2020;44:157‐167. [DOI] [PMC free article] [PubMed] [Google Scholar]
- 7. Khailany RA, Safdar M, Ozaslan M. Genomic characterization of a novel SARS‐CoV‐2. Gene Rep. 2020;19:100682. [DOI] [PMC free article] [PubMed] [Google Scholar]
- 8. Fang S, Li K, Shen J, et al. GESS: a database of global evaluation of SARS‐CoV‐2/hCoV‐19 sequences. Nucleic Acids Res. 2021;49:D706‐D714. [DOI] [PMC free article] [PubMed] [Google Scholar]
- 9. Toyoshima Y, Nemoto K, Matsumoto S, Nakamura Y, Kiyotani K. SARS‐CoV‐2 genomic variations associated with mortality rate of COVID‐19. J Hum Genet. 2020;65:1075‐1082. [DOI] [PMC free article] [PubMed] [Google Scholar]
- 10. Majumdar P, Niyogi S. ORF3a mutation associated with higher mortality rate in SARS‐CoV‐2 infection. Epidemiol Infect. 2020;148:e262. [DOI] [PMC free article] [PubMed] [Google Scholar]
- 11. Hahn G, Wu CM, Lee S, et al. Two mutations in the SARS‐CoV‐2 spike protein and RNA polymerase complex are associated with COVID‐19 mortality risk. bioRxiv 2020. 2020:386714. [Google Scholar]
- 12. Shu Y, McCauley J. GISAID: Global initiative on sharing all influenza data—from vision to reality. Euro Surveill. 2017;22:22. [DOI] [PMC free article] [PubMed] [Google Scholar]
- 13. Rivals I, Personnaz L, Taing L, Potier MC. Enrichment or depletion of a GO category within a class of genes: which test? Bioinformatics. 2007;23:401‐407. [DOI] [PubMed] [Google Scholar]
- 14. Johnson NL, Kotz S, Kemp AW. Univariate Discrete Distributions. New York, NY: Wiley; 1992. [Google Scholar]
- 15. Dobson AJ. An Introduction to Generalized Linear Models. London: Chapman and Hall; 1990. [Google Scholar]
- 16. Hastie TJaP D. Generalized linear models. Wadsworth & Brooks/Cole; 1992.
- 17. McCullagh P, Nelder JA. Generalized Linear Models. London: Chapman and Hall; 1989. [Google Scholar]
- 18. Venables WNaR, B. D. Modern Applied Statistics with S. New York, NY: Springer; 2002. [Google Scholar]
- 19. R Core Team. RFfSC. R: A Language and Environment for Statistical Computing; 2019.
- 20. Schrodinger, LLC . The AxPyMOL Molecular Graphics Plugin for Microsoft PowerPoint, Version 1.8; 2015.
- 21. Schrodinger, LLC . The PyMOL Molecular Graphics System, Version 1.8; 2015.
- 22. Schrodinger, LLC . The JyMOL Molecular Graphics Development Component, Version 1.8; 2015.
- 23. Berman H, Henrick K, Nakamura H. Announcing the worldwide Protein Data Bank. Nat Struct Biol. 2003;10:980. [DOI] [PubMed] [Google Scholar]
- 24. Walls AC, Park YJ, Tortorici MA, Wall A, McGuire AT, Veesler D. Structure, function, and antigenicity of the SARS‐CoV‐2 spike glycoprotein. Cell. 2020;181(281‐292):e286‐e292. [DOI] [PMC free article] [PubMed] [Google Scholar]
- 25. Gao Y, Yan L, Huang Y, et al. Structure of the RNA‐dependent RNA polymerase from COVID‐19 virus. Science. 2020;368:779‐782. [DOI] [PMC free article] [PubMed] [Google Scholar]
- 26. Yang J, Yan R, Roy A, Xu D, Poisson J, Zhang Y. The I‐TASSER Suite: protein structure and function prediction. Nat Methods. 2015;12:7‐8. [DOI] [PMC free article] [PubMed] [Google Scholar]
- 27. Huang X, Pearce R, Zhang Y. De novo design of protein peptides to block association of the SARS‐CoV‐2 spike protein with human ACE2. Aging. 2020;12:11263‐11276. [DOI] [PMC free article] [PubMed] [Google Scholar]
- 28. Zhang C, Zheng W, Huang X, Bell EW, Zhou X, Zhang Y. Protein structure and sequence reanalysis of 2019‐nCoV genome refutes snakes as its intermediate host and the unique similarity between its spike protein insertions and HIV‐1. J Proteome Res. 2020;19:1351‐1360. [DOI] [PMC free article] [PubMed] [Google Scholar]
- 29. Yurkovetskiy L, Wang X, Pascal KE, et al. SARS‐CoV‐2 Spike protein variant D614G increases infectivity and retains sensitivity to antibodies that target the receptor binding domain. bioRxiv. 2020.
- 30. Zhang L, Jackson CB, Mou H, et al. The D614G mutation in the SARS‐CoV‐2 spike protein reduces S1 shedding and increases infectivity. bioRxiv. 2020.
- 31. Eaaswarkhanth M, Al Madhoun A, Al‐Mulla F. Could the D614G substitution in the SARS‐CoV‐2 spike (S) protein be associated with higher COVID‐19 mortality? Int J Infect Dis. 2020;96:459‐460. [DOI] [PMC free article] [PubMed] [Google Scholar]
- 32. Li Q, Wu J, Nie J, et al. The impact of mutations in SARS‐CoV‐2 Spike on viral infectivity and antigenicity. Cell. 2020;182(1284):1284‐1294. [DOI] [PMC free article] [PubMed] [Google Scholar]
- 33. Gruber AR, Lorenz R, Bernhart SH, Neuböck R, Hofacker IL. The Vienna RNA websuite. Nucleic Acids Res. 2008;36:W70‐W74. [DOI] [PMC free article] [PubMed] [Google Scholar]
- 34. Lorenz R, Bernhart SH, Höner Z, et al. ViennaRNA Package 2.0. Algorithms Mol Biol. 2011;6:26. [DOI] [PMC free article] [PubMed] [Google Scholar]
- 35. Hatos A, Hajdu‐Soltész B, Monzon AM, et al. DisProt: intrinsic protein disorder annotation in 2020. Nucleic Acids Res. 2020;48:D269‐d276. [DOI] [PMC free article] [PubMed] [Google Scholar]
- 36. Piovesan D, Tabaro F, Mičetić I, et al. DisProt 7.0: a major update of the database of disordered proteins. Nucleic Acids Res. 2017;45:D219‐d227. [DOI] [PMC free article] [PubMed] [Google Scholar]
- 37. Kyte J, Doolittle RF. A simple method for displaying the hydropathic character of a protein. J Mol Biol. 1982;157:105‐132. [DOI] [PubMed] [Google Scholar]
- 38. Wrapp D, Wang N, Corbett KS, et al. Cryo‐EM structure of the 2019‐nCoV spike in the prefusion conformation. Science. 2020;367:1260‐1263. [DOI] [PMC free article] [PubMed] [Google Scholar]
- 39. Watanabe Y, Allen JD, Wrapp D, McLellan JS, Crispin M. Site‐specific glycan analysis of the SARS‐CoV‐2 spike. Science. 2020;369:330‐333. [DOI] [PMC free article] [PubMed] [Google Scholar]
- 40. Wise J. Covid‐19: New coronavirus variant is identified in UK. BMJ. 2020;371:m4857. [DOI] [PubMed] [Google Scholar]
- 41.PHE: Meera Chand SH, Gavin Dabrera, Christina Achison; Imperial, College London: Wendy Barclay NF, Erik Volz; University of Wellcome BNLUoEAR et al. Investigation of novel SARS‐COV‐2 variant. England PH (ed). 2020.
- 42.Covid: WHO in 'close contact' with UK over new virus variant. https://www.bbc.com/news/world-55382212
Associated Data
This section collects any data citations, data availability statements, or supplementary materials included in this article.
Data Availability Statement
The release of original data must be permitted by GISAID based on the agreements. However, analyzed results can be found and downloaded from the website, https://shiny.ph.iu.edu/GESS/