Abstract
The mortality risk factors for coronavirus disease (COVID‐19) must be early predicted, especially for severe cases, to provide intensive care before they develop to critically ill immediately. This paper aims to develop an optimized convolution neural network (CNN) for predicting mortality risk factors for COVID‐19 patients. The proposed model supports two types of input data clinical variables and the computed tomography (CT) scans. The features are extracted from the optimized CNN phase and then applied to the classification phase. The CNN model's hyperparameters were optimized using a proposed genetic‐based adaptive momentum estimation (GB‐ADAM) algorithm. The GB‐ADAM algorithm employs the genetic algorithm (GA) to optimize Adam optimizer's configuration parameters, consequently improving the classification accuracy. The model is validated using three recent cohorts from New York, Mexico, and Wuhan, consisting of 3055, 7497,504 patients, respectively. The results indicated that the most significant mortality risk factors are: CD T Lymphocyte (Count), D‐dimer greater than 1 Ug/ml, high values of lactate dehydrogenase (LDH), C‐reactive protein (CRP), hypertension, and diabetes. Early identification of these factors would help the clinicians in providing immediate care. The results also show that the most frequent COVID‐19 signs in CT scans included ground‐glass opacity (GGO), followed by crazy‐paving pattern, consolidations, and the number of lobes. Moreover, the experimental results show encouraging performance for the proposed model compared with different predicting models.
Keywords: artificial intelligence, classification algorithms, deep learning, evolutionary computation, genetic algorithms, hybrid intelligent systems, medical diagnostic, predictive model
1. INTRODUCTION
The outbreak of the coronavirus disease 2019 (COVID‐19) caused worldwide health fears; the virus causes serious respiratory difficulties, leading to patients' decease. 1 On March 11, 2020, the World Health Organization (WHO) declared it as an international pandemic. 2 On September 30, 2020, WHO reported 33 916 696 confirmed cases and 1 013 879 deaths worldwide. 3 The real numbers are probably much higher as a result of lack in reporting and making the tests. The severe growth in coronavirus disease (COVID‐19) infections has set stress on healthcare structures; there is a crucial need for a better understanding of the pathogenesis of this syndrome to accurately triage patients. Moreover, recent studies 4 have shown a shocking mortality rate of 62% for critically ill cases and growing with age and patients with severe respiratory tract symptoms. Recent studies 5 refer that it is likely to reappear a second wave for the virus that needs to be early monitored. The severity of COVID‐19 cases 6 , 7 is putting excessive stress on medical structures to provide the appropriate diagnosis and treatments early. Unfortunately, at present, there are no available procedures to differentiate patients that need immediate medical care and to determine their mortality rate.
Moreover, the pathological data and clinical risk factors of COVID‐19 are rare. Due to the limited number of expert clinicians and radiologists, the hospital and medical centers need artificial intelligence‐based models to analyze the clinical, laboratory, and radiological characteristics and predict mortality risk factors in severe COVID‐19 patients. Different studies 8 , 9 , 10 have been made to predict different mortality risk factors including procalcitonin (PCT), low platelet counts, D‐dimer, and lactate dehydratase (LDH). The results obtained might be restricted statistically biased due to the limited size of the cohort used and due to the lack of generalization. Given these challenges, devolving tools that can identify the mortality risk factors of COVID‐19 cases from large and recent cohorts of patients is an urgent need, which could be helpful for healthcare workers for taking the appropriate decision regarding the provided treatment regimes. In this context, this paper presents an optimized deep learning inspired model (ODL‐COVID) for predicting risk factors for mortality of COVID‐19 patients, based on CNN, for three different recent cohorts from New York, Mexico, and Wuhan, consisting of 3055, 7497, and 504 patients, respectively. Deep learning (DL) techniques are used to create end‐to‐end models to achieve promising results using input data, without using the feature extraction techniques. DL techniques, 9 , 10 , 11 , 12 especially the convolutional neural networks (CNNs), have been commonly used in diagnosing, predicting, and classifying COVID‐19 clinical variables, X‐ray, and CT images. Even though the original CNNs have verified promising performance in predicting and diagnosing medical data, different parameters need to be optimized. To improve the performance of CNN, a new optimization algorithm named genetic‐based adaptive momentum estimation (GB‐ADAM) is proposed, in the deep learning phase, which integrates the genetic algorithm (GA), 13 as an evolutionary computation algorithm, with Adam optimizer 14 to optimize the learning phase. It is used for backpropagation and automatically updates the weights of CNN. ODL‐COVID model is proposed to employ different AI techniques to improve the prediction purpose of the model.
The main significance of the paper is as follows:
The ODL‐COVID model is used to predict the risk factors for mortality of patients with COVID‐19. The model is validated using three recent cohorts from different geographic areas, which will help healthcare workers figure out the features of the COVID‐19's second wave and provide immediate medical interaction for severe cases with high‐risk factors. ODL‐COVID discovers different variances for risk factors, even at earlier phases than clinicians.
Using the deep learning technique in the model gives the ability to analyze a larger number of cohorts and investigate different data formats (clinical variables and CT images) for the training phase. Also, it eliminates the low positive rates caused by limited data, as it retains thousands of information from less known objects.
Unlike most of the CNN models presented, this study proposes a new CNN architecture for extracting the deep factors from COVID‐19 datasets, which is not a pre‐trained model. It is trained from scratch using six different layers: four convolution layers, four max pooling layers, four exponential linear units (ELUs) layers, three fully connected layers, two dropout layers, and one output layer Softmax. These layers, described later in detail, have guaranteed an effective and fast extraction of COVID‐19's features, and promising results were achieved.
The optimized trained CNN model's extracted features have been applied as the input to the classification phase for training. The classification phase classifies the mortality risk factors based on these extracted features, using different classifiers, which are support vector machine (SVM), naive Bayes (NB), and discriminant analysis (DA). ODL_COVID selects the classifier with higher accuracy and minor classification error obtained.
A genetic‐based adaptive momentum estimation (GB‐ADAM) algorithm is proposed to optimize the hyperparameters used by the Adam optimizer in the CNN model's learning phase, consequently improving the classification accuracy.
The proposed model is validated using three recent cohorts from different locations to ensure the model's generalization. Also, it has been found that the most common COVID‐19 signs in CT scans included ground‐glass opacity GGO, followed by crazy‐paving patterns, consolidations, and the number of lobes. The results proved that the ODL‐COVID model could handle large volumes of data with a minor learning cost.
ODL‐COVID identifies the most significant predictors among many clinical and laboratory features (11 056 patients with 141 features/each). The results obtained from the prediction model are validated by comparing its performance with different prediction models: standard CURB‐65 score, 15 DL‐COVID, 9 and deep learning survival Cox. 10
A consistent AI‐based model has been presented for COVID‐19 risk factors prediction to help clinicians and radiologists speedily prioritize the patients with high‐risk factors when there are limitations in medical resources. Taking earlier decisions will save patient lives, specifically during the pandemic.
The paper is structured as follows: Section 2 shows some preliminaries used in the paper. Recent COVID‐19 prediction models are presented in Section 3. Section 4 presents a detailed description of the proposed ODL‐COVID model, and the proposed GB‐ADAM algorithm is presented. The performance of ODL‐COVID is evaluated in Section 5, showing the effect of implementing GB‐ADAM in optimizing the CNN. The results are compared against the most recent prediction models. Section 6 discusses the results and concludes the paper.
2. PRELIMINARIES
The proposed ODL‐COVID model is based on CNN and Adam optimization. Thus this section briefly reviews these preliminaries.
2.1. Convolutional neural network
2.1.1. The convolution layer
It is the major layer in the CNN structure block. It is used to extract the input's significant features. It consists of several kernel matrices and outputs the activation maps (output matrix), where a bias value is added, as shown:
| (1) |
where is the former layer, is the input map to this layer, is the trained kernel, and is the bias value to be added. The main aim of the training process is to train the weights of the kernel. The Rectified Linear Unit (ReLU): The layer follows the convolutional layer, called the activation layer. It is used to calculate the output of the neural network using linear combination, 17 as shown in the following activation function:
| (2) |
In this study, we used exponential linear units (ELUs), a special type of the ReLU, to fasten the training process by making the activations nearly equal to zero, as shown in the following equation:
| (3) |
where is the hyperparameter that needs to be optimized. The results of using ELUs proved greater accuracy during classification compared with results obtained by the ReLUs. The Max Pooling layer: This layer is used for downsampling the number of nodes between convolutional layers in the network. The Fully connected layer: It is placed at the end of the CNN to guarantee the proper connections between computational and activations nodes in these layers. Its main goal is to transmit the activations to the end of the network for the later units.
2.1.2. Adam optimization
It is an optimization algorithm 14 that exploits the stochastic gradient data (GD) for the objective function, based on adaptive estimations of lower‐order moments. Adam algorithm computes the learning rates from the approximations of the first and second gradients moments, merging the gains of AdaGrad 17 and RMSProp. 18 The first momentum (mean) is achieved by:
| (4) |
The second momentum (the un‐centered variance) is calculated as follows:
| (5) |
where β 1, β 2 are the average rates for the movement of the momentum. is the cost function with parameters w, where w is weight. and are biased near to zero, when and are nearly 1. To respond to these biases, Adam algorithm uses the corrected bias estimation of the first and second moment as follows:
| (6) |
| (7) |
These moments are used in the Adam update rule as follows:
| (8) |
where α is the learning rate, is used to avoid the case of dividing by 0.
3. LITERAL REVIEW
In the last few months, several studies 8 , 9 , 10 , 20 , 21 , 22 , 23 , 27 , 28 tried to present a predictive model to identify the most common mortality features associated with COVID‐19 cases. Zhang et al. 9 presented a deep learning neural network algorithm to detect mortality's most significant variables. Their results indicated that D‐dimer, oxygen index, lymphocyte, C‐reactive protein, and LDH are the highest mortality predictors in their cohort that contain only 181 COVID‐19 patients. The small size of the cohort used in this study reflected that the results obtained are statistically biased. Liang et al. 10 presented an application to calculate patients' risk at admission, using a deep learning technique. Although this study used three different cohorts with a total of 1590 patients, it only used 10 clinical variables in their study, which will not reflect the patient's whole severity degree. The study date was from November 2019 to January 2020, which indicates that the predicted factors are for the first wave of COVID‐19, which might be mutated.
A severity prediction framework is presented in Reference 19 using supervised learning. The study predicts hemoglobin, alanine aminotransferase, and myalgias as risk factors. However, the data used for the study are relatively small. Yan, Li, et al. 20 reported that LDH, lymphocyte, and C‐reactive protein are the main risk factors for the cohort of 375 patients and 300 features. The prediction model presented used single and multi‐tree XGBoost as machine learning methods. The authors suggested using a larger size of patients and features to enhance their model's performance. The main limitations for these models are the lack of generalization in the validation, using only internal validation, and the limited sample size and old study dates of the cohorts used in their studies.
On the other hand, different hybrid intelligent systems 24 , 25 , 26 have been presented to solve different optimization problems. Many efforts had been made to optimize Adam algorithm for CNN optimization. Jiyang et al. 26 proposed an optimization algorithm that combines ADAM, genetic algorithm, and boosting. Their presented algorithm, namely, boosting based GADAM (BGADAM), is used to enhance the classifications model's training rate. Dokkyun et al. 27 enhanced Adam algorithm by embedding the cost function in the parameter Adam's update rule to avoid the local minimum.
4. THE PROPOSED OPTIMIZED DEEP LEARNING INSPIRED MODEL FOR PREDICTING RISK FACTORS FOR MORTALITY OF PATIENTS WITH COVID‐19
In this paper, an optimized deep learning inspired model is proposed to predict the risk factors that cause mortality for COVID19 patients (ODL‐COVID), as shown in Figure 1. The prediction model is based on CNN and machine learning techniques. The model accepts two types of data: input, the clinical variables dataset, and the CT images dataset. It consists of five main phases: Pre‐processing, offline augmentation, deep learning, classifier learning, and model evaluation. The pre‐processing phase is used to impute missing data in the input data and remove any noise in the data. The missing data are replaced statically with substituted values. In ODL‐COVID model, different imputation methods are applied based on the type of features. For numeric features, a predictive mean matching (PMM) is applied. While for the multi‐features that have more than two levels, a Bayesian multinomial logistic regression method is applied for imputation.
FIGURE 1.
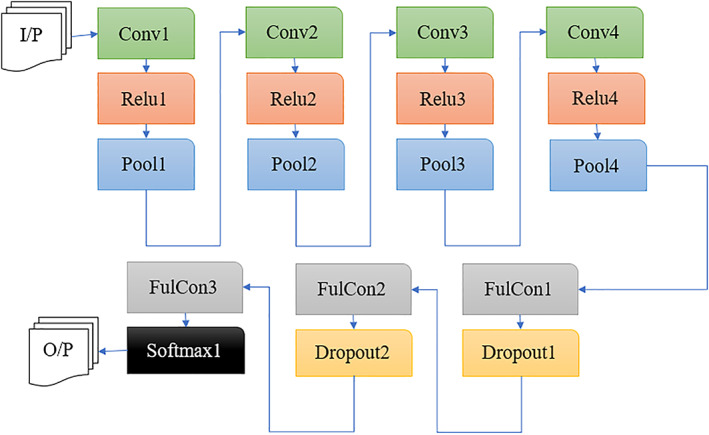
The block diagram of the newly proposed CNN model
In addition, a Gaussian function is used for Gaussian blurs in CT images dataset to eliminate the noise in order to extract the substantial section.
The pre‐processed data are divided into two sets, one set training with 70% and one for testing data 30%. The offline augmentation is applied to the training dataset only to normally distribute the number of samples for the severe and mild classes for COVID‐19 patients, to solve the class imbalance problem in COVID‐19 datasets. For the CT images, the augmentation is applied using the rotate and flip data approaches. The augmentation applied reduces overfitting that might occur in CNN and enhance the convergence, which eventually contributes to improved results. The test dataset will be used for testing the deep learning phase, after the training process, to extract the relevant deep features. The extracted deep feature will be used as an input to the classifier learning phase to increase the classification accuracy, and the classification error will be reported. The optimization in CNN is based on the features of Adam optimization and GA algorithm. The mutation and crossover operations of GA are efficiently used to calculate the learning rate, weight, and bias for training the classifier, to achieve improved data classification performance.
In the deep learning phase of ODL‐COVID, a proposed CNN model is presented for extracting the deep factors from COVID‐19 datasets, shown in Figure 2. It consists of 18 layers with six different layers: four convolution layers, four max pooling layers, four ELUs layers, three fully connected layers, two dropout layers, and one output layer, Softmax. An ELU layer follows each convolution layer.
FIGURE 2.
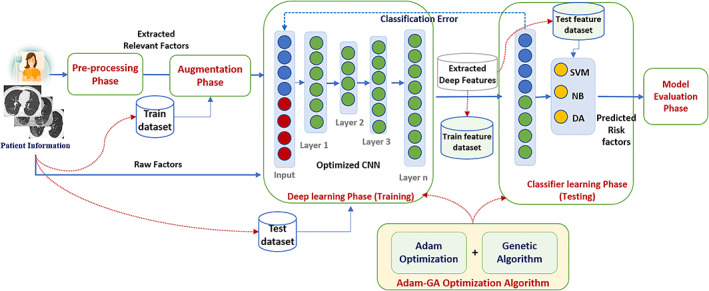
The block diagram of the proposed ODL‐COVID model
The ELU layers output is followed by max pooling layer. At the end of the architecture, there are two fully connected layers followed by dropout layers with a probability of 0.1 to improve all‐purpose classification purposes. Finally, one fully connected layer is connected with a Softmax layer, as shown in Table 1. The designed CNN model is then optimized by the proposed GA‐Adam algorithm, discussed later, to update the model's weights and for the backpropagation. To start training the CNN model, the CNN's hyperparameters are initialized: the initial learning rate (, the initial parameter vector and the maximum iterations () using Adam suggested parameters' initializations.
TABLE 1.
The details of the proposed CNN architecture model
| Name | Type | Size |
|---|---|---|
| Conv1 | Convolution | 3 × 3 pixels—16 different filters—128 bias |
| ELU1 | Exponential linear units | 74 × 74 |
| Pool1 | Max pooling | 3 × 3 max pooling layer |
| Conv2 | Convolution |
3 × 3 pixels—32 different filters—256 bias 5 × 5 convolutional kernels |
| ELU2 | Exponential linear units | 9 × 9 |
| Pool2 | Max pooling | 3 × 3 max pooling layer |
| Conv3 | Convolution | 3 × 3 pixels—32 different filters—256 bias |
| ELU3 | Exponential linear units | 3 × 3 |
| Pool3 | Max pooling | 3 × 3 max pooling layer |
| Conv4 | Convolution | 3 × 3 pixels—32 different filters—512 bias |
| ELU4 | Exponential linear units | 1 × 1 |
| Pool4 | Max pooling | 3 × 3 max pooling layer |
| Fulcon1 | Fully connected | 64 neurons |
| Dropout1 | Dropout | with a probability of 0.1 |
| Fulcon2 | Fully connected | 48 neurons |
| Dropout2 | Dropout | with a probability of 0.1 |
| Fulcon3 | Fully connected | 4 neurons: 4 mortality risk factors |
| Softmax1 | Softmax | 1 × 1 |
In the classifier learning phase, three different classification algorithms, SVM, NB, and DA, have been used to predict the risk factors of COVID‐19, considering the deep features extracted from CNN. The features extracted are divided into 70% for training and 30% for testing data. Then, each classifier is trained and tested to predict the relevant risk factors, and the results obtained from each classifier are evaluated. The proposed model's main idea is to benefit from the features extracted from the trained, optimized deep learning phase and machine learning techniques to achieve a reliable prediction model for COVID‐19 mortality.
The proposed model is trained for binary and multi‐class classification. The classification phase deals with binary classification problem, as it classifies the cases in the dataset to COVID‐19 and non‐COVID19 cases. Then, the classification algorithm will classify the detected COVID‐19 cases to moderate, severe‐survived, and severe‐died cases, as a three‐class problem.
The model evaluation phase is used to validate the overall model's performance. The accuracy, specificity, sensitivity, F‐score, the area under the curve (AUC) of receiving operating characteristic (ROC), confusion matrix, and the false‐positive rate (FPR) are used for evaluation, where true positive (TP) and true negative (TN) symbolize the number of truly predicted severe and moderate cases. In contrast, false‐positive (FP) and false‐negative (FN) represent the number of wrongly predicted severe and moderate cases.
4.1. The proposed genetic‐based adaptive momentum estimation optimization algorithm
In the deep learning phase, a new optimization algorithm named genetic‐based adaptive momentum estimation (GB‐ADAM) is proposed, which employs GA to optimize Adam's configuration parameters, consequently improving the classification accuracy. The computation steps are shown in Figure 3.
FIGURE 3.
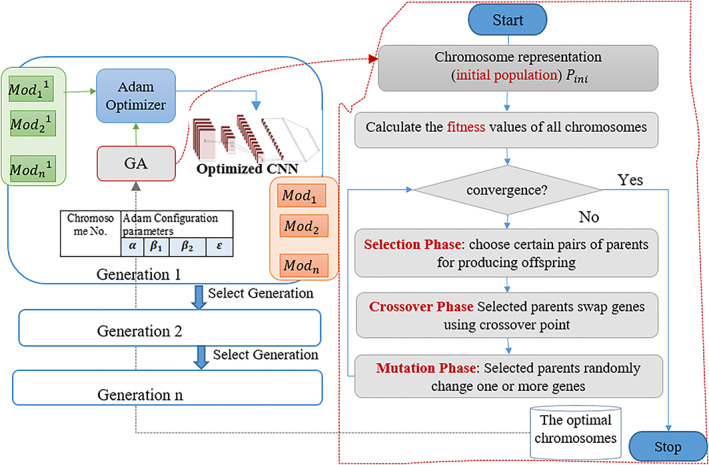
The block diagram of the proposed GB‐ADAM
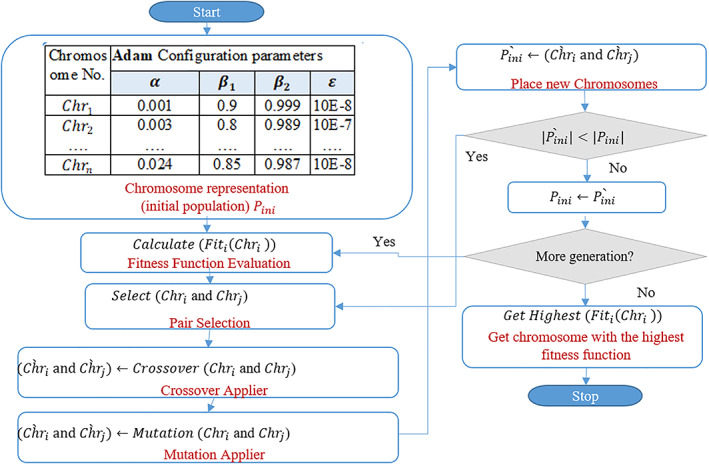
In each generation, Adam optimizer is used to train the variables of the model (, …., ) where n is the number of model variables per generation i, selected by the GA using the selection, crossover, and mutation operations. The variables with the highest fitness functions will be selected to produce the new generation. These operations are repeated until the convergence is reached. And the generation with the highest variables will be selected as the output solution of the model. Figure 4 shows the detailed steps of applying the GA to the Adam algorithm for optimizing its configuration parameters. The GB‐Adam processing can be divided into six main phases: initial population, fitness function evaluation, selection, crossover, mutation, and test termination.
FIGURE 4.
The steps of applying GA to Adam
In the initial population phase, Adam's parameters are represented as chromosomes for the initial population. These chromosomes are randomly generated, and the chromosome with superior solution has a high probability of reproducing. A subset of Adam's parameters is denoted in each chromosome as a decimal sequence. In the fitness function evaluation phase, first the cost function can be calculated as follows:
| (9) |
L (·, ·; ) represents any cost function for a specific vector of variables. is the validation sample, is the features of instance j, is the labels associated with instance j, and is the vector of all assigned variables in model i of generation n. Then, the fitness values of all chromosomes are computed using a predefined fitness function, as shown:
| (10) |
where ω is a parameter that selects the adjustment between a specific classifier performance (assuming that a is for SVM, b for NB and c for DA), the features' size (, and the number of features . This fitness function is used for the training phase to decrease the number of COVID‐19 mortality risk factors (select only the most significant factors), decrease the cost, and increase the classification accuracy.
The fitness function unit can be considered the measure of each chromosome's fitness degree based on the classifier's accuracy. The best chromosome is the one that introduces the maximum fitness value. Each chromosome's fitness value should be provided by calculating the accuracy of the three suggested classifiers, and the best results obtained by the classifier should be nominated. In the selection phase, certain pairs of parents are selected for generating offspring. For each chromosome, the probability of selection () is assigned. The selection operation is applied by changing the gene's combinations and switching the corresponding parts of the string. In the crossover phase, the probability of the crossover value () is assigned for the pairs of parents to specify if the crossover operation will be applied between them or not, to generate new offsprings for the next generation. Unlike the original Adam algorithm, which uses trial and error in tuning the configuration parameters, the crossover operation is executed between the selected pair of parent solution , which is the pair with the highest fitness values obtained from Equation (10). The crossover process leads to the creation of new solutions from existing good ones (chromosomes) to produce better offspring's in the new generation, based on a predefined crossover rate CR [0,1]. In the mutation phase, the probability of mutation () is assigned for every offspring to indicate if the mutation process will be performed on every offspring or not. Mutation process changes a chromosome locally to generate new better solutions under the constraints of a predefined parameter mutation rate (MR). If the chromosome' fitness value is below the MR value, then each gene in the parent solution is mutated based on this equation:
| (11) |
where Chr i is the newly generated chromosome, is the parent solution, is a random number [−1,1], and is the random chromosome selected. The old set of chromosomes are replaced with the newly generated chromosomes. And then the size of the newly generated population is checked; if it is still less than the initial population's size, then the steps from selection to mutation phase will be repeated, otherwise the initial populations will be replaced by the new populations.
In the termination phase, the number of generations will be examined to terminate the algorithm. If the current generation's index reached the predefined number of the maximum iterations (), then the newly generated solutions are selected, which is the chromosome with the highest fitness function found. If there are more generations, the former phases from the fitness function evaluation phase will be repeated. At the end, the best combination of features (parameters) is represented in the chromosome that provides the highest fitness value. These optimized parameters are then used in Adam's configuration for optimizing the CNN. The pseudo‐code of the proposed GB‐Adam algorithm is presented in algorithm 1.
Algorithm 1. Pseudo‐code of GB‐Adam algorithm.
Inputs: C(w): Cost function with parameters w
: Initial parameter vector
Output:
The parameters combination with the highest fitness function
: The learning Rate
: Exponential decay rates for the moment estimates
: A number to prevent any division by zero
Start
0, 0
Do
Iter = iter + 1;
Generate (, ,…
For each i in n
based on equation (10)
) then
Replace
)
Update Population
Else
Remain
)
End For
Update parameters
Get‐Highest (Parameters combination)
While (iter<= max iteration ) i 0
Do
i i+1
/(1 ‐ )
/(1 ‐ )
While ( w not converged)
return
End
Applying GA with Adam optimizer provides the advantages of exploration and exploitation features, which lead to a speedy convergence with the capability to avoid local minima. In other words, GA‐ADAM combines the advantages of the genetic algorithm (GA) along with the Adam algorithm to select the more effective genes in order to optimize the classification accuracy without reaching the local optima. In the GA‐ADAM algorithm, two ways are implemented for this issue: First, in the initial population, change the crossover probability by increasing and randomizing the number of population and ensure that the number of generation is increasing. When the fitness restarted, revert to the initial configuration and randomize all selected for crossover. This will avoid the local minima, especially in the big search space. Second, by reducing the crossover probability and increase mutation on the condition that the number of generations increases. The higher the mutation rate is, the more search space will be searched and the higher the chance that the global minimum is found.
5. EXPERIMENTAL RESULTS
Several experiments were conducted to evaluate the proposed ODL‐COVID model's performance on an Intel Core i5‐8250 1.80 GHz processor, 8 GB memory. Python 3.7 and TensorFlow 1.3 are used to run the model. The main parameters are set, as shown in Table 2.
TABLE 2.
The parameters used to evaluate the ODL‐COVID model
| Parameter | Value | Parameter | Value |
|---|---|---|---|
| Number of generations | 500 | Crossover rate (CR) | 0.7 |
| Population size | 30 | Mutation rate (MR) | 0.01 |
| Maximum iterations | 900 | Initial learning rate | 1e−5 |
| Number of epochs | 64 | The learning rate was decreased by 0.01 after each 12th epoch | |
5.1. Data sources used for external validation
The datasets used were aggregated from different sources. Initially, the dataset used was https://www.covidanalytics.io/dataset, which collects data from over 160 published studies, where the study end dates for the patients in this dataset were between March 29 and April 18, 2020. This dataset aggregates its data from different hospitals around the world, which may have different equipment and reporting standards. The information is standardized across papers over best accuracy. This dataset is publicly available.
Then, to ensure the generalization of the proposed model, three independent cohorts 21 , 22 , 23 are collected, with extensive geographic coverage, for external validation. The datasets used are from New York, Mexico, and Wuhan, consisting of 3055, 7497, and 504 patients, as shown in Table 3. Each cohort contains the following information: (1) Demographic information (e.g. number of patients in the cohort, aggregated age, and gender statistics); (2) comorbidity information (e.g. prevalence of diabetes, hypertension, etc.); (3) symptoms (including fever, cough, sore throat, etc.); (4) treatments (including antibiotics, intubation, etc.); (5) standard labs (including lymphocyte count, platelets, etc.); and (6) outcomes (including discharge, hospital length of stay, death, etc.). The clinical variables used for the three datasets collected were homogenously assessed. The data used contain longitudinal information. The data collected are available upon request from the first author.
TABLE 3.
The details of the three independent cohorts used for validation
| Cohort | New York | Mexico | Wuhan | Merged dataset |
|---|---|---|---|---|
| # of patients | 3055 | 7497 | 504 | 11 056 |
| # of Excluded records | 291 | 499 | 78 | 808 |
| # of Study days | 33 | 49 | 99 | 49 |
| Study end date | April 11, 2020 | April 18, 2020 | March 29, 2020 | April 18, 2020 |
| Mortality rate | 6.9% | 9.1% | 15.67% | 10.56% |
| #severe‐died | 191 | 630 | 76 | 897 |
| #Severe‐survived | 305 | 980 | 73 | 1358 |
| #Moderate | 2268 | 5388 | 337 | 7994 |
| AUC | 0.978 | 0.963 | 0.987 | 0.982 |
In addition, a COVID_CT dataset 29 was used to validate our proposed ODL‐COVID model. The dataset contains 349 CT images containing clinical findings of COVID‐19 from 216 patients. For each CT scan in the dataset, different information is provided as patient age, gender, location, medical history, scan time, severity of COVID‐19, and radiology report. The data are divided into two sets, namely, training and testing. The results obtained from patients' CT scans had been evaluated once.
In the COVID_CT dataset, the images are collected from COVID19‐related papers. CT images containing COVID‐19 anomalies and severity degree are selected by reading the captions of the figure in the papers. These captions were created after radiologists had labeled the images.
6.
6.1.
The COVID‐19 patients in these cohorts were divided into three groups: severe and died (SD), severe and survived (SS), and moderate (M) cases. After collecting these datasets, the proposed ODL_COVID model analyzed and ranked 102 laboratory variables and 39 basic and clinical features for the patients: 49% of patients are males, the median age is 46, and 26.5% are smokers. Severe cases (Sc) presented more comorbidities than moderate cases (Mc) as follows: hypertension (Sc = 38.7% and Mc = 11.2%), diabetes (Sc = 25.3% and Mc = 9.1%), and cardiovascular disease (Sc = 16.7% and Mc = 3.2%).
6.2. The most significance mortality risk factors
This experiment is used to identify the most significant mortality risk factors detected in severe cases. After the classification algorithm in ODL‐COVID correctly classified the severe cases, it detected the top most frequent features appeared in these cases, as shown in Figure 5. Figure 5A shows the most frequent basic and clinical features in the dataset, which are diabetes (29.7%), hypertension (28.6%), elder age (25.4%), cardiovascular disease (21.1%), dyspnea (20.5%), and diarrhea (19.1%), which is considered as an individual symptom.
FIGURE 5.
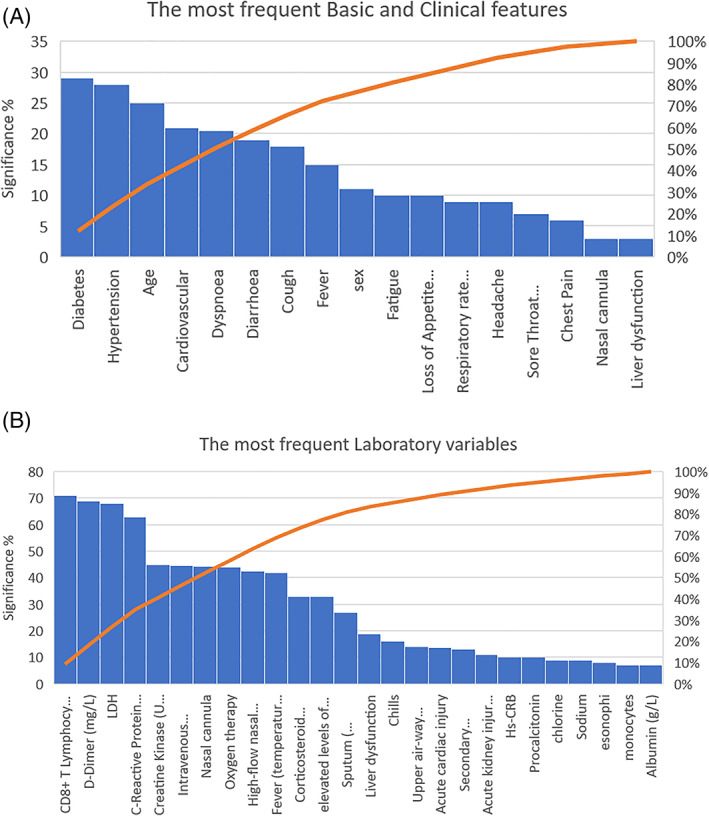
The top most significant features obtained by ODL‐COVID. (A) The most frequent basic and clinical features. (B) The most frequent laboratory variables
Figure 5B shows the most frequent laboratory variables. The results show that the most significant laboratory variables for mortality, obtained by ODL‐COVID, were as follows: CD T lymphocyte (Count), D‐dimer greater than 1 μg/ml, high values of lactate dehydrogenase (LDH), and C‐reactive protein (CRP) individually and associated with two main risk symptoms: diabetes and hypertension.
Moreover, the results show that the most common COVID‐19 signs in CT scans included GGO, crazy‐paving pattern, consolidations, and lobes' number, as shown in Table 4.
TABLE 4.
The laboratory variables and radiological features for COVID‐19 patients
| Laboratory variables | Normal range | All patients (11 056) | Moderate cases (7994) | Severe‐survived (1358) | Severe‐died (897) |
|---|---|---|---|---|---|
| CD8+ T Lymphocyte (Count) (×109/L) | 1.1–3.2 | 0.86 (0.57–1.16) | 1.00 (0.67–1.23) | 0.73 (0.49–1.03) | 0.59 (0.34–1.05) |
| D‐Dimer (μg/ml) | 0–0.5 | 0.23 (0.13–0.52) | 0.15 (0.10–0.24) | 0.28 (0.17–0.58) | 1.89 (0.38–3.41) |
| Lymphocyte percentage (%) | 20–50 | 20.3 (10.0–29.1) | 24.9 (17.3–34.2) | 14.0 (8.7–24.7) | 8.4 (4.7–15.2) |
| Lactic dehydrogenase (LDH) U/L | 125–243 | 300·(234–407) | 253.5 (219·0–318·0 | 389(319504) | 521 (363·0–669·0) |
| C‐reactive protein (CRP) (mg/L) | 0–3 | 27.9 (9.0–60.6) | 15.9 (4.5–38.1) | 36.3 (18.3–72.5) | 105.2 (53.3–160.3) |
| Procalcitonin (PCT) (ng/ml) | 0–0.1 | 0.06 (0.0–0.13) | 0.04 (0.0–0.05) | 0.1 (0.04–0.24) | 0.29 (0.10–0.60) |
| Creatinine kinase‐MB (ng/ml | 0.0–6.22 | 1.1 (0.6–2.2) | 0.8 (0.5–1.4) | 1.5 (0.7–3.1) | 2.2 (1.1–3.6) |
| Serum creatinine (μmol/L) | 64–104 | 67.6 (55.9–85.2) | 66.4 (54.0–80.7) | 80.0 (66.0–112.0) | 62.9 (52.0–75.0) |
| CT image—COVID‐19 signs | |||||
| GGO (%) | 85.6 | 89 | 84.5 | 80 | |
| Consolidation (%) | 62.7 | 64.4 | 62.2 | 60 | |
| Crazy‐paving pattern (%) | 54.2 | 53.4 | 54.5 | 55.6 | |
| More than five lobes (%) | 55.6 | 37.1 | 69.2 | 91.4 | |
Note: Data are shown as median (confidence interval range) or no. (%) eight hundred and seven out 11 056 patients were excluded due to missing information or noise.
6.3. ODL‐COVID performance validation
The performances of ODL‐COVID are measured using AUC when identifying the six most significant risk factors. In this experiment, the binary classification of ODL‐COVID is evaluated. Figure 6 shows the AUC curves for ODL‐COVID compared with other prediction models: standard CURB‐65 score, 15 the resultant risk score (DL‐COVID), 9 and DL survival Cox. 10
FIGURE 6.
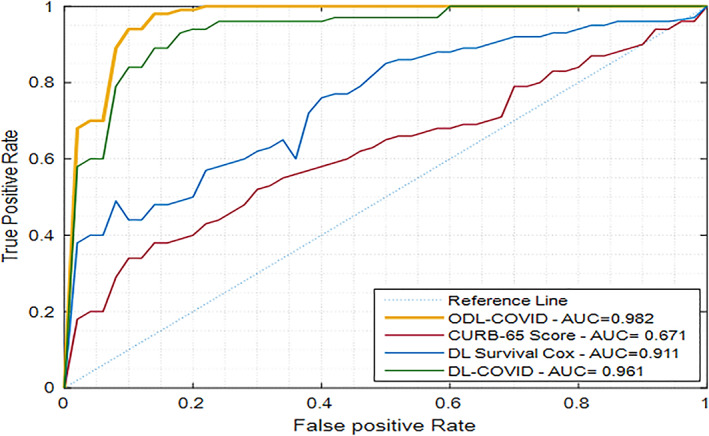
The AUC and ROC curves for the ODL‐COVID compared with other models
The performance of ODL‐COVID, with AUC = 0.982, outperformed other models: CURB‐65 (AUC = 0.671), DL survival Cox (AUC = 0.911), and DL‐COVID (AUC = 0.961). Besides validating the results obtained by the binary classification of ODL‐COVID, the multi‐classification is also validated.
The multi‐class classification, which predicts the severity degree (Moderate M, Severe‐Survived SS, and Severe‐Died SD), is validated by calculating the prediction accuracy using the confusion matrix of the testing data, as shown in Figure 7.
FIGURE 7.
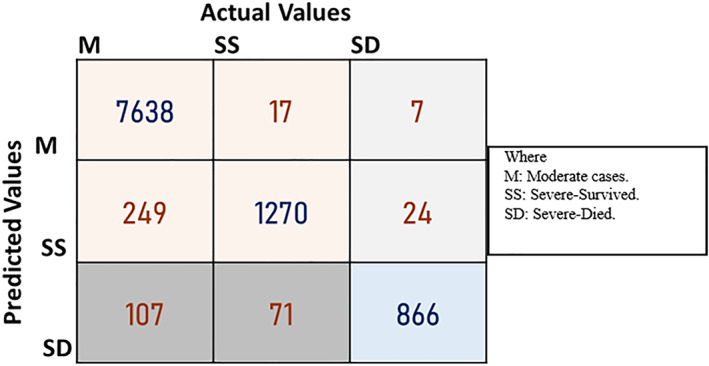
The confusion matrix for all cases (10 249 patients) with the 141 features
The accuracy was obtained as 0.9555, 0.9356, and 0.965 for M, SS, and SD cases, respectively. The confusion matrix in Figure 7 shows the prediction accuracy of all cases, which is 96.45% (where 866 cases are correctly predicted as SD out of 897 patients, and only seven cases were classified as moderate case.) using the extracted feature. Of the 7994 moderate cases, 249 were classified as SS, and 107 were classified as SD. Seventeen of the 1358 SS cases were classified as M, and 71 were classified as SD.
6.4. The classifier learning phase validation
This experiment is used to validate the classifier learning phase's performance in the proposed model and test the deep features extracted from the optimized CNN. The accuracy, sensitivity, specificity, FPR, and F1 score are calculated for each classifier presented in the model, using the deep features extracted from the different datasets, as shown in Table 5.
TABLE 5.
The classification models' performance (SVM‐NB‐DA) for different datasets using the ODL‐COVID model's deep features
| Classification models | Accuracy | Sensitivity | Specificity | FPR | F1 score | |
|---|---|---|---|---|---|---|
| New York | ODL_COVID_SVM | 0.9276 | 0.9747 | 0.8806 | 0.1194 | 0.9314 |
| ODL_COVID_DA | 0.9144 | 0.8982 | 0.9306 | 0.0694 | 0.9112 | |
| ODL_COVID_NB | 0.9109 | 0.9112 | 0.9106 | 0.0894 | 0.9094 | |
| Mexico | ODL_COVID_SVM | 0.9332 | 0.9529 | 0.9135 | 0.0865 | 0.9343 |
| ODL_COVID_DA | 0.9340 | 0.9351 | 0.9334 | 0.0676 | 0.9279 | |
| ODL_COVID_NB | 0.9291 | 0.9512 | 0.9071 | 0.0929 | 0.9294 | |
| Wuhan | ODL_COVID_SVM | 0.9538 | 0.9729 | 0.9347 | 0.0653 | 0.9552 |
| ODL_COVID_DA | 0.9391 | 0.9476 | 0.9306 | 0.0694 | 0.9385 | |
| ODL_COVID_NB | 0.9388 | 0.9435 | 0.9341 | 0.0659 | 0.9377 | |
| Merged dataset | ODL_COVID_SVM | 0.9385 | 0.9609 | 0.9162 | 0.0841 | 0.9382 |
| ODL_COVID_DA | 0.9289 | 0.9329 | 0.9249 | 0.0751 | 0.928 | |
| ODL_COVID_NB | 0.9263 | 0.9353 | 0.9173 | 0.0827 | 0.9255 | |
The SVM classifier was superior to NB and DA in the merged dataset collected. It was realized that SVM classifier ensured an improvement in the mortality prediction for New York and Wuhan datasets. Therefore, SVM result improved classification for mortality prediction with accuracy, sensitivity, specificity, FPR, and F1 score are 93.85%, 96.09%, 91.62%, 84.1%, and 93.82%, respectively.
6.5. The disease severity degrees
A risk classification system is proposed based on the six most significant risk factors obtained from the ODL‐COVID. This system is used to predict the risk and severity degrees. The severity degrees range from 0 to 6 (from moderate to extremely severe). The severity degrees' classification method is used to predict mortality, using the findings obtained from ODL‐COVID, as follows: The risk classification system uses a score calculator that adds a degree to the total score of a case if it detected one of the following: high values of lactate dehydrogenase (LDH), CD T lymphocyte, C‐reactive protein (CRP), D‐dimer greater than 1 Ug/ml, hypertension, and diabetes. Figure 8 shows the results of the risk score model for the whole dataset.
FIGURE 8.
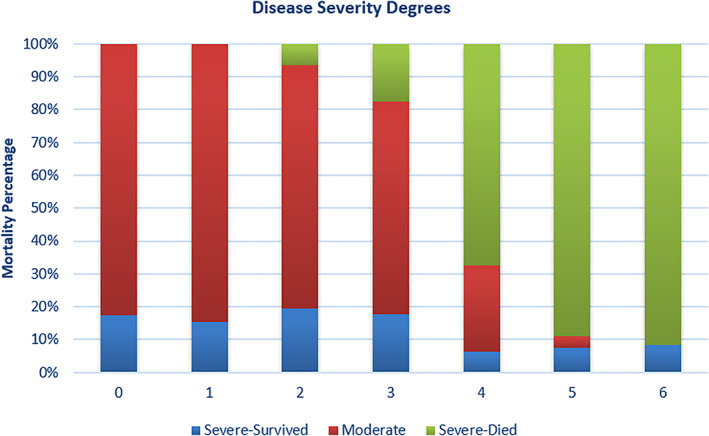
The disease severity degrees with mortality percentage
The SD cases increased with the increase in severity degree, while M and SS cases decreased with the decrease in severity degree. The mortality rates for the severity degrees' classification method of 0, 1, 2, 3, 4, 5, and 6 were 0%, 0%, 5.3%, 17.2%, 59.7%, 70.8%, and 89.1%, respectively.
6.6. Risk probability monitoring
The risk probability system calculates the risk of severe disease at admission and during patients' stay. Based on the obtained risk probability, the patients are categorized into moderate and severe cases.
This experiment is used to compute the risk probability for severe (SD and SS) and non‐severe cases (M) from hospital admission to the end of the study days. As presented in Figure 9, ODL‐COVID monitors the risk probability through the days of study. AUC's prediction performance at the end of the study is 0.961, while AUC is 0.881 at hospital admission.
FIGURE 9.
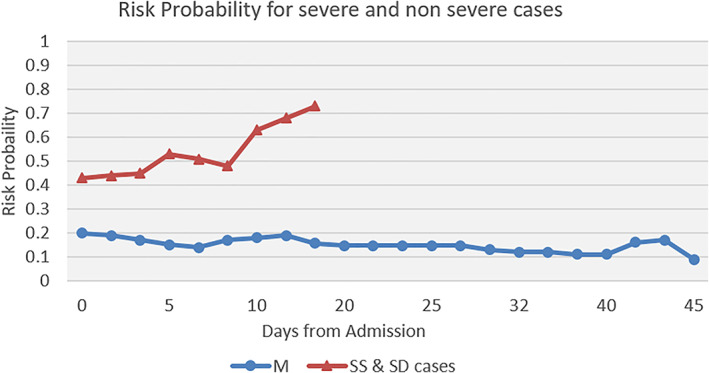
The risk probability during the days of the study
These results show that the clinical, laboratory, and radiological features help predict risk in severe cases.
7. DISCUSSION AND MAIN CONCLUSION
The proposed model consists of two main phases: The deep learning phase and the classifier learning phase. The deep learning phase extracts deep features from the deep layers of CNNs. These features will then be the input to the classifier learning phase to improve COVID‐19 risk factor prediction further. Our model's significance is fivefold: First, most of the predictive models use deep feature sets obtained from pre‐trained models. However, ODL‐COVID presented a new optimized CNN model, which is trained from scratch. The results showed that using the features extracted improved the prediction performance. Second, instead of using the hyperparameters presented by Adam optimizer to optimize CNN performance, our study presented GA‐Adam optimizer that improves the learning and classification accuracy.
Third, the proposed model predicts the mortality risk factors for different cohorts and presents a severity degree classification method ranging from 0 to 6 (from moderate to extremely severe). This classification model might help to anticipate severe situations allowing better management of all resources and maintaining a closer control of these patients. Fourth, the six risk factors predicted—lymphocytes‐dimer, LDH, CRP, hypertension, and diabetes—can be simply identified in any hospital or and medical center. This will help limit limited healthcare resources' situation; to prioritize severe patients with high‐risk probability quickly. Finally, most of the predictive models presented suffer from a lack of generalization in the validation and the limited sample size and old study dates of the cohorts used in their studies. The proposed model used three recent cohorts from different geographic areas, with a total of 11 056 patients, which will help healthcare workers to figure out the features of the COVID‐19's second wave and provide immediate medical interaction for severe cases with high‐risk factors.
CONFLICT OF INTEREST
The authors declare no conflict of interest.
Elghamrawy SM, Hassanien AE, Vasilakos AV. Genetic‐based adaptive momentum estimation for predicting mortality risk factors for COVID‐19 patients using deep learning. Int J Imaging Syst Technol. 2022;32(2):614-628. 10.1002/ima.22644
DATA AVAILABILITY STATEMENT
The datasets are available in the following repositories: https://figshare.com/s/83e0ffb908e47aa25704, https://archive‐beta.ics.uci.edu/ml/datasets/616 and the CT images used are available on reference [31] https://github.com/UCSD‐AI4H/COVID‐CT
REFERENCES
- 1. Zhu N, Zhang D, Wang W, et al. A novel coronavirus from patients with pneumonia in China, 2019. N Engl J Med. 2020;382(8):727‐733. [DOI] [PMC free article] [PubMed] [Google Scholar]
- 2. Huang C, Wang Y, Li X, et al. Clinical features of patients infected with 2019 novel coronavirus in Wuhan. China Lancet. 2020;395(10223):497‐506. [DOI] [PMC free article] [PubMed] [Google Scholar]
- 3. World Health Organization . Coronavirus disease 2019 (COVID‐19): situation report, 82; 2020. https://www.who.int/emergencies/diseases/novel-coronavirus-2019/situation-reports/. Accessed September 28, 2020.
- 4. Yang X, Yu Y, Xu J, et al. Clinical course and outcomes of critically ill patients with SARS CoV‐2 pneumonia in Wuhan, China: a single‐centered, retrospective, observational study. Lancet Resp Med. 2020;8:475‐481. [DOI] [PMC free article] [PubMed] [Google Scholar]
- 5. Leung K, Wu JT, Liu D, Leung GM. First‐wave COVID‐19 transmissibility and severity in China outside Hubei after control measures, and second‐wave scenario planning: a modelling impact assessment. Lancet. 2020;395(10233):1382‐1393. [DOI] [PMC free article] [PubMed] [Google Scholar]
- 6. Hui DS, Azhar EI. Coronavirus (COVID‐19) Mortality Rate; 2020. www.worldometers.info. Accessed 23 March, 2020.
- 7. Madani TA, Ntoumi F, Kock R, et al. The continuing 2019‐nCoV epidemic threat of novel coronaviruses to global health—the latest 2019 novel coronavirus outbreak in Wuhan, China. Int J Infect Dis. 2020;91:264‐266. 10.1016/j.ijid.2020.01.009 [DOI] [PMC free article] [PubMed] [Google Scholar]
- 8. Zhou F, Yu T, du R, et al. Clinical course and risk factors for mortality of adult inpatients with COVID‐19 in Wuhan, China: a retrospective cohort study. Lancet. 2020;395(10229):1054‐1062. 10.1016/S0140-6736(20)30566-3 [DOI] [PMC free article] [PubMed] [Google Scholar]
- 9. Zhu JS, Ge P, Jiang C, et al. Deep‐learning artificial intelligence analysis of clinical variables predicts mortality in COVID‐19 patients. J Am Coll Emerg Phys Open. 2020;1(6):1364‐1373. [DOI] [PMC free article] [PubMed] [Google Scholar]
- 10. Liang W, Yao J, Chen A, et al. Early triage of critically ill COVID‐19 patients using deep learning. Nat Commun. 2020;11:1‐7. 10.1038/s41467-020-17280-8 [DOI] [PMC free article] [PubMed] [Google Scholar]
- 11. Sierra‐Sosa D, Garcia‐Zapirain B, Castillo C, et al. Scalable healthcare assessment for diabetic patients using deep learning on multiple GPUs. IEEE Trans Ind Inform. 2019;15(10):5682‐5689. [Google Scholar]
- 12. Elghamrawy SM, Hassnien AE, Snasel V. Optimized deep learning‐inspired model for the diagnosis and prediction of COVID‐19. Comput Mater Contin. 2021;67(2):2353‐2371. [Google Scholar]
- 13. Whitley D. A genetic algorithm tutorial. Stat Comput. 1994;4(2):65‐85. [Google Scholar]
- 14. Kingma DP, Ba J. Adam: a method for stochastic optimization. arXiv. 2014; preprint arXiv:1412.6980. https://arxiv.org/abs/1412.6980. [Google Scholar]
- 15. Jones BE, Jones J, Bewick T, et al. CURB‐65 pneumonia severity assessment adapted for electronic decision support. Chest. 2011;140(1):156‐163. [DOI] [PMC free article] [PubMed] [Google Scholar]
- 16. Toğaçar M, Ergen B, Cömert Z. Waste classification using autoencoder network with integrated feature selection method in convolutional neural network models. Measurement. 2019;153:107459. 10.1016/j.measurement.2019.107459 [DOI] [Google Scholar]
- 17. Duchi J, Hazan E, Singer Y. Adaptive subgradient methods for online learning and stochastic optimization. J Mach Learn Res. 2011;12:2121‐2159. [Google Scholar]
- 18. Tieleman T, Hinton G. Lecture 6.5—RmsProp: divide the gradient by a running average of its recent magnitude. COURSERA. Neural Netw Mach Learn. 2012. [Google Scholar]
- 19. Jiang X, Coffee M, Bari A, et al. Towards an artificial intelligence framework for data‐driven prediction of coronavirus clinical severity. Comput Mater Contin. 2020;63:537‐551. [Google Scholar]
- 20. Yan L, et al. Prediction of criticality in patients with severe Covid‐19 infection using three clinical features: a machine learning‐based prognostic model with clinical data in Wuhan. MedRxiv. 2020;1‐25. https://www.medrxiv.org/content/10.1101/2020.02.27.20028027v2. [Google Scholar]
- 21. Solís P, Carreňo H. COVID‐19 fatality and comorbidity risk factors among confirmed patients in Mexico. medRxiv. 2020. https://www.medrxiv.org/content/10.1101/2020.04.21.20074591v1. [Google Scholar]
- 22. Liu Q, Fang X, Tian L, et al. The effect of Arbidol hydrochloride on reducing mortality of Covid‐19 patients: a retrospective study of real world date from three hospitals in Wuhan. medRxiv. 2020. https://www.medrxiv.org/content/10.1101/2020.04.11.20056523v1. [Google Scholar]
- 23. Vaid A, Somani S, Russak AJ, et al. Machine learning to predict mortality and critical events in COVID‐19 positive New York City patients. medRxiv. 2020. https://www.medrxiv.org/content/10.1101/2020.02.27.20028027v3. [DOI] [PMC free article] [PubMed] [Google Scholar]
- 24. Abdel‐Hamid NB, ElGhamrawy S, El Desouky A, Arafat H. A dynamic spark‐based classification framework for imbalanced big data. J Grid Comput. 2018;16(4):607‐626. [Google Scholar]
- 25. Elghamrawy SM, Hassanien AE. GWOA: a hybrid genetic whale optimization algorithm for combating attacks in cognitive radio network. J Amb Intell Hum Comput. 2019;10(11):4345‐4360. [Google Scholar]
- 26. Bai J, Zhang J. BGADAM: boosting based genetic‐evolutionary ADAM for convolutional neural network optimization. arXiv Preprint arXiv:1908.08015. 2019. https://arxiv.org/abs/1908.08015. [Google Scholar]
- 27. Lu J, Hu S, Fan R, et al. ACP risk grade: a simple mortality index for patients with confirmed or suspected severe acute respiratory syndrome coronavirus 2 disease (COVID‐19) during the early stage of outbreak in Wuhan, China. medRxiv. 2020. https://www.medrxiv.org/content/10.1101/2020.02.20.20025510v1. [Google Scholar]
- 28. Zhang P, Cai J, et al. Association of inpatient use of angiotensin converting enzyme inhibitors and angiotensin II receptor blockers with mortality among patients with hypertension hospitalized with COVID‐19. Circ Res. 2020;156(12):1671‐1681. [DOI] [PMC free article] [PubMed] [Google Scholar]
- 29. https://github.com/UCSD-AI4H/COVID-CT.
Associated Data
This section collects any data citations, data availability statements, or supplementary materials included in this article.
Data Availability Statement
The datasets are available in the following repositories: https://figshare.com/s/83e0ffb908e47aa25704, https://archive‐beta.ics.uci.edu/ml/datasets/616 and the CT images used are available on reference [31] https://github.com/UCSD‐AI4H/COVID‐CT


