

Abstract
The burden of pneumonia, especially that caused by respiratory viruses, is markedly high in the pediatric age group. This study aimed to assess viral agents causing severe pneumonia among mechanically ventilated patients. Nonbronchoscopic bronchoalveolar lavage was performed for pediatric patients having severe pneumonia indicated for mechanical ventilation to be tested with a multiplex PCR immediate diagnosis of their etiologic pathogen. Among the 75 patients recruited, viral agents were detected in 73.4% of cases. Rhinovirus and respiratory syncytial virus (RSV) were the most common viruses detected in 32.1% and 29.5%, respectively. The rate of viral infection showed a clear increased incidence in the winter season. The mortality rate among viral‐associated severe pneumonia reached 56.36%. Odds of mortality increased threefolds in presence of comorbid conditions and 10‐folds with congenital heart disease. The study demonstrated the neglected importance of rhinovirus besides RSV in causing severe critical pneumonia in the pediatric age.
Keywords: bronchoalveolar lavage, rhinovirus, severe pneumonia
1. INTRODUCTION
“The single biggest threat to a man's continued predominance on the planet is a virus,” said Joshua Lederberg, an American molecular biologist and a Nobel Prize winner, who is known for his work in microbial genetics. It has been of utmost importance to study diseases caused by viral agents whenever suspected and to take prompt actions whenever a viral infection is proved. 1
Pneumonia is a leading cause of morbidity and mortality in children worldwide. On average, 1 in 66 children in high‐income countries is affected by pneumonia per year, compared to 1 in 5 children in low‐ and middle‐income countries. 2
The Pneumonia Etiology Research for Child Health project among children in developing countries estimated that viruses accounted for 61.4% of causes, whereas bacteria accounted for 27.3% and Mycobacterium tuberculosis for 5.9%. 3 Viral pneumonia is defined as a disease entity wherein there is the viral causation of oxygen and carbon dioxide gas exchange abnormalities at the level of the alveoli, secondary to viral‐mediated and/or immune response‐mediated inflammation. 4
The identification of causative viruses enables the accurate diagnosis of respiratory infections and prescription of specific antiviral agents against certain viruses, such as oseltamivir for influenza viruses, and improves the prognosis. 5 Recognizing causative viruses can also provide information on the appropriate infection control measures, which can potentially reduce unnecessary hospital stays. 6
The prevalence of viruses can vary by geography, season, and immunization coverage. The prevalence of viruses values varies depending on the study design, including case definitions, specimen collection methods, and diagnostic tools applied. This study was designed to analyze the viral agents causing severe pneumonia among mechanically ventilated pediatric patients in a university‐affiliated pediatric intensive care unit (PICU) in a developing country.
2. SUBJECT AND METHODS
2.1. Study design
A cross‐sectional study was carried out on critically ill patients with an age range from 1 month to 16 years, diagnosed with severe pneumonia indicated for mechanical ventilation according to Center for Disease Prevention and Control (CDC) pediatric ventilator‐associated events criteria. 7 Cases were recruited from July 2019 to July 2020. During this study period, SARS‐Co‐V2 infections in the study community were considered very low. A sample size of 70 patients was estimated to be enough required sample with 80% study power at a significant level of 95% (accepted α error = 0.05). 8 Cases were increased to 75 to compensate for 5 cases with an unidentified etiologic pathogen.
2.2. Study setting
A nine‐bedded university‐affiliated medical, nonsurgical PICU, with a yearly admission rate of 250–300 cases is considered a tertiary center of referral serving four governorates of almost 20 million population. The high level of patient care provided in this PICU depended on 24 h/2 residents; one on duty in PICU and the other on call to ensure the rapid rescue of cases in the emergency room or other wards. The high nurse: patient ratio is 1:1 for close monitoring of critically ill patients. All procedures were under the supervision of intensive care consultants. Patients whose ages were less than 30 days or more than 16 years were not admitted to this PICU.
2.3. Collection of data
Demographic and clinical data included patients' age, gender, underlying diagnoses, pediatric index of mortality score II, Pediatric Logistic Organ Dysfunction score, routine laboratory investigations, different types of initial and supportive treatment given, mechanical ventilation, invasive devices, PICU length of stay, and patient's outcome.
2.4. Diagnosis of viral etiology
Nonbronchoscopic broncho‐alveolar lavage (NB‐BAL) for mechanically ventilated cases, meeting the CDC definition of pneumonia, was performed by a 3‐year trained pediatric intensivist. NB‐BAL samples were subjected to an immediate nested multiplex PCR assessment using an automated closed system in the PICU unit used as a rapid bedside test to identify the causative agent in a respiratory panel plus including most of the bacterial and viral pathogens. The organisms were identified within 60–70 min from admission and management plans were designed accordingly. Pneumonia plus panel used in this study is designed to detect ten viral agents: influenza A, influenza B, respiratory syncytial virus, human rhinoviruses/enteroviruses, human metapneumovirus, parainfluenza viruses, adenoviruses, and coronaviruses (OC43, 229E, NL63, and HKU1, and finally the Middle East Respiratory Syndrome Coronavirus). The nested multiplex PCR assessment was carried using the Film‐Array, BioFire (serial number: 2FA06414) that lyses, extracts, amplifies, and detects nucleic acid for multiple causative pathogens within a single specimen in one step using endpoint melting curve. The Film‐Array assay was done according to the manufacturer's instructions. Briefly, a sample swab was introduced into the NB‐BAL sample and rotated for 10–15 times, transferred into sample injection vial, then introduced into a pouch. All steps within the pouch were automatically performed. An RNA process control was included in each pouch to monitor all reaction steps. Unfortunately, the study was conducted before the manufacturer upgrading the respiratory panel to include SARS‐CoV2.
According to the results of PCR, treatment plans were adjusted. The addition of an appropriate antiviral medicine was implemented every time a virus was detected. Also in these cases, a complete assessment for any evidence of associated bacterial infection was searched. The absence of any evidence of bacterial infection with positive viral results encouraged the treating physicians to stop any antibiotics.
2.5. Ethical consideration
The study was approved by the Institutional Review Board of the Faculty of Medicine; the University Ethical Committee approved the study design on November 2019 (IRB:00012098, FWA:00018699, serial: 0106281). Written informed consent was obtained from the legal guardian of all patients recruited in the study.
2.6. Statistical consideration
Statistical analysis used SPSS (Statistical Package for Social Science, version 21). Since the Kolmogorov–Smirnov test of normality revealed significance in the distribution of some variables, so nonparametric statistics were adopted. Comparisons were carried out between two studied independent non‐normally distributed subgroups using the Mann–Whitney U test. Kruskal–Wallis test was used if more than two studied independent subgroups. Pearson's correlation and point‐biserial correlation was done. Chi‐square test was used to test the association between qualitative variables. Monte Carlo corrections were carried out when indicated. F test (analysis of variance) was used for normally distributed quantitative variables to compare between more than two groups and post hoc test (Tukey) for pairwise comparisons. The univariate logistic model is used to estimate the probability of a binary response based on one or more predictor (or independent) variables. An alpha level was set to 5% with a significance level of 95%, and a beta error accepted up to 20% with a power of study of 80% (Table 1).
Table 1.
Comparison between the studied subgroups
| Only viral (n = 20) | Only bacterial (n = 15) | Mixed viral and bacterial (n = 35) | p value | |
|---|---|---|---|---|
| Sex | ||||
| Male n (%) | 14 (70.0%) | 9 (60.0%) | 17 (48.6%) | 0.294 |
| Female n (%) | 6 (30.0%) | 6 (40.0%) | 18 (51.4%) | |
| 5.50 (4–10.5) | 9.0 (4–56) | 4.50 (3–9) | 0.259 | |
| Age categories | ||||
| <12 n (%) | 15 (75.0%) | 8 (53.3%) | 30 (85.7%) | MC p = 0.064 |
| 12–<60 n (%) | 5 (25.0%) | 3 (20.0%) | 4 (11.4%) | MC p = 0.342 |
| ≥60 n (%) | 0 (0.0%) | 4 (26.7%) | 1 (2.9%) | MC p = 0.007** |
| Summer n (%) | 8 (40.0%) | 10 (66.7%) | 6 (17.1%) | 0.003** |
| Fall n (%) | 3 (15.0%) | 2 (13.3%) | 8 (22.9%) | MC p = 0.778 |
| Winter n (%) | 6 (30.0%) | 0 (0.0%) | 21 (60.0%) | <0.001** |
| Spring n (%) | 3 (15.0%) | 3 (20.0%) | 0 (0.0%) | MC p = 0.014* |
| PIM 2. median (IQR) | 26.50 (21.4–49.5) | 27.40 (14.7–44.9) | 36.90 (23.6–60) | 0.217 |
| PELOD‐2 median (IQR) | 4.50 (2.5–5.5) | 4.0 (2–4) | 4.0 (4–6) | 0.111 |
| Vital signs mean (SD) | ||||
| Weak pulsations n (%) | 8 (40.0%) | 5 (33.3%) | 20 (57.1%) | 0.227 |
| Temperature (Celsius) | 37.19 ± 1.17 | 37.11 ± 1.27 | 36.90 ± 1.31 | 0.685 |
| Heart rate (bpm) | 149.4 ± 25.43 | 138.0 ± 24.57 | 153.3 ± 26.55 | 0.167 |
| Systolic BP (mmHg) | 98.05 ± 20.11 | 101.8 ± 22.87 | 97.63 ± 15.82 | 0.754 |
| Diastolic BP (mmHg) | 58.15 ± 15.30 | 59.53 ± 19.88 | 55.49 ± 11.84 | 0.634 |
| MAP (mmHg) | 71.80 ± 15.13 | 72.27 ± 21.14 | 69.46 ± 12.20 | 0.783 |
| Respiratory rate (bpm) | 38.89 ± 7.23 | 34.40 ± 8.28 | 47.97 ± 10.01 | <0.001** |
| GCS. median (IQR) | 13.0 (9.5–14) | 14.0 (8.5–15) | 12.0 (8–15) | 0.817 |
| ABG | ||||
| PO2 median (IQR) | 76.05 (63.5–124.9) | 102.0 (77.5–153.5) | 77.0 (63.1–102) | 0.237 |
| PCO2 median (IQR) | 38.95 (34.5–47.5) | 32.0 (26.5–41.5) | 34.90 (31–44.5) | 0.136 |
| PaO2/FiO2 median (IQR) | 125.90 (105.1–220) | 156.0 (131.8–255.5) | 123.30 (83.5–200) | 0.374 |
| WBCs (×103) | ||||
| Total. median (IQR) | 9.40 (7.7–14.3) | 13.80 (6.7–16.5) | 13.30 (7.9–22.2) | 0.463 |
| Neutroph. median (IQR) | 5.70 (3.7–10) | 9.10 (4.1–12.5) | 7.30 (4.5–15.6) | 0.537 |
| Lymph. median (IQR) | 2.28 (1.6–3.3) | 2.50 (1.7–3.6) | 3.20 (1.7–5) | 0.249 |
| Platelets (×103). median (IQR) | 294.0 (200–399) | 176.0 (66.5–467.5) | 250.0 (117–369.5) | 0.393 |
| CRP. median (IQR) | 9.75 (2.3–39.5) | 39.0 (13.8–113.5) | 6.30 (2.3–32.5) | 0.038* |
| Chest X ray n (%) | ||||
| Uni‐lobar infiltrate | 3 (15.0%) | 3 (20.0%) | 8 (22.9%) | MC p = 0.921 |
| Multilobar infiltrates | 2 (10.0%) | 4 (26.7%) | 7 (20.0%) | MC p = 0.475 |
| Interstitial infiltrates | 12 (60.0%) | 7 (46.7%) | 19 (54.3%) | 0.736 |
| Normal | 3 (15.0%) | 1 (6.7%) | 1 (2.9%) | MC p = 0.181 |
| Duration MV (days) median (IQR) | 8.0 (3.50–18.0) | 11.0 (3.0–29.50) | 7.0 (4.0–11.0) | 0.721 |
| LOS (days) median (IQR) | 16.0 (9.0–22.0) | 18.0 (7.0–46.50) | 12.0 (6.50–18.0) | 0.239 |
| Outcome. deceased n (%) | 12 (60.0%) | 8 (53.3%) | 19 (54.3%) | 0.899 |
Note: MC, monte carlo test. *Statistically significant p ˂ 0.05.
Abbreviations: ABG, arterial blood gases; BP, blood pressure; CRP, C reactive protein; GCS: Glasgow coma scale; IQR, interquartile range; LOS, length of stay; MAP, mean arterial pressure; MV, mechanical ventilation; PELOD, pediatric logistic organ dysfunction; PIM‐2, pediatric index of mortality 2; WBC, white blood cells.
3. RESULTS
In this study, 246 patients were admitted to the PICU. Seventy‐five patients having severe pneumonia indicated for mechanical ventilation were recruited. After performing multiplex PCR testing of their bronchoalveolar lavage for the respiratory pneumonia panel organisms, results revealed that most of the cases, 46.7% (n = 35), had mixed viral and bacterial organisms and viruses alone accounted for 26.7% (n = 20) of severe pneumonia (Figure 1). The distribution of viral incidence shows an evident increase in the fall and winter seasons with a peak in December and January (Figure 2). The pie chart (Figure 3) showed that the most common retrieved virus was rhinovirus/enterovirus (32.1%), followed by respiratory syncytial virus (29.5%). Comparison of the clinical and demographic data (Table 2) showed that young aged patients (˂12 months) were more prone to viral and mixed pneumonia (75% and 85.7%, respectively) while bacteria significantly (p = 0.007) affected older aged children (≥60 months). There was a statistically significant difference in seasonal distribution; bacteria were more common in summer, while viruses predominated causes of pneumonia in winter. Clinically, patients with mixed viral and bacterial pneumonia showed significantly faster respiratory rates. As a laboratory marker, the C reactive protein was statistically higher in the bacterial group compared to the viral or mixed group (39 vs. 9.75 and 6.3, respectively, p = 0.038). The knowledge of the viral cause of pneumonia has led to significant treatment changes, specifically the addition of antiviral therapy for the viral and mixed groups and stoppage of antibiotics for the only viral pneumonia group as demonstrated in Table 2. The mortality rate among the viral‐associated mechanically ventilated pneumonia was 56.36% and the significant risk factors related to fatal outcomes were the presence of comorbid conditions, especially congenital heart disease (Table 3). Univariate logistic regression model proved that the presence of comorbidities is an independent risk of mortality (p = 0.024, odds ratio: 3.636, 95% confidence interval [CI]: 1.183–11.181). The presence of congenital heart diseases, in particular, increased the odds of mortality 10.952 times with 95% CI (1.290–93.001) by univariate logistic regression (p = .028).
Figure 1.
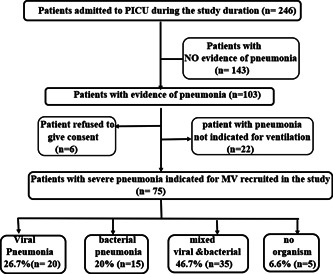
RECORD diagram showing the strategy of recruitment of the studied population
Figure 2.
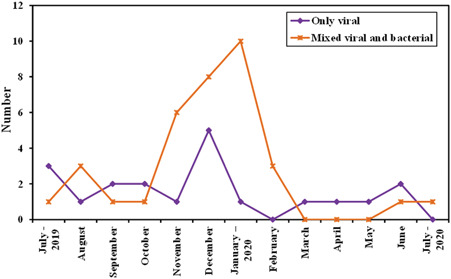
Trend of viral‐induced pneumonia over 1 year
Figure 3.
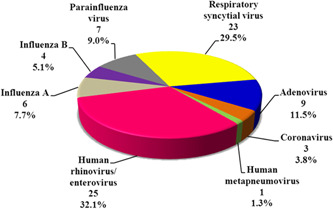
Incidence of respiratory viruses among the studied population
Table 2.
Comparison between the studied groups as regards antimicrobial therapy change after PCR detection of respiratory viruses
| Only viral (n = 20) | Only bacterial (n = 15) | Mixed viral and bacterial (n = 35) | χ 2 | p | p 1 | p 2 | ||||
|---|---|---|---|---|---|---|---|---|---|---|
| No. | % | No. | % | No. | % | |||||
| Addition of antiviral | 11 | 55.0 | 0 | 0.0 | 14 | 40.0 | 11.853** | 0.003** | 0.001** | 0.283 |
| Addition/change of antibiotic | 3 | 15.0 | 9 | 60.0 | 25 | 71.4 | 16.654** | <0.001** | 0.006** | <0.001** |
| Stoppage of antibiotic | 9 | 45.0 | 0 | 0.0 | 0 | 0.0 | 21.425** | MC p < 0.001** | 0.004** | FE p < 0.001** |
| No change of antibiotics | 6 | 30.0 | 6 | 40.0 | 6 | 17.1 | 3.141 | 0.208 | 0.537 | FE p = 0.319 |
Note: χ2: Chi‐square test; MC: Monte Carlo; FE: Fisher Exact.
p: p value for comparing the 3 studied groups
p 1: value for comparing only viral and only bacterial
p 2: value for comparing only viral and mixed viral and bacterial
*Statistically significant at p ≤ .05.
**Statistically significant at p ≤ .01.
Table 3.
Risk factors related to mortality among the subgroup of viral‐induced severe mechanically ventilated pneumonia (n = 55)
| Discharged (n = 24) | Deceased (n = 31) | χ 2 | p | |
|---|---|---|---|---|
| Gender | ||||
| Male | 12 (50.0%) | 19 (61.3%) | 0.701 | 0.402 |
| Female | 12 (50.0%) | 12 (38.7%) | ||
| Age (months) | ||||
| <12 | 21 (87.5%) | 24 (77.4%) | 1.254 | MC p = 0.838 |
| 12–<60 | 3 (12.5%) | 6 (19.4%) | ||
| ≥60 | 0 (0.0%) | 1 (3.2%) | ||
| Comorbidities | ||||
| Absent | 16 (66.7%) | 11 (35.5%) | 5.263* | 0.022* |
| Present | 8 (33.3%) | 20 (64.5%) | ||
| Comorbidities | ||||
| Asthma | 1 (4.2%) | 0 (0.0%) | 1.316 | FE p = 0.436 |
| Chronic lung disease | 0 (0.0%) | 1 (3.2%) | 0.789 | FE p = 1.000 |
| Immunodeficiency | 1 (4.2%) | 3 (9.7%) | 0.609 | FE p = 0.624 |
| Congenital heart disease | 1 (4.2%) | 10 (32.3%) | 6.672* | FE p = 0.015* |
| Other | 6 (25.0%) | 10 (32.3%) | 0.345 | 0.557 |
| Addition of antiviral | ||||
| Yes | 11 (45.8%) | 14 (45.2%) | 0.002 | 0.960 |
| No | 13 (54.2%) | 17 (54.8%) | ||
| Stoppage of antibiotic | ||||
| Yes | 2 (8.3%) | 7 (22.6%) | 2.006 | FE p = 0.271 |
| No | 22 (91.7%) | 24 (77.4%) | ||
| Bacterial coinfection | ||||
| Yes | 16 (66.7%) | 19 (61.3%) | 0.169 | 0.681 |
| No | 8 (33.3%) | 12 (38.7%) |
Note: χ2, Chi‐square test; MC, Monte Carlo; FE, Fisher Exact.
*Statistically significant at p ≤ 0.05.
**Statistically significant at p ≤ 0.01.
4. DISCUSSION
The burden of pneumonia including that due to respiratory viruses is markedly high in the pediatric age group and has been under‐estimated in practice due to difficulty in diagnosis. The advent of sensitive PCR‐based detection techniques may partly explain the increasing recognition of the involvement of viruses in respiratory diseases. 9 To ascertain whether viruses detected among the studied patients caused pneumonia symptoms and contributed to the severity by themselves is a challenging procedure. 10 Most of the studies in literature depended on nasopharyngeal wash or swabs together with variable case definitions, ranging from mild to severe signs of pneumonia. To the best of our knowledge, the current study is one of few studies that focused on severe critically ill pneumonia patients indicated for mechanical ventilation and the diagnostic sample was bronchoalveolar lavage performed during the acute phase of the disease and tested with multiplex PCR technique. This process might provide more accurate information as regards the etiologic pathogens of severe pneumonia.
The current study showed a high incidence of viruses detected in the studied population (73.4%) (n = 55/75) with a considerably increased incidence in the fall rainy winter season October–January (Figure 2, p ˂ 0.001). Other studies in literature showed a wide viral range from 49%–56% in developing countries like Mozambique 10 and Kenya 11 and even a higher range in developed countries from 73%–81% in the United States 12 and Sweden, 13 respectively. Recent evidence suggests that when sensitive detection methods are used, the prevalence of viral infections in children with pneumonia is higher than was previously thought. 9 Prevalence of viruses can also vary by geography, season, and other factors, such as immunization coverage, while specimen collection methods and diagnostic tools applied would affect the detection ability. Reports from tropical and subtropical areas have shown that virus circulation is highly dependent on weather patterns, especially rainfall and monsoons that affect virus seasonality. 14 , 15
This study showed that the most important two viruses causing two‐thirds of the studied cases were rhinovirus (RV) and respiratory syncytial virus (RSV), with an incidence of 32.1% and 29.5%, respectively. Many worldwide reports support the importance of RSV in lower respiratory tract infection in young children, especially under 5 years. 10 , 11 , 16 , 17 Rhinovirus has long been considered to be a benign virus causing upper respiratory tract infections, but in recent years, both experimental and clinical evidence has accumulated that RV can infect the lower respiratory tract. 9 Results of the current study showed RV was detected from deep bronchoalveolar lavage more than RSV. Rhinovirus can replicate in the higher temperatures of the lower airways and is able to infect cultured human bronchial epithelium. 9 In Greece, Tsolia et al. 9 reported RV to account for 45% of lower respiratory tract infections, while in Brazil, Nascimento‐Carvalho et al. 18 reported that RV represented 21% of their cases.
Viruses are responsible for a large proportion of lower respiratory tract infections in children but antibiotics are often prescribed for viral illness. 19 Following the knowledge of PCR results, management of intensivists significantly differed in between the three studied groups (viral, bacterial, mixed) as regards the stoppage or change of antibiotic (p ˂ 0.001) and the addition of appropriate antiviral agent (p ˂ 0.003). Our study suggests that multiplex PCR is a good and rapid diagnostic tool to distinguish viral from bacterial pneumonia and plays a fundamental role in decision‐making during the treatment of severe pneumonia.
The viral bacterial coinfection was detected in 46.7% of cases. Compared to viral and bacterial groups, the mixed group showed a significantly higher respiratory rate (p ˂ 0.001). Some reports suggest that bacterial coinfection is often an essential part of the pathogenesis of most severe viral infections progressing to pneumonia. 10 It has been speculated that viruses pave the way for bacterial infection. On the other hand, emerging evidence suggests that prior colonization with potentially pathogenic bacteria may enhance the severity of respiratory viral infections. 20 Many studies observed a decline in viral pneumonia following the introduction of the pneumococcal vaccine in South Africa 21 and the United States. 22 Altogether, these data support bidirectional interactions between respiratory viruses and bacteria. 20
Mortality among the studied cases was independently related to the presence of comorbid chronic illnesses, especially congenital heart diseases. The logistic regression model showed that the presence of chronic illness associated with severe pneumonia increased mortality by threefolds (95% CI: 1.183–11.181, p = 0.024). While congenital heart disease increased the odds of mortality 10‐folds (95% CI: 1.290–93.001, p = 0.028) in case they develop severe pneumonia. Caggiano et al. 23 highlighted that comorbidities negatively affect the clinical evolution of children with pneumonia. Xiao‐Xiao et al. 24 reported that patients who died from severe pneumonia had more comorbidities and especially congenital heart diseases. Other researches demonstrated the significantly fatal outcome of viral‐induced pneumonia in children with variable congenital heart disease. 25 , 26 These findings put emphasis on pneumonia preventive measures to be implemented in children having any chronic medical condition, especially those with congenital heart disease.
This study is not without limitations. First, the lack of facilities to diagnose the Covid‐19 novel virus since the test was not available nor Food and Drug Administration approved by the time of recruitment of the studied population. However, none of our patients was suspected or probable to be infected with this virus depending on the CDC criteria since patients with Covid‐19 were admitted to specific centers of isolation. Second, the mixed infection group represented almost half the studied cases (46.7%) and the exact role of each pathogen remains to be clarified and the effect of virus or bacteria detected on the clinical course and outcome could not be distinguished. Further studies concerning the quantification of viral load could provide important information on the role of each pathogen within a mixed infection.
5. CONCLUSION
Results from this study demonstrated the importance of rhinovirus as well as the respiratory syncytial virus in causing severe pneumonia indicated for mechanical ventilation in the pediatric age group. Proper management of these patients mandates accurate and rapid diagnosis of its etiologic agent. Further studies on a multicenter basis would provide better insight into the under‐estimated role of Rhinovirus.
CONFLICT OF INTERESTS
The authors declare that there are no conflict of interests.
AUTHOR CONTRIBUTIONS
Ahmed El‐Nawawy was responsible for the idea, data analysis, and revision of the manuscript. Manal AM. Antonios was responsible for protocol, data analysis, and writing of the manuscript. Marwa A. Meheissen was responsible for the microbiological aspect of the study. Marwan M. Fahim was responsible for protocol implementation and data collection.
El‐Nawawy A, Antonios MA, Meheissen MA, Fahim MM. Respiratory viruses associated with severe mechanically ventilated pneumonia in children. J Med Virol. 2022;94:461‐468. 10.1002/jmv.27284
DATA AVAILABILITY STATEMENT
All raw data and materials are available upon request from the corresponding author via email.
REFERENCES
- 1. Specter M After Ebola. The New Yorker J 2014; (https://www.newyorker.com/news/daily-comment/whats-ebola).
- 2. Nair H, Simões EA, Rudan I, et al. Global and regional burden of hospital admissions for severe acute lower respiratory infections in young children in 2010: a systematic analysis. The Lancet. 2013;381(9875):1380‐1390. [DOI] [PMC free article] [PubMed] [Google Scholar]
- 3. O'Brien KL, Baggett HC, Brooks WA, et al. Causes of severe pneumonia requiring hospital admission in children without HIV infection from Africa and Asia: the PERCH multi‐country case‐control study. The Lancet. 2019;394(10200):757‐779. [DOI] [PMC free article] [PubMed] [Google Scholar]
- 4. Freeman AM, Soman‐Faulkner K, Leigh, Jr., TR . Viral pneumonia. StatPearls Publishing. 2019;12(2):153‐158. [Google Scholar]
- 5. Minejima E, Wong‐Beringer A. Implementation of rapid diagnostics with antimicrobial stewardship. Expert Rev Anti Infect Ther. 2016;14(11):1065‐1075. [DOI] [PubMed] [Google Scholar]
- 6. Tanday S. Resisting the use of antibiotics for viral infections. The Lancet. Respir Med. 2016;4(3):179. 10.1016/S2213-2600(16)00060-6 [DOI] [PubMed] [Google Scholar]
- 7. Pediatric Ventilator‐Associated Event (PedVAE) . Device‐associated Module. Center of Disease Prevention & Control (CDC). (https://www.cdc.gov/nhsn/pdfs/pscmanual/pcsmanual_current.pdf
- 8. Faul F, Erdfelder E, Lang AG, Buchner AG. Power 3: a flexible statistical power analysis program for the social, behavioral, and biomedical sciences. Behav Res Methods. 2007;39(2):175‐191. [DOI] [PubMed] [Google Scholar]
- 9. Tsolia MN, Psarras S, Bossios A, et al. Etiology of community‐acquired pneumonia in hospitalized school‐age children: evidence for high prevalence of viral infections. CID. 2004;39:681‐686. [DOI] [PMC free article] [PubMed] [Google Scholar]
- 10. O'callaghan‐Gordo C, Bassat Q, Morais L, et al. Etiology and epidemiology of viral pneumonia among hospitalized children in rural mozambique. Pediatr Infect Dis J. 2011;30:39‐44. [DOI] [PubMed] [Google Scholar]
- 11. Berkley JA, Munywoki P, Ngama M, et al. Viral etiology of severe pneumonia among Kenyan infants and children. JAMA. 2010;303:2051‐2057. [DOI] [PMC free article] [PubMed] [Google Scholar]
- 12. Jain S, Williams DJ, Arnold SR, et al. Community aquired pneumonia requiring hospitalization among US children. N Engl J Med. 2015;372:835‐845. [DOI] [PMC free article] [PubMed] [Google Scholar]
- 13. Rhedin S, Lindstrand A, Hjelmgren A, et al. Respiratory viruses associated with community acquired pneumonia in children: matched case–control study. Thorax. 2015;70:847‐853. 10.1136/thoraxjnl-2015-206933 [DOI] [PubMed] [Google Scholar]
- 14. Saha S, Chadha M, Al Mamun A, et al. Influenza seasonality and vaccination timing in tropical and subtropical areas of southern and south‐eastern Asia. Bull World Health Organ. 2014;92:318‐330. [DOI] [PMC free article] [PubMed] [Google Scholar]
- 15. Chadha MS, Potdar VA, Saha S, et al. Dynamics of influenza seasonality at sub‐regional levels in India and implications for vaccination timing. PLoS One. 2015;10:e0124122. [DOI] [PMC free article] [PubMed] [Google Scholar]
- 16. Jain S. Epidemiology of viral pneumonia. Clin Chest Med. 2017;38:1‐9. 10.1016/j.ccm.2016.11.012 [DOI] [PMC free article] [PubMed] [Google Scholar]
- 17. Shi T, Mclean K, Campbell H, Nair H. Aetiological role of common respiratory viruses in acute lower respiratory infections in children under five years: a systematic review and meta–analysis. J Glob Health. 2015;5(1):010408. 10.7189/jogh.05.010408 [DOI] [PMC free article] [PubMed] [Google Scholar]
- 18. Nascimento‐Carvalho CM, Ribeiro CT, Cardoso MR, et al. The role of respiratory viral infections among children hospitalized for community‐acquired pneumonia in a developing country. Pediatr Infect Dis J. 2008;27(10):939‐940. [DOI] [PubMed] [Google Scholar]
- 19. Pavia AT. Viral infections of the lower respiratory tract: old viruses, new viruses, and the role of diagnosis. CID. 2011;52(Suppl 4):S284‐S289. [DOI] [PMC free article] [PubMed] [Google Scholar]
- 20. Diaz‐Diaz A, Garcia‐Maurino C, Jordan‐Villegas A. Viral bacterial interactions in children: impact on clinical outcomes. Pediatr Infect Dis J. 2019;38(6):S14‐S19. 10.1097/INF.0000000000002319 [DOI] [PMC free article] [PubMed] [Google Scholar]
- 21. Madhi SA, Klugman KP. A role for strept pneumoniae in virus‐associated pneumonia. Nature Med. 2004;10:811‐813. [DOI] [PMC free article] [PubMed] [Google Scholar]
- 22. Weinberger DM, Klugman KP, Steiner CA, Simonsen L, Viboud C. Association between respiratory syncytial virus activity and pneumococcal disease in infants: a time series analysis of US hospitalization data. PLoS Med. 2015;12:1001776. [DOI] [PMC free article] [PubMed] [Google Scholar]
- 23. Caggiano S, Ullmann N, De Vitis E, et al. Factors that negatively affect the prognosis of pediatric community acquired pneumonia in district hospital in Tanzania. Int J Mol Sci. 2017;18(3):623‐633. [DOI] [PMC free article] [PubMed] [Google Scholar]
- 24. Xiao‐Xiao Ao. The epidemiology of hospital death following pediatric severe community acquired pneumonia. Italian J Pediatr. 2021;47:25. [DOI] [PMC free article] [PubMed] [Google Scholar]
- 25. Sahan YȌ, Kiliçoglu E, Tutar ZȔ. Evaluation of children with congenital heart disease hospitalized with the diagnosis of lower respiratory infection. J Pediatr Res. 2018;5(1):32‐36. [Google Scholar]
- 26. Crawford RL, Prodhan P, Riley J. Mortality among children with heart disease and adenovirus pneumonia. Pediatrics. 2020;146:599‐600. [Google Scholar]
Associated Data
This section collects any data citations, data availability statements, or supplementary materials included in this article.
Data Availability Statement
All raw data and materials are available upon request from the corresponding author via email.