

Abstract
Background
Recent studies have utilized MRI to determine the extent to which COVID‐19 survivors may experience cardiac sequels after recovery.
Purpose
To systematically review the main cardiac MRI findings in COVID‐19 adult survivors.
Study type
Systematic review.
Subjects
A total of 2954 COVID‐19 adult survivors from 16 studies.
Field Strength/sequence
Late gadolinium enhancement (LGE), parametric mapping (T1‐native, T2, T1‐post (extracellular volume fraction [ECV]), T2‐weighted sequences (myocardium/pericardium), at 1.5 T and 3 T.
Assessment
A systematic search was performed on PubMed, Embase, and Google scholar databases using Boolean operators and the relevant key terms covering COVID‐19, cardiac injury, CMR, and follow‐up. MRI data, including (if available) T1, T2, extra cellular volume, presence of myocardial or pericardial late gadolinium enhancement (LGE) and left and right ventricular ejection fraction were extracted.
Statistical Tests
The main results of the included studies are summarized. No additional statistical analysis was performed.
Results
Of 1601 articles retrieved from the initial search, 12 cohorts and 10 case series met our eligibility criteria. The rate of raised T1 in COVID‐19 adult survivors varied across studies from 0% to 73%. Raised T2 was detected in none of patients in 4 out of 15 studies, and in the remaining studies, its rate ranged from 2% to 60%. In most studies, LGE (myocardial or pericardial) was observed in COVID‐19 survivors, the rate ranging from 4% to 100%. Myocardial LGE mainly had nonischemic patterns. None of the cohort studies observed myocardial LGE in “healthy” controls. Most studies found that patients who recovered from COVID‐19 had a significantly greater T1 and T2 compared to participants in the corresponding control group.
Data Conclusion
Findings of MRI studies suggest the presence of myocardial and pericardial involvement in a notable number of patients recovered from COVID‐19.
Level of Evidence
3
Technical Efficacy Stage
3
Keywords: COVID‐19, cardiac magnetic resonance imaging, adult survivors
To date, coronavirus disease 2019 (COVID‐19), caused by the novel severe acute respiratory syndrome coronavirus‐2 (SARS‐CoV‐2), has affected over 184 million people, of whom approximately 170 million have recovered. 1
Myocardial injury have been noted in a 17.85% (95% confidence interval (CI): 13.18–23.72) of hospitalized patients with SARS‐CoV‐2 infection in the acute phase. 2 Consistent with other viral diseases, 3 , 4 there are increasing concerns that some of these cardiac sequels may persist beyond the acute phase of the disease into several weeks and months of recovery in survivors. Also, it has been assumed that some survivors may develop cardiac complications due to persistent inflammation in the convalescent period. 5 If untreated, sustained cardiac injury, especially myocarditis and fibrosis, could have severe consequences such as malignant arrhythmia, heart failure, and sudden cardiac death. 6 , 7
Given the high prevalence of the infection and the potential poor prognosis of cardiac complications in the absence of timely management, it is important to identify the extent to which survivors may be affected. Hence, recent studies have assessed the presence of cardiac involvement using MRI, a noninvasive diagnostic tool, in patients infected by SARS‐CoV‐2 after recovery. 8 , 9 , 10 , 11 , 12 , 13 , 14 , 15 , 16 , 17 , 18 , 19 , 20 , 21 , 22 , 23 , 24 , 25 , 26 , 27 , 28 , 29
There is no published systematic review of MRI studies focusing on COVID‐19 survivors. In the systematic review of Ojha et al, 30 all except five selected articles were case reports on patients in the acute phase of COVID‐19. Hence, the aim of this systematic review was to summarize the main cardiac MRI findings in COVID‐19 adult survivors reported in all available case series and cohort studies.
Materials and Methods
The study's methodology followed the recommendations outlined in the Preferred Reporting Items for Systematic Reviews and Meta‐Analyses (PRISMA) statement. 31 No ethical approval was required because this study was a systematic review of published studies.
All eligible studies that assessed cardiac sequels in COVID‐19 adult survivors through MRI were included in this systematic review.
Search
Electronic databases, including PubMed, Embase, and Google Scholar, were searched on March 6, 2020, and again on June 24, 2021.
The search was conducted using key terms for four domains: 1) “COVID‐19,” “sars‐COV‐2,” “novel corona,” or “2019‐nCOV,” 2) “cardiac complications,” “cardiac involvement,” “myocardial inflammation,” “cardiac injury,” “heart injury,” or “myocarditis”; 3) “cardiac magnetic resonance,” “cardiac MRI,” or “CMR,”; and 4) follow‐up, “follow up,” “after recovery,” “after discharged,” or “post‐acute.” While tailoring for each database, terms were combined by “OR” in each domain, then domains were combined by “AND.”
The reference list of each retrieved article was checked to identify any potentially eligible items that had not yet been retrieved. All retrieved articles were added to EndNote X8.2 reference management software, and duplicate studies were removed from the list.
Study Inclusion
Two independent researchers ([H.M. 3 years experience] and H.T. [5 years experience]) screened titles, abstracts, and full texts of retrieved articles hierarchically to identify the eligible items. Any disagreements were resolved by involving a third researcher (NSh [Ex.: 13 years] or HR [Ex. 11 years]).
Eligibility Criteria
We included observational studies that met all five of the following criteria:
Cardiac evaluation by MRI
Median/mean follow‐up time to MRI: at least 2 weeks after discharge or diagnosis
Including COVID‐19 out/inpatients who were at postacute phase
Having a case series (n > 10 cases) or a cohort design
Written in English
Data Extraction
Three independent researchers [N.Sh., H.R., and H.T.] extracted the data from the articles that fulfilled the inclusion criteria and recorded them in a “Data Extraction Form” generated using Microsoft Excel, as outlined in the following.
First author's name, country, study design, sample size, age, sex, study population, follow‐up duration (time from diagnosis/discharge to MRI), and main findings on: myocardial or pericardial late gadolinium enhancement (LGE), T1, T2, extra cellular volume (ECV), left ventricle (LV) and right ventricle (RV), ejection fraction (EF), global longitudinal strain (GLS), pericardial effusion (PE), troponin level. All extracted data were organized and presented in Tables 1, 2, 3, 4.
TABLE 1.
Characteristics of the Included Studies
| ID | Author | Country | Design | COVID‐19 Group in the Acute Phase | Control Group(s) | |||||||||
|---|---|---|---|---|---|---|---|---|---|---|---|---|---|---|
| Follow‐up Time (days) | Population | Disease Severity | Cardiac Symptom/Sign | N | % Male | Age (year) a | Population | N | % Male | Age (year) a | ||||
| 1 | Puntmann et al 15 | Germany | PC | 71 (64–92) c |
‐General population d PMH: DM: 18% CAD: 13%, HTN: 22% |
Asymptomatic: 18% Mild/moderate: 49% Severe: 33%/ventilated: 2% Hospitalized: 33% |
El. hs. Tr: 15% Others: NR |
100 | 53% | 49 (45–53) | I) Age and sex‐MHC | 50 | 50% | 48 (43–52) |
| II) RF Matched | 57 | 52% | 49 (46–52) | |||||||||||
| 2 | Clark et al 28 | USA | RC | 52 (NR)b |
Athlete d PMH: Negative |
Asymptomatic: 23% Mild: 77% Hospitalized: 0.0% |
NR | 22 | 41% | 20 (19–21) | I) HC | 22 | 64% | 30 (27–32) |
| II) Athletic | 22 | 86% | 31 (28–35) | |||||||||||
| 3 | Wang et. al 10 | China | RC | 102.5 (20.6)c |
‐General population d ‐PMH: Negative |
Moderate: 72.7% Severe: 35%/critical: 2.3% Hospitalized:100% |
NYHA III/IV: 8/2 Tr. I (ng/ml): 0.02 (0.01–0.02) |
44 | 43% | 47.5 ± 13.3 | Normal d | 31 | 61% | 47.1 ± 11.0 |
| 4 | Brito et al 29 | USA | RC | 27 (22–33) c |
‐Athlete d ‐PMH: Negative |
Asymptomatic: 30% Mild: 66% / Moderate: 4% Hospitalized: 0.0% |
Cardiac Sym.: 20% ECG change: 3% El. Tr: 3% |
54 | 85% | 19 (19–21) | Athletic d | 20 | 40% | 20 (19–21) |
| 5 | Huang et al 24 | China | RC | 47 (36–58) c |
‐Patients With cardiac sym. after discharge ‐ PMH: HTN: 8% |
Moderate: 85% Severe: 15% Hospitalized:100% |
NR | 26 | 38% | 38 (32–45) | Healthy | 20 | 35% | 40 (29–50) |
| 6 | Ng et al 17 | China | RC | 56 (NR) d | ‐Patients with ECG changes or El. Tr at acute phase/‐PMH: NR |
Mild/moderate: 94% Not reported: 6% Hospita:lized:100% |
1_Cardiac sym.: NR ECG changes: 88% El. Tr: 44% | 16 | 56% | 68 (53–69) | Healthy | 15 | NR | NR |
| 7 | Eiros et al 26 | Spain | RC | 73 (65–77) d |
Health‐care workers PMH: DM: 1%, HTN: 12%, CVD: 6% |
Oxygen therapy 11% Hospitalized: 16% |
Cardiac sym.: 62% Others: NR |
139 | 28% | 52 (41–57) | General Population (PMH: NR) | 20 | 30% | 53 (39–57) |
| 8 | Raman et al 13 | UK | RC | 70 (62–76) c |
General population PMH: DM:: 15.5% HTN: 37.9%, CAD: 3.4% |
Moderate:64% Severe: 36% Hospitalized:100% |
El. hs. Tr: 8% Chest pain 27.6% Others: NR |
58 | 59% | 55·4 ± 13·2 | Comorbidity/sex/ age‐ MC | 30 | 60% | 53·9 ± 12·3 |
| 9 | Pan et al. 16 | China | PC | 46 (43–50) d |
General population PMH: negative |
Mild/moderate/severe/critical 19%/67%/14%/ 0% ‐ Hospitalized:100% | NR | 21 | 47.6% | 36 (31–47) | Age /sex‐ MC | 20 | 40% | 50 (32–61) |
| 10 | Vago et al 11 | Hungary | RC |
F:17 (17–19) M: 67/90 d |
Athlete d ‐PMH: Negative |
Asymptomatic: 17% Mild: 83% Hospitalized: 0.0% |
Cardiac sym. 8% (1) El. Tr.: 0.0% (0) ECG change: NR |
12 | 17% | 23 (20–23) | Athlete | 15 | NR | NR |
| HC | 15 | NR | NR | |||||||||||
| 11 | Kotecha et al 21 | UK | RC | 68 (39 103) d |
General population PMH; DM: 34% HTN: 57%/CAD: 7% |
Severe: 100% ventilated: 32% Hospitalized:100% |
Elevated Tr.: 100% Tr level (median [IQR]): 26 (19–70) |
148 | 70% | 64 (12) | Age/sex MHC | 40 | 70% | 64 (9) |
| HC | 40 | 57% | 49 (6) | |||||||||||
| 12 | Joy et al 23 | UK | PC | 180 c |
Seropositive HCW HTN: 10%, DM: 2%, CAD: NR |
Asymptomatic: 39% Mild: 61% Hospitalized: 3% |
NR | 74 | 38% | 39 (30–48) | Seronegative HCW, age, sex, ethnicity | 75 | 47% | 37 (31–47) |
| 13 | Daniels, et al 27 | USA | CS | 22.5 (28.5)c |
Athletes PMH: Negative |
NR | NR | 1597 | NR | NR | ‐ | ‐ | ‐ | |
| 14 | Moulson et al 18 | USA | CS | 33 (18 63) c | Athletes, clinically indicated CMR: 37.5% PMH: Negative | NR | NR | 317 | NR | ‐ | ‐ | ‐ | ‐ | ‐ |
| 15 | Rajpal et al 14 | USA | CS | 23 (17–30) b |
Athlete d PMH: Negative |
Asymptomatic: 54% Mild: 46% Hospitalized: 0.0% |
NR | 26 | 58% | 19.5 ± 1.5 | ‐ | ‐ | ‐ | ‐ |
| 16 | Knight et al 22 | UK | CS |
I) 46 ± 15 b II) 37 ± 10 c |
Cases with an EL. Tr of unknown cause at the acute phase PMH: Negative |
ICU ventilated: 34% Hospitalized:100% |
El. Tr: 100% hsTr (ng/liter): 23.0 (19.0–32.8). Others: NR |
29 | 83% | 64 ± 9 | ‐ | ‐ | ‐ | ‐ |
| 17 | Małek et al 20 | Poland | CS | 32 (22–62) c |
Athlete PMH: Negative |
Asymptomatic: 23% Mild: 54% Moderate: 19% Severe/hospitalized: 4% |
NR | 26 | 19% | 24 (21–27) | ‐ | ‐ | ‐ | ‐ |
| 18 | Fu et al 25 | China | CS | 180 | General population |
Severe: 17% Hospitalized:100% |
El. Tr: 21% El. myocardial injury marker, abnormal echo, or ECG: 67.7% |
34 | NR | NR | ‐ | ‐ | ‐ | ‐ |
| 19 | Starekova et al 12 | USA | CS | 15 (11–194) c |
Athlete PMH: Negative |
Asymptomatic: 16.5% Mild: 49% Moderate: 27.5% |
Chest Pain: 5% Other: NR |
145 | 74% | 19.6 ± 1.3 | ||||
| 20 | Wu et al 9 | China | CS | 180 c |
General population PMH; DM: 18.5% HTN: 14.8%/CAD: 0.0% |
Severe: 41% Hospitalized:100% |
At least one cTn concentration > 26 pg/mL: 50% | 27 | 30% | 63 [58, 70] | ‐ | ‐ | ‐ | ‐ |
| 21 | Martinez, et al 19 | USA | CS | 19 (3–156) c |
Athletes with abnormal test results on cardiac screening at follow‐up PMH: Negative |
Asymptomatic/pauci‐symptomatic: 41.7% Severe: 0.0% Hospitalized: 0.0% |
NR | 27 | NR | NR | ‐ | ‐ | ‐ | |
| 22 | Zhou et al 8 | Hong Kong | CS | 14–28 b |
General population Abnormal ECG/elevated Tr |
Hospitalized: 100% | NR | 12 | NR | NR | _ | _ | _ | |
CAD = coronary artery disease; CS = case series; DM = diabetes mellitus; El. hs. Tr = elevated hs troponin; HTN = hypertension; IQR = interquartile range; MC = matched control; MHC = matched healthy control; NR = not reported; NYHA = New York Heart Function Classification; PMH = past medical history; PC = prospective cohort; RC = retrospective cohort; Sym. = symptoms; Tr = troponin.
Median (IQR)/Mean ± SD.
Median (IQR)/Mean ± SD time from discharge.
Median (IQR)/Mean ± SD from diagnosis.
Patients were consecutively recruited regardless of having cardiac symptoms at the acute phase.
§Cardiac Sym./ECG change/El. Tr, or Tr level (median [IQR]).
TABLE 2.
Quality of the Included Cohort Studies
| N. | Study | Selection | Comparability | Outcome | Total Of 9 scores | ||||||
|---|---|---|---|---|---|---|---|---|---|---|---|
| 1 | 2 | 3 | 4 | II (**) | a | b | c | Class | |||
| 1 | Puntmann et al 15 | * | * | * | ‐ | ** | * | * | * | 8 | Good |
| 2 | Clark et al 28 | * | * | * | ‐ | ** | * | * | * | 8 | Good |
| 3 | Wang et al 10 | * | * | * | ‐ | ‐ | * | * | * | 6 | Fair |
| 4 | Brito et al 29 | * | * | * | ‐ | ** | * | * | * | 8 | Good |
| 5 | Huang et al 24 | ‐ | * | * | ‐ | ‐ | * | * | * | 5 | Fair |
| 6 | Eiros et al 26 | * | * | * | ‐ | ‐ | * | * | * | 6 | Fair |
| 7 | Raman et al 13 | * | * | * | ‐ | ** | * | * | * | 8 | Good |
| 8 | Pan et al 16 | * | * | * | ‐ | ** | * | * | * | 8 | Good |
| 9 | Kotecha et al 21 | * | * | * | ‐ | ** | * | * | * | 8 | Good |
| 10 | Ng et al 17 | ‐ | * | * | ‐ | ‐ | * | * | * | 5 | Fair |
| 11 | Vago et al 11 | * | * | ‐ | ‐ | ‐ | * | * | * | 5 | Fair |
| 12 | Joy et al 23 | * | * | * | ‐ | ** | * | * | * | 8 | Good |
1: Representativeness of exposed cohort (*).
2: Selection of nonexposed cohort (*).
3: Ascertainment of exposure (*).
4: The Outcome of Interest Was Not Present at Start of Study (*).
II: Comparability of Cohorts on the Basis of the Design or Analysis (**).
a: Assessment of outcome (*).
b: Enough follow‐up time for outcomes to occur (*).
c: Adequacy of follow‐up (*).
TABLE 3.
Cardiac MRI Parameters of Myocardial and Pericardial Involvement in Recovered COVID‐19 Patients
| Author | Group | T1 (msec) | T2 (msec) | LGE % (N) | PE % (N) [cut point] | ECV a Mean (SD) | Abnormal Finding | Tesla | |||||
|---|---|---|---|---|---|---|---|---|---|---|---|---|---|
| Mean (SD)/Median (IQR) | Abnormal % (N) [cut point] | Mean (SD)/Median (IQR) | Abnormal % (N) [cut point] | Total | Myocardial | Pericardial | |||||||
| Ischemic | Nonischemic | ||||||||||||
| Puntmann et al 15 | COVID‐19 | 1130 (1119, 1150) | 73% (73) [NR] | 39 (37, 40) | 60% (60) | 74% (74) | 32% (32) | 20% (20) | 22% (22) | 20% (20) [>10 mm] | NR |
T1 T2 LGE PE |
3 |
| H C | 1077 (1065, 1089)* | 6% (3)* | 35 (34, 36) * | 4% (2)* | 0.0 (0)* | 0.0% (0)* | 0.0 (0)* | 0.0 (0)* | 0.0 (0)* | NR | |||
| MC | 1109 (1101,1119)* | 40% (23)* | 36 (35, 37)* | 9% (5)* | 39% (21) * | 17% (9)* | 7% (4)* | 15% (8) | 15% (8)* | NR | |||
| Clark et al 28 | COVID‐19 | 982 (973, 997) b | 5% (1) [>1042 msec] | 46.4 (45.2, 48.2) b | 13.5% (3) [>53.9 msec] | 9% (2) | 4.5% (1) | 4.5% (1) | 4.5% (1) | NR | 25.3 (2.6) b |
T2 LGE ECV |
1.5 |
| HC | 978 (963, 998) | NR | 44.6 (43.2, 45.4) * | 0.0% (0) | 0.0 (0)* | 0.0% (0) | 0.0 (0) | 0.0% (0) | NR | 24 (3) | |||
| Athletic C. | 989 (963, 1008) | NR | NR | 0.0% (0) | 0.0 (0) * | 0.0% (0) | 0.0 (0) | 0.0% (0) | NR | 22.5 (2.6)* | |||
| Wang et. al 10 | COVID‐19 | NR | NR | NR | 0.0% (0) | 30% (13) | 0.0% (0) | 30% (13) | 0.0% (0) | NR | NR | LGE | 3 |
| Normal C | NR | NR | NR | 0.0% (0) | 0.0 (0) | 0.0% (0) | 0.0 (0) | 0.0% (0) | NR | NR | |||
| Huang et al 24 | COVID‐19 | 1256.2 (27.66) | NR | 40.8 (3.6) | 57.6% (15) c | 31% (8) c | 0.0% (0) | 31% (8) | 0.0% (0) | 27% (7)c [NR] | 26.8 (4.7) |
T1, T2 LGE, PE, ECV |
3 |
| HC | 1224 (10.5)* | NR | 39.1 (3.1)* | 0.0% (0) | 0.0% (0) | 0.0% (0) | 0.0 (0) | 0.0% (0) | 0.0(0) | 23.7 (1.5) * | |||
| Brito et al 29 , d | COVID‐19 | 969 (950, 984) | 19% (9) [>990 msec] | 44.0 (42.0, 45.0) | 0.0% (0) [>52 msec] | 41.7% (20) | 0.0% (0) | 2.% (1) | 39.6% (19) | 58% (28) [≥5 mm] | NR |
T1, LGE PE |
1.5 |
| Rajpal et al 14 | COVID‐19 | 983 (961, 1002) | 42% (11) [>990 msec] | 52.5 (49.8, 53.0) | 15.4% (4) [>54 msec] | 46.2% (12) | 0.0% (0) | 46.2% (12) | 0.0% (0) | 8% (2) | 24.7 (2.9) |
T1, T2 LGE ECV |
3 |
| Ng et al 17 | COVID‐19 | 1209 (1164, 1219) | 50% (8) [>1208 msec] | 52 (50, 56) | 31% (5) [>54.5 msec] | 15% (4) | 6.3% (1) | 18.8% (3) | 0.0% (0) | NR | NR |
T1, T2 LGE |
1.5 |
| HC | 1158 (1109–1208) * | NR | 48.0 (41.5, 54.8) * | NR | NR | NR | NR | NR | NR | NR | |||
| Knight et al 22 | COVID‐19 | NR | NR | NR | 0.0% (0) | 100% (29) | 31% (9) | 51.7% (15) | 0.0%(0) | 7% (2) [NR] | NR | LGE | 1.5 |
| Eiros et al 26 | COVID‐19 | 1020 (1005–1040) | 42% (58) [NR] | 50 (48–51) | 4% (6) [NR] | 7% (10) | NR | NR | NR | 30% (42) [>3 mm] | NR | T1, T2, LGE, PE, ECV | 1.5 |
| Controls | 1004 (980–1034)* | 0.0% (0) | 54 (51–55)* | 0.0% (0) | 0.0% (0) | NR | NR | NR | 0.0% (0) | NR | |||
| Raman et al 13 | COVID‐19 | 1179·7 (34·4) | 26·0% (13/50) | 41·7 (2·2) | 2% (1/50) | NR | 1.9% (1/52) | 11.5% (6) | NR | 1.9% (1/52) [>10 mm] | 30·4 (28·3–31·3) |
T1 LGE |
3 |
| MC | 1149·3 (24·0)* | 3·7% (1/28) | 41·6 (2·2) | 3.6%(1/28) | NR | 7.4% (2/28) | 0.0% (0) | NR | 0.0% (0) | 28·3 (26·8–31·5) | |||
| Vago et al 11 | COVID‐19 | 957 (943, 972) | NR | 44 (44–45) | 0.0% (0) | 0.0% (0) | 0.0% (0) | 0.0% (0) | 0.0% (0) | 0.0% (0) | NR | T1 | 1.5 |
| Athlete C. | 957 (951, 976) | NR | 44(44–45) | 0.0% (0) | 0.0% (0) | 0.0% (0) | 0.0% (0) | 0.0% (0) | 0.0% (0) | NR | |||
| HC | 981 (966, 990)* | NR | 46(44–47) | 0.0% (0) | 0.0% (0) | 0.0% (0) | 0.0% (0) | 0.0% (0) | 0.0% (0) | NR | |||
| Pan et al 16 | COVID‐19 | 1208.4 (64.2) | 23.8% (5/21) [1337.1] | 49.2 (46.1–54.6) | 47.6% (10/21) [>59.8] | NR | NR | NR | NR | NR | NR | T1, T2 | 3 |
| MC | 1213.6 (61.7) | NR | 48.3 (45.2–51.7)* | NR | NR | NR | NR | NR | NR | NR | |||
| Kotecha et al 21 | COVID‐19 | 1033 (41) | 13% (19) [>1076] | 46 (3) | 3% (4) [>52] | 49% (70) | 22% (32) | 33% (47) | NR | 5%(8) | NR | T1, LGE, PE | 1.5 |
| MC | 1028 (35) | 13% (5) | 47 (3) | 3% (1) | 45% (18) | 15% (10) | 20% (8) | NR | NR | NR | |||
| HC | 1008 (35)* | NR | 48 (2) | NR | 0.0% (0) | 0.0% (0) | 0.0% (0) | NR | NR | NR | |||
| Joy et al 23 | COVID‐19 | 1020 (34) | 7% (5) [>1072] | 48.8 (2.5) | 9% (7) [>52.4] | 19% (14) e | NR | NR | NR | NR | 22.3 (2.0) | T1, T2, LGE, ECV | 1.5 |
| MC | 1016 (28) | 1% (1) | 48.6 (1.9) | 3% (2) | 17% (13) | NR | NR | NR | NR | 22.1 (2.2) | |||
| Malek et al 20 | COVID‐19 | 1010 (992–1028) | 0.0% (0) [1054] | 46 (45–48) | 4% (1/26) [50] | 4% (1) | 0.0% (0) | 4% (1) | 0.0% (0) | 8.0% (2) [NR] | 26 (24–27) |
LGE T2 |
1.5 |
| Starekova, et al 12 | COVID‐19 | 978 (40) [3 T: 1129 (84)] | NR | 48 (4) [3 T: 49 (5)] | NR | 29% (42) c | NR | NR | NR | NR | NR | LGE | 1.5 or 3 |
| Wu et al 9 | COVID‐19 | 1211.7 [1185.2, 1247.1] | NR | NR | NR | 30% (8) | NR | 26% (7) | NR | NR | 0.28 [0.26, 0.31] | LGE | 3 |
| Martinez, et al 19 | COVID‐19 | NR | NR | NR | NR | 18.5% (5) | NR | NR | 7% (2) | NR | NR | LGE | NR |
| Zhou et al 8 | COVID‐19 | NR | NR | NR | NR | 0.0% (0) | NR | NR | NR | NR | NR | NR | NR |
C = control; IQR = interquartile range; HC = healthy controls; MC = matched controls; NR = not reported; SD = standard deviation; PE = pericardial effusion.
P value < 0.05.
Clark et al: ECV > 30.3% in 1 patient (4.5%); Rajpal: ‐ ECV ≥27 in 6 (23%) and > 29% in 1 patient (4%).
On mid septum slice.
On conventional MRI.
MRI performed only for COVID‐19 patients.
Non‐RV insertion point: 8% in COVID‐19 patients and 9% in controls.
TABLE 4.
Cardiac Function Based on MRI Findings and Troponin Level in Patients Recovered From COVID‐19
| Author | Group | On CMR | Troponin (pg/mL) | Finding + | Other Important Findings | |
|---|---|---|---|---|---|---|
| LVEF | RVEF | |||||
| Mean (SD)/Med (IQR) | Mean (SD)/Med (IQR) | Mean (SD)/Med (IQR) | ||||
| Puntmann et al 15 | COVID‐19 | 56 (54–58) | 56 (52–59) | 5.6 (4.1–6.6) |
‐LV and RV dysfunction ‐Elevated Tr. |
‐Troponin was significantly correlated with native T1 and T2 mapping ‐Detectable hsTr.T (≥3 pg/Ml) No. (%) in 71% (71) [COVID‐19] > 11% (22) [HC] and 31% (57) [RF matched C.] ‐ hsTr.T ≥ 13.9 pg/mL, No. (%) in 5% (5) of COVID‐19 and 0.0% (0) of controls |
| Healthy C. | 60 (58–62)* | 60 (56–63)* | 3.2 (3.0–3.5)* | |||
| RF Matched C | 61 (58–64)* | 59 (56–62)* | 3.9 (3.2–4.5)* | |||
| Clark et al 28 | COVID‐19 | 60 (59, 63) | 52 (50, 54) | NR | ‐RV dysfunction |
‐Echocardiographic finding of COVID‐19 cases (n = 16): LVEF, %: 59 (56, 63), GLS, %: −18.2 (−19.7, −15.6) ‐Increased RV volumes in COVID‐19 cases rather than others on MRI ‐No one had abnormal Tr, ECG, or LVEF < 50% [on echocardiography] |
| Healthy C | 60 (57, 64) | 57 (55, 60)* | NR | |||
| Athletic C. | 61 (57, 64) | 56 (51, 59)* | NR | |||
| Wang et al 10 | COVID‐19 | 62.8 (4.9) | 57.4 (8.4) | NR | NR | ‐ |
| Normal C. | 62.0 (6.7) | 59 .1 (6.5) | NR | |||
| Brito et al 29 | COVID‐19 | 59.91 (56.64, 62.88) | 53.58 (48.33, 59.43) | NR | LV dysfunction |
‐LVEF < 50% in one symptomatic COVID‐19 patient (echo and MRI) ‐‐None has elevated inflammatory biomarkers ‐On echocardiography, no significant differences between control and patients with and without symptoms regarding LVEF% and RVEF |
| Athletic C. | NR | NR | NR | |||
| Huang et al 24 | COVID‐19 | 62.2 (6.3) | 38.4 (7.5) | 2.0 (1.9–2.2) | ‐RV dysfunction |
‐The hs‐cTr I level was in the normal range for all recovered patients at the time of MRI ‐ EF < 50% in one COVID‐19 patient on MRI but not seen in controls |
| Healthy C. | 63.0 (8.9) | 46.1 (12.0) * | NR | |||
| Rajpal et al 14 | COVID‐19 | 57.73 (6.22) | 56.88 (4.26) | NR | ‐LV dysfunction |
‐ EF < 50% in one case, EF <55 in 3 Cases on MRI ‐ No athlete had elevated serum levels of Tr I or ECG changes |
| Ng et al 17 | COVID‐19 | 59 (56–65) | 53 (48–57) | NR | NR | ‐ Six out of nine patients who had abnormal MRI finding (s) had elevated blood biomarkers of inflammation |
| Knight et al 22 | COVID‐19 | 67.7 ± 11.4 | 63.7 ± 9.5 | All | LV and RV dysfunction | ‐ One patient had mild LV dysfunction, and one had severe biventricular dysfunction. |
| Pan et al 16 | COVID‐19 | 61.6 (6.5) | 54.7 (7.1) | NR | RV dysfunction |
‐Severity of disease, elevated level of Hs‐CRP and D‐Dimer, and lymphopenia during hospitalization was significantly associated with higher T2 value. ‐Elevated Hs‐CRP level was significantly associated with higher T1 value. |
| Matched Controls | 64.8 (9.5) | 60.3 (6.9) * | NR | |||
| Starekova, et al 12 | COVID‐19 | 58 (5) | 54 (6) | NR | ‐ | ‐ |
| Wu et al 9 | COVID‐19 | 56 [54, 59] | NR | 2.9 [2.0, 4.4] | NR | Patients with cardiac injury during hospitalization showed significantly higher levels of hs‐cTnI (pg/mL) (4.3 [2.0, 6.7] vs. 2.5 [1.8, 2.9]; P value: 0.041) and d NT‐pro BNP (99 [78, 138] vs. 47 [36, 61]; P value: 0.004) |
| Eiros et al 26 | COVID‐19 | 64 (60–67) | 63 (59–68) | NR | Elevated Tr. | ‐hs.Tr > 14 pg/mL in one patients |
| Controls | 68 (62–71) | 66 (61–69) | NR | |||
| Raman et al 13 | COVID‐19 | 63·0 (7·72) | 57·9 (7·8) | 2·0 (2·0–3·0) | NR | ‐ |
| Matched Controls | 63·6 (6·32) | 57·6 (6·0) | 2·0 (2·0–3·0) | |||
| Vago et al 11 | COVID‐19 | 58 (55–61) | NR | NR | NR | ‐ |
| Athlete | 57 (54–60) | NR | NR | |||
| Healthy Controls | 60 (58–63) | NR | NR | |||
| Malek et al 20 | COVID‐19 | 61 (60–62) | 59 (57–60) | 4.0 (4.0–5.0) | LV dysfunction |
Detectable Tr (>4 pg/mL): 15% (4), Abnormal Tr (>13.90 pg/mL): 0.0% Abnormal LVEF: 8% (2) / Abnormal RVEF: 0.0% (0) |
| Kotecha et al 21 | COVID‐19 | 67 (11) | 61(9) | NR | NR | ‐ |
| Matched Controls | 67 (9) | 64(7) | NR | |||
| Healthy Controls | 66(5) | 61(5) | NR | |||
| Joy et al 23 | COVID‐19 | 67.5 (64.4–70.2) | NR | 4 (3–7) | ‐ | ‐ |
| Matched Controls | 66.8 (62.8–70.1) | NR | 4 (3–7) | ‐ | ||
| Fu et al 25 | COVID‐19 | NR | NR | NR | LV dysfunction | LVEF<50: 47% (16), RVEF: 15% (5) |
| IMartinez, et al 19 | COVID‐19 | NR | NR | NR |
Elevated Tr. LV dysfunction |
‐Five patients had a hs‐ Tr level greater than the 99th percentile of the reference laboratory value ‐LVEF <50 reported in two patients on CMR ‐Abnormal ECG: 33% (9) 18 abnormal ECHO |
C = control; IQR = interquartile range; GLS = global longitudinal strain; EF = ejection fraction; LV = left ventricular; LVEF = left ventricular ejection fraction; NR = not reported; RV = right ventricular; RVPLS = right ventricle peak longitudinal strain; SD = standard deviation; Tr = troponin.
P value < 0.05.
Quality Assessment
Two members of the research team (H.M. and H.K.) independently assessed the quality of the included articles using an appraisal tool adapted for use in observational studies, and any disagreement was resolved through discussion or a third researcher (H.R., N.Sh., or H.T.).
Quality appraisal was performed using the Newcastle–Ottawa scale (NOS) 32 for the cohort studies and NIH Quality Assessment Tool for Case Series Studies. 33 Both appraisal tools contained nine items, and their total score ranged from 0 to 9; the scores were categorized into three groups: poor: met 0–3, fair: met 4–6 criteria, and good: met 7–9 criteria.
Results
Study Selection Process
A total of 1601 articles were identified through the initial search, of which 527 were duplicates and 1052 did not meet the inclusion criteria (by title/abstract: n = 893, full text: n = 159). Twenty‐two articles, including 12 cohort studies and 10 case series studies, were eligible for inclusion in this review (Fig. 1).
FIGURE 1.
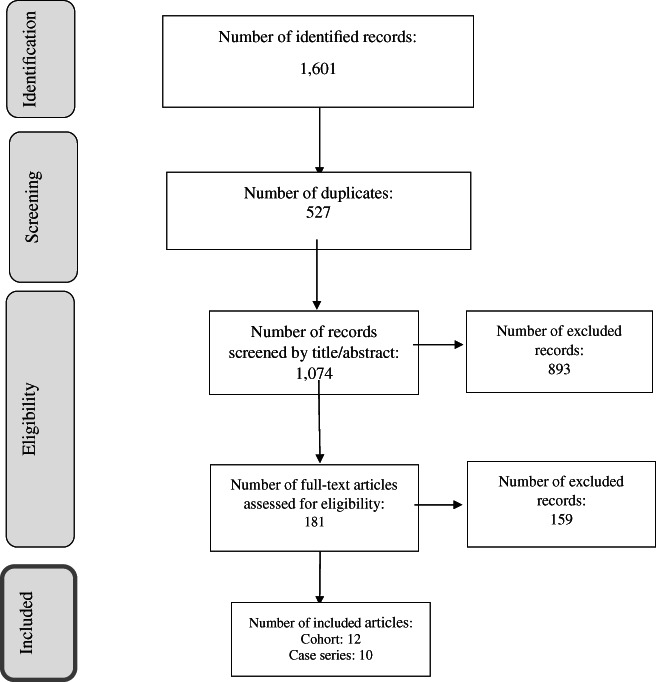
PRISMA flowchart of literature search and selection process
Study Characteristics
Table 1 presents the characteristics of the studies included in this systematic review. These studies were carried out in China (n = 6), the United States (n = 7), the United Kingdom (n = 4), Poland (n = 1), Hungary (n = 1), Spain (n = 1), Germany (n = 1), and Hong Kong (n = 1). Overall, they involved 2954 COVID‐19 adult survivors; the sample sizes ranged from 12 to 1597 COVID‐19 survivors. Patients were consecutively recruited in 15 studies (six case series and nine cohort studies), regardless of cardiac symptoms at the acute phase or follow‐up time. 8 , 10 , 11 , 13 , 14 , 15 , 23 , 25 , 26 , 27 , 28 , 29 , 34 The mean/median age of participants ranged from 19 to 68 years, with a male predominance in most studies. Median/mean time from diagnosis/discharge to the cardiac imaging assessment varied across the studies, with a minimum of 15 days and a maximum of 180 days.
In terms of the severity of COVID‐19 disease, eight studies (five case series and three cohort studies) included nonhospitalized athletes with asymptomatic or mild infection. 11 , 12 , 14 , 18 , 20 , 27 , 28 , 29 In others, study populations varied in terms of hospitalization rate and disease severity.
All cohort studies, but one, 23 included an external control group selected by different criteria. 10 , 11 , 13 , 15 , 16 , 17 , 21 , 24 , 26 , 28 , 29 The exception was the cohort study conducted by Joy et al 23 that included SARS‐CoV‐2 seropositive and seronegative health care workers. In two studies, echocardiography was performed along with MRI for evaluating cardiac involvement. 28 , 29
The quality score was >5 in all cohort studies (Table 2) and >6 in the case series studies conducted by Rajpal et al 14 (8 scores), Małek et al 20 (8 scores), Daniels et al 27 (8 scores), Starekova et al (8 scores), 12 Martinez et al 19 (7 scores), Wu et al 9 (7 scores), Moulson et al 18 (7 scores), Knight al 22 (6 scores), Fu et al 25 (6 scores), and Zhou et al 8 (6 scores).
Table 3 presents the cardiac MRI parameters of myocardial and pericardial involvement in recovered COVID‐19 patients reported by different studies.
Myocardial Involvement
Of the 15 studies that evaluated both T2 and LGE, Vago et al found raised T2 or LGE in none of 12 patients. 11 Wang et al, 10 Brito et al, 29 and Knight et al 22 detected LGE in 30%, 41.7%, and 100% of their patients, respectively, but did not find a raised T2 in any of them. Starekova et al 12 found LGE in 14 of 74 (19%) patients but they failed to provide information on rate of raised T2. The remaining studies reported rates of increased T2 ranging from 2% to 60% and LGE ranging from 4% to 74%.
Four out of 22 studies that evaluated LGE (n = 3) or T2 (n = 1) of which, Pan et al reported raised T2 in 10 of 21 patients (47.6%) 16 and remaining studies conducted by Wu et al, 9 Martinez et al, 19 and Zhou et al. 8 found LGE in 30%, 18.5%, and 0.0% of participants, respectively.
The rate of nonischemic myocardial enhancement in COVID‐19 patients varied from 2% in the Brito et al 29 study to 51.7% in the Knight et al 22 study, more frequently detected in the studies that included a higher percentage of patients with severe form of the disease at the acute phase. 9 , 13 , 15 , 21 , 22 None of the cohort studies observed myocardial LGE in healthy controls. However, Puntmann et al 15 and Kotecha et al 21 detected nonischemic myocardial enhancement in their risk‐matched control groups, but with a lower frequency (Puntmann et al 15 : 7% vs. 20%; Kotecha et al 21 : 20% vs 33%).
Fourteen out of 22 studies, including 4 case series and 10 cohort studies, performed T1 mapping; the rate of raised T1 varied from 0% in the Malek et al 20 study to 73% in the Puntmann et al 15 study. Six out of 10 cohort studies reported that patients who recovered from COVID‐19 had a significantly greater mean T1 (also T2) compared to participants in the corresponding control group. 13 , 15 , 17 , 21 , 24 , 26 Based on Lake Louise criteria (LLC), Moulson et al 18 identified cardiac involvement in 21 of 317 (7%) athletes, which was more frequent in those who underwent clinically indicated MRI (15/119, 12.6%) than in those undergoing a primary screening MRI (6/198 (3.0%)) and concluded that cardiac MRI will be optimized by confining its use to athletes presenting with cardiopulmonary symptoms and/or abnormalities on triad testing (ECG, elevated troponin, and echocardiography).
However, Daniels et al 27 identified myocarditis in 2.3% of athletes (37/1597) based on a modified version of LLC; they also found that a strategy using cardiac MRI in all athletes, regardless of cardiac symptoms or triad testing results, increases the prevalence of diagnosis to a 7.4‐fold compared to the symptom‐driven (2.3% vs. 0.31%) and to 2.8‐fold to cardiac testing strategies (2.3% vs. 0.81%). In addition, cardiac MRI follow‐up of 27 of these 37 athletes (follow‐up duration [weeks] mean [SD]: 9.4 [3.1] from COVID‐19 diagnosis) showed two patterns of resolution: 1) resolution of both T2 mapping abnormalities and LGE in 11 of 27 athletes and 2) resolution of T2 mapping abnormalities but persistence of LGE in 16 of 27 athletes. Clinical myocarditis cases were less likely to experience resolution of LGE than subclinical cases.
Myocardial involvement defined by this criteria was also reported in other studies: Eiros et al 26 (26% [n = 36]), Ng et al 17 (18.8% [n = 3]), Rajpal et al 14 (15% [n = 4]), Clark et al, 28 (4.5% [n = 1]), Starekova et al 12 (1.3% [n = 2]), and Malek et al 20 (0.0% [n = 0]).
Among cohort studies that measured ECV (%), while Clark et al 28 and Huang et al 24 , 30 both found a greater mean ECV (%) in COVID‐19 patients than in control subjects, Raman et al 13 and Joy et al 23 did not detect any significant difference. Increased ECV rates (%) were reported by Eiros et al 26 (36% [n = 52], cut point: not reported [NR]), Rajpal et al 14 (23% [n = 6], cut point: ≥27%), Clark et al 28 (4.5% [n = 1], cut point: >30.3%), Joy et al 23 (3.0%, cut point: NR), and Malek et al 20 (0.0% [n = 0], cut point: 31.9%).
Fu et al 25 reported the presence of edema in 10 (29.41%) and fibrosis in 2 (5.80%) patients, mainly in the subgroup of patients with cardiac abnormalities (having elevated myocardial injury marker, abnormal echocardiographic, and/or electrocardiographic results) at admission. However, they provided no information on how edema and fibrosis were defined on MRI.
Wu et al 9 observed that patients with cardiac injury compared to those without cardiac injury (having at least one cTn concentration > 26 pg/mL during hospitalization) had a higher rate of LGE [7/13 (53.8%) vs. 1/14 (7.1%), P = 0.013]. They detected no significant differences between two groups regarding T1 and ECV measurements.
Pericardial Involvement
Pericardial enhancement in patients recovered from COVID‐19 was observed in the studies conducted by Brito et al 29 (39.6%), Puntmann et al 15 (22%), Martinez et al 19 (7%), and Clark et al 28 (4.5%). Seven studies observed Pericardial LGE in none of their study population. 10 , 11 , 14 , 17 , 20 , 22 , 24
The rate of pericardial effusion in COVID‐19 patients varied from 0% 11 to 58% 29 in 10 studies that evaluated its presence (Table 3).
Cardiac Function
As presented in Table 4, right ventricle ejection fraction (RVEF) mean in the COVID‐19 group was significantly lower than that in the control group in four out of eight cohort studies. 15 , 16 , 24 , 28 Mean/median left ventricle ejection fraction (LVEF) fell in the normal range in all studies; six studies also reported the number of cases with LVEF<50% 19 , 20 , 24 , 25 , 28 , 29 ; while Fu et al 25 reported abnormal LVEF (<50%) in 16 of 34 cases; the remained studies detected it in a maximum of two cases.
The study of Wang et al 10 found that right ventricle (RV) and left ventricle (LV) strains significantly decreased in COVID‐19 with LGE compared to those without LGE and normal controls. Furthermore, Brito et al 29 found global longitudinal strain (GLS) < 16% (on echocardiography) only in COVID‐19 patients with pericardial LGE.
However, Puntmann et al 15 found that T1 and T2 had higher discriminatory values for COVID‐19 related involvement than parameters of volume and EF.
Six out of nine studies measuring troponin level at the time of MRI found elevated level of this biomarker of cardiac injury in none of the participants. 13 , 14 , 20 , 24 , 28 , 29 (Table 4).
Discussion
Included studies have reported different rates of cardiac MRI abnormalities in COVID‐19 adult survivors; however, most of them, including those involving asymptomatic patients, found a notable number of patients with raised T1, T2, and/or myocardial LGE.
In the previous systematic review, Ojha et al 30 pooled data from 34 MRI studies (29 case reports, 3 case series, and 2 cohort studies) comprising 199 COVID‐19 patients at different phases of the disease. Myocarditis was diagnosed in nearly 40% (80/199) of patients on cardiac MRI; and the common imaging findings, in order by frequency, were mapping abnormalities, edema, and LGE. However, their main findings' validity is questionable mainly due to the unreasonable pooling of the data from studies with different designs and population. 30
Varied rates of MRI abnormalities among studies may be explained by differences in the study populations in terms of past medical history (PMH) status, disease severity, follow‐up duration, and presence of cardiac symptoms.
Elevated T2 is specific for myocardial edema, 34 , 35 and elevated T1 may detect diffuse myocardial fibrosis and/or edema. 36 While elevated T1 and T2 simultaneously represent an active inflammatory process, isolated raised T1 in the absence of a raised T2 suggests residual diffuse myocardial damage. 37
In addition to T1 and T2, LGE indicates the existence of myocardial damage and allows the differentiation of ischemic from nonischemic injury. 38 In the included studies, myocardial LGE mainly had nonischemic patterns. Some patterns of LGE distribution in nonischemic myocardial injury, such as subepicardial and mid wall patterns, are commonly attributed to myocarditis. 39 , 40 Noteworthy, the studies that included a higher percentage of patients with severe form of the disease found a higher rate of nonischemic LGE compared to others. 9 , 10 , 15 , 21 , 22
Included studies also observed a notable prevalence of pericardial involvement, including effusion and/or positive LGE, either isolated or along with myocardial involvement in COVID‐19 patients.
Some studies observed LGE in the absence of edema, suggesting that fibrosis and scar may be permanent. 22 Also, studies found evidence of increased ECV (%), a marker of myocardial fibrosis, 41 in some patients. Myocardial fibrosis has been proven to be an independent predictor of cardiac mortality in patients with inflammatory myocarditis. 42 , 43
Prognostic value of abnormal CMR findings in recovered COVID‐19 is unknown. However, previous long‐term follow‐up of patients with suspected myocarditis revealed that abnormal cardiac MRI findings are a prognostic factor for poor outcomes. 44 , 45 Gräni et al 45 found that the presence of mid‐wall LGE (hazard ratio, HR [95%] confidence interval [CI]: 2.39 [1.54–3.69]), abnormal T2‐weighted ratio more than 2.0 (defined as signal intensity [SI] ratio of myocardium/skeletal muscle, HR [95% CI]: 2.14 [1.30–3.52]), and ECV mean greater than 35% (HR [95% CI]: 3.38 [1.43–7.97]) all were associated with a higher rate of major adverse cardiac events (MACE).
Also, evidence of isolated nonischemic myocardial LGE at MRI can be a substrate for malignant arrhythmia and severe complications, such as sudden cardiac death. 6 , 7 , 46
Based on Lake Louise Criteria, abnormalities in at least two out of three of T1, T2, and LGE suggest the presence of active myocarditis. 47 Eight studies reported myocarditis based on Lake Louise criteria, and its rate varied from 0% 20 to 36%. 47
The presence of myocardial inflammation could have severe consequences without timely diagnosis and appropriate treatment. 6 , 7
Acute viral myocarditis could progress to chronic smoldering myocarditis and subsequently lead to heart failure. 48 , 49 Compared to patients with myocardial involvement, a majority of patients with isolated pericardial involvement are more likely to experience a benign course. 50 Noteworthy, about 15%–30% of these patients may develop recurrent pericarditis or constrictive pericarditis. 51
Some studies found presence of cardiac MRI surrogates of myocarditis in COVID‐19 patients without symptoms at postacute phase of disease. At present, given the unknown clinical significance of these findings in asymptomatic general population, cardiac MRI screening is recommended to be limited to the research settings. 52
All nine studies focused on athletes found abnormal MRI findings in some patients. 11 , 14 , 18 , 21 , 28 , 29 However, there is uncertainty about clinical significance associated with these observed abnormal CMR findings, especially among athletes with asymptomatic to mild COVID‐19. 53 , 54
Daniels et al 27 found that primary cardiac MRI screening strategy resulted in a higher diagnostic yield for myocarditis compared to both symptom‐driven and cardiac testing strategies. At present, primary CMR screening prior to return to play after COVID‐19 infection remains a subject of much debate due to high prevalence of cardiac damage and fibrosis with unknown prognostic significance in endurance athletes, the poor diagnostic yield of acute myocardial inflammation, in combination with expertise required for advanced cardiac MRI interpretation, costs, and burden on health care system. 54
In addition, Daniels et al 27 observed that cardiac MRI abnormalities (LGE, T2) resolved for some cases at repeat MRI, more frequently in cases with subclinical myocarditis rather than those with clinical MRI.
At present, the American College of Cardiology's Sports and Exercise Council have recommended the selective use of cardiac MRI in the case of detected abnormalities by a tiered approach based on the presence of symptoms, followed by electrocardiography (ECG), injury biomarkers, and echocardiography. 53
Most included studies showed that the RV and LV traditional morphological and functional parameters fell in the normal range in the COVID‐19 patients; however, RVEF mean in the COVID‐19 group was statistically lower than that in controls in four studies although the observed differences were mainly clinically nonsignificant. The findings of two studies suggest that COVID‐19 patients with LGE may have RV/LV dysfunction, which could be detected by strain analysis rather than other conventional parameters. 10 , 29 Abnormal strain can be explained by the presence of LGE lesions in the middle myocardium and/or sub‐epicardium. 55
Eight out of 13 studies measuring biomarkers of ongoing inflammation found MRI abnormality in the absence of an elevated level of these biomarkers 13 , 14 , 20 , 24 , 28 , 29 ; however, Puntmann et al 15 found a significant direct correlation between high‐sensitivity troponin with the results of T1 and T2 mapping.
The exact mechanisms in which SARS‐CoV‐2 can lead to myocardial injury have remained unclear. However, viral involvement of cardiomyocytes and systemic inflammation may be the possible mechanisms responsible for the virus's cardiac sequels. 56
Limitations
Our included studies involved different populations of COVID‐19 survivors, used different cut points for detecting abnormal MRI findings, and had variable follow‐up periods that all may result in different rate of abnormal findings, preventing meta‐analysis. Overall, they each had some limitations, including small sample sizes and the bias in selecting controls. In addition, none of included studies performed baseline cardiac MRI examination; In this regard, Raisi‐Estabragh et al showed that pre‐existing cardiac MRI abnormalities is associated with greater odds of SARS‐CoV‐2 positivity, independent of cardiovascular risk factors. 57 They concluded that cardiovascular involvement after COVID‐19 may reflect pre‐existing cardiac status rather than COVID‐19‐related cardiac abnormalities. Also, available evidence failed to provide information on correlation of detected cardiac MRI abnormalities with clinical outcomes at long term.
Conclusion
There are evidence of cardiac involvement, including edema, pericarditis, cardiac fibrosis, myocarditis, and contractile function impairment in COVID‐19 survivors with a diverse spectrum of disease severity at the acute phase. As most studies included healthy young patients with asymptomatic or mild SARS‐CoV‐2 infection, these findings are concerning as the presence of cardiac injury may be underestimated and, hence, undermanaged in this group of patients. Larger, well‐designed cohort studies are needed to confirm these findings and to assess their long‐term clinical consequences.
Acknowledgment
Researchers appreciated the Clinical Research Development Center of Kamali and Rajaee Hospitals in Alborz University of Medical Sciences.
Contributor Information
Mohamad Hossein Mozafari Bazargany, Email: mhmozafari7@gmail.com.
Hadith Rastad, Email: h.rastad91@gmail.com.
References
- 1. Worldometers COVID‐19 data . COVID‐19 CORONAVIRUS PANDEMIC. Accessed on July 06, 2021. Available from: https://www.worldometers.info/coronavirus/. .
- 2. Kunutsor SK, Laukkanen JA. Cardiovascular complications in COVID‐19: A systematic review and meta‐analysis. J Infect 2020;81:139‐e141. [DOI] [PMC free article] [PubMed] [Google Scholar]
- 3. Gutberlet M, Spors B, Thoma T, et al. Suspected chronic myocarditis at cardiac MR: Diagnostic accuracy and association with immunohistologically detected inflammation and viral persistence. Radiology 2008;246:401‐409. [DOI] [PubMed] [Google Scholar]
- 4. Schultz JC, Hilliard AA, Cooper LT, Rihal CS. Diagnosis and treatment of viral myocarditis. Paper presented at: Mayo Clinic Proceedings. 2009. [DOI] [PMC free article] [PubMed]
- 5. Shchedrygina A, Nagel E, Puntmann VO, Valbuena‐Lopez S. COVID‐19 myocarditis and prospective heart failure burden. Expert Rev Cardiovasc Ther 2020;19:1‐10. [DOI] [PubMed] [Google Scholar]
- 6. Maron BJ, Towbin JA, Thiene G, et al. Contemporary definitions and classification of the cardiomyopathies: An American Heart Association scientific statement from the council on clinical cardiology, heart failure and transplantation committee; quality of care and outcomes research and functional genomics and translational biology interdisciplinary working groups; and council on epidemiology and prevention. Circulation 2006;113:1807‐1816. [DOI] [PubMed] [Google Scholar]
- 7. Kraft L, Erdenesukh T, Sauter M, Tschöpe C, Klingel K. Blocking the IL‐1β signalling pathway prevents chronic viral myocarditis and cardiac remodeling. Basic Res Cardiol 2019;114:11. [DOI] [PubMed] [Google Scholar]
- 8. Zhou M, Wong CK, Un KC, et al. Cardiovascular sequalae in uncomplicated COVID‐19 survivors. PLoS One 2021;16:e0246732. [DOI] [PMC free article] [PubMed] [Google Scholar]
- 9. Wu X, Deng KQ, Li C, et al. Cardiac involvement in recovered patients from COVID‐19: A preliminary 6‐month follow‐up study. Front Cardiovasc Med 2021;8:315. [DOI] [PMC free article] [PubMed] [Google Scholar]
- 10. Wang H, Li R, Zhou Z, et al. Cardiac involvement in COVID‐19 patients: Mid‐term follow up by cardiovascular magnetic resonance. J Cardiovasc Magn Reson 2020;23:1‐2. [DOI] [PMC free article] [PubMed] [Google Scholar]
- 11. Vago H, Szabo L, Dohy Z, Merkely B. Cardiac magnetic resonance findings in patients recovered from COVID‐19: Initial experiences in elite athletes. Cardiovasc Imag 2020;14:1279‐1281. [DOI] [PMC free article] [PubMed] [Google Scholar]
- 12. Starekova J, Bluemke DA, Bradham WS, et al. Evaluation for myocarditis in competitive student athletes recovering from coronavirus disease 2019 with cardiac magnetic resonance imaging. JAMA Cardiol 2021;e207444. [DOI] [PMC free article] [PubMed] [Google Scholar]
- 13. Raman B, Cassar MP, Tunnicliffe EM, et al. Medium‐term effects of SARS‐CoV‐2 infection on multiple vital organs, exercise capacity, cognition, quality of life and mental health, post‐hospital discharge. EClinicalMedicine 2021;31:100683. [DOI] [PMC free article] [PubMed] [Google Scholar]
- 14. Rajpal S, Tong MS, Borchers J, et al. Cardiovascular magnetic resonance findings in competitive athletes recovering from COVID‐19 infection. JAMA Cardiol 2021;6:116‐118. [DOI] [PMC free article] [PubMed] [Google Scholar]
- 15. Puntmann VO, Carerj ML, Wieters I, et al. Outcomes of cardiovascular magnetic resonance imaging in patients recently recovered from coronavirus disease 2019 (COVID‐19). JAMA Cardiol 2020;5:1265‐1273. [DOI] [PMC free article] [PubMed] [Google Scholar]
- 16. Pan C, Zhang Z, Luo L, et al. Cardiac T1 and T2 mapping showed myocardial involvement in recovered COVID‐19 patients initially considered devoid of cardiac damage. J Magn Reson Imaging 2021;54:421–428. [DOI] [PMC free article] [PubMed] [Google Scholar]
- 17. Ng M‐Y, Ferreira VM, Leung ST, et al. Patients recovered from COVID‐19 show ongoing subclinical myocarditis as revealed by cardiac magnetic resonance imaging. Cardiovasc Imaging. 2020;13:2476‐2478. [DOI] [PMC free article] [PubMed] [Google Scholar]
- 18. Moulson N, Petek BJ, Drezner JA, et al. SARS‐CoV‐2 cardiac involvement in young competitive athletes. Circulation. 2021. 10.1161/circulationaha.121.054824. [DOI] [PMC free article] [PubMed] [Google Scholar]
- 19. Martinez MW, Tucker AM, Bloom OJ, et al. Prevalence of inflammatory heart disease among professional athletes with prior COVID‐19 infection who received systematic return‐to‐play cardiac screening. JAMA Cardiol 2021;6:745–752. [DOI] [PMC free article] [PubMed] [Google Scholar]
- 20. Małek ŁA, Marczak M, Miłosz‐Wieczorek B, et al. Cardiac involvement in consecutive elite athletes recovered from Covid‐19: A magnetic resonance study. J Magn Reson Imaging 2021;53:1723‐1729. [DOI] [PMC free article] [PubMed] [Google Scholar]
- 21. Kotecha T, Knight DS, Razvi Y, Kumar K, et al. Patterns of myocardial injury in recovered troponin‐positive COVID‐19 patients assessed by cardiovascular magnetic resonance. Eur Heart J 2021;42:1866‐1878. [DOI] [PMC free article] [PubMed] [Google Scholar]
- 22. Knight DS, Kotecha T, Razvi Y, et al. COVID‐19: Myocardial injury in survivors. Circulation 2020;142:1120‐1122. [DOI] [PMC free article] [PubMed] [Google Scholar]
- 23. Joy G, Artico J, Kurdi H, Seraphim A, et al. Prospective case‐control study of cardiovascular abnormalities 6 months following mild COVID‐19 in healthcare workers. JACC Cardiovascular Imaging 2021;S1936–878X. 10.1016/j.jcmg.2021.04.011. [DOI] [PMC free article] [PubMed] [Google Scholar]
- 24. Huang L, Zhao P, Tang D, et al. Cardiac involvement in patients recovered from COVID‐2019 identified using magnetic resonance imaging. Cardiovascular Imaging 2020;13:2330‐2339. [DOI] [PMC free article] [PubMed] [Google Scholar]
- 25. Fu H, Zhang N, Zheng Y, et al. Risk stratification of cardiac sequelae detected using cardiac magnetic resonance in late convalescence at the six‐month follow‐up of recovered COVID‐19 patients. J Infect 2021;83:119–145. [DOI] [PMC free article] [PubMed] [Google Scholar]
- 26. Eiros R, Barreiro‐Perez M, Martin‐Garcia A, et al. Pericarditis and myocarditis long after SARS‐CoV‐2 infection: A cross‐sectional descriptive study in health‐care workers. MedRxiv 2020. 10.1101/2020.07.12.20151316. [DOI] [Google Scholar]
- 27. Daniels CJ, Rajpal S, Greenshields JT, et al. Prevalence of clinical and subclinical myocarditis in competitive athletes with recent SARS‐CoV‐2 infection: Results from the big ten COVID‐19 cardiac registry. JAMA Cardiol 2021;e212065. [DOI] [PMC free article] [PubMed] [Google Scholar]
- 28. Clark D, Parikh A, Dendy J, et al. COVID‐19 myocardial pathology evaluated through screening cardiac magnetic resonance (COMPETE CMR). Circulation 2021;143:609–612. [DOI] [PMC free article] [PubMed] [Google Scholar]
- 29. Brito D, Meester S, Yanamala N, et al. High prevalence of pericardial involvement in college student athletes recovering from COVID‐19. Cardiovasc Imaging 2021;14:541‐555. [DOI] [PMC free article] [PubMed] [Google Scholar]
- 30. Ojha V, Verma M, Pandey NN, Mani A, et al. Cardiac magnetic resonance imaging in coronavirus disease 2019 (COVID‐19): A systematic review of cardiac magnetic resonance imaging findings in 199 patients. J Thorac Imaging 2021;36:73‐83. [DOI] [PubMed] [Google Scholar]
- 31. Knobloch K, Yoon U, Vogt PM. Preferred reporting items for systematic reviews and meta‐analyses (PRISMA) statement and publication bias. J Craniomaxillofac Surg 2011;39:91‐92. [DOI] [PubMed] [Google Scholar]
- 32. Peterson J, Welch V, Losos M, Tugwell PJ. The Newcastle‐Ottawa scale (NOS) for assessing the quality of nonrandomised studies in meta‐analyses. Ottawa Hospital Research Institute. 2011. http://www.ohri.ca/programs/clinical_epidemiology/oxford.asp. [Google Scholar]
- 33. National Institutes of Health . Quality assessment tool for case series studies. 2014. https://www.nhlbi.nih.gov/health-topics/study-quality-assessment-tools.
- 34. Li H, Zhu H, Yang Z, Tang D, Huang L, Xia L. Tissue characterization by mapping and strain cardiac MRI to evaluate myocardial inflammation in fulminant myocarditis. J Magn Reson Imaging 2020;52:930‐938. [DOI] [PubMed] [Google Scholar]
- 35. Dolan RS, Rahsepar AA, Blaisdell J, et al. Multiparametric cardiac magnetic resonance imaging can detect acute cardiac allograft rejection after heart transplantation. JACC Cardiovasc Imaging 2019;12:1632‐1641. [DOI] [PMC free article] [PubMed] [Google Scholar]
- 36. Kellman P, Arai AE, Xue H. T1 and extracellular volume mapping in the heart: Estimation of error maps and the influence of noise on precision. J Cardiovasc Magn Reson 2013;15:1‐12. [DOI] [PMC free article] [PubMed] [Google Scholar]
- 37. Puntmann VO, Valbuena S, Hinojar R, et al. Society for Cardiovascular Magnetic Resonance (SCMR) expert consensus for CMR imaging endpoints in clinical research: Part I‐analytical validation and clinical qualification. J Cardiovasc Magn Reson 2018;20:1‐23. [DOI] [PMC free article] [PubMed] [Google Scholar]
- 38. Vermes E, Carbone I, Friedrich MG, Merchant N, et al. Patterns of myocardial late enhancement: Typical and atypical features. Arch Cardiovasc Dis 2012;105:300‐308. [DOI] [PubMed] [Google Scholar]
- 39. Cummings KW, Bhalla S, Javidan‐Nejad C, et al. A pattern‐based approach to assessment of delayed enhancement in nonischemic cardiomyopathy at MR imaging. Radiographics 2009;29:89‐103. [DOI] [PubMed] [Google Scholar]
- 40. Saeed M, Hetts SW, Jablonowski R, Wilson MW. Magnetic resonance imaging and multi‐detector computed tomography assessment of extracellular compartment in ischemic and non‐ischemic myocardial pathologies. World J Cardiol 2014;6:1192. [DOI] [PMC free article] [PubMed] [Google Scholar]
- 41. Lurz JA, Luecke C, Lang D, et al. CMR‐derived extracellular volume fraction as a marker for myocardial fibrosis: The importance of coexisting myocardial inflammation. JACC Cardiovasc Imaging 2018;11:38‐45. [DOI] [PubMed] [Google Scholar]
- 42. Marra MP, De Lazzari M, Zorzi A, et al. Impact of the presence and amount of myocardial fibrosis by cardiac magnetic resonance on arrhythmic outcome and sudden cardiac death in nonischemic dilated cardiomyopathy. Heart Rhythm 2014;11:856‐863. [DOI] [PubMed] [Google Scholar]
- 43. Schelbert EB, Piehler KM, Zareba KM, et al. Myocardial fibrosis quantified by extracellular volume is associated with subsequent hospitalization for heart failure, death, or both across the spectrum of ejection fraction and heart failure stage. J Am Heart Assoc 2015;4:e002613. [DOI] [PMC free article] [PubMed] [Google Scholar]
- 44. Schumm J, Greulich S, Wagner A, et al. Cardiovascular magnetic resonance risk stratification in patients with clinically suspected myocarditis. J Cardiovasc Magn Reson 2014;16:1‐12. [DOI] [PMC free article] [PubMed] [Google Scholar]
- 45. Gräni C, Eichhorn C, Bière L, et al. Prognostic value of cardiac magnetic resonance tissue characterization in risk stratifying patients with suspected myocarditis. J Am Coll Cardiol 2017;70:1964‐1976. [DOI] [PMC free article] [PubMed] [Google Scholar]
- 46. Zorzi A, Perazzolo Marra M, Rigato I, et al. Nonischemic left ventricular scar as a substrate of life‐threatening ventricular arrhythmias and sudden cardiac death in competitive athletes. Circ Arrhythm Electrophysiol 2016;9:e004229. [DOI] [PMC free article] [PubMed] [Google Scholar]
- 47. Pan JA, Lee YJ, Salerno M. Diagnostic performance of extracellular volume, native T1, and T2 mapping versus Lake Louise criteria by cardiac magnetic resonance for detection of acute myocarditis: A meta‐analysis. Circ Cardiovasc Imaging 2018;11:e007598. [DOI] [PMC free article] [PubMed] [Google Scholar]
- 48. Yue‐Chun L, Guang‐Yi C, Li‐Sha G, et al. The protective effects of ivabradine in preventing progression from viral myocarditis to dilated cardiomyopathy. Front Pharmacol 2016;7:408. [DOI] [PMC free article] [PubMed] [Google Scholar]
- 49. Thakkar S, Arora S, Kumar A, et al. A systematic review of the cardiovascular manifestations and outcomes in the setting of coronavirus‐19 disease. Clin Med Insights 2020;14:1179546820977196. [DOI] [PMC free article] [PubMed] [Google Scholar]
- 50. Imazio M, Pivetta E, Restrepo SP, et al. Usefulness of cardiac magnetic resonance for recurrent pericarditis. Am J Cardiol 2020;125:146‐151. [DOI] [PubMed] [Google Scholar]
- 51. Cremer PC, Kumar A, Kontzias A, et al. Complicated pericarditis: Understanding risk factors and pathophysiology to inform imaging and treatment. J Am Coll Cardiol 2016;68:2311‐2328. [DOI] [PubMed] [Google Scholar]
- 52. Murthy, V. Letter Warns Against Clinical Role for Cardiac MRI in Asymptomatic COVID Patients. https://cvctcardiobrief.com/letter-warns-against-clinical-role-for-cardiac-mri-in-asymptomatic-covid-patients/
- 53. Kim JH, Levine BD, Phelan D, et al. Coronavirus disease 2019 and the athletic heart: Emerging perspectives on pathology, risks, and return to play. JAMA Cardiol 2021;6:219‐227. [DOI] [PubMed] [Google Scholar]
- 54. Kim JH. Screening athletes for myocarditis with cardiac magnetic resonance imaging after COVID‐19 infection—lessons from an english philosopher. JAMA Cardiology. 2021. 10.1001/jamacardio.2020.7463. [DOI] [PubMed] [Google Scholar]
- 55. Uziębło‐Życzkowska B, Mielniczuk M, Ryczek R, Krzesiński P. Myocarditis successfully diagnosed and controlled with speckle tracking echocardiography. Cardiovasc Ultrasound 2020;18:1‐4. [DOI] [PMC free article] [PubMed] [Google Scholar]
- 56. Babapoor‐Farrokhran S, Gill D, Walker J, et al. Myocardial injury and COVID‐19: Possible mechanisms. Life Sci 2020;253:117723. [DOI] [PMC free article] [PubMed] [Google Scholar]
- 57. Raisi‐Estabragh Z, McCracken C, Cooper J, et al. Adverse cardiovascular magnetic resonance phenotypes are associated with greater likelihood of incident coronavirus disease 2019: Findings from the UKbiobank. Aging Clin Exp Res 2021;33:1133‐1144. [DOI] [PMC free article] [PubMed] [Google Scholar]