Abstract
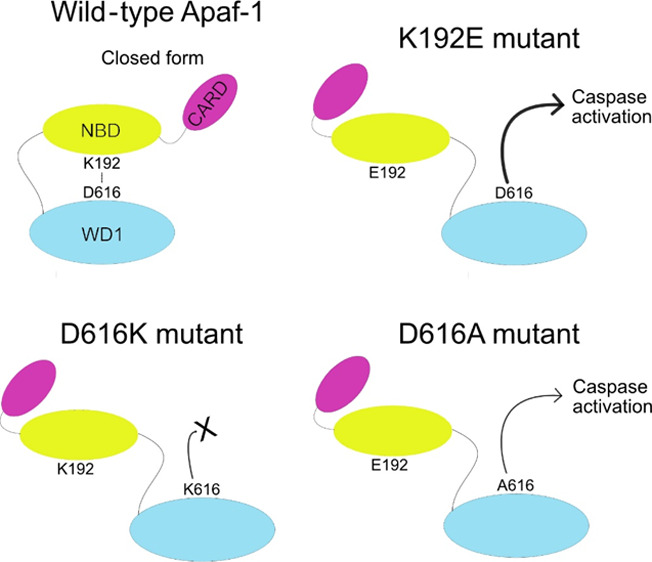
The molecular mechanism of apoptosome activation through conformational changes of Apaf-1 auto-inhibited form remains largely enigmatic. The crystal structure of Apaf-1 suggests that some ionic bonds, including the bond between K192 and D616, are critical for the preservation of the inactive “closed” form of Apaf-1. Here, a split luciferase complementation assay was used to monitor the effect of disrupting this ionic bond on apoptosome activation and caspase-3 activity in cells. The K192E mutation, predicted to disrupt the ionic interaction with D616, increased apoptosome formation and caspase activity, suggesting that this mutation favors the “open”/active form of Apaf-1. However, mutation of D616 to alanine or lysine had different effects. While both mutants favored apoptosome formation such as K192E, D616K cannot activate caspases and D616A activates caspases poorly, and not as well as wild-type Apaf-1. Thus, our data show that the ionic bond between K192 and D616 is critical for maintaining the closed form of Apaf-1 and that disrupting the interaction enhances apoptosome formation. However, our data also reveal that after apoptosome formation, D616 and K192 play a previously unsuspected role in caspase activation. The molecular explanation for this observation is yet to be elucidated.
Introduction
Apaf-1 (apoptotic protease activating factor-1) is a large multidomain protein that oligomerizes to form the apoptosome, which is a platform for the activation of specific proteases called caspases. These caspases are the key effectors in the induction of apoptosis, although roles in other processes have also been described.1−4 A wide range of different stimuli triggering apoptosome formation and mutations that affect Apaf-1 gene expression or Apaf-1 function have been reported in a variety of disorders such as cancers and autoimmune and neurodegenerative diseases.1,5 It is therefore possible that Apaf-1 is a viable drug target for different strategies that either induce or prevent apoptosome formation.6−9
Apaf-1 has several recognizable domains; at the N-terminus, is a caspase interaction domain (or CARD) that is necessary for binding and activating caspase-9. This is followed by a nucleotide binding domain (NBD) and helical domains (HDs). The C-terminal part of the protein contains two regulatory WD domains (WD1 and WD2).10,11
The release of cytochrome c from the mitochondria and subsequent binding to WD1 and 2 of Apaf-1 leads to the activation of Apaf-1.12 Cytochrome c binding switches Apaf-1 from a closed or auto-inhibited state [which contains adenosine 5′-diphosphate (ADP)] to an open form, exposing Apaf-1’s NBD. This allows nucleotide exchange, and the binding of adenosine 5′-triphosphate (ATP) triggers the assembly of an Apaf-1 heptamer called the apoptosome.12,13 The heptamer binds caspase-9 through CARD–CARD interactions, which causes caspase-9 activation. Caspase-9 is the initiator caspase of the intrinsic apoptotic pathway and is responsible for activating effector caspases-3/7, which then disassemble the cell.14,15 After decades of study and detailed crystallography and Cryo-EM studies, much is known of Apaf-1 structure and function,13,16−20 but some aspects of the molecular mechanisms controlling Apaf-1 activation remain unknown.
One of the poorly understood aspects of Apaf-1 structure and function is how the closed conformation of Apaf-1 is maintained. Based on a crystal structure of murine Apaf-1, a salt bridge between K192 in the NBD-HD1 region and D616 in the WD1 domain and another salt bridge between E546 and R907 could keep the Apaf-1 monomer in a closed form.13,22 Cytochrome c binding causes disruption of the salt bridge between K192-D616, whereby WD1 is released from its interaction with NBD-HD1.13 We previously reported that disruption of the salt bridge formed by E546 did not lead to activation of Apaf-1, suggesting that if the E546-R907 interaction is important in keeping Apaf-1 inactive, it cannot do so alone.21 Of note, glutamic acid E542 located in the near vicinity of E546 and with the same general directional orientation and R612 in WD1, may also be key players in this particular interaction region (Figure S1). Hence, double mutation (E542 + E546; or R612 + R907) may be required to disrupt the ionic interactions in this area.
In this report, we used a split luciferase complementation assay to test the effect on apoptosome formation and caspase activation of disrupting the K192–D616 salt bridge between the WD1 domain and NBD-HD1. Previously, we have used the split luciferase complementation assay to monitor Apaf-1–Apaf-1 interactions in cell-based and cell-free settings.22−27 This assay provides a relatively simple approach to studying the effects of Apaf-1 mutations on its oligomerization and caspase activation.
Our data show that disrupting the salt bridge by mutating K192 or D616 increases Apaf-1–Apaf-1 interactions and caspase activation, suggesting that the K192–D616 interaction plays a key role in maintaining the closed form of Apaf-1. Although mutating D616 favored apoptosome formation, it reduced caspase activation, a defect that was rescued in the D616A/K192E double mutant. Thus, we have not only demonstrated the importance of the K192–D616 interaction for apoptosome formation but also uncovered a previously unsuspected role for K192 and D616 in regulating caspase activation after apoptosome formation.
Results
Assessing the Specificity of the Reporter Function Using Inactivating Mutations
Overexpression of Apaf-1 is known to induce apoptosis .28−30 This cell death is dependent on apoptosome formation as mutating K160 in the NBD to arginine (which prevents ATP binding and apoptosome formation) prevents cell death.28
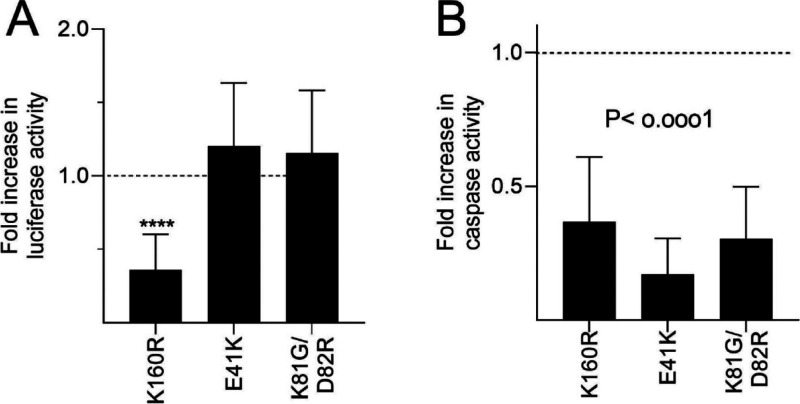
Here, we overexpressed split luciferase Apaf-122,24,25 in cells to test the effect of various Apaf-1 mutants on apoptosome formation and caspase activity. First, we assessed the increase in luciferase activity and caspase activity induced by expression of split luciferase wild-type (WT) Apaf-1. We found that overexpression of WT Apaf-1 produced statistically significant increase in both luciferase activity (32-fold ± 24, N = 8; P = 0.0087) and caspase activity (14-fold ± 8.5, N = 6; P = 0.005) relative to a pcDNA3 transfection control. To test whether this activity is associated with apoptosome formation, we compared the luciferase activity of the K160R mutant. The K160R mutation dramatically reduced both luciferase activity and caspase activity (Figure 1A,B). We also tested an E41K mutant and a K81G/D82R mutant. These mutations are in the Apaf-1 CARD domain and prevent Apaf-1 from activating caspase-9.31 These amino acids are not involved in Apaf-1 oligomerization. If the caspase activity seen with Apaf-1 overexpression was due to apoptosome formation, then caspase activity induced by these two mutants should be much less than the activity induced by WT Apaf-1. Indeed, when either mutant was expressed, we still detected luciferase activity, indicating that both mutants formed apoptosomes. However, neither the E41K nor the K81G/D82R mutant was effective in increasing caspase activity. Together, these data suggest that apoptosome formation is necessary for the luciferase activity and for the caspase activity induced by Apaf-1 overexpression. These data further validate the split luciferase complementation assay as a tool for studying apoptosome formation in living cells.25,27
Figure 1.
Effect of Apaf-1 mutations on the XLucApaf-1 (NLucApaf-1 co-expressed with CLuc Apaf-1) the split luciferase complementation assay. WT or mutant Apaf-1 were expressed in HEK293T cells and the resultant luciferase activity (A) and caspase-3-like activity (B) assessed. The results are expressed as fold change relative to the activity of the WT Apaf-1 and are the mean ± SD of n > 6 experiments.
Disrupting Ionic Interactions between K192 and D616 with K192E
Apaf-1 structure data13 suggests that a salt bridge between K192 and D616 holds Apaf-1 in an inactive conformation. To test this idea, we mutated both residues and tested the effect on Apaf-1 function using the split luciferase complementation assay and a caspase assay. If this salt bridge is important in limiting the activation of Apaf-1 and apoptosome formation, then breaking the interaction should increase both luciferase and caspase activity.
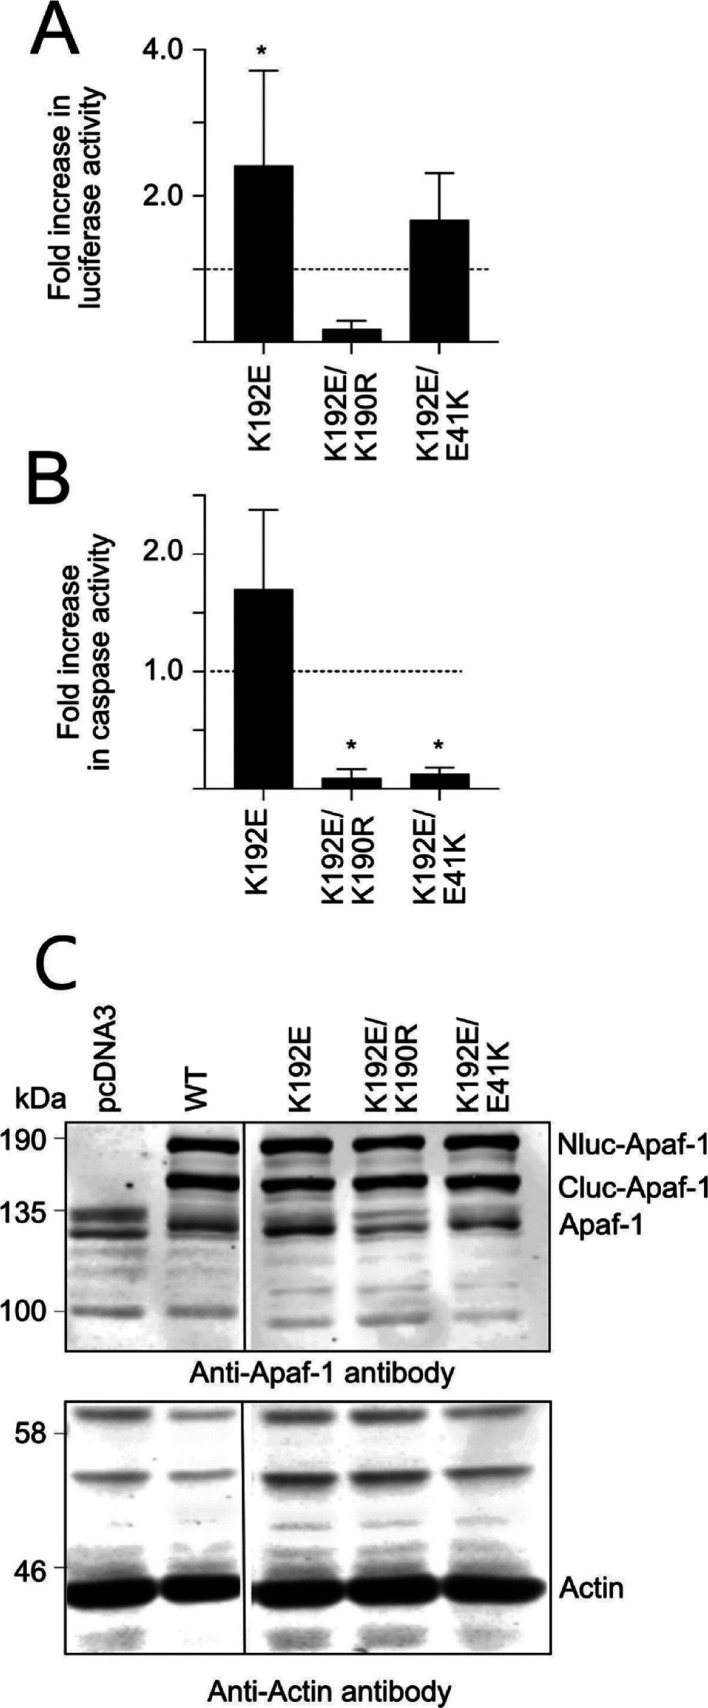
When the split luciferase K192E mutant was expressed, it was found to generate greater luminescence activity than WT Apaf-1 (Figure 2A). Importantly, the K192E/K160R Apaf-1 had very low luciferase activity, indicating that the K192E mutant, like WT Apaf-1, is dependent on nucleotide binding for oligomerization. The K192E mutant showed a trend toward increased caspase activity over WT Apaf-1, but the increase did not reach statistical significance. The luciferase activity of the K192E/E41K mutant was also greater than the activity of WT Apaf-1 (Figure 2A), but the caspase activity induced by the K192E/E41K double mutant was much lower than WT Apaf-1, which is consistent with the inability of the specific CARD mutants as mentioned above to bind caspase-9 (Figure 2B).
Figure 2.
Effect of the K192E mutation on Apaf-1: Apaf-1 interactions and caspase activity. WT or mutant Apaf-1 were expressed in HEK293T cells, and the resultant luciferase activity (A) and caspase-3-like activity (B) was assessed. The results are expressed as fold change relative to the activity of the WT Apaf-1 and are the mean ± SD of n > 6 experiments. Luciferase activity of WT Apaf-1 was 32-fold ± 24 greater than the pcDNA3 transfection control (N = 8; P = 0.0087), and caspase activity was 14-fold ± 8.5 greater (N = 6; P = 0.005). (C) Expression levels of the mutants was assessed by immunoblotting for the cotransfected NLuc and Cluc Apaf-1 variants in the HEK293T cells (n > 6, mean ± SD).
To test whether the reporter was detecting apoptosome formation in the cells or postcell lysis, a cell-permeant luciferase substrate was used with live cells (Figure S2). In the experiment, the luminescence signals were detectable and their pattern was the same as our experiments using cell lysis. These data suggest that the reporter was detecting apoptosome formation in the cells and not apoptosome formation postlysis.
Disrupting Ionic Interactions between K192 and D616 with D616A or D616K
Our expectation was that mutating D616 would have a similar effect on apoptosome formation and caspase activity as the K192E mutation. Consistent with this idea, expression of either the D616A or the D616K mutant significantly increased luciferase activity, as also observed for K192E, suggesting that both mutations favoured apoptosome formation (Figure 3A). We also performed gel filtration chromatography to detect Apaf-1 complexes of approximately 700 kDa, which is the size of the apoptosome. Lysates from cells expressing WT, D616A, or D616K Apaf-1 were resolved by gel filtration chromatography, and the amount of Apaf-1 in each fraction was assessed by immunoblotting (Figure 3B). The transgenes are expressed at much higher levels than endogenous Apaf-1 (Figure 3C); hence, endogenous Apaf-1 contributes very little to the analysis. The monomeric split luciferase Apaf-1 is also larger than endogenous Apaf-1 and thereby elutes earlier than endogenous Apaf-1 (Figure 3B). These experiments detected greater levels of high-molecular-weight complexes of D616A and D616K mutants than WT Apaf-1. These data, together with the split luciferase data suggest that D616A and D616K formed more apoptosomes than WT Apaf-1 (Figure 3A,B).
Figure 3.
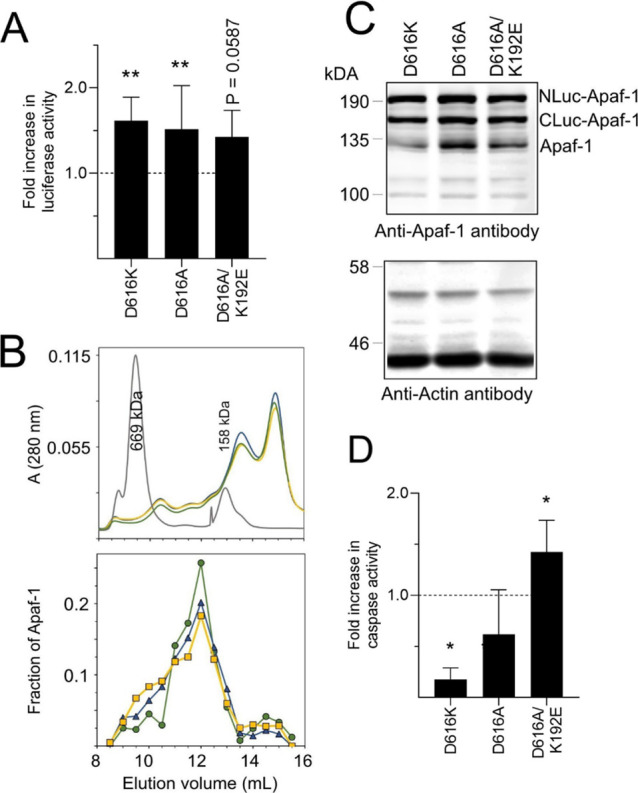
(A) WT or mutant Apaf-1 was expressed in HEK293T cells and the resultant luciferase activity was assessed. (B) Gel filtration chromatography of WT and mutant forms of Apaf-1. The upper panel shows absorbance at 280 nm and reflects total protein, the black curve is molecular-weight standards. The bottom panel shows levels of Apaf-1in each fraction assessed by immunoblotting. Green circles = WT; yellow squares = D616A; blue triangles = D616K (n = 1). (C) Immunoblotting for the cotransfected NLuc and Cluc Apaf-1 variants in HEK293T cells. (D) WT or mutant Apaf-1 was expressed and the resultant caspase-3 like activity was assessed. The results of A and D are expressed as fold change relative to the activity of the WT Apaf-1 and are the mean ± SD of n > 6 experiments.
We also expected the effect of the D616 mutations on caspase activity to be similar to the K192E mutation. However, this was not the case. The D616A mutant indeed led to caspase activation but appeared to do so less well than WT Apaf-1 or K192E Apaf-1 (cf. Figures 2 and 3D). Expression of the D616K mutant failed to induce caspase-3-like activity (cf. Figures 1 and 3D) and resembled the findings for the E41K or K81G/D82R mutants.
Rescuing the Caspase Activation Defect of D616A with K192E
Having determined that separate D616 and K192 mutations affected apoptosome formation and caspase activation, we tested the effect of a double mutation (Figure 3). Combining the mutations did not significantly increase luciferase activity over the single mutation (Figure 3A), suggesting that the double mutant formed similar levels of apoptosomes. However, the double mutant rescued the defect in the caspase activation seen with the D616A mutant. These data suggest that D616 and K192 have previously unreported roles in regulating caspase activation after apoptosome formation.
Discussion
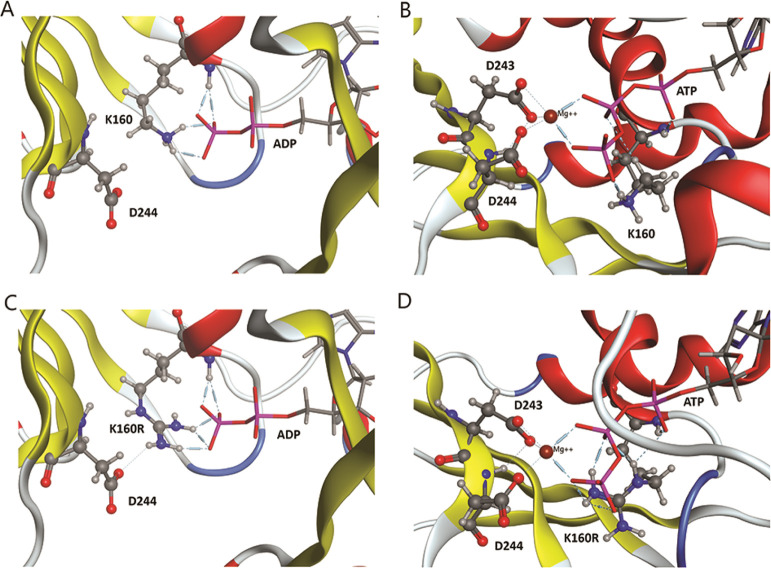
Analyses of the Apaf-1 structure have shown that the inactive form of Apaf-1 includes a salt bridge between K192 and D616. We employed a split luciferase complementation assay that allowed us to relatively quickly assess apoptosome formation to test the roles played by K192 and D616 in Apaf-1 function. Our first experiments demonstrated that the assay was sensitive to mutations that are known to disrupt apoptosome formation (K160R)28 or caspase activation (E41K and K81G/D82R),31 thus validating our approach. For further explanation on how the K160R mutation works to inhibit apoptosome formation, molecular modeling of K160R in active and inactive forms show that Arg is able to bind to the terminal phosphates of both ADP and ATP (Figure 4). It is suggested that a higher affinity of Arg to the terminal phosphate of both ADP and ATP could block ADP/ATP exchange or ATP hydrolysis.
Figure 4.
K160 and K160R mutant structures in the NBD of Apaf-1. WT K160 interacting with ADP in the inactive form (A) and ATP in the active form (B). Mutant K160R interacting with ADP in the inactive form (C) and with ATP in the active form (D).
Our experiments to test the role of the K192–D616 salt bridge first focused on mutating K192 to glutamic acid. The data show that this mutation increased both apoptosome formation and caspase activity and support the idea that K192 is important for keeping Apaf-1 in an inactive or closed conformation. This conclusion is supported by the observations that the luciferase activity induced by the K192E mutant requires nucleotide binding and that the caspase activity induced is dependent on CARD–CARD interactions with caspase-9.
Seeking further support, we tested the impact of mutating D616. One mutation was to alanine, a small neutral amino acid, and a second was to lysine, a large amino acid with opposite charge to aspartic acid normally found at position 616. Both D616A and D616K mutants increased luciferase activity similarly to the K192E mutant, which is consistent with the idea that the K192–D616 salt bridge is indeed important for restraining apoptosome formation. We also corroborated these observations using gel filtration chromatography and found that the K192E and the D616 mutants form higher levels of high-molecular-weight complexes than WT Apaf-1.
However, the effect of these mutations on caspase activation was more complex. Given the split luciferase and gel filtration data on apoptosome formation, we expected that both D616A and D616K mutants would increase caspase activation. Instead, D616A induced less caspase activation than WT Apaf-1 and the D616K mutant reduced caspase activation to levels seen with the K160R and E41K mutants, which cannot oligomerize or cannot bind caspase-9, respectively. Replacing D616 with a positively charged amino acid (D616K) had a much more profound effect on caspase activity than replacing D616 with a neutral amino acid (D616A), suggesting that the role of D616 in caspase activation is dependent on ionic interactions. However, the possibility of secondary effects of mutations on the local structure should be considered, for example, the D616A and D616K mutations may affect the conformation of the loops in the regulatory region of active Apaf-1 (Figure 5B).
Figure 5.
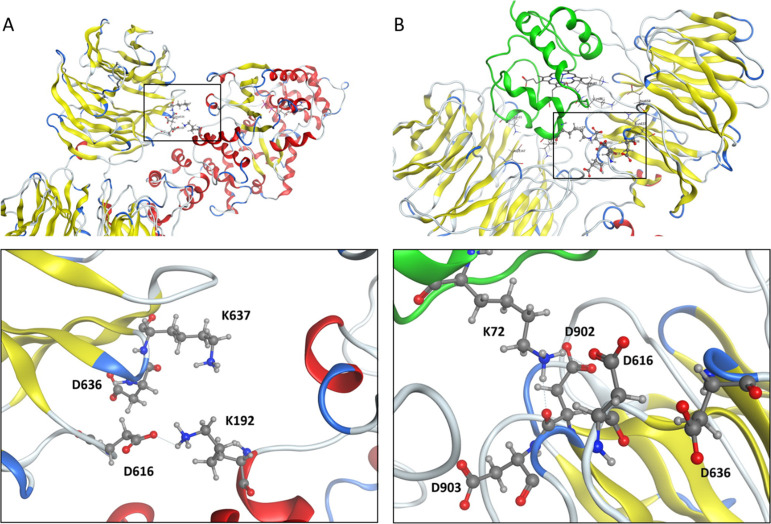
Inactive (A) and active (B) form of Apaf-1. (A) Close-up views of the closed or the autoinhibited form of Apaf-1. The salt bridge between K192 in the NBD (with red α-helices) and D616 in WD1 (with yellow β-sheets). (B) Position of D616 in the regulatory region of the active or open form of Apaf-1. Cytochrome c is shown in green and the β-sheets of the WD region in yellow.
In cells expressing the K192E/D616A double mutation, K192E rescues the defect in caspase-3 activity caused by the D616A mutation. How K192E can compensate for the D616A defect is not clear. The structure of the Apaf-1 monomer shows that there is another aspartic acid residue (D636) in the vicinity of D616 (Figure 5A), which may be able to establish a new electrostatic interaction with K192 upon mutation of D616. The K192E mutation precludes an interaction with D636, favoring apoptosome formation and caspase activation. However, this is a poor explanation for rescue of the D616A defect by K912E as the K192E/D616A mutant does not appear to form more apoptosomes than the D616A mutant.
Thus, our experiments have shown for the first time the importance of the K192–D616 interaction for keeping Apaf-1 inactive. In addition, we have uncovered a previously unsuspected role for K192 and D616 in regulating caspase activation after apoptosome formation.
It is not clear how D616 or K192 regulates caspase activation as structure data show neither direct interaction with caspase-9 nor −3 (Figure 5). However, K192 and D616 may form intramolecular or intermolecular interactions with other Apaf-1 residues within the apoptosome. As our assay is carried out in cells, we cannot rule out intermolecular interactions with other cellular proteins that stabilize a conformation that supports caspase activation. Cytochrome c is an obvious example. The structure of activated Apaf-1 shows that D616 lies close to D902, which forms a salt bridge to K72 of cytochrome c (Figure 5B). The K72 residue of cytochrome c is one of the critical points in the interaction with the regulatory region of Apaf-1 and interfering with K72 that prevents apoptosome formation.16,32 Mutating D616 may disrupt interactions between D902 and K72 and alter apoptosome conformation and caspase activation. However, the cytochrome c dependence of apoptosome formation in our experiments has not been established; it is possible that the apoptosome formation we detect is driven by high Apaf-1 concentrations instead of cytochrome c binding. Therefore, we cannot rule out the possibility that the effects on caspase activity are explained by intermolecular interactions with other proteins besides cytochrome c. As mentioned before, another possibility is that the K192 and D616 mutations may affect the structure of active Apaf-1, causing conformational changes in their residing loops. Such effects of point mutations are well documented and may even cause long-range structural changes.33
Finally, our data show high interexperiment variation in the magnitude of luciferase activity generated by the split luciferase apoptosome assay. Comparing independent experiments therefore requires careful normalization. A consequence of this variation is that subtle effects are very likely difficult or impossible to detect. Nonetheless, our data on the split luciferase assay for apoptosome formation, together with our previous reports,25,27 demonstrate the utility of using the assay to quickly test the effects of mutations on different steps in Apaf-1 activation (ATP binding, caspase-9 binding, as well changes in intramolecular interactions) without having to perform resource- and time-demanding protein purification and gel filtration experiments.
In conclusion, the split luciferase complementation assay can be used to quickly assess the effect of mutations on apoptosome formation and caspase activation in cells. Our data show that the ionic bond between K192 and D616 is critical for maintaining the closed form of Apaf-1 and that disrupting the interaction enhances apoptosome formation. However, our data also reveal that after apoptosome formation, K192 and D616 play a previously unsuspected role in caspase activation. The molecular explanation for this observation is, as yet, unclear.
Materials and Methods
Plasmids, Bacteria, and Cell Strains
The constructs of the WT N-Luc and C-Luc Apaf-1 (N- and C-terminal portions of connected luciferase fragments to Apaf-1) in a pcDNA3.1(+) backbone were previously prepared as described.24 The plasmids were used to make the mutations reported, and the SURE 2 bacteria strain (200152 Agilent Technologies) was used for preparing the plasmids. HEK293T cells (EACC) were used to express the constructs.
Mutagenesis and Preparation of Plasmids
The designed primers (Table S1) were made by Sigma-Aldrich company. The mutations were introduced by the quick-change site-directed mutagenesis method using the following materials: PrimeSTAR GXL DNA polymerase (R050A TAKARA), DpnI enzyme (R0176S NEB), ISOLATE II PCR and Gel Kit (BIO-52059 Bioline), SYBR Safe DNA gel stain (S33102 Invitrogen), D-DiGit gel scanner (Licor), QIAprep Spin Miniprep kit (27104), Quick-Load purple 1 kb DNA ladder (NEB), and gel-loading dye purple (NEB). The transformation and selection of the desired colonies performed by SURE 2 supercompetent cells at 18 °C. The DNA sequencing of genes was done by the Eurofins scientific group. The reading ranges were about 800 nucleotides around the region of the mutation points. The pairwise sequence alignments made by (https://www.ebi.ac.uk/Tools/psa/). During the mutagenesis process, we found that the TAC codon corresponding to the Tyr 975 is prone to unwanted mutants in the TAA stop codon, so this point should be considered in sequencing. Quantification of amounts of the plasmid concentrations was carried out by the agarose gel electrophoresis method and the Image J software.
Protein Expression and the Cell Lysate Preparation for Analysis
Dulbecco’s modified Eagle’s medium (high glucose) (D5796), fetal bovine serum (FBS) (F7524), Hanks’ balanced salt solution (H6648), NaCl (S7653), and trypsin–EDTA solution were obtained from Sigma-Aldrich company, and the linear polyethylenimine MW 25 000 (Polysciences) was used as the transfection reagent. The cells were cultured in Dulbecco’s modified Eagle’s medium containing 10% FBS. The seeding density per well at the time of transfection was 4 × 10⁵ cells per well of a 6-well plate and 2 × 10⁴ cells per well of 96-well plate, and in 96-well plates was 20,000 cells per well. Under these conditions, the cells were ∼60% confluent by 20 h.
To transfect cells in a 6-well plate, 400 ng of each N-Luc Apaf-1 and C-Luc Apaf-1 constructs (800ng in total) were diluted in 150 mM NaCl solution up to 100 μL. In parallel, 150 mM NaCl solution was mixed to 4μL polyethyleneimine (PEI) (1 mg/mL) to reach the final volume of 100 μL. Each of the solutions were mixed by a vortex mixer for 10 s; then, the PEI solution was added to mixed plasmids. The final solution was then vortex-mixed again for 10 s. After 30 min of incubation, the transfection mixture was gently and dropwise added to each well (containing 1800 μL medium). To transfect cells in a 96-well plate, 60 ng of DNA of each plasmid with the same ratio of DNA/PEI was used. Then, 20μL of the transfection mixture was added to each well (containing 180 μL medium). The cell cultures were incubated at 37 °C with 5% CO2 for 48 h. All of the floating and adherent cells were collected and centrifuged at 400g for 5 min, washed, and resuspended in 100 μL of the extraction buffer (50 mM HEPES pH 7.4, 10 mM KCl, 2 mM MgCl2, 5 mM EGTA, 10 μg/mL cytochalasin B from Drechslera dematioidea, 1 mM dithiothreitol (DTT), 100 μM phenylmethylsulfonyl fluoride, 1% protease inhibitor cocktail P8340, all prepared by Sigma-Aldrich, and 10 μM ALLN (sc-221236, ChemCruz)). The cell lysates were prepared by four freeze and thaw cycles in liquid nitrogen, and the supernantant was collected after centrifugation at 13g for 10 min at 4 °C in maximum speed. The protein concentration of the lysate was measured by the Bradford assay (Bradford reagent, B6916 Sigma Aldrich).
Western Blotting
The same amount of the cell lysates (50 μg protein) was loaded in 8% sodium dodecyl sulfate polyacrylamide gel electrophoresis gel for each sample. Immunoblotting of the samples was performed as previously described.24
Caspase-3-Like and Luciferase Activities
To assay caspase-3-like activity, 100 μL of the diluted Ac-DEVD-AMC (Enzo) in the assay buffer (50 mM HEPES pH 7.4, 5 mM EGTA, 1 mM DTT) was added to 15 μL of the cell lysate to reach 10 μM final substrate concentration. The fluorescence signals from the samples in a 96-well microplate were recorded by PerkinElmer 1420 Multilabel Counter Victor 3 plate reader at 27 °C temperature and over time. The maximal slope from the linear portion of each curve was normalized to the amount of protein in each reaction and the result expressed as arbitrary fluorescence units/min/mg protein.
For luciferase activities, 50 μL of the luciferase assay system substrate (E1500, Promega) was added to each well of the 96-well microplate assay containing 15 μL of the cell lysates. Immediately, the luminescence signals were measured by the Perkin Elmer plate reader as RLU/sec for at least 50 repeats, with a 60 s delay between repeats. The peak of each luminescence activity was normalized by the amount of protein in each reaction, and the result expressed as RLU/s/mg.
For the cellular luminescence assay, the seeded and intact transfected HEK293T cells in a 96-well microplate were treated by a prepared solution of D-luciferin (ab143654, Abcam) and were measured in a PerkinElmer plate reader according to the manufacturer’s instructions.
Gel Filtration
The samples were loaded on a Superdex 200 HR column connected to an AKTA prime chromatography system. The fractionation was performed at 0.5 mL/min flow rate, 0.5 mL fraction size in a buffer containing 5% (w/v) sucrose, 0.1% (w/v) 3-[(3-cholamidopropyl)dimethylammonio]-1-propanesulfonate, 20 mM HEPES/NaOH, 5 mM DTT, and 50 mM NaCl. Size markers thyroglobulin (669 kDa) and aldolase (158 kDa) were used to approximate the sizes of oligomeric (∼700 kDa) and monomeric (∼15 kDa) Apaf-1. Then, 30 μL of each fraction was loaded on 8% polyacryl amide gel. The protein was transferred to a nitrocellulose membrane and incubated with Apaf-1 antibody overnight at 4 °C, as described for Western blotting. To analyze the data, the total of the intensity values from all fractions was used to establish the total amount of Apaf-1. The amount of Apaf-1 in each fraction was then expressed as a fraction of this total amount.
Statistical Analysis
All the graphical data are expressed as fold changes relative to WT Apaf-1. The data were analyzed using GraphPad Prism version 9. A one- sample t-test was used to compare the increase in luciferase and caspase activity induced by overexpression of Apaf-1 relative to a pcDNA3 control transfection. A one-way ANOVA test was used for comparing data sets with more than two groups. Tukey’s posthoc test was selected as the multiple comparison test for comparing WT sample mean with the other means. The data were plotted as mean ± SD. The confidence intervals were defined for 95%. P values are summarized with asterisk symbols: (P < 0.0001) ****; (P = 0.0001 to 0.001) ***; (P = 0.001 to 0.01) **; (P = 0.01 to 0.05) *; (P ≥ 0.05) ns.
Structure Modeling
All structure modeling was performed using Molecular Operating Environment (MOE) 2018.01;34 inactive form: PDB ID 3SFZ (murine APAF-1),13 active form: monomer of PB-ID 3JBT (human APAF-1).32 The two forms share 87.4% sequence identity and a further 9% sequence similarity. All residues described in the text are conserved between the two species. Throughout, alpha helices are depicted in red and beta sheets in yellow. Cytochrome c in Figure 5B is depicted in green. The residues of interest are shown in ball-and-stick and ADP/ATP as stick images. In order to enable appropriate inclusion of the mutant form K160R and comparison with the WT conformers, the models in Figure 4 depicting K160 or K160R in the active and inactive forms all underwent protein preparation and energy minimization based on the AMBER10:EHT force field and default settings in MOE.
Acknowledgments
This research is funded by EPIC 690939, an EC-funded RISE to HOF. F.S. and S.H. are visiting scientists supported by the EPIC. L.E. acknowledges funding from the Swedish Research Council (VR). S.H. is supported by the Research Council of Tarbiat Modares University through a grant (#D/2003) to the cell death and differentiation research program.
Glossary
Abbreviations
- N-Luc or C-Luc
N- or C-terminal portion of connected luciferase fragments to Apaf-1.
- XLuc
Coexpression of N-Luc and C-Luc Apaf-1 of one type (WT or mutant) of Apaf-1.
Supporting Information Available
The Supporting Information is available free of charge at https://pubs.acs.org/doi/10.1021/acsomega.1c02274.
Structural model of the interaction region of E546 and R907, live cell luminescence assay of the WT and mutated Apaf-1 reporter forms, and the primer sequences for mutagenesis (PDF)
Author Contributions
F.S.: she performed all experiments; S.H., assay concept, experimental design, writing and funding; L.E., structural modelling, reading the paper; H.F., data analysis and interpretation, model concept, writing and funding.
The authors declare no competing financial interest.
Supplementary Material
References
- Schafer Z. T.; Kornbluth S. The apoptosome: physiological, developmental, and pathological modes of regulation. Dev. Cell 2006, 10, 549–561. 10.1016/j.devcel.2006.04.008. [DOI] [PubMed] [Google Scholar]
- Shakeri R.; Kheirollahi A.; Davoodi J. Apaf-1: Regulation and function in cell death. Biochimie 2017, 135, 111–125. 10.1016/j.biochi.2017.02.001. [DOI] [PubMed] [Google Scholar]
- Wu C.-C.; Bratton S. B. Caspase-9 swings both ways in the apoptosome. Mol. Cell. Oncol. 2017, 4, e1281865 10.1080/23723556.2017.1281865. [DOI] [PMC free article] [PubMed] [Google Scholar]
- Xu W.; Che Y.; Zhang Q.; Huang H.; Ding C.; Wang Y.; Wang G.; Cao L.; Hao H. Apaf-1 Pyroptosome Senses Mitochondrial Permeability Transition. Cell Metab. 2021, 33, 424–436. 10.1016/j.cmet.2020.11.018. [DOI] [PubMed] [Google Scholar]
- Ferraro E.; Corvaro M.; Cecconi F. Physiological and pathological roles of Apaf1 and the apoptosome. J. Cell Mol. Med. 2003, 7, 21–34. 10.1111/j.1582-4934.2003.tb00199.x. [DOI] [PMC free article] [PubMed] [Google Scholar]
- D’Amelio M.; Tino E.; Cecconi F. The apoptosome: emerging insights and new potential targets for drug design. J. Pharm. Res. 2008, 25, 740–751. 10.1007/s11095-007-9396-z. [DOI] [PMC free article] [PubMed] [Google Scholar]
- Fischer U.; Schulze-Osthoff K. Apoptosis-based therapies and drug targets. Cell Death Differ. 2005, 12, 942–961. 10.1038/sj.cdd.4401556. [DOI] [PubMed] [Google Scholar]
- Ledgerwood E. C.; Morison I. M. Targeting the apoptosome for cancer therapy. Clin. Cancer Res. 2009, 15, 420–424. 10.1158/1078-0432.CCR-08-1172. [DOI] [PubMed] [Google Scholar]
- Yang L.; Mashima T.; Sato S.; Mochizuki M.; Sakamoto H.; Yamori T.; Oh-Hara T.; Tsuruo T. Predominant suppression of apoptosome by inhibitor of apoptosis protein in non-small cell lung cancer H460 cells: therapeutic effect of a novel polyarginine-conjugated Smac peptide. Cancer Res. 2003, 63, 831–837. [PubMed] [Google Scholar]
- Yu X.; Acehan D.; Ménétret J.-F.; Booth C. R.; Ludtke S. J.; Riedl S. J.; Shi Y.; Wang X.; Akey C. W. A structure of the human apoptosome at 12.8 Å resolution provides insights into this cell death platform. Structure 2005, 13, 1725–1735. 10.1016/j.str.2005.09.006. [DOI] [PubMed] [Google Scholar]
- Zou H.; Henzel W. J.; Liu X.; Lutschg A.; Wang X. Apaf-1, a human protein homologous to C. elegans CED-4, participates in cytochrome c–dependent activation of caspase-3. Cell 1997, 90, 405–413. 10.1016/S0092-8674(00)80501-2. [DOI] [PubMed] [Google Scholar]
- Yuan S.; Akey C. W. Apoptosome structure, assembly, and procaspase activation. Structure 2013, 21, 501–515. 10.1016/j.str.2013.02.024. [DOI] [PMC free article] [PubMed] [Google Scholar]
- Reubold T. F.; Wohlgemuth S.; Eschenburg S. Crystal structure of full-length Apaf-1: how the death signal is relayed in the mitochondrial pathway of apoptosis. Structure 2011, 19, 1074–1083. 10.1016/j.str.2011.05.013. [DOI] [PubMed] [Google Scholar]
- Shalini S.; Dorstyn L.; Dawar S.; Kumar S. Old, new and emerging functions of caspases. Cell Death Differ. 2015, 22, 526–539. 10.1038/cdd.2014.216. [DOI] [PMC free article] [PubMed] [Google Scholar]
- Wang L.; Qiao Q.; Wu H. Understanding CARD tricks in apoptosomes. Structure 2017, 25, 575–577. 10.1016/j.str.2017.03.013. [DOI] [PMC free article] [PubMed] [Google Scholar]
- Cheng T. C.; Hong C.; Akey I. V.; Yuan S.; Akey C. W. A near atomic structure of the active human apoptosome. eLife 2016, 5, e17755 10.7554/eLife.17755. [DOI] [PMC free article] [PubMed] [Google Scholar]
- Li Y.; Zhou M.; Hu Q.; Bai X.-c.; Huang W.; Scheres S. H. W.; Shi Y. Mechanistic insights into caspase-9 activation by the structure of the apoptosome holoenzyme. Proc. Natl. Acad. Sci. U.S.A. 2017, 114, 1542–1547. 10.1073/pnas.1620626114. [DOI] [PMC free article] [PubMed] [Google Scholar]
- Qin H.; Srinivasula S. M.; Wu G.; Fernandes-Alnemri T.; Alnemri E. S.; Shi Y. Structural basis of procaspase-9 recruitment by the apoptotic protease-activating factor 1. Nature 1999, 399, 549–557. 10.1038/21124. [DOI] [PubMed] [Google Scholar]
- Su T.-W.; Yang C.-Y.; Kao W.-P.; Kuo B.-J.; Lin S.-M.; Lin J.-Y.; Lo Y.-C.; Lin S.-C. Structural insights into DD-fold assembly and caspase-9 activation by the Apaf-1 apoptosome. Structure 2017, 25, 407–420. 10.1016/j.str.2016.12.019. [DOI] [PubMed] [Google Scholar]
- Yuan S.; Yu X.; Topf M.; Ludtke S. J.; Wang X.; Akey C. W. Structure of an apoptosome-procaspase-9 CARD complex. Structure 2010, 18, 571–583. 10.1016/j.str.2010.04.001. [DOI] [PMC free article] [PubMed] [Google Scholar]
- Shakeri R.; Hosseinkhani S.; Los M. J.; Davoodi J.; Jain M. V.; Cieślar-Pobuda A.; Rafat M.; Ardestani S. K. Role of the salt bridge between glutamate 546 and arginine 907 in preservation of autoinhibited form of Apaf-1. Int. J. Biol. Macromol. 2015, 81, 370–374. 10.1016/j.ijbiomac.2015.08.027. [DOI] [PubMed] [Google Scholar]
- Torkzadeh-Mahani M.; Ataei F.; Nikkhah M.; Hosseinkhani S. Design and development of a whole-cell luminescent biosensor for detection of early-stage of apoptosis. Biosens. Bioelectron. 2012, 38, 362–368. 10.1016/j.bios.2012.06.034. [DOI] [PubMed] [Google Scholar]
- Noori A. R.; Hosseini E. S.; Nikkhah M.; Hosseinkhani S. Apoptosome formation upon overexpression of native and truncated Apaf-1 in cell-free and cell-based systems. Arch. Biochem. Biophys. 2018, 642, 46–51. 10.1016/j.abb.2018.01.017. [DOI] [PMC free article] [PubMed] [Google Scholar]
- Tashakor A.; H-Dehkordi M.; O’Connell E.; Gomez Ganau S.; Gozalbes R.; Eriksson L. A.; Hosseinkhani S.; Fearnhead H. O. A new split-luciferase complementation assay identifies pentachlorophenol as an inhibitor of apoptosome formation. FEBS Open Bio 2019, 9, 1194–1203. 10.1002/2211-5463.12646. [DOI] [PMC free article] [PubMed] [Google Scholar]
- Oladzad A.; Nikkhah M.; Hosseinkhani S. Optimization of Experimental Variables Influencing Apoptosome Biosensor in HEK293T Cells. Sensors 2020, 20, 1782. 10.3390/s20061782. [DOI] [PMC free article] [PubMed] [Google Scholar]
- Hosseini E. S.; Nikkhah M.; Hamidieh A. A.; Fearnhead H. O.; Concordet J.-P.; Hosseinkhani S. The Lumiptosome, an engineered luminescent form of the apoptosome can report cell death by using the same Apaf-1 dependent pathway. J. Cell Sci. 2020, 133, 133. 10.1242/jcs.242636. [DOI] [PubMed] [Google Scholar]
- Noori A.-R.; Tashakor A.; Nikkhah M.; Eriksson L. A.; Hosseinkhani S.; Fearnhead H. O. Loss of WD2 subdomain of Apaf-1 forms an apoptosome structure which blocks activation of caspase-3 and caspase-9. Biochimie 2021, 180, 23–29. 10.1016/j.biochi.2020.10.013. [DOI] [PubMed] [Google Scholar]
- Hu Y.; Benedict M. A.; Ding L.; Núñez G. Role of cytochrome c and dATP/ATP hydrolysis in Apaf-1-mediated caspase-9 activation and apoptosis. EMBO J. 1999, 18, 3586–3595. 10.1093/emboj/18.13.3586. [DOI] [PMC free article] [PubMed] [Google Scholar]
- Perkins C.; Kim C. N.; Fang G.; Bhalla K. N. Overexpression of Apaf-1 promotes apoptosis of untreated and paclitaxel-or etoposide-treated HL-60 cells. Cancer Res. 1998, 58, 4561–4566. [PubMed] [Google Scholar]
- Shinoura N.; Sakurai S.; Asai A.; Kirino T.; Hamada H. Transduction of Apaf-1 or caspase-9 induces apoptosis in A-172 cells that are resistant to p53-mediated apoptosis. Biochem. Biophys. Res. Commun. 2000, 272, 667–673. 10.1006/bbrc.2000.2839. [DOI] [PubMed] [Google Scholar]
- Hu Q.; Wu D.; Chen W.; Yan Z.; Yan C.; He T.; Liang Q.; Shi Y. Molecular determinants of caspase-9 activation by the Apaf-1 apoptosome. Proc. Natl. Acad. Sci. U.S.A. 2014, 111, 16254–16261. 10.1073/pnas.1418000111. [DOI] [PMC free article] [PubMed] [Google Scholar]
- Zhou M.; Li Y.; Hu Q.; Bai X.-c.; Huang W.; Yan C.; Scheres S. H. W.; Shi Y. Atomic structure of the apoptosome: mechanism of cytochrome c-and dATP-mediated activation of Apaf-1. Genes Dev. 2015, 29, 2349–2361. 10.1101/gad.272278.115. [DOI] [PMC free article] [PubMed] [Google Scholar]
- Carpentier M.; Chomilier J. Analyses of displacements resulting from a point mutation in proteins. J. Struct. Biol. 2020, 211, 107543. 10.1016/j.jsb.2020.107543. [DOI] [PubMed] [Google Scholar]
- ULC, CCG . Molecular Operating Environment (MOE). 1010 Sherbrooke St. West, Montreal, QC, Canada, H3A 2R7, 2018. https://www.chemcomp.com/. (Jan, 2018).
Associated Data
This section collects any data citations, data availability statements, or supplementary materials included in this article.


