

Abstract
Objective
This study aimed to identify long-term prognostic protein biomarkers associated with disease progression in patients with progressive multiple sclerosis (MS).
Methods
CSF samples were collected from a discovery cohort of 28 patients with progressive MS who participated in a clinical trial with interferon beta. Patients were classified into high and low disability progression phenotypes according to numeric progression rates (NPR) and step-based progression rates (SPR) after a mean follow-up time of 12 years. Protein abundance was measured by shotgun proteomics. Selected proteins from the discovery cohort were quantified by parallel reaction monitoring in CSF samples from an independent validation cohort of 41 patients with progressive MS classified also into high and low disability progression phenotypes after a mean follow-up time of 7 years.
Results
Of 2,548 CSF proteins identified in the discovery cohort, 10 were selected for validation based on their association with long-term disability progression: SPATS2-like protein, chitinase 3–like 2 (CHI3L2), plasma serine protease inhibitor, metallothionein-3, phospholipase D4, beta-hexosaminidase, neurexophilin-1, adipocyte enhancer-binding protein 1, cathepsin L1, and lipopolysaccharide-binding protein. Only CHI3L2 was validated, and patients with high disability progression exhibited significantly higher CSF protein levels compared with patients with low disability progression (p = 0.03 for NPR and p = 0.02 for SPR). CHI3L2 levels showed good performance to discriminate between high and low disability progression in patients with progressive MS (area under the curve 0.73; sensitivity 90% and specificity 63%).
Conclusions
Although further confirmatory studies are needed, we propose CSF CHI3L2 as a prognostic protein biomarker associated with long-term disability progression in patients with progressive MS.
Classification of Evidence
This study provides Class II evidence that high CSF CHI3L2 levels identified higher disability progression in patients with progressive MS.
Multiple sclerosis (MS) is a neurodegenerative immune-mediated disorder of the CNS and an important cause of disability among young adults.1 Although the etiology of MS is unknown, it is assumed that both a complex genetic background and environmental triggers contribute to disease manifestation.2-6 In approximately 80%–85% of patients, MS starts with acute episodes of neurologic dysfunction and follows a relapsing-remitting course (RRMS).1 However, over time, a significant number of these patients will enter a secondary progressive phase of the disease which is characterized by maintained neurologic deterioration with or without further relapses.7 The remaining 15%–20% of patients with MS follow a progressive course from disease onset, and they are referred to as primary progressive MS (PPMS).8 Whereas currently available therapies in MS are highly effective to suppress the predominantly inflammatory component observed in patients with RRMS, these therapies have proven to be ineffective in patients with progressive forms of MS in whom a neurodegenerative component dominates.9,10 In this setting, a more in-depth understanding of the prognostic factors associated with disability progression will be critical to stratify patients with progressive MS according to disease evolution and ultimately may set the rationale for the design of more specific therapeutic approaches to prevent disease progression. In this study, we aimed to identify long-term prognostic biomarkers predictive of heightened disability progression in patients with progressive MS.
Methods
Discovery Cohort
Twenty-eight patients with progressive MS (17 patients with primary progressive forms [PPMS]11 and 11 patients with transitional progressive forms8) who participated in a 2-year phase II randomized, double-blind, placebo-controlled trial of interferon beta (IFNβ)-1b12 were included in this study. Selection of patients was performed based on the availability of CSF samples during the trial, and as shown in Table 1, this cohort was representative of the entire cohort that participated in the trial for demographics and clinical characteristics. Thirteen patients (46.4%) received IFNβ during the 2-year trial. Except for 1 patient treated with IFNβ during the trial who received mitoxantrone for 1 year after trial completion and then was treated with IFNβ for 11 additional years, the remaining 27 patients included in this study were untreated during the whole follow-up period. Progression rate variables were created by dividing Expanded Disability Status Scale (EDSS) changes, confirmed after 6 months, by the time on follow-up. Because many patients were in the range of EDSS where a change in 0.5 points corresponds to 1 EDSS step increase, 2 different variables were computed using these 2 different approaches: numeric progression rates (NPR) and step-based progression rates (SPR). Progression rates were computed between the time of trial onset and the last visit, and between the time after trial completion and the last visit. High disability progression was defined by the presence of NPR or SPR above the 75th percentile of disability progression. Patients with progression rates below the 75th percentile were defined as low disability progression. Demographic and clinical characteristics of patients with high and low disability progression are summarized in eTable, links.lww.com/NXI/A581.
Table 1.
Demographic and Clinical Characteristics of Patients With Progressive MS Belonging to the Discovery Cohort

Chromatographic and Mass Spectrometric Analysis in the Discovery Cohort
CSF samples were collected by lumbar puncture during the trial both in placebo and IFNβ-treated patients (mean time [range] from trial onset: 13 months [8.8–17.9]). CSF samples were centrifuged to remove cells, and the remaining volume was aliquoted and conserved at −80°C until used. For each sample, 120 µL of CSF were used for protein precipitation in cold acetone overnight at 4°C. Pellets were then solubilized in 6 M urea in 200 mM ammonium bicarbonate, reduced with 100 mM dithiothreitol, and alkylated with 200 mM iodoacetamide. Proteins were then digested with LysC 1:10 ratio (w:w; enzyme:substrate) at 37°C overnight followed by trypsin 1:10 ratio (w:w; enzyme:substrate) at 37°C for 8 hours. Tryptic peptide mixtures were desalted using a C18 UltraMicroSpin column (The Nest Group).
Peptide mixtures were analyzed in an Orbitrap Fusion Lumos with an EASY-Spray source coupled to a nano-ultra-performance liquid chromatography (UPLC) system (EASY-nanoLC 1000 liquid chromatography) equipped with a reverse-phase chromatography 25-cm column with an inner diameter of 75 µm, packed with 1.9 µm C18 particles (Nikkyo Technos, Japan). Chromatographic gradients started at 7% buffer B with a flow rate of 250 nL/minute and gradually increased to 35% in 120 minutes. After each run, the column was washed for 15 minutes with 90% buffer B (buffer A: 0.1% formic acid in water and buffer B: 0.1% formic acid in acetonitrile). The mass spectrometer was operated in data-dependent acquisition mode, with full MS scans over a mass range of m/z 350–1,500 with detection in the Orbitrap (120K resolution) and with auto gain control (AGC) set to 100,000. In each cycle of data-dependent acquisition analysis, after each survey scan, the most intense ions above a threshold ion count of 10,000 were selected for fragmentation with HCD at normalized collision energy of 28%. The number of selected precursor ions for fragmentation was determined by the “top speed” acquisition algorithm (maximum cycle time of 3 seconds), and a dynamic exclusion of 60 seconds was set. Fragment ion spectra were acquired in the ion trap with an AGC of 4,000 and a maximum injection time of 300 ms.
Acquired data were analyzed using the Proteome Discoverer software suite (v2.0, Thermo Fisher Scientific), and peptides were identified using the Mascot search engine (v1.6.0.16, Matrix Science). Data were searched against a human protein database derived from the SwissProt database (as in April 2015) plus the most common contaminants. The precursor ion mass tolerance was 7 ppm at the MS1 level, and up to 3 missed cleavages for trypsin were allowed. The fragment ion mass tolerance was set to 0.5 Da, methionine oxidation was set as variable modification, and cysteine carbamidomethylation was set as fixed modification. The identified peptides were filtered by 5% false discovery rate. Peptide areas were obtained using the “precursor ions area detector” module in the Proteome Discoverer software suite (v2.0, Thermo Fisher Scientific). Protein abundance in each condition was estimated using the log-transformed average of the 3 most intense peptides per protein group.
Selection of Candidate Proteins Associated With Disability Progression for Validation
Selection of proteins for validation in an independent cohort of patients with progressive MS was performed based on the differences in CSF protein levels between patients with high and low disability progression according to NPR and SPR at trial onset and after trial completion, and correlations between CSF protein levels and numeric and step progression rates at trial onset and after trial completion. Those proteins exhibiting a statistically significant abundance change (p value <0.05) or significant correlation (p value <0.05) in most (n ≥ 5) of the disability progression criteria reported in Table 3 were selected for further validation.
Table 3.
Selected CSF Proteins in the Discovery Cohort for Validation

Validation Cohort
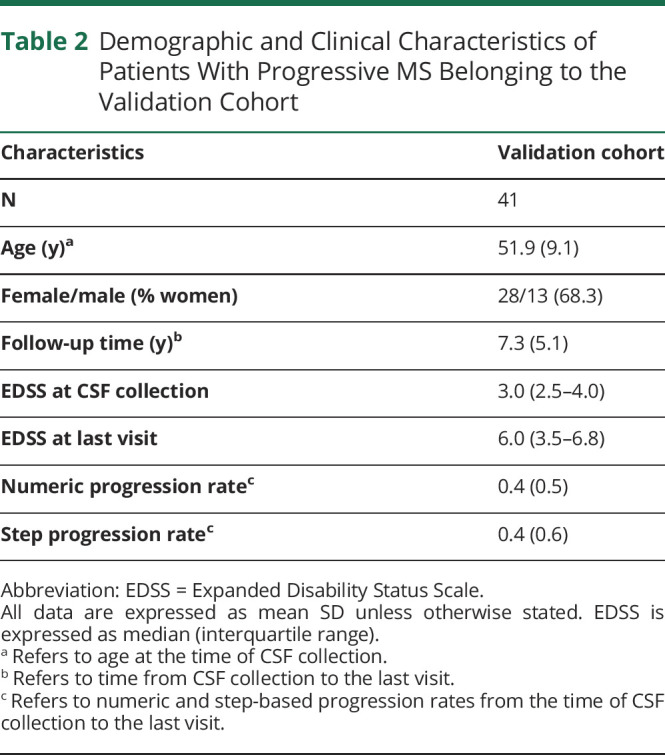
An independent cohort of 41 patients with PPMS was included in this study to validate selected proteins from the targeted quantitative proteomics approach. Patients were recruited from 4 MS centers (Barcelona—Hospital de Bellvitge [n = 7], Barcelona—Hospital Clinic [n = 11], Madrid—Puerta de Hierro [n = 6], and Madrid—Ramón y Cajal [n = 17]), and CSF sampling was performed as described above. NPR and SPR were calculated between the time of CSF collection performed at each recruiting center for diagnostic purposes and the time of last visit. As in the discovery cohort, patients in the validation cohort were classified according to the 75th percentiles of confirmed disability progression based on NPR and SPR. Patients were untreated for the whole follow-up period. A summary of demographics and clinical characteristics of the validation cohort is given in Table 2.
Table 2.
Demographic and Clinical Characteristics of Patients With Progressive MS Belonging to the Validation Cohort
Standard Protocol Approvals, Registrations, and Patient Consents
Written informed consent was obtained from each participant. This study was approved by the corresponding local Ethics Committees, and written informed consent was obtained from each participant.
Quantification of CSF Levels of Selected Proteins in the Validation Cohort
Levels of selected proteins were measured after a targeted proteomics approach with parallel reaction monitoring (PRM). For each patient, 80 µL of CSF were used for protein precipitation in cold acetone overnight at 4°C. Pellets were then solubilized in 6 M urea in 200 mM ammonium bicarbonate, reduced with 100 mM dithiothreitol, alkylated with 200 mM iodoacetamide, and digested with LysC 1:10 ratio (w:w; enzyme:substrate) at 37°C overnight followed by trypsin 1:10 ratio (w:w; enzyme:substrate) at 37°C for 8 hours. Tryptic peptide mixtures were desalted using a C18 UltraMicroSpin column (The Nest Group, Inc). For each targeted peptide, an isotopically labeled counterpart (13C6,15N2-Lys and 13C6,15N4-Arg, Pepotec Peptides; Thermo Fisher Scientific) was spiked in the peptide mixtures and used as internal standard for quantification purposes. Up to 2 unique peptides per protein were selected for targeted protein quantification. For each selected peptide, an isotopically labeled peptide (13C6,15N4-Arg and 13C6,15N2-Lys) was spiked in the samples and used as internal standard for quantification by PRM. The amount of internal standard peptide to be spiked in each sample was evaluated using dilution curves, and the final concentration was chosen based on the following criteria: (1) to be within the concentration range in which a linear response of the peptide was observed and (2) to have an area as close to the endogenous peptide area as possible.
Digested samples were analyzed by PRM using an Orbitrap Eclipse coupled to an EASY-nanoLC 1200 UPLC system (Thermo Fisher Scientific) with a 50-cm C18 chromatographic column (Easy-Spray Column, PepMap RSLC C18). Peptide mixes were separated with a chromatographic gradient starting at 5% B with a flow rate of 300 nL/minute and going up to 22% B in 79 minutes and to 32% B in 11 minutes (buffer A: 0.1% formic acid in water and buffer B: 0.1% formic acid in acetonitrile). The Orbitrap Eclipse was operated in positive ionization mode with an EASY-Spray nanosource at 1.4 kV and at a source temperature of 275°C.
A scheduled PRM method was used for data acquisition with a quadrupole isolation window set to 1.4 m/z and MS2 scans over a mass range of m/z 300–2,000, with detection in the Orbitrap mass analyzer at a 30K resolution. MS2 fragmentation was performed using HCD fragmentation at 30 normalized collision energy; the AGC was set at 1E5 and the maximum injection time at 54 ms. The size of the scheduled window was 6 minutes, and the maximum cycle time was 1 seconds. All data were acquired using XCalibur software.
Product ion chromatographic traces corresponding to the targeted precursor peptides were evaluated using Skyline software v.20.1 based on (1) co-elution of endogenous and internal standard peptides, (2) the number of detected traces, (3) correlation of the trace relative intensities between endogenous and internal standard peptides, and (4) expected retention time. Normalization was performed based on the median abundance of the internal standard peptides across all runs. Protein abundance estimates were performed using the software package MSstats 3.8.2.
The mass spectrometry proteomics data have been deposited to the ProteomeXchange Consortium (proteomecentral.proteomexchange.org) through the Proteomics Identifications Database partner repository13 with the data set identifier PXD022958.
Quantification of Neurofilament Light Chain Levels in CSF by Single-Molecule Array
Levels of neurofilament light chain (NFL) were measured in CSF samples from 36 patients with PPMS belonging to the validation cohort using commercially available NFL immunoassay kits (Quanterix, Billerica, MA, cat no. 103186) and run on a single-molecule array (Simoa) HD-1 Analyzer (Quanterix). Samples were run in duplicate in line with manufacturers' instructions using appropriate standards and internal controls. The intra-assay coefficient of variation was 6%.
Classification of Evidence
Our primary research question was to identify CSF biomarkers associated with disability progression in patients with progressive MS. The classification of evidence assigned to this question is Class II.
Statistical Analysis
Differences in CSF protein abundances were assessed among patients with high and low disability progression according to NPR and SPR using an analysis of variance model. Linear association between CSF protein abundances and NPR and SPR during the follow-up was evaluated using the Spearman rank correlation coefficient. Considering that a proportion of patients were receiving IFNβ at the time of CSF collection, the potential effect of IFNβ in CSF protein levels was also evaluated including treatment as covariate in the analysis. Differences in progression rates between patients from the discovery and validation cohorts were assessed using a Mann-Whitney U test. Performance of CSF chitinase 3–like 2 (CHI3L2) levels to discriminate between patients with high and low disability progression was assessed using receiver operating characteristic (ROC) curve analysis.
Data Availability
All data analyzed during this study will be shared anonymized by request of a qualified investigator to the corresponding author.
Results
CSF Proteomic Analysis in the Discovery Cohort of Patients With Progressive MS Identifies Proteins Associated With Long-term Disability Progression
A schematic flowchart summarizing the main steps of the study design is represented in Figure 1. To identify proteins associated with disability progression, we first performed a quantitative proteomic analysis in CSF samples from a discovery cohort of 28 patients with progressive MS classified according to numeric and step progression rates. A total of 2,548 proteins were identified in CSF samples by mass spectrometric analysis (the full list of identified proteins is provided in eTable, links.lww.com/NXI/A582). Of these identified proteins, 10 proteins were prioritized for further validation because of their potential association with disability progression, as described in the Methods section: SPATS2-like protein (SPATS2L), CHI3L2, plasma serine protease inhibitor (SERPINA5), metallothionein-3 (MT3), phospholipase D4 (PLD4), and beta-hexosaminidase (HEXB), which were more abundant in the CSF of patients with high disability progression, and neurexophilin-1 (NXPH1), adipocyte enhancer-binding protein 1 (AEBP1), cathepsin L1 (CTSL), and lipopolysaccharide-binding protein (LBP), which were more abundant in the CSF of patients with low disability progression (Table 3). Only NXPH1 showed significant changes in CSF protein levels in patients receiving IFNβ, although differences stayed significant after adjusting by treatment. The remaining detected proteins showed either a lack of statistically significant association with disability progression or were significantly associated with disability progression only in a minority (<5) of the classification criteria (eTable 3, links.lww.com/NXI/A583).
Figure 1. Flowchart Summarizing the Different Steps Undertaken in the Study.

NPR and SPR were calculated in a discovery cohort of 28 patients with progressive MS who participated in a 2-year placebo-controlled trial of IFNβ-1b. Progression rates were computed between the time of trial onset and the last visit (NPR/SPR at trial onset), and between the time after trial completion and the last visit (NPR/SPR off trial). Based on these progression rates, patients with progressive MS were classified into high and low disability progression phenotypes. By means of a quantitative proteomic approach, a total of 2,548 proteins were identified in CSF samples from patients belonging to the discovery cohort, of which 10 proteins were found to be associated with disability progression in most of the selection criteria shown in the figure. Protein levels for these 10 proteins were measured by PRM in CSF samples from a validation cohort of 41 patients with progressive MS classified into high and low disability progression phenotypes according to NPR and SPR computed between the time of CSF collection and the time of the last visit.
CSF CHI3L2 Is Validated as Long-term Prognostic Biomarker Associated With Disability Progression in Patients With PPMS
To validate the results obtained in the discovery cohort, levels of the 10 selected proteins were determined by targeted proteomics in CSF samples from an independent cohort of patients with progressive MS. Although the discovery cohort included patients with transitional progressive MS and PPMS, no statistically significant differences were observed in the CSF levels of the 10 selected proteins between both groups of patients (data not shown), results that supported the use of a validation cohort consisting exclusively of patients with PPMS. Follow-up time of patients with PPMS in the validation cohort was shorter and EDSS scores at onset lower compared with patients belonging to the discovery cohort (eTable 1, links.lww.com/NXI/A581 and eTable 2, links.lww.com/NXI/A582). However, there were no statistically significant differences in NPR and SPR between patients from the discovery and validation cohorts (0.3 [0.7] and 0.2 [0.1] for NPR at onset and off trial, respectively, in the discovery cohort vs 0.4 [0.5] in the validation cohort; 0.6 [1.3] and 0.3 [0.2] for SPR at onset and off trial, respectively, in the discovery cohort vs 0.4 [0.6] in the validation cohort; p > 0.05 for all comparisons).
Only CHI3L2 was validated, and similar to the findings in the discovery cohort (Table 3), CSF CHI3L2 levels were significantly higher in patients with PPMS who progressed faster during the follow-up based on both NPR and SPR compared with those patients having lower disability progression (p = 0.03 and p = 0.02, respectively) (Figure 2A). CSF CHI3L2 levels significantly correlated with NPR (r: 0.34, p = 0.03), whereas a trend for significant correlation was observed between CHI3L2 levels and SPR progression rates (r: 0.30, p = 0.05) (Figure 2a).
Figure 2. Performance of CHI3L2 as a Biomarker of Disability Progression in Patients With Progressive MS.

(A) Graphs comparing CSF CHI3L2 levels between high and low disability progression patients with progressive MS according to numeric and step-based progression rates, and correlation plots evaluating linear association between CSF CHI3L2 levels and progression rates, both in the validation cohort. (B) Performance of CSF CHI3L2 levels to discriminate between patients with high and low disability progression based on numeric (B.a) and step-based progression rates (B.b). AU = protein abundance estimate; AUC = area under the receiver operating characteristic curve. Numbers in parentheses represent 95% confidence intervals of the AUC; CHI3L2 = chitinase 3-like 2.
Figure 2B shows the potential for CSF CHI3L2 levels to discriminate between high and low disability progression in patients with PPMS. The area under the ROC curve (AUC) was 73% (p = 0.03) and a CSF CHI3L2 value of 17.1 (protein abundance estimate) resulted in the best cutoff to classify patients with PPMS with high and low disability progression according to both NPR and SPR, with a sensitivity of 90% and specificity of 63%.
Partial correlations adjusting for age did not reveal statistically significant associations between CSF CHI3L2 and NFL levels (r = 0.02, p = 0.91) or between CSF NFL levels and numeric progression rates (r = 0.08, p = 0.62) or SPR (r = 0.09, p = 0.60).
In the validation cohort, except for SPATS2L which could not be detected, the mean CSF levels of the remaining proteins did not significantly differ between high and low disability progression using NPR or SPR in patients with PPMS, and hence, they were not validated as biomarkers associated with disability progression in MS (Table 4; eFigure 1, links.lww.com/NXI/A579 and eFigure 2, links.lww.com/NXI/A580).
Table 4.
CSF Proteins Levels of Selected Proteins in the Validation Cohort

Discussion
Our understanding of disease progression is limited and still remains as one of the unmet needs in MS.10 In this context, there is a lack of prognostic factors associated with disability progression in patients with progressive forms of MS. Bearing this in mind, we aimed to identify long-term prognostic biomarkers in the CSF of patients with progressive MS by conducting a 2-phase study. An initial or discovery cohort included patients with progressive MS with a follow-up longer than 10 years who participated in a single-center trial of IFNβ-1b.12 By quantitative proteomics analysis of the CSF samples collected during the trial, we identified a number of candidate CSF proteins that were associated with long-term disability progression in patients classified according to 2 related progression rate indexes, which were applied at different time points during the trial. Although almost half of the patients were receiving IFNβ at the time of CSF collection, treatment did not seem to have a major impact on CSF protein levels.
A second or validation cohort included exclusively untreated patients with PPMS whose CSF samples were collected from different MS centers. Although in these patients follow-up time was shorter and EDSS scores were lower, the progression rates, which relate EDSS changes to time on follow-up, were comparable among patients with progressive MS belonging to both study cohorts. Selected candidate CSF biomarkers identified in the initial cohort were measured in the validation cohort by means of PRM, a well-known specific and reproducible mass spectrometric technique for protein quantitation.14 Only CHI3L2 was found to be significantly associated with disability progression in both cohorts of patients.
CHI3L2, also known as YKL39, is a member of the 18 glycosyl hydrolase family that can bind chitin with high affinity but lacks enzymatic activity.15 CHI3L2 was first discovered in conditioned medium from primary cultures of human articular cartilage chondrocytes15, and its function has been related to the immune response and tissue remodeling. In this context, CHI3L2 was expressed by M2 polarized macrophages and was found to act as a pro-angiogenic and monocyte recruiting factor.16 Little is known about the physiologic and pathologic roles of CHI3L2 in the CNS. CSF CHI3L2 levels have been reported to be elevated in a number of neuroinflammatory conditions.17-21 In patients with clinically isolated syndrome (CIS), high CSF CHI3L2 levels were associated with an increased risk for MS and predicted cognitive impairment evaluated by the paced auditory serial addition test.18 In another study, CSF CHI3L2 levels were found to be significantly increased in patients with RRMS compared with patients with CIS, patients with progressive MS, and controls.17
In our study, CSF abundance for CHI3L2 was higher in patients with progressive MS who later progressed faster compared with those patients with lower progression rates. In addition, CSF CHI3L2 levels showed good potential to discriminate between high and low disability progression in patients with progressive MS after long-term follow-up, with excellent sensitivity and acceptable specificity. Although the underlying molecular mechanisms of the association observed between CSF CHI3L2 levels and disease progression are unknown, a previous study revealed CHI3L2 expression in astrocytes from white matter plaques and from normal appearing white matter.17 In this context, several lines of evidence have pointed to astrocytes as important players in MS pathogenesis and suggested a contribution of these cells to the neurodegenerative component of the disease.22-27 This astrocytic origin of CHI3L2 may explain the lack of correlation observed in our study between CSF CHI3L2 abundance and CSF NFL levels, as a representative biomarker of neuronal damage.28
CSF proteins that were significantly associated with long-term disability progression in a lower number of classification methods are also interesting candidate biomarkers that require further validation in independent cohorts of patients with progressive MS. Of note, one of these candidates is CHI3L1, a protein closely related to CHI3L2 in size and sequence, although with structural differences,29 which has been extensively implicated in MS.30 In contrast to CHI3L2, CHI3L1 was found significantly increased in the CSF of patients with progressive MS compared with patients with RRMS,17 and high CSF CHI3L1 levels were identified as an independent predictor of disability worsening in patients with MS.31
The reasons for the lack of validation of the remaining proteins selected from the first phase of the study are unknown and probably manifold. They may be related to differences in the clinical characteristics of patients included in both cohorts such as the clinical form (patients with transitional progressive and PPMS in the discovery cohort vs patients with purely PPMS in the validation cohort), treatment with IFNβ in a subgroup of patients from the discovery cohort vs untreated patients in the validation cohort, and shorter follow-up and lower disability scores in the validation cohort. However, as mentioned before, some of these differential factors were considered in the analysis, and also the progression rates that were used to classify patients into high and low disability progression phenotypes were comparable among patients from the discovery and validation cohorts. Other factors may relate to differences in the proteomic techniques used to determine protein abundance in the CSF of patients with MS. However, based on the results in the validation cohort, except for CHI3L2, the remaining candidate CSF proteins identified in the first phase of the study can probably be considered as false-positive results.
In conclusion, a proteomic approach in CSF samples from patients with progressive MS classified into high and low disability progression phenotypes has led to the identification and validation of CHI3L2 as a biomarker associated with long-term disability progression. Further mechanistic studies are needed to better understand the relationship between CSF CHI3L2 and disability progression in MS.
Acknowledgment
The authors want to particularly acknowledge the patients and the Biobank HUB-ICO-IDIBELL (PT17/0015/0024) integrated in the Spanish Biobank Network for their collaboration. The authors also wish to thank the Biobank Hospital Universitario Puerta de Hierro Majadahonda (HUPHM)/Instituto de Investigación Sanitaria Puerta de Hierro-Segovia de Arana (IDIPHISA) (PT17/0015/0020 in the Spanish National Biobanks Network) for the human specimens used in this study.
Glossary
- AEBP1
adipocyte enhancer-binding protein 1
- AGC
auto gain control
- CHI3L2
chitinase 3–like 2
- CIS
clinically isolated syndrome
- CTSL
cathepsin L1
- EDSS
Expanded Disability Status Scale
- HEXB
hexosaminidase
- IFNβ
interferon beta-1b
- MS
multiple sclerosis
- MT3
metallothionein-3
- NFL
neurofilament light chain
- NPR
numeric progression rates
- NXPH1
neurexophilin-1
- PLD4
phospholipase D4
- PPMS
progressive MS
- PRM
parallel reaction monitoring
- ROC
receiver operating characteristic
- RRMS
relapsing-remitting course
- SERPINA5
plasma serine protease inhibitor
- SPATS2L
SPATS2-like protein
- SPR
step progression rates
- UPLC
ultra-performance liquid chromatography
Appendix. Authors
Contributor Information
Jaume Sastre-Garriga, Email: jsastre-garriga@cem-cat.org.
Eva Borras, Email: eva.borras@upf.edu.
Luisa M. Villar, Email: luisamaria.villar@salud.madrid.org.
Albert Saiz, Email: asaiz@clinic.cat.
Sergio Martínez-Yélamos, Email: smartinezy@bellvitgehospital.cat.
Juan Antonio García-Merino, Email: jgmerino@salud.madrid.org.
Rucsanda Pinteac, Email: rucsanda.pinteac@vhir.org.
Nicolas Fissolo, Email: nicolas.fissolo@vhir.org.
Antonio J. Sánchez López, Email: asanchezl.hpth@salud.madrid.org.
Lucienne Costa-Frossard, Email: lufrossard@yahoo.es.
Yolanda Blanco, Email: yblanco@clinic.cat.
Sara Llufriu, Email: sllufriu@clinic.cat.
Angela Vidal-Jordana, Email: avidal@cem-cat.org.
Eduard Sabidó, Email: eduard.sabido@crg.cat.
Xavier Montalban, Email: xavier.montalban@unic-em.com.
Study Funding
This work was funded by grants from the International Progressive MS Alliance (grant no. PA0020), Asociación Esclerosis Múltiple (EME)—Red Española de Esclerosi múltiple (REEM), REEM (RD16/0015/002 and RD16/0015/003) cofunded by the Instituto de Salud Carlos III and Fondo Europeo de Desarrollo Regional (FEDER, Otra manera de hacer Europa).
Disclosure
The authors report no disclosures relevant to the manuscript. Go to Neurology.org/NN for full disclosures.
References
- 1.Thompson AJ, Baranzini SE, Geurts J, et al. Multiple sclerosis. Lancet. 2018;391(10130):1622-1636. [DOI] [PubMed] [Google Scholar]
- 2.International Multiple Sclerosis Genetics Consortium, Wellcome Trust Case Control Consortium 2, , Sawcer S, et al. Genetic risk and a primary role for cell-mediated immune mechanisms in multiple sclerosis. Nature. 2011;476(7359):214-219. [DOI] [PMC free article] [PubMed] [Google Scholar]
- 3.International Multiple Sclerosis Genetics Consortium, Beecham AH, Patsopoulos NA, et al. Analysis of immune-related loci identifies 48 new susceptibility variants for multiple sclerosis. Nature Genet. 2013;45(11):1353-1360. [DOI] [PMC free article] [PubMed] [Google Scholar]
- 4.International Multiple Sclerosis Genetics Consortium. Multiple sclerosis genomic map implicates peripheral immune cells and microglia in susceptibility. Science. 2019;365(6460):eaav7188. [DOI] [PMC free article] [PubMed] [Google Scholar]
- 5.Ascherio A, Munger KL, Lünemann JD. The initiation and prevention of multiple sclerosis. Nat Rev Neurol. 2012;8(11):602-612. [DOI] [PMC free article] [PubMed] [Google Scholar]
- 6.Waubant E, Lucas R, Mowry E, et al. Environmental and genetic risk factors for MS(XX): an integrated review. Ann Clin Transl Neurol. 2019;6(9):1905-1922. [DOI] [PMC free article] [PubMed] [Google Scholar]
- 7.Confavreux C, Vukusic S. Natural history of multiple sclerosis: a unifying concept. Brain. 2006;129(Pt 3):606-616. [DOI] [PubMed] [Google Scholar]
- 8.Thompson AJ, Polman C, Miller CH, et al. Primary progressive multiple sclerosis. Brain. 1997;120(Pt 6):1085-1096. [DOI] [PubMed] [Google Scholar]
- 9.Tintore M, Vidal-Jordana A, Sastre-Garriga J. Treatment of multiple sclerosis - success from bench to bedside. Nat Rev Neurol. 2019;15(1):53-58. [DOI] [PubMed] [Google Scholar]
- 10.Thompson A, Ciccarelli O. Towards treating progressive multiple sclerosis. Nat Rev Neurol. 2020;16(11):589-590. [DOI] [PubMed] [Google Scholar]
- 11.Lublin FD, Reingold SC. Defining the clinical course of multiple sclerosis: results of an international survey. Neurology. 1996;46(4):907-911. [DOI] [PubMed] [Google Scholar]
- 12.Montalban X, Sastre-Garriga J, Tintoré M, et al. A single-center, randomized, double-blind, placebo-controlled study of interferon beta-1b on primary progressive and transitional multiple sclerosis. Mult Scler. 2009;15(10):1195-1205. [DOI] [PubMed] [Google Scholar]
- 13.Perez-Riverol Y, Csordas A, Bai J, et al. The PRIDE database and related tools and resources in 2019: improving support for quantification data. Nucleic Acids Res. 2019;47(D1):D442-D450. [DOI] [PMC free article] [PubMed] [Google Scholar]
- 14.Lesur A, Domon B. Advances in high-resolution accurate mass spectrometry application to targeted proteomics. Proteomics. 2015;15(5-6):880-890. [DOI] [PubMed] [Google Scholar]
- 15.Guan S-P, Mok Y-K, Koo K-N, et al. Chitinases: biomarkers for human diseases. Protein Pept Lett. 2009;16(5):490-498. [DOI] [PubMed] [Google Scholar]
- 16.Liu T, Larionova I, Litviakov N, et al. Tumor-associated macrophages in human breast cancer produce new monocyte attracting and pro-angiogenic factor YKL-39 indicative for increased metastasis after neoadjuvant chemotherapy. Oncoimmunology. 2018;7(6):e1436922. [DOI] [PMC free article] [PubMed] [Google Scholar]
- 17.Hinsinger G, Galéotti N, Nabholz N, et al. Chitinase 3-like proteins as diagnostic and prognostic biomarkers of multiple sclerosis. Mult Scler. 2015;21(10):1251-1261. [DOI] [PubMed] [Google Scholar]
- 18.Møllgaard M, Degn M, Sellebjerg F, et al. Cerebrospinal fluid chitinase-3-like 2 and chitotriosidase are potential prognostic biomarkers in early multiple sclerosis. Eur J Neurol. 2016;23(5):898-905. [DOI] [PubMed] [Google Scholar]
- 19.Sanfilippo C, Nunnari G, Calcagno A, et al. The chitinases expression is related to simian immunodeficiency virus encephalitis (SIVE) and in HIV encephalitis (HIVE). Virus Res. 2017;227:220-230. [DOI] [PubMed] [Google Scholar]
- 20.Sanfilippo C, Longo A, Lazzara F, et al. CHI3L1 and CHI3L2 overexpression in motor cortex and spinal cord of sALS patients. Mol Cell Neurosci. 2017;85:162-169. [DOI] [PubMed] [Google Scholar]
- 21.Thompson AG, Gray E, Bampton A, et al. CSF chitinase proteins in amyotrophic lateral sclerosis. J Neurol Neurosurg Psychiatry. 2019;90(11):1215-1220. [DOI] [PubMed] [Google Scholar]
- 22.Wang D, Ayers MA, Catmull DV, et al. Astrocyte-associated axonal damage in pre-onset stages of experimental autoimmune encephalomyelitis. Glia. 2005;51(3):235-240. [DOI] [PubMed] [Google Scholar]
- 23.Brambilla R, Persaud T, Hu X, et al. Transgenic inhibition of astroglial NF-kappa B improves functional outcome in experimental autoimmune encephalomyelitis by suppressing chronic central nervous system inflammation. J Immunol. 2009;182(5):2628-2640. [DOI] [PMC free article] [PubMed] [Google Scholar]
- 24.Nair A, Frederick TJ, Miller SD. Astrocytes in multiple sclerosis: a product of their environment. Cell Mol Life Sci. 2008;65(17):2702-2720. [DOI] [PMC free article] [PubMed] [Google Scholar]
- 25.Kim RY, Hoffman AS, Itoh N, et al. Astrocyte CCL2 sustains immune cell infiltration in chronic experimental autoimmune encephalomyelitis. J Neuroimmunol. 2014;274(1-2):53-61. [DOI] [PMC free article] [PubMed] [Google Scholar]
- 26.Farez MF, Quintana FJ, Gandhi R, et al. Toll-like receptor 2 and poly(ADP-ribose) polymerase 1 promote central nervous system neuroinflammation in progressive EAE. Nat Immunol. 2009;10(9):958-964. [DOI] [PMC free article] [PubMed] [Google Scholar]
- 27.Mayo L, Trauger SA, Blain M, et al. Regulation of astrocyte activation by glycolipids drives chronic CNS inflammation. Nat Med. 2014;20(10):1147-1156. [DOI] [PMC free article] [PubMed] [Google Scholar]
- 28.Khalil M, Teunissen CE, Otto M, et al. Neurofilaments as biomarkers in neurological disorders. Nat Rev Neurol. 2018;14(10):577-589. [DOI] [PubMed] [Google Scholar]
- 29.Ranok A, Wongsantichon J, Robinson RC, Suginta W. Structural and thermodynamic insights into chitooligosaccharide binding to human cartilage chitinase 3-like protein 2 (CHI3L2 or YKL-39). J Biol Chem. 2015;290(5):2617-2629. [DOI] [PMC free article] [PubMed] [Google Scholar]
- 30.Pinteac R, Montalban X, Comabella M. Chitinases and chitinase-like proteins as biomarkers in neurological disorders. Neurol Neuroimmunol Neuroinflamm. 2020;8(1):e921. [DOI] [PMC free article] [PubMed] [Google Scholar]
- 31.Gil-Perotin S, Castillo-Villalba J, Cubas-Nuñez L, et al. Combined cerebrospinal fluid neurofilament light chain protein and chitinase-3 like-1 levels in defining disease course and Prognosis in multiple sclerosis. Front Neurol. 2019;10:1008. [DOI] [PMC free article] [PubMed] [Google Scholar]
Associated Data
This section collects any data citations, data availability statements, or supplementary materials included in this article.
Data Availability Statement
All data analyzed during this study will be shared anonymized by request of a qualified investigator to the corresponding author.