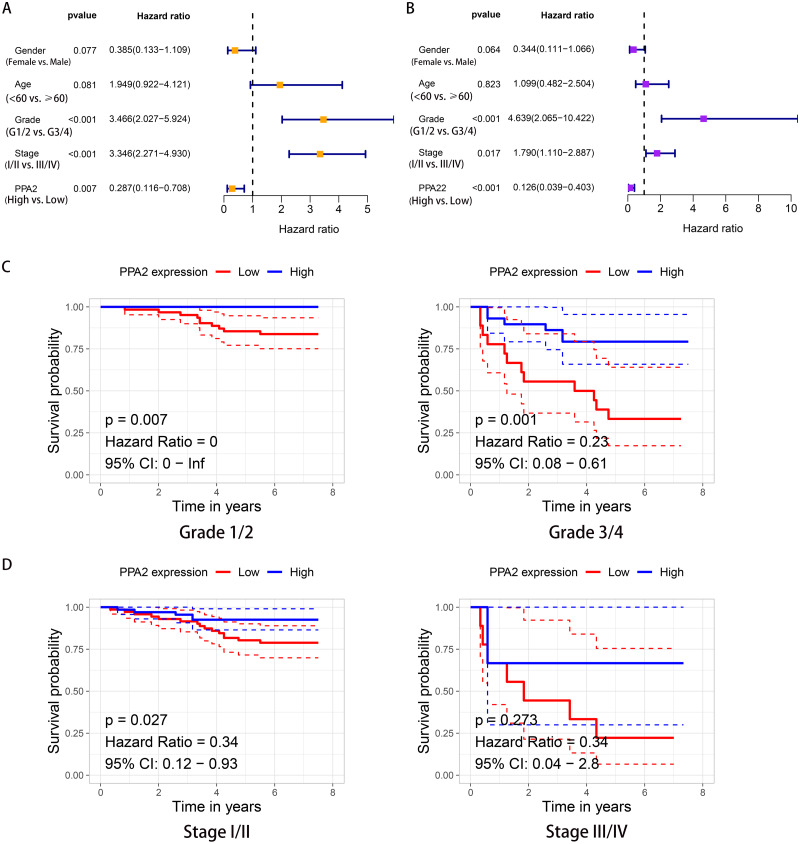
Figure 3. Independent prognostic value of PPA2 in KIRC.
(A) Forest plot showing the results of univariate Cox regression analysis. (B) Forest plot showing the results of multivariate Cox regression analysis. (C) Kaplan–Meier survival analysis for PPA2 expression stratified by histologic grade. (D) Kaplan–Meier survival analysis for PPA2 expression stratified by stage. KIRC, kidney renal clear cell carcinoma.

