Editorial Our new column Insights is an ongoing series of interviews prepared by the China CDC Weekly team with researchers, policymakers, experts, and other leaders that strives to disseminate experiences, knowledge, and perspectives in global and public health with a wider community. At the discretion of the Weekly’s team, these interviews will be written into articles, shared as videos, and/or presented as transcripts to best promote plain-language principles and to ease understanding of non-specialized academic readers.
Our first publication in Insights is an interview with Professor Jian Lu, the City University of Hong Kong’s Chair Professor of the Department of Biomedical Sciences, Department of Material Science and Engineering, and Department of Mechanical Engineering, conducted on June 15, 2020. Prof. Lu has used his interdisciplinary expertise to create a new approach for modeling the COVID-19 pandemic by drawing comparisons between infection propagation and mechanical vibration. For more information, please read below.
As the coronavirus disease 2019 (COVID-19) pandemic was becoming a major public health emergency in late January 2020, Professor Jian Lu of the City University of Hong Kong was queried by friends in a WeChat group to predict the number of cases in the coming days. Prof. Lu, the chair professor of three departments including Biomedical Sciences, Material Science and Engineering, and Mechanical Engineering, saw in this academic challenge an opportunity to utilize his interdisciplinary expertise and contribute to the global understanding of the pandemic.
Where many existing models have relied on epidemiological and biostatistical principles to find an R0, the basic reproductive number indicating the number of infections coming from one case, Prof. Lu believed that the modeling of R0 relied on many difficult-to-estimate parameters such as the effectiveness of social distancing measures and case-finding capabilities. Having a separate skillset, Prof. Lu saw a chance to use only publicly available case numbers to formulate the propagation of the COVID-19 pandemic analogously to a vibration mechanical system. Being an expert in fracture mechanics and experimental mechanics, Prof. Lu saw similarities to assessing the strength of new materials and Moore’s Law, the observation that transistor density on a microchip doubles every two years but has no inherent material explanation, and applied these lines of thinking by viewing the country and regional health systems as pseudo-materials with the COVID-19 pandemic applying stress and propagating failure.
The following is his equation: N(Dn)total = N(Dn−1)total × (Rn−1 - Rc × Dn); where Dn is the number of days starting from the first day of simulation to day n; N(Dn)total is the total number of infected cases till day n; Rn-1 is the case increase rate prior to day n; and Rc is the reduction coefficient of daily cases increase rate (1).
Prof. Lu’s equation was used to display two vital components in his model: the rate of increase in daily cases and the reduction coefficient Rc of the increase rate in daily cases. As shown in Figure 1, the rate of increase in daily cases was mapped to display the rate of growth in individual countries and regions. Countries that were shaded green have reached the final stages of propagation and were close to overcoming the pandemic within their borders. However, countries that were bluer with rates of increase <2% and <3% were still experiencing high levels of growth, and countries that were shaded black have Rc’s that were <0.5%, which indicates the pandemic was still not controlled within the country’s borders. The countries modelled as having uncontrolled growth were, as of June 24, 2020, The Republic of Columbia, Republic of India, The Federative Republic of Brazil, Republic of the Philippines, Sultanate of Oman, The Republic of South Africa, The Republic of Honduras, The Republic of Argentina, and Republic of Iraq.
Figure 1.

Professor Jian Lu’s daily update of his COVID-19 pandemic model using publicly available data. The color scheme indicated the rate of increase in daily cases in countries and regions, and if the rate of increase had a significantly low reduction coefficient of the increase rate Rc, the country was shaded black.
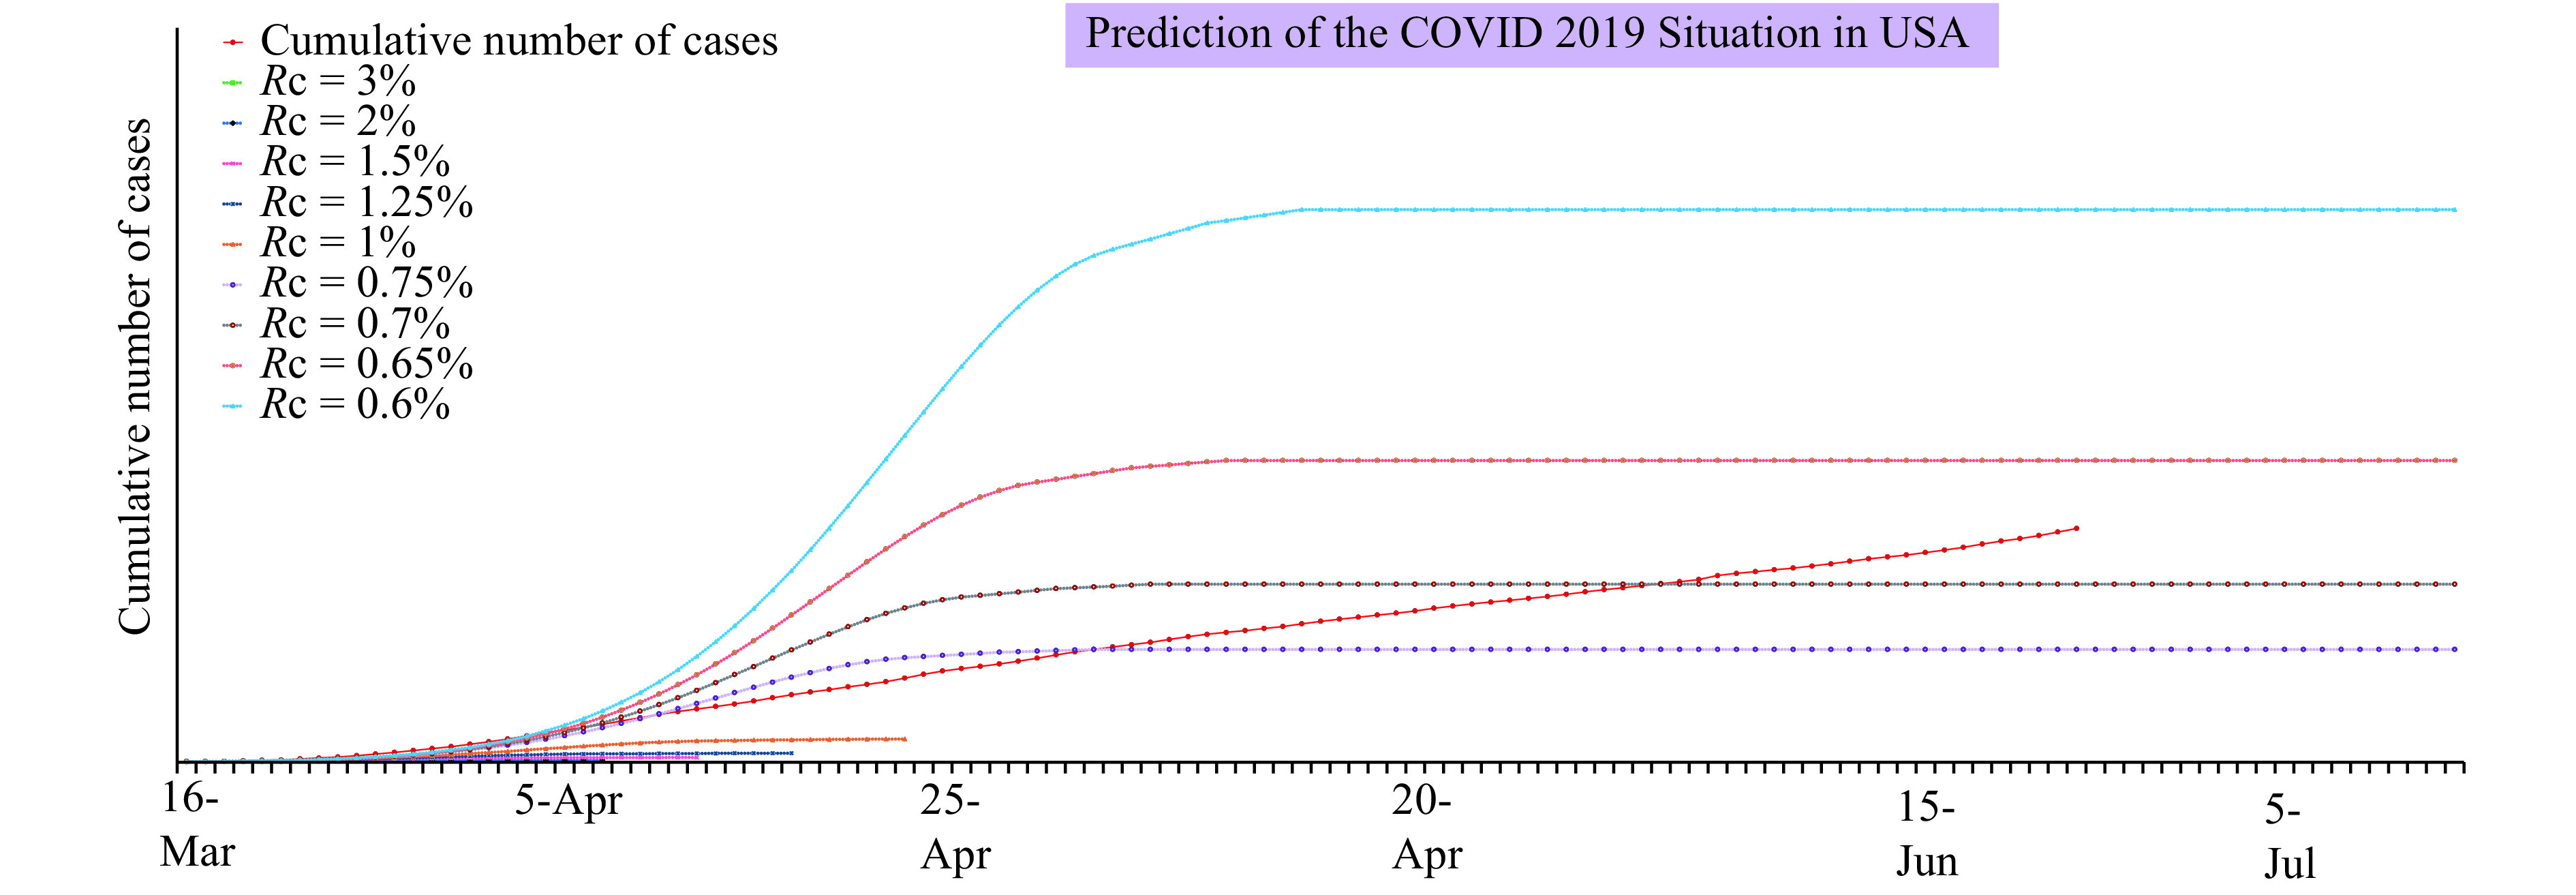
In his daily updates, Prof. Lu also included additional graphs modeling the propagation of COVID-19 at several different Rc’s and tracked the real propagation within individual countries and several states of the USA. As shown in Figure 2, a higher Rc value indicated stronger control and the projected curves reached a lower cumulative number of cases. The red curve indicated the real progression of the pandemic using publicly available data and showed shifts in which Rc threshold the USA’s curve was in, which intuitively suggested that the propagation of COVID-19 can alter based on the tightening or loosening of response measures. Prof. Lu’s approach, therefore, means that R0 can be considered as dynamic and as taking into account the response to virus propagation.
Figure 2.

Professor Jian Lu’s modeling of COVID-19 progression in the United States. The real progression was indicated by the red curve, and the other curves projected the progression at various reduction coefficients, Rc, of the rate of increase of daily cases. This curve indicated that COVID-19 is still not adequately controlled as the red line has exceeded the projected lines of Rc=0.75% and Rc=0.7%. Professor Jian Lu’s models of other countries and of several states in the USA are available at his homepage: http://personal.cityu.edu.hk/jianlu.
Prof. Lu and his team will diligently continue updating their modeling of these countries and regions until the end of the pandemic. For more detailed information, please visit their website: http://personal.cityu.edu.hk/jianlu/.
Biography

Jian Lu, PhD Chair Professor of the Department of Mechanical Engineering Chair Professor of the Department of Materials Science and Engineering Chair Professor of the Department of Biomedical Sciences City University of Hong Kong
References
- 1.Lu Jian A new, simple projection model for COVID-19 pandemic. medRxiv. 2020 doi: 10.1101/2020.03.21.20039867. [DOI] [Google Scholar]


