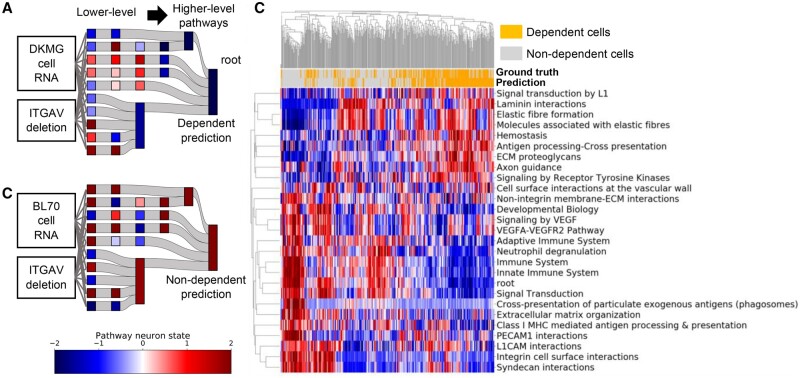
Fig. 5.
BioVNN explains the dependency by simulated pathway states. (A) ITGAV-dependent cell line, DKMG, and (B) non-ITGAV-dependent cell line, BL70, showed distinct neuron states of 27 ITGAV-involved pathways in the hierarchy, which explains their reversed predictions. (C) The clustered heatmap of neuron states of ITGAV-involved pathways and cell lines. The neuron state colors represent the PC1 of neuron states converted to a z-score across cell lines

