Abstract
The transcription factor TCF-1 is essential for the development and function of T regulatory (Treg) cells, however its function is poorly understood. Here, we show that TCF-1 primarily suppresses transcription of genes that are co-bound by Foxp3. Single-cell RNA-seq analysis identified effector- and central-memory Treg-cells with differential expression of Klf2 and memory and activation markers. TCF-1 deficiency did not change the core Treg transcriptional signature, but promoted alternative signaling pathways whereby Treg-cells became activated and gained gut-homing and TH17 characteristics. TCF-1-deficient Treg-cells strongly suppressed T-cell proliferation and cytotoxicity, but were compromised in controlling CD4+ T-cell polarization and inflammation. In mice with polyposis, Treg cell-specific TCF-1 deficiency promoted tumor growth. Consistently, tumor-infiltrating Treg cells of colorectal cancer patients showed lower TCF-1 expression and increased TH17 expression signatures compared to adjacent normal tissue and circulating T-cells. Thus, Treg cell-specific TCF-1 expression differentially regulates TH17-mediated inflammation and T-cell cytotoxicity, and can determine colorectal cancer outcome.
Introduction
Treg-cells are a heterogenous population of thymic and extrathymic origins with diverse immune suppressive functions. Expression of the lineage-determining transcription factor FOXP3 is essential for maintaining Treg identity 1, 2, 3, but is not sufficient to account for the substantial functional diversity of Treg-cells4. In addition to FOXP3, Treg-cells can express other transcription factors that are normally associated with T-helper cell functions, namely RORγT, GATA3, or TBET. More than half of gut-infiltrating Treg-cells in healthy mice express RORγT. RORγT+ Treg-cells are generated from naïve conventional CD4+ T-cells (Tconv) upon stimulation by bacterial antigens, and suppress pathobiont induced inflammation in an IL-10 dependent manner 5. GATA3-expressing Treg-cells express Ikzf2/HELIOS and IL1Rl1/ST2/IL33-receptor and expand in response to IL-33 6. These are mainly of thymic origin, although a subset that potentially originates from Tconv cells can convert to RORγT+ Treg-cells7. Both RORγT- and GATA3-expressing Treg-cells accumulate in colon tumors, and have T-cell suppressive and tumor-promoting properties 8, 9. Single-cell RNA-sequencing (scRNAseq) studies of mouse and human cells have identified transcriptionally distinct subpopulations (clusters) of effector-Treg cells (eTreg) and central-memory-Treg cells (cTreg) 7, 10. However, the molecular underpinning of Treg responses and adaptations at the single cell level to their environment is still poorly understood.
In contrast to healthy mice, expansion of RORγT+ Treg-cells in human colorectal cancer (CRC) coincides with increased colon inflammation 9, 11. In mouse models of polyposis Treg-specific ablation of RORγT attenuates inflammation and tumor growth 9. Furthermore, the adoptive transfer of Treg-cells from healthy but not from tumor bearing mice to polyposis prone mice hinders polyposis 12. We found that Treg-cells in CRC patients and mice with polyposis express elevated levels of β-catenin, which epigenetically programs the cells to become proinflammatory 13, 14. Our findings were corroborated by an independent report of elevated expression of β-catenin by pro-inflammatory Treg-cells in multiple sclerosis 15. These findings indicate cancer related changes in Treg functions.
TCF-1 is the T-cell specific DNA binding partner of β-catenin 16. Germline TCF-1 deficiency induces premature expression of FOXP3 in double-positive thymocytes 17 and expands thymic Treg cells 18, suggesting a role in Treg specification. We and others have shown that TCF-1 and FOXP3 co-bind to overlapping regulatory sites of pro-inflammatory pathway genes 14, 19, 20 and repress the MAF-RORγt-IL-17 axis 14, 21. Here, we report that in the absence of TCF-1 FOXP3 fails to control these genes and Treg-cells gain promoinflammatory and tumor promoting properties similar to the Treg cells that expand in human CRC and mouse polyposis. Moreover, TCF-1 is downregulated in CRC-tumor-infiltrating Treg-cells. Therefore, TCF-1 differentially controls independent Treg functions that are deregulated in CRC and contribute to tumor growth.
Results
TCF-1 negatively regulates gene expression in Treg-cells
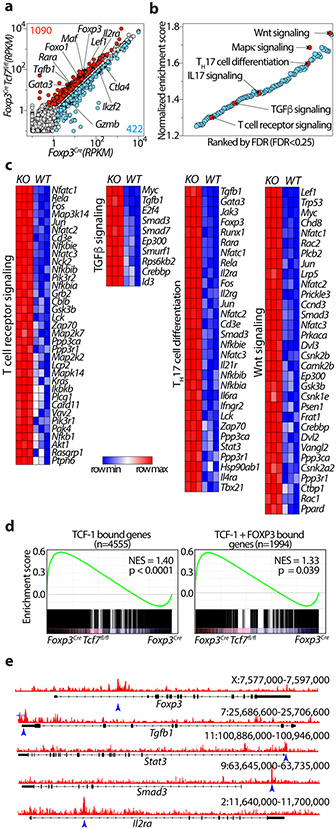
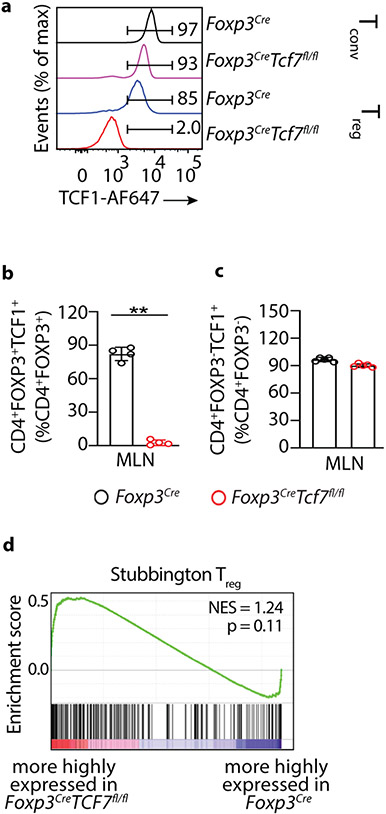
To understand how TCF-1 regulates Treg properties, we generated mice homozygous for the floxed exon4 Tcf7 22 and the Foxp3Cre alleles 23 (Foxp3CreTcf7fl/fl). FACS analysis of mesenteric lymph node cells (MLNs) confirmed loss of TCF-1 in Treg but not CD4+ Tconv cells (Extended Data Fig.1a,b,c). Bulk RNAseq analysis revealed that deletion of Tcf7 upregulated 1,090 genes (fold change >1.5 and FDR < 0.001), which included the core Treg signature genes IL2ra, Foxp3, Foxo1, Tgfb1, Lef1, Rara, and Gata3, and downregulated 422 genes including Ctla4, Ikzf2/HELIOS, and Gzmb (Fig. 1a). To identify pathways affected, we performed gene set enrichment analysis (GSEA) on all Kegg pathways comparing transcriptomes of Treg-cells from Foxp3CreTcf7fl/fl to control Foxp3Cre mice (FDR<0.25; Fig. 1b, Supplementary Table1). The analysis indicated that the TCF-1-deficient Treg-cells preserved the core Treg signature genes (Extended Data Fig.1d), but were enriched in Wnt, MAPK, IL-17, TGFβ, T-cell receptor (TCR) signaling, and TH17 differentiation pathways (Fig. 1b). The enhanced Wnt signature could result from reversal of TCF-1 inhibition of transcription 16 . The most significantly enriched genes within the leading edge for WNT signaling included Lef1, Lrp5, Gsk3b, Csnk1e, Csnk2a2, Ep300, and Rac1; TH17 differentiation genes included Tgfb1, IL6ra, Rara, Stat3, Ifngr2, Gata3, and Tbx21 as well as genes downstream of the TCR; TGFβ signaling genes included Tgfb1, Smad3, Smad7, and Myc; TCR signaling genes included Nfatc1, 2, 3, Rela, Fos, Jun, PIk3r1, Akt1, Nfkb1, Kras, and Plcg1 (Fig. 1c). Earlier identified TCF-1 bound as well as TCF-1 and FOXP3 co-bound genes 14 were highly upregulated in TCF-1-deficient Treg-cells (Fig. 1d), suggesting dominant regulation by TCF-1. Altered gene expression coincided with opening of chromatin at gene regulatory sites, as determined by ChiP-seq, with key examples being Tgfb1, Stat3, Smad3 and Il2ra (Fig. 1e). Collectively, our data show that TCF-1 has a dominant role in its’ cooperates with FOXP3 to negatively regulate the activation and functional polarization of Treg-cells.
Figure 1: TCF-1 deficiency selectively reprograms Treg-cells without compromising their core signature.
(a) Scatter plot comparing the expression of genes in TCF-1-deficient (Foxp3CreTcf7fl/fl) and TCF-1-sufficient (Foxp3Cre) Treg-cells. Reads Per Kilobase of transcript, per Million mapped reads (RPKM) expression values are average of three biological replicates. Significantly up- or downregulated genes (fold change >1.5 and FDR < 0.001) are shown in red or blue with exact numbers shown at the top or bottom corner, respectively. (b) Significantly enriched Kegg pathways by gene set enrichment analysis (GSEA) induced in transcriptomes of TCF-1-deficient versus sufficient Treg-cells. Normalized enrichment scores of all enriched Kegg pathways (FDR< 25%) are shown. Select pathways are highlighted. See TableS1 for the full list. (c) The expression of all leading-edge genes from four indicated pathways. See TableS1 for the raw expression levels of all genes. (d) GSEA plots showing the enrichment of genes expressed more highly in TCF-1-deficient (Tcf7fl/fl Foxp3Cre) versus TCF-1-sufficient (Foxp3Cre) Treg-cells for genes that are bound by TCF-1 (upper panel) or co-bound by TCF-1 and FOXP3 (lower panel). (e) TCF-1 ChIP-seq tracks in mouse Treg-cells showing the Foxp3, Tgfb1, Stat3, Smad3 and Il2ra gene loci. For simplicity, the input control signal is subtracted from visualized tracks using IGV tools. Detected TCF-1 bound sites against the input control are indicated with blue arrow. Data in d-e are from GSE139960.
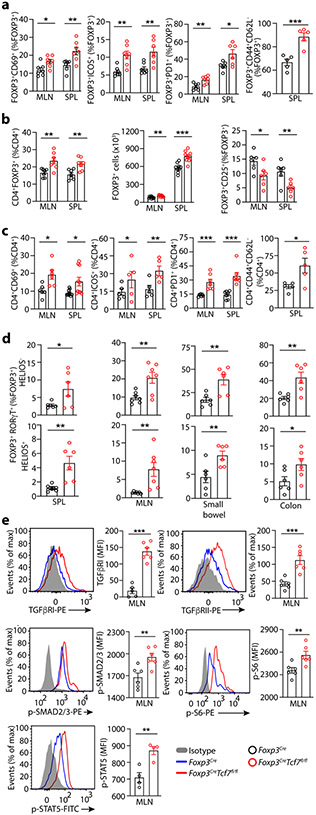
Using FACS analysis we validated changes in expression of cell surface proteins that mark T-cell activation, CD69, ICOS, PD1, and CD44, and CD62L (Fig. 2a; Extended Data Fig.2a,b,c,h). Loss of TCF-1 increased the Treg to CD4+ T-cell ratios and the frequency as well as absolute numbers of Treg-cells in secondary lymphoid organs (Fig. 2b; Extended Data Fig.2e), but reduced the cell-surface expression of CD25 (Fig. 2b; Extended Data Fig.2f). We confirmed earler reports of activation of Tconv cells, marked by changes CD69, ICOS, PD1, and CD44 20 (Fig. 2c; Extended Data Fig.2a,b,c,d). The TCF-1 deficient Treg-cells expressed higher levels of RORγT, TGFβRI, TGFβRII, and p-SMAD2/3 (Fig. 2d,e; Extended Data Fig.2g), p-STAT5 and p-S6 (a downstream target of mTORC1 that is highly active in Treg cells 24) (Fig. 2e). Collectively, these results show that TCF-1 deficiency enhances the activation and expression of core Treg signature genes causing the systemic expansion of RORγT+ Treg-cells.
Figure 2: Cumulative data from FACS analysis shows activation and expansion of Treg-cells and CD4+ Tconv-cells in TCF-1 deficient mice.
Treg-cells and CD4+ Teff-cells from 5.5-month-old Foxp3CreTcf7fl/fl mice and control Foxp3Cre mice were analyzed by FACS. (a) Frequency of CD4+Foxp3+ Treg-cells expressing CD69 (MLN: n = 7, p < 0.01 & SPL: n = 7, p < 0.006), ICOS (MLN: n = 7, p < 0.002 & SPL: n = 7, p < 0.004), PD-1 (MLN: n = 6, p < 0.006 & SPL: n = 6, p < 0.02), and CD44 and CD62L (SPL: n = 5, p < 0.001) (b) Frequencies of Treg-cells (MLN: n = 7, p < 0.005 & SPL: n = 7, p < 0.004), and absolute numbers of Treg-cells (MLN: n = 9, p < 0.003 & SPL: n = 7, p < 0.0002), and their expression of CD25 (MLN: n = 6, p < 0.03 & SPL: n = 6, p < 0.009). (c) Frequencies of conventional CD4+ T-cells expressing CD69 (MLN: n = 6, p < 0.01 & SPL: n = 10, p < 0.01), PD-1 (MLN: n = 7, p < 0.0008 & SPL: n = 7, p < 0.0004), ICOS(MLN: n = 6, p < 0.01 & SPL: n = 6, p < 0.002), and CD44 and CD62L (SPL: n = 5, p < 0.02). (d) The frequencies of HELIOS− or HELIOS+FOXP3+RORγT+ Treg-cells, in the spleen (n = 6, p < 0.04 or p < 0.004), MLN (n = 7, p < 0.005), small bowel (n = 6, p < 0.006 or p < 0.01), and colon (n = 6, p < 0.006 or p < 0.04). (a, b, c & d) Data are representative of two or more independent experiments. (e) Representative FACS histograms normalized to mode (left) and bar diagrams of cumulative data for expression of TGFβRI (n = 6, p < 0.0001), TGFβRII (n = 6, p < 0.0008), p-SMAD2/3 (n = 6, p < 0.006), p-S6 (n = 6, p < 0.009), and p-STAT5 (n = 5, p < 0.005) by Treg-cells. Data are representative of three independent experiments. In all experiments n represents biologically independent animals; means ± SEM, two-sided unpaired t-test.
Molecularly distinct clusters of Treg-cells
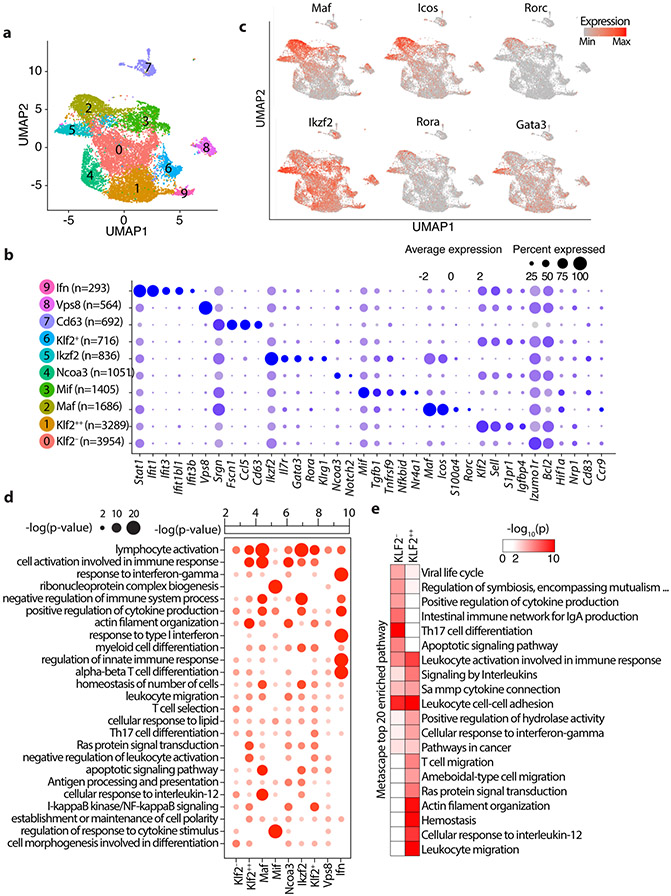
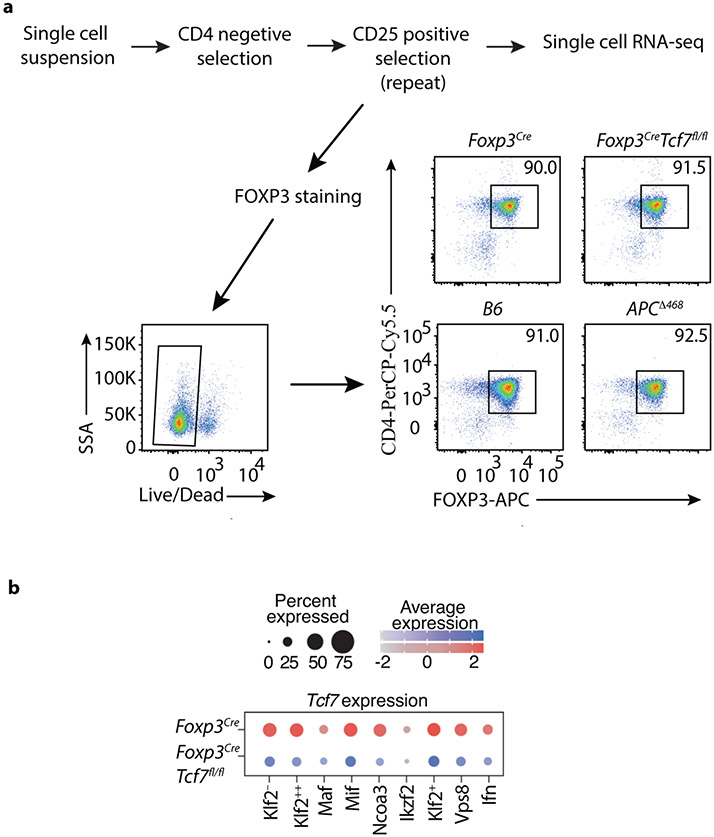
To understand how TCF-1 regulates Treg gene expression and heterogeneity, we performed scRNAseq of purified mesenteric lymph node Treg-cells using the 10xGenomics platform (Extended Data Fig.3a) in four types of mice: Foxp3CreTcf7fl/fl, Foxp3Cre, the polyposis prone APCΔ468, and WT C57BL/6J (B6) mice. An unbiased integrative analysis across all four genotypes after regression for potential artifacts using the Seurat platform (see Methods) resulted in 14,487 cells grouped into 10 major subpopulations on UMAP projection (Fig. 3a, Supplementary Table2; see Materials and Methods). These subpopulations were annotated according to the most salient identified cell markers (Fig. 3b). As expected, the exon-4 deleted Tcf7 transcripts were still detected across the Treg clusters, although less intensely as compared to the WT Tcf7 transcript in control Foxp3Cre Treg-cells (Extended Data Fig.3b).
Figure 3: Single cell transcriptomics delineates distinct Treg subpopulations in the mesenteric lymph nodes.
(a) Integrated UMAP showing 10 major Treg cell types isolated from the MLNs of mice used in this study. (b) Expression of cell-defining features across all cell types. Color intensity is proportional to the average of gene expression across cells in the indicated clusters. The size of circles is proportional to percentage of cells expressing indicated genes. (c) mRNA expression of select indicated genes projected on the UMAP, focusing on features of the Maf and Ikzf2 Treg clusters. (d) Significantly enriched pathways by Metascape based on top 200 genes upregulated in indicated cell type compared to all other cell types. See TableS2 for the full list. (e) 20 most significantly enriched pathways by Metascape based on genes upregulated in Klf2− or Klf2++ cell types compared directly to Klf2++ or Klf2− cell types, respectively.
We identified two eTreg clusters with activated/effector characteristics, and low expression of Kruppel-like Factor 2 (Klf2). These were annotated as Maf and Ikzf2 based on their high expression of the corresponding genes. The Maf cluster had the highest expression of Rorc, Icos, and S100a4 (Fig. 3b,c). cMAF is essential for the generation of RORγT+ Treg-cells and IgA response 25, and is negatively regulated by TCF-1 21. Expression of Rorc/RORγT by Treg-cells is bacterial dependent 7, suggesting that the Maf cluster represents peripherally induced Treg-cells. The Ikzf2 cluster had the highest expression of IL7r, Rora, and Gata3, and Klrg1, and the second highest expression of Maf and Icos (Fig. 3b,c). Ikzf2 encodes for HELIOS a member of the IKAROS transcription factor family that regulates several Treg suppressive functions 26, and is preferentially but not exclusively expressed by thymus-derived naïve/cTreg-cells 27. This cluster prominently expressed Gata3 and its downstream target gene St2 that encodes a subunit of the IL33-receptor. Thymus-derived Treg-cells, constitute a significant proportion of the GATA3+ St2 expressing colonic Treg-cells 6, supporting the thymic origin of the Ikzf2 cluster. These two clusters were earlier described as the RORγT+ and the HELIOS+ subsets in mice 7, or as nonlymphoid T-cell like (nLT) Treg-cells in mice and pTreg-cells in humans 10.
The Mif (macrophage migration inhibitory factor) cluster had high expression of Tgfb1, Tnfrsf9/4-1bb, Nfkbid, and Nr4a1 (Fig. 3b and Extended Data Fig.4). It also expressed Maf, Icos, and Ikzf2 but less than the Maf and Ikzf2 clusters (Fig. 3b,c). Nr4a1/NUR77 is an immediate-early activation gene downstream of the TCR that induces expression of Tnfrsf9 and Ikzf2 28. High expression of these genes together with Tgfb1 are characteristics of early TGFβ induced extrathymic Treg cells. Expression of Hif1a, a downstream target of β-catenin, was highest in the Mif and Maf clusters, suggesting TCR signaling 29 and a potential link between β-catenin signaling and activation of the Maf/RORγT axis 13, 14.
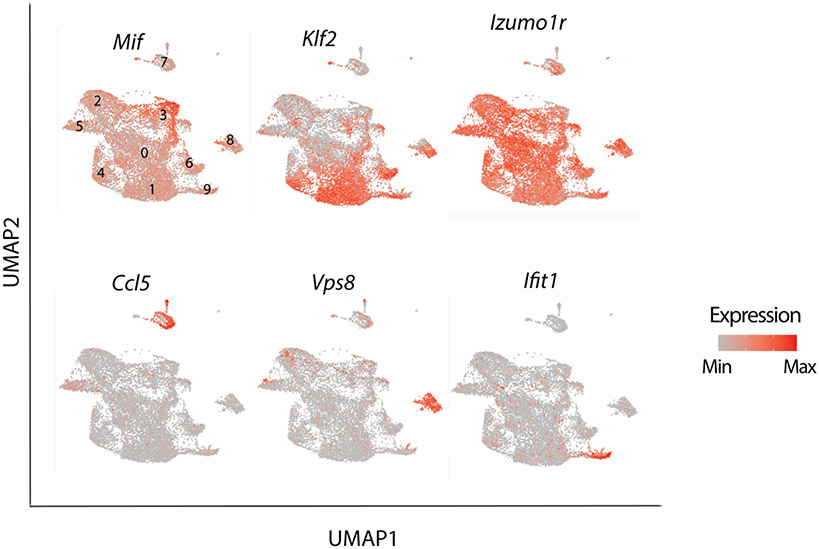
The remaining clusters expressed naïve/central-memory genes that identify the cTreg 10, and varying levels of Klf2 (Fig. 3b and Extended Data Fig.4) a nuclear factor that regulates migration of Treg-cells 30. The Klf2++ cluster which had the highest expression of markers of early thymic emigrants (ETE) and homing to secondary lymphoid organs 30, including Klf2, S1pr1 and Igfbp4 (Fig. 3b and Extended Data Fig.4). The Klf2− and Ncoa3 clusters had the lowest expression of these markers, suggesting that they contain more mature cells. The Ncoa3 cluster was outstanding in strong expression of Ncoa3 (Fig. 3b), a nuclear co-activator and partner of arylhydrocarbone receptor 31, and high expression of Notch2. Three other cTreg clusters, the Klf2+, Ifn and Vsp8, expressed intermediate levels of ETE markers, and were together isolated from the main cluster pool (Fig. 3a,b). The Ifn cluster was conspicuous by its expression of multiple interferon response genes including Stat1, Ifit1, Ifit3, Ifit1bl1, and Ifit3b (Fig. 3b; Extended Data Fig.4). The Vsp8 cluster expressed Klf2 and Izumo1r, markers of cTreg-cells 32, but was unique in strong expression of Vps8 a subunit of the CORVET complex that is involved in the formation of exosomes 33 (Fig. 3b; Extended Data Fig.4). The Cd63 cluster, had poor expression of Klf2 and Izumo1r (FOLR4), expressed Ccl5 and was distant to the other clusters (Fig. 3a,b and Extended Data Fig.4), hence it likely is not a Treg cluster. Overall, expression of Klf2 and ETE versus activation markers separated the Treg clusters into different stages of maturation.
To better define the Treg clusters, we performed gene ontology pathway analysis on the upregulated genes. The Maf and Ikzf2 clusters highlighted pathways that indicate terminal differentiation, such as lymphocyte activation, immune response, negative regulation of immune system process, positive regulation of cytokine production, and high apoptotic signaling. By contrast, the Mif cluster displayed regulation of response to cytokine stimulus but no other function, consistent an intermediate stage of Treg specification/maturation (Fig. 3d). Since Klf2++ and Klf2− were the two largest Treg clusters with the most extreme difference in Klf2 expression among the cTreg-cells (Fig. 3a,b), we directly compared them using Metascape and identified the 20 most enriched pathways. The Klf2++ cluster was enriched for T-cell migration and leukocyte cell-cell adhesion pathways, consistent with being less mature (Fig. 3e), while the Klf2− cluster was enriched for TH17 cell differentiation, IgA production, and cytokine production (Fig. 3e), indicating a more mature state. Thus, expression of Klf2 appears to correlated with the stage of maturity of Treg-cells.
TCF-1 regulates distinct Treg functions
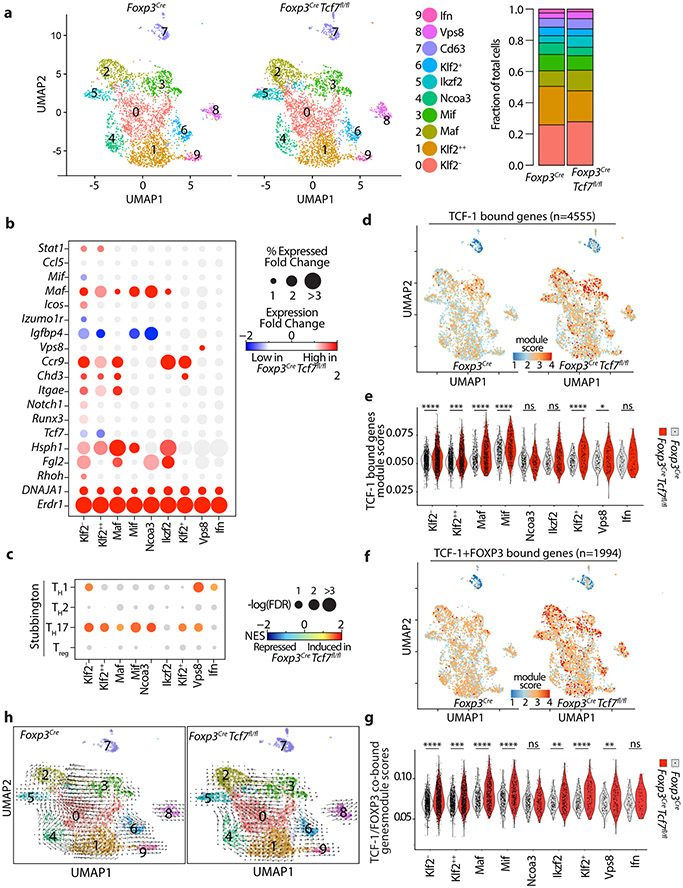
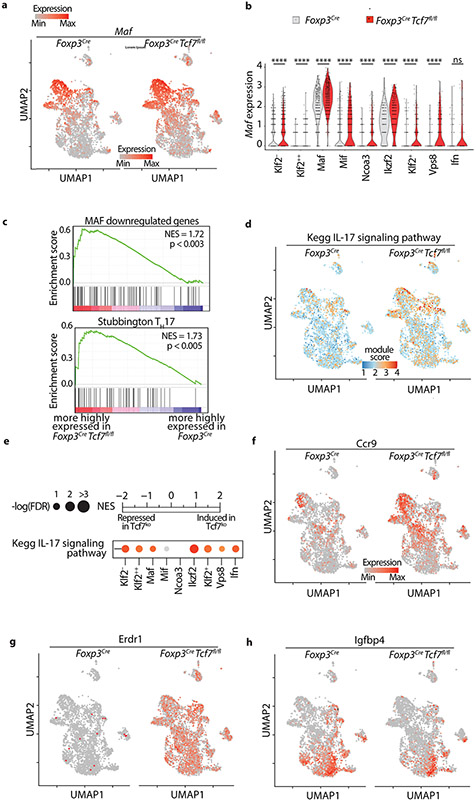
To better understand the contribution of TCF-1 to Treg identity and function, we made side by side comparison of the scRNAseq data from Foxp3CreTcf7fl/fl and control Foxp3Cre mice. Loss of TCF-1 did not alter the spatial distribution or the number of Treg clusters (Fig. 4a, left panel), but did suggest a possible increase in the frequency of cells in the Maf and Ikzf2 Treg clusters relative to the less differentiated clusters (Fig. 4a, right panel). There were significant changes in the expression of Maf, Ccr1, and Hsph1 across Treg clusters with the notable common exception of the Ifn cluster (Fig. 4b; Extended Data Fig. 5a,b; Supplementary Table 3). Accordingly, we found across the Treg clusters changes in expression of MAF target genes and TH17 pathway genes (Extended Data Fig.5c), and corresponding increases in the TH17 signaling pathway as revealed by GSEA against the Stubbington (Fig. 4c) or the Kegg genesets (Extended Data Fig.5d,e).
Figure 4: TCF-1-deficient and sufficient Treg-cells show distinct effector functions.
(a) UMAP projection (left) and fraction of cells in each cell type (stackbars; right panel) for TCF-1-sufficient (Foxp3Cre) and TCF-1-deficient (Foxp3CreTcf7fl/fl) Treg-cells. Data are from two replicates. (b) Expression changes of the most differentially expressed genes between TCF-1-deficient and sufficient Treg-cells. See TableS3 for the full list. The fold change in expression intensities is color-coded. The fold change in percent of cells expressing the indicated gene in each cell type is proportional to the circle size. (c) GSEA analysis for the indicated gene lists comparing transcriptomes of TCF-1-sufficient and TCF-1-deficient Treg-cells across all cell types. Normalized enrichment scores (NES) are color coded. −log10 (FDR) values are proportional to the circle size. FDR>15% are masked with gray color. (d) The UMAP projection of module scores for relative expression of TCF-1 bound genes, (e) related violin plots. (f) The UMAP projection of module scores for relative expression of TCF-1 and FOXP3 co-bound genes, (g) related violin plots. (h) UMAP and extrapolated future state of cells (overlaid arrows) based on RNA velocity for TCF-1-sufficient (Foxp3Cre) and TCF-1-deficient (Foxp3Cre Tcf7fl/fl) Treg-cells. * p < 0.05, *** p < 0.001, **** p<0.0001 by one-sided (e) or two-sided(g) Wilcoxon test.
The Maf, Ikzf2, Klf2−, and Mif clusters had the strongest upregulation of Ccr9, a gut homing marker (Fig. 4b; Extended Data Fig.5f). The Maf and Ikzf2 had the strongest increase in expression of Hsph1 (Fig. 4b), a Treg activation marker 34. The Maf cluster also had the strongest increase in expression of the gut-associated integrin Itgae/CD103/αE-integrin (Fig. 4b), and together with the Ikzf2 cluster the strongest increase in expression of Fibrinogen-like-protein-2 (Fgl2) 35, a downstream target of TIGIT (Fig. 4b). All TCF-1-deficient clusters had uniformly increased expression of Dnaja1, which encodes a heat shock protein co-chaperone 36 (Fig. 4b), and Erdr1, which encodes a bacteria-sensitive secreted apoptotic factor 37 (Extended Data Fig.5g), but downregulated Igfbp4, an inhibitor of insulin-like growth factor receptor signalling 38 (Fig. 4b and Extended Data Fig.5h). The Ifn cluster was the only cluster that did not show significant changes with loss of TCF-1 (Fig. 4b and Extended Data Fig.5b). The Vps8 cluster was unique in having high TH1 as well as TH17 signatures (Fig. 4c), raising speculation that this cluster may be precursor to pathogenic TH17 cells, which co-express TH1 and TH17 cytokines 39. These results highlight enhanced Treg activation, gut homing, and TH17 polarization with the loss of TCF-1.
Next, we determined how loss of TCF-1 affects the expression of genes that normally bind TCF-1, by integrating earlier generated ChIPseq analysis data 14. Overall these genes were upregulated with the loss of TCF-1, indicating negative regulation of gene expression by TCF-1; exception were the Ikzf2, Ncoa3, and Ifn clusters that remained unchanged (Fig. 4d,e). Importantly, expression of TCF-1 and FOXP3 co-bound genes also increased upon loss of TCF-1 (Fig. 4f,g). indicating that TCF-1 cooperates with FOXP3 to suppresses gene expression. Collectively these findings are consistent with TCF-1 functioning as a dominant regulator of FOXP3 in suppressing expression of Treg genes involved in TH17 signaling, gut homing, and bacterial response.
To better understand the inter-cluster relations of Treg-cells, we overlaid RNA velocity vectors on the UMAP projection. RNA velocity uses scRNAseq data of unspliced and spliced mRNAs to predict future states of transcriptionally distinct clusters of cells 40. Maf and Ikzf2 were identified as terminally differentiated Treg clusters, which derived from less mature clusters . While the Mif cluster exclusively gave rise to the Maf cluster, the Klf2− and Ncoa3 were immediate precursors to Ikzf2 (Fig. 4h). There was also some indication for interconversion of Ilzf2 to Maf, in agreement with an earlier report that HELIOS+ Treg-cells can be induced to express RORγT 7. The Ifn, Vps8 and Klf2+ clusters were isolated and less related to the other clusters, encouraging speculations that they may be intermediates to alternative fates, perhap effector T-cells. In total, the velocity analysis revealed stages of Treg specification and maturation, as well as potential differentiation to non-Treg-cells.
Polyposis causes activation and polarization of Treg-cells
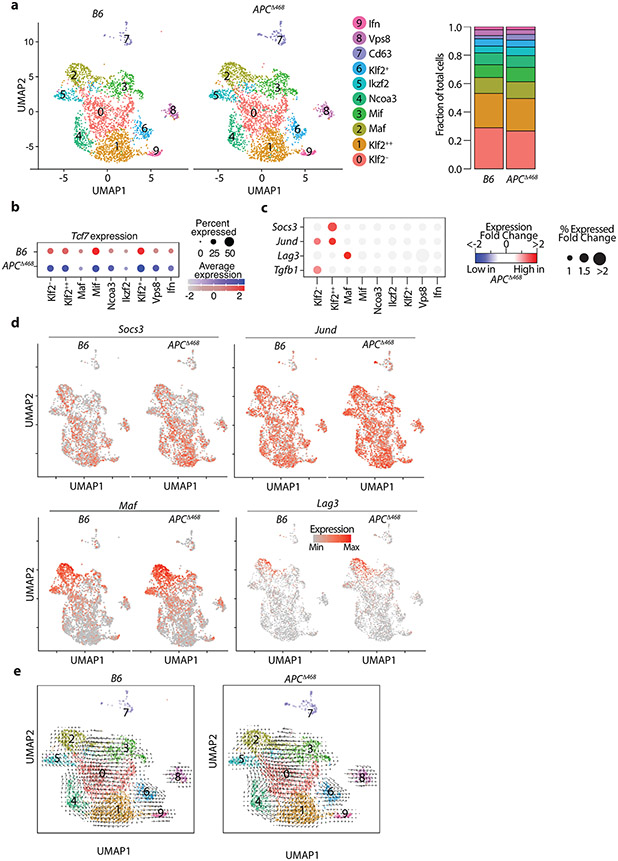
We next performed scRNAseq analysis of Treg-cells from the MLNs of WT and polyposis ridden APCΔ468 mice. Distribution and numbers of Treg clusters were similar to the Foxp3CreTcf7fl/fl and Foxp3Cre mice (Extended Data Fig.6a; Supplementary Table4). In both mice, expression of Tcf7 was lower in the terminally differentiated Maf and Ikzf2 eTreg clusters as compared with the less matured cTreg clusters (Extended Data Fig.6b). Comparison of gene expression between WT and APCΔ468 Treg-cells revealed upregulation of Socs3, JunD, Lag3, and Tgfb1 during polyposis (Extended Data Fig.6c,d). SOCS3 regulates IL-23-mediated STAT3 phosphorylation and polarization of CD4+ T-cells to the TH17 lineage 41. JunD, encodes an AP1 transcription factor that is activated downstream of the TCR 42. LAG3 mediates immune suppression by Treg cells 43. Velocity analysis revealed conserved intercluster relations (Extended Data Fig.6e). Collectively, these transcriptional changes are consistent with the activation and TH17 polarization of Treg cells during polyposis.
TCF-1 regulates Treg-cell suppression of CD8+ T-cells
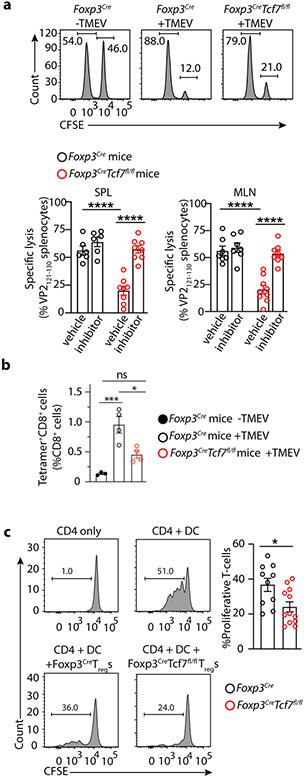
We next related our molecular data to Treg function. Earlier we and others had reported that Treg suppression of CD8+ T-cell cytotoxicity is TGFβR dependent 44, 45, 46. Given their activated expression profile, preservation of the core Treg signature, and the enhanced TGFβ signature, we predicted that TCF-1-deficient Treg-cells would efficiently suppress CD8+ T-cells. To test this, we compared CD8 cytotoxic responses of Foxp3CreTcf7fl/fl and Foxp3Cre mice to acute infection with Theiler’s murine encephalomyelitis virus (TMEV), using an in vivo kill assay. In an earlier study we described an immunodominant virus-specific CD8+ T-cell response to the viral VP2121-130 peptide that peaks on day 7 post infection47. We quantified this activity by adoptive transfer of an equal mix of TMEV-VP2121-130 peptide pulsed and unpulsed splenocytes, at the peak of response to viral infection. Lysis of the peptide pulsed cells was significantly less effective in the Foxp3CreTcf7fl/fl than the Foxp3Cre mice (~21% versus ~56% converted, p< 0.0001 Student’s t-test) and treatment of mice with LY3200882 abrogated this difference (Fig. 5a). Using tetramers we found that infection of Foxp3Cre mice triggered a nearly 14-fold expansion of VP2121-130-specific CD8+ T-cells in the spleen, from 0.07% to almost 1% (p=0.004) of total CD8+ T-cells at the peak of response to TMEV. This expansion was reduced in the Foxp3CreTcf7fl/fl mice to the level of baseline uninfected Foxp3Cre mice (Fig. 5b). To independently validate this inhibition, we performed in vitro proliferation inhibition assays. FACS purified CD4+CD25+YFP+ Treg-cells were cocultured with an equal number of naïve CD4+CD25−CD62LhiCD44lo T-cells and then stimulated with allogeneic BALB/c CD11c+ dendritic cells (DC) and αCD3. The TCF-1-deficient Treg-cells exhibited stronger suppressive activity than TCF-1-sufficient Treg cells (p<0.05; Student’s t-test) (Fig. 5c). Together, our data show that TCF-1 deficiency augments the ability of Treg-cells to suppress CD8+ T-cell cytotoxicity and T-cell proliferation.
Figure 5: TCF-1-deficient Treg-cells suppress viral antigen specific CD8+ T-cell cytotoxicity and T-cell proliferation.
Foxp3CreTcf7fl/fl and control Foxp3Cre mice at 7-8 weeks of age were compared for their anti-viral T-cell response. (a) Representative FACS histograms and cumulative data of viral antigen specific lysis of VP2121-130 specific pulsed splenocytes after adoptive transfer in the indicated mice. An equal mix of TMEV-VP2121-130 peptide pulsed and unpulsed splenocytes were labelled with different concentrations of CFSE and adoptive transferred to the indicated mice seven days after infection of the mice with TMEV at the peak of response to viral infection. Antigen specific lysis of the splenotyces was measured in the MLN (Foxp3Cre: n = 6, not significant; Foxp3CreTcf7fl/fl: n = 8, p < 0.0001) and spleen (Foxp3Cre: n = 6, not significant; Foxp3CreTcf7fl/fl: n = 8, p < 0.0001), four hours after transfer, and calculated after normalizing for nonspecific death of splenocytes transferred in naïve uninfected mice. Data are representative of two or more independent experiments. To block Treg suppression of CD8 T-cells, we treated a separate set of mice from the day of infection with a small molecule inhibitor of TGFβR1 (LY3200882, Eli Lilly), and compared with vehicle control. (b) Cumulative data of tetramer FACS analysis of VP2121-130 specific CD8+ T-cells in the spleen (Foxp3Cre −TMEV: n = 3, p < 0.003 & p < 0.007; Foxp3Cre +TMEV: n = 4, p < 0.01; Foxp3CreTcf7fl/fl +TMEV: n = 4) of mice at the peak of response to TMEV, on day 7 post viral infection. (c) Representative FACS histograms and cumulative data of Treg inhibition of CD4+ T-cell proliferation. Percent of proliferating cells in the in vitro assays are shown. FACS sorted CD4+CD25− cells from the spleen of C57B/6 mice were labelled with CFSE and incubated alone or with irradiated allogenic BALB/c dendritic cells (DC) and αCD3, with or without equal numbers of purified Treg-cells from the indicated mice. Dilution of CFSE by CD4 gated cells was measure after 3 days. Data are representative of three independent experiments with (Foxp3Cre: n =5 & Foxp3CreTcf7fl/fl: n = 6; p < 0.01). In all experiments n represents biologically independent animals; means ± SEM, two-sided, unpaired t-test.
TCF-1 regulates Treg suppression of inflammation
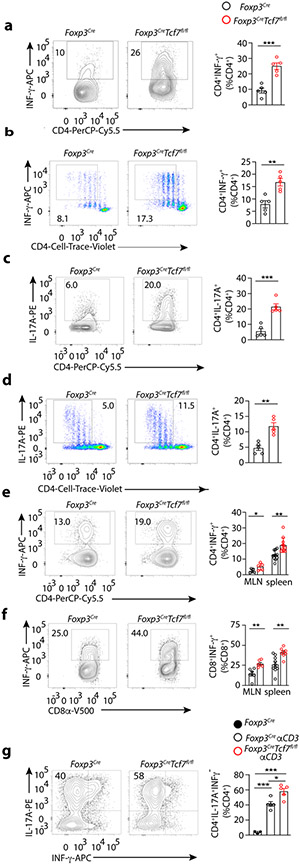
Inflammation requires CD4+ T-cell help. Therefore we compared TCF-1-deficient and sufficient Treg cells for their ability to suppress polarization of naïve CD4+ T-cells to TH1 or TH17 lineage. For the in vitro assays, spleen CD4+ lymphocytes containing both Tconv and Treg-cells were purified from Foxp3CreTcf7fl/fl and control Foxp3Cre mice, stimulated with αCD3 and αCD28 under TH1 or TH17 polarization conditions for four days. The TH1 polarized T-cells from Foxp3CreTcf7fl/fl mice expressed significantly more IFNγ than the T-cells from Foxp3Cre mice (~25% versus ~9% converted, p<0.0004 ) (Fig. 6a). To standardize the CD4+ T-cell to Treg ratios, we repeated the assay using sorted CD4+CD25−CD62LhiCD44lo naïve T-cells from WT CD45.1 mice mixed at equal ratio with CD25+YFP+ Treg-cells from Foxp3CreTcf7fl/fl or control Foxp3Cre mice. TCF-1-deficient Treg-cells were consistently less effective in suppressing CD4+ T-cell polarization to TH1 (Fig. 6b) (~16% versus ~8% converted, p < 0.002). Similarly, the TH17 polarized T-cells from Foxp3CreTcf7fl/fl mice expressed significantly more IL-17A than the T-cells from Foxp3Cre mice (Fig. 6c) (~20% versus ~5% converted, p< 0.0003), and this was confirmed when equal numbers of purified Tconv and Treg-cells were mixed (Fig. 6d) (~11% versus ~5% converted, p < 0.001). Thus, TCF-1 deficiency compromised the ability of Treg-cells to suppress pro-inflammatory TH cell polarization, to TH1 or TH17.
Figure 6: TCF-1-deficient Treg-cells fail to suppress TH1 or TH17 polarization of CD4+ Tconv cells.
Foxp3CreTcf7fl/fl and control Foxp3Cre mice at 5 months of age were assayed for efficiency of CD4 T-cell polarization, using in vitro and in vivo assays. Representative FACS contour-plots (left) and cumulative histogram plots (right) are shown. (a) TH1 polarization in vitro, using total CD4+ splenocytes from the indicated mice. Magnetically purified CD4+ splenocytes containing both Tconv and Treg-cells from the indicated mice were stimulated in vitro under TH1 polarization conditions for 4 days and stained for CD4 and intracellular IFNγ (n = 5, p < 0.0004). (b) TH1 polarization in vitro, with equal numbers of CD4+ Treg-cells and CD4+ Tconv cells of the indicated mice. FACS purified CD62L+CD44−CD25−CD45.1+CD4+ cells from spleen were labelled with Cell Trace Violet, mixed 1:1 with YFP+CD45.2+CD4+CD25+ spleen Treg-cells, and stimulated under TH1 polarization conditions and assayed by FACS. IFNγ expression gated on CD45.1+ cells (n = 5, p < 0.002). (c) TH17 polarization in vitro, using total CD4+ splenocytes from the indicated mice. CD4+ splenocytes were purified and assayed as in “a”, and were stained for CD4 and intracellular IL-17A (n = 5, p < 0.0003; means ± SEM; two-sided, unpaired t-test). (d) TH17 polarization in vitro, with equal numbers of Treg-cells and CD4+ Tconv cells of the indicated mice. Cells were purified and mixed and analyzed by FACS as in “b”, for expression of intracellular IL-17A (n = 5, p < 0.001). (e) Quantitation of in vivo TH1 response to infection with TMEV. The indicated mice were assessed by FACS on day 7 post infection for expression of IFNγ by MLN (n = 5, p < 0.04) and spleen (n = 11, p < 0.001) derived CD4+ T-cells. (f) The same for CD8+ T-cells (MLN: n = 4, p < 0.04; spleen: Foxp3Cre: n = 6 & Foxp3CreTcf7fl/fl: n = 4; p < 0.003). (g) Quantitation of in vivo TH17 response after IP injection of αCD3. The indicated mice were assessed by FACS after 3 consecutive injections with antibody (see Materials and Methods) for expression of IL-17A by small bowel residing CD4+ T-cells (Foxp3Cre: n = 3, p < 0.0001; Foxp3Cre αCD3: n = 5; p < 0.01; Foxp3CreTcf7fl/fl αCD3: n = 5). Data are representative of two or more independent experiments. In all experiments n represents biological replicates, independent animals; means ± SEM, two-sided, unpaired t-test)
We further validated our findings using well established conditions that elicit TH1 or TH17 immunity in vivo. Mice were infected with TMEV and after seven days mononuclear cells isolated from the spleen or MLNs were re-stimulated ex vivo with PMA/Ionomycin/Golgistop to measure intracellular IFNγ. CD4+ and CD8+ T-cells from Foxp3CreTcf7fl/fl mice expressed significantly more IFNγ than cells from Foxp3Cre mice (Fig. 6e,f) (CD4: MLN 6% versus 3%, p <0.04 & spleen 19% versus 12% p<0.001, CD8: MLN 26% versus 14% p<0.003 & spleen 41% versus 24% p<0.001). To measure TH17 polarization we followed an established protocol 48, injected the mice intraperitoneally (IP) with αCD3 and four days later quantified the expression of IL-17A by CD4+ T-cells in the small bowel by FACS. The Foxp3CreTcf7fl/fl mice generated significantly more IL-17-expressing CD4 T-cells than the control Foxp3Cre mice (p< 0.01) (Fig. 6g). Collectively, these findings indicate that TCF-1-deficient Treg-cells are compromised in suppressing TH1 and TH17 polarization in vitro and in vivo.
TCF-1-deficient Treg-cells promote tumor growth
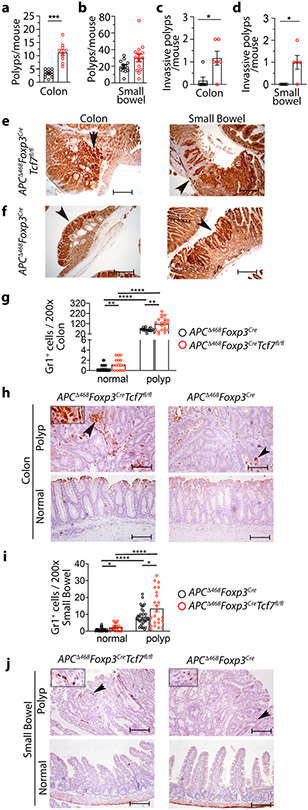
To assess the tumor-promoting properties of TCF-1-deficient Treg-cells, we crossed the polyposis-prone APCΔ468 mice 49 with Foxp3CreTcf7fl/fl or Foxp3Cre mice and aged the compound mutant mice to develop polyps. The TCF-1-deficient APCΔ468Foxp3CreTcf7fl/fl mice had significantly more colon polyps than control APCΔ468Foxp3Cre mice (12% versus 4% p<0.0001) (Fig. 7a), while tumor load in the small intestine did not change (Fig. 7b). Nuclear β-catenin staining revealed higher incidence of pre-invasive tumors in both the colon (Fig. 7c) and small bowel (Fig. 7d) of the APCΔ468Foxp3CreTcf7fl/fl mice (Fig. 7e), compared with APCΔ468Foxp3Cre mice (Fig. 7f). The APCΔ468Foxp3CreTcf7fl/fl colon tumors had high densities of Gr1+ compared to APCΔ468Foxp3Cre mice (116 per FOV versus 62 per FOV ; p< 0.0001) (Fig. 7g,h), as did the small bowel tumors (13.5 per FOV) versus APCΔ468Foxp3Cre mice (8.5 per FOV; p< 0.02) (Fig. 7i,j). The increase in Gr1+ cells was also evident in the tumor-distant healthy tissue (colon: 1.2 versus 0.4 per FOV; p<0.009 and small bowel: 2 versus 1 per FOV; p<0.01) (Fig. 7g,h,i,j). Based on these findings we conclude that TCF-1 deficient Treg-cells have enhanced tumor promoting properties, which relates in part to their compromised suppression of inflammation.
Figure 7. TCF-1-deficient Treg-cells promote inflammation and tumor growth in polyposis-prone APCΔ468 mice.
Tumor incidence, tumor aggression, and inflammation were quantified at 5.5 months of age in APCΔ468Foxp3CreTcf7fl/fl mice and compared to control APCΔ468Foxp3Cre mice. (a and b) Polyps and tumors in the excised colon (APCΔ468Foxp3Cre: n = 12 & APCΔ468Foxp3CreTcf7fl/fl: n = 10; p < 0.0001) and small bowel (APCΔ468Foxp3Cre: n = 12 & APCΔ468Foxp3CreTcf7fl/fl: n = 14; not significant) were visualized using a dissection microscope and manually counted. (c and d) Invasive lesions in the colon (n = 6; p < 0.01) and the small bowel (n = 5; p < 0.02). For the cumulative data (a, b, c & d), each symbol represents a value from an individual mouse. Tumor aggression was evaluated by counting lesions that had extensive nuclear β-catenin staining at the submucosal boundary, as determined by IHC. Benign polyps were identified by restricted β-catenin staining at the luminal boundary of the lesions. Each symbol represents a value from an individual mouse. (e and f) Representative IHC of colon and small bowel for nuclear β-catenin; scale bar 200 μm. (g and h) Quantification of Gr1 stained cells in the colon and representative IHC stained sections; scale bar 100 μm. (i and j) Quantification of Gr1 stained cells in the small bowel and representative IHC stained sections. Arrows in “h” and “j” point to Gr1 expressing cells. Each symbol represents counts in one field of vision (FOV) at 200x (g: normal: n = 4, p < 0.009, p < 0.0001, and polyp: n = 4, p < 0.001 & i: normal: n = 4, p < 0.01, p < 0.0001, and polyp: n = 4, p < 0.02). In all experiments n represents biologically independent animals; means ± SEM; two-sided, unpaired t-test.
TCF-7 is downregulated in Treg-cells of CRC tumors
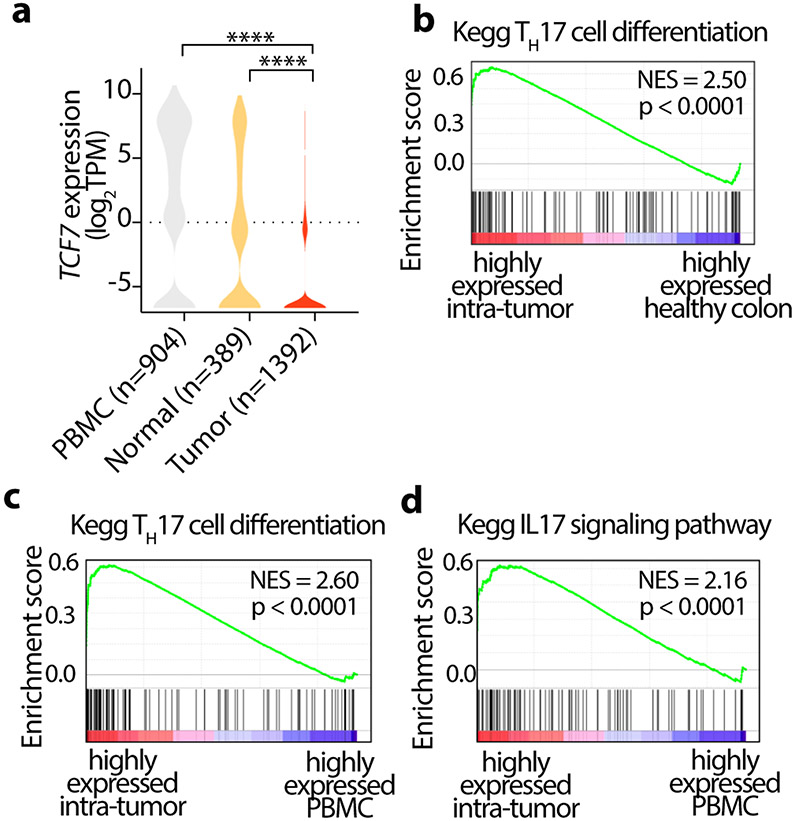
To determine the clinical relevance of our findings, we reanalyzed publicly available scRNA-seq data from 12 CRC patients 50, focusing on the Treg-cells from paired peripheral blood mononuclear cells (PBMC), tumor, and adjacent normal tissues. Tumor infiltrating Treg-cells had significantly lower expression of TCF7 compared to adjacent normal tissue and PBMC (Fig. 8a). Moreover, genes that were highly expressed in tumor infiltrating Treg-cells were enriched in Kegg TH17 differentiation and IL-17 signaling pathways (Fig. 8b,c,d). These findings are consistent with our earlier observations in CRC patients 9, 11, 51. Furthermore, they establish the relevance of our findings with TCF-1 mice harboring deficient Treg-cells to the immune pathology of CRC.
Figure 8. Tcf-7 is downregulated in CRC tumor-infiltrating Treg-cells.
Publicly available scRNA-seq data from 12 CRC patients was analyzed, focusing on the Treg-cells from paired peripheral blood mononuclear cells (PBMC), tumor, and adjacent normal tissues. (a) Violin plots showing the expression of Tcf7 in Treg-cells from peripheral blood (PBMC), adjacent normal and tumor tissues. Data is sourced from GSE108989. Number of Treg-cells in each group is indicated in parenthesis. **** p<0.0001 by one-way ANOVA test. (b-d) GSEA plots showing highly expressed genes in Treg-cells, (b) comparing TH17 cell differentiation genes in tumor infiltrating to healthy tissue infiltrating Treg-cells, (c) comparing TH17 cell differentiation genes in tumor infiltrating to PBMC Treg-cells (d) comparing IL-17 signaling pathway in tumor infiltrating to PBMC Treg-cells, as designated. NES: Normalized enrichment scores.
Discussion
We have provided evidence that TCF-1 differentially controls independent Treg suppressive mechanisms. TCF-1 deficient Treg-cells gained a “split personality” similar to Treg-cells in CRC 52, failing to suppress inflammation but becoming more active in suppressing T-cell proliferation and cytotoxicity. In a mouse model of spontaneous polyposis, these changes fueled tumor growth by promoting inflammation while blocking antigen specific CD8 T-cell responses. We demonstrated the relevance of these findings to CRC in humans by meta-analysis of publicly available data, which showed that tumor infiltrating Treg-cells had reduced TCF-1 expression and increased of TH17 and IL-17 signaling.
TCF-1-deficient Treg-cells strongly expressed the core Treg signature genes, along with Wnt, TH17, MAPK, and TCR signaling. The scRNAseq, identified two eTreg clusters 7, marked by high expression of cMaf or Ikzf2, and assigned several cTreg clusters to different stages of maturation based their expression of Klf2, ETE, and activation markers as well as their spatial distribution in the UMAP. This classification was confirmed by pathway analysis. Gene expression data strongly suggested peripheral and thymic origins of the Maf and Ikzf2 clusters respectively. Our UMAP superimposed velocity analysis suggested intercluster relations, indicating that the Maf and Ikzf2 eTreg clusters might originate from two cTreg clusters with low Klf2 expression, namely Klf2− and Ncoa3, while the Mif cluster exclusively led to the Maf cluster. Among the cTreg clusters, Ifn, Klf2+, and Vps8 were the most isolated, based on velocity analysis, and could represent transitions to effector T-cells.
Changes in gene expression caused by loss of TCF-1 occurred within conserved Treg clusters. Side by side comparison of scRNAseq data from TCF-1 deficient and sufficient Treg-cells revealed changes in activation, TH17 signaling, and gut homing. Ablation of TCF-1 broadly enhanced expression of genes that are normally bound by TCF-1 and FOXP3 with few exceptions, such as the Ikzf2/HELIOS cluster. Expression of cMaf, and TH17 signaling signature was increased across Treg clusters, again with little change in the Ikzf2/HELIOS cluster. These findings agrees with our earlier finding that in patients with inflammatory bowel disease and dysplasia expression of proinflammatory cytokines (IL-17, IFNγ, TNF α) by Treg-cells is mostly limited to the RORγT+HELIOS− Treg-cells 14.
Using ex vivo and in vivo assays we demonstrated that TCF-1 deficient Treg-cells strongly suppressed T-cell proliferation and antigen-specific T-cell cytotoxicity of CD8+ T-cells, however, they were compromised in hindering the polarization of CD4+ T-cell to the pro-inflammatory TH17 or TH1 lineages and failed to suppress inflammation in polyposis. Notably, pharmacologic inhibition of TGFβR1 signaling blocked the suppression of CD8 cytotoxicity by TCF-1 deficient Treg-cells, in line with active TGFβ signaling in the absence of TCF-1 and the essential role of this pathway in Treg suppression of CD8 T-cells 44, 46. The combined pro-inflammatory and T-cell suppressive action of TCF-1 deficient Treg-cells increased tumor load and tumor aggression in polyposis, demonstrating relevance to CRC. These findings demonstrate a bifurcation of Treg suppressive activities upon loss of TCF-1, which favors tumor growth.
Polyposis in mice upregulated Treg genes associated with activation, inflammation, and immune suppression, similar to TCF-1 deficient Treg-cells. At the single cell level, TCF-1 expression was lower in the most differentiated relative to the less mature Treg clusters. We found these findings to be relevant to human CRC. Re-analysis of publicly available data 50 showed reduced TCF-1 expression in tumor infiltrating Treg-cells in CRC. These observations are in line with the tumor dependence Treg pro-inflammatory properties in CRC patients and in polyposis mice 9, 11, 51.
FOXP3 participates in regulatory complexes that activate or suppress gene expression to determine Treg identity53. TCF-1 substantially overlaps with FOXP3 in its’ binding to regulatory elements of genes of responsible for T-cell activation, migration, and TH17 differentiation, indicating that it cooperates with FOXP3 to determine Treg fate and function 14, 20. FOXP3 downregulates the expression of TCF-1 54 and here we show that ablation of TCF-1 results in the upregulation of FOXP3. Importantly, Treg-cells that lack TCF-1 fail to control the expression of pro-inflammatory genes that normally co-bind TCF-1 and FOXP3. We therefore propose that the interplay between TCF-1 and FOXP3 at co-bound gene regulatory elements differentially regulates independent Treg functions. Under normal physiological conditions this could be beneficial and help eradicate infections while avoiding autoimmunity, but in the setting of CRC these properties fuel tumor growth while blocking cancer immune surveillance 13, 14.
Induction of RORγT in Treg-cells is bacterial dependent, but how dysbiosis which is a known characteristic of CRC, alters the function of RORγT+ Treg-cells remains poorly understood. Here we found that expression of Erdr1, a gene that encodes a bacterial sensitive secreted apoptotic factor 37, is upregulated in TCF-1 deficient Treg-cells. Future studies are warranted to elucidate how bacteria alter TCF-1 signaling and Treg functions in CRC, and how they can be exploited to help prevent CRC or improve response to therapy .
Methods
Mice
Mouse strains described below were housed and bred at the Mayo Clinic animal facility. Tcf7fl/fl (European Mouse Mutant Archive, EMMA) 22 were crossed to Foxp3Cre-YFP mice 23 (designated as Foxp3Cre mice) to generate mice with Treg-cell specific deletion of Tcf7. Foxp3CreTcf7fl/fl and control Foxp3Cre mice were crossed to APCΔ468 mice 49 to generate the polyposis prone compound mutant APCΔ468Foxp3CreTcf7fl/fl and APCΔ468 Foxp3Cre mice. Animal experiments were approved by the Animal Ethics Committee of the institutes responsible for housing the mice. Unless otherwise specified, all experimental procedures were performed on 5.5 month-old laboratory mice.
Viral infections
Mice were infected with Murine Theiler's Encephalomyelitis Virus (TMEV) at day 0. For acute viral infection, 2.5-5.0 × 10⁵ plaque-forming units (PFU) was used. Virus was prepared in plain DMEM and injected intraperitoneally (i.p.).
In vivo cytotoxicity assay
In vivo CTL assays followed established protocols 44, 55. Briefly, splenocytes from naive WT CD45.1 background mouse were prepared as single-cell suspensions to 1 × 10⁷/ml in Ca/Mg-free Hanks’ balanced salt solution (HBSS) (GE Healthcare). The specific target population (half of the cells) was pulsed with 1μM/ml VP2121-130 peptide and the negative control target population (half of the cells) was not pulsed with peptide. Cells were incubated for 60 min at 37 °C, then were washed twice in complete media and brought up in Ca/Mg-free HBSS for labeling with carboxyfluorescein succinimidyl ester (CFSE; 79898 BioLegend). Peptide pulsed cells were incubated with 10 μM CFSE (CFSEhi) or non-pulsed with 1 μM CFSE (CFSElo) concentrations for 10 min in a 37 °C water bath, and then quenched by addition of complete media. Cells were washed three times, then viable cells counted and mixed in a 1:1 ratio prior to injection into recipient mice. A total of 15 million cells per 200 μl Ca/Mg-free PBS (Lonza) (at room temperature) were transferred into mice on day 7 post TMEV, by i.v. injection into the tail. Recipient mice were euthanized 4 h later, and the harvested mesenteric lymph nodes and splenocytes were analyzed by flow cytometry to determine the percentage of CFSEhi and CFSElo cells. The percentage of VP2121-130 -specific cytotoxicity was calculated as follows:
In some experiments, mice were gavaged twice a day with TGFβR1 inhibitor (LY3200882, Eli Lilly) 105 mg/kg body weight or 1% hydroxyethyl-cellulose (09368; Sigma) as vehicle from the day of infection till day 7 post infection. Then the cytotoxicity was measured as described above.
Dissociation of mesenteric lymph nodes (MLNs) and spleen
A single cell suspension was obtained from MLNs and splenocytes after physical dissociation with a 40 μm mesh (Falcon). Red blood cell lysis on splenocytes was performed using 1 ml of ACK lysis buffer (Lonza) for 1 min on ice and washed in PBS-2% FBS (F8067; Sigma) buffer.
Enzymatic dissociation of small bowel and colon
Tissue was dissociated using the following steps. Fat layers were removed, washed, and opened longitudinally. Tissues were then minced and dissociated in a cocktail solution of 12 mg collagenase IV (LS004188; Worthington), 180 U DNase (D5025; Sigma) and 1.2 mg hyaluronidase (H3506; Sigma) in 20 ml complete RPMI-1640 media with constant stirring for 25 min at 37 °C. Single cell suspensions were then filtered, and supernatants were washed in PBS-2% FBS. Tissues were digested twice. A percoll (P1644; Sigma) gradient was then performed to remove platelets and debris by layering the 44 % percoll cell suspension over 67 % percoll and centrifuging at 400 g for 20 min at 4 °C without brake. The mononuclear cell layer was collected and washed in PBS-2% FBS buffer.
Flow cytometry
Cells were stained with LIVE/DEAD Fixable Blue Stain (dilution: 1/750; L34962; Invitrogen) and antibodies for 30 min at 4 °C. The fluorochrome-conjugated antibodies were as follows: anti-CD4-PerCP/Cyanine5.5 (dilution: 1/300; clone: RM4-5; Cat: 116012) or anti-CD4-AF700 (dilution: 1/200; clone: RM4-5; cat: 116022) or anti-CD4-Brilliant Violet 785 (dilution: 1/300; clone: RM4-5; Cat: 100551), anti-CD25-Brilliant Violet 650 (dilution: 1/200; clone: PC61; cat: 102038), anti-CD44-Brilliant Violet 785 (dilution: 1/500; clone: IM7; cat: 103059), anti-CD278 (ICOS)-PE-Cy7 (dilution: 1/200; clone: C398.4A; cat: 313520), anti-CD279 (PD-1)-Brilliant Violet 421 (dilution: 1/200; clone: 29F.1A12; cat: 135218), anti-CD45.1-PE/Cy7 (dilution: 1/500; clone: A20; cat: 110730) or anti-CD45.1-BV650 (dilution: 1/500; clone: A20; cat: 110735), anti-CD45.2-APC (dilution: 1/500; clone: 104; cat: 109814) (all from BioLegend); anti-CD8a-V500 (dilution: 1/200; clone: 53-6.7; cat: 560776), anti-CD62L-FITC (dilution: 1/200; clone: MEL-14; cat: 553150), anti-CD69-Brilliant Violet 785 (dilution: 1/200; clone: H1.2F3; cat: 564683) (all from BD Biosciences). 50 μl of a 1:50 dilution of APC-conjugated Db:VP2121-130 tetramer (National Institutes of Health Tetramer Core Facility) was used in a 30-min incubation step in the dark at room temperature. TGFβ RI-PE (dilution: 10μl/test; Cat: FAB5871P), Rat IgG2A-PE (dilution: 10μl/test; IC006P), TGFβ RII-PE (10μl/test; cat: FAB532P) and Goat IgG-PE (dilution: 10μl/test; IC108P; all from R & D Systems) surface staining were performed according to the manufacturer’s instruction. For intracellular staining, surface-stained cells were fixed and permeabilized with the FOXP3/Transcription Factor Staining Buffer Set (00-5523-00; eBiosciences), followed by incubation with fluorochrome-conjugated anti- FOXP3-FITC or anti- FOXP3-APC (dilution: 1/200; clone: FJK-16s Cat: 17-5773-82; eBioscience); anti-Helios-Brilliant Violet 421 (dilution: 1/200; clone: 22F6; cat: 137234; BioLegend) or anti-Helios-PerCP/Cyanine5.5 (dilution: 1/200; clone: 22F6; cat: 137230; BioLegend); anti-RORγT-Brilliant Violet 421 (dilution: 1/200; clone: Q31-378; cat: 562894; BD Biosciences) or anti-RORγT-PE (dilution: 1/200; clone: Q31-378; cat: 562607; BD Biosciences); and anti-TCF-1-Alexa Fluor 647 (dilution: 1/300; clone: C63D9; cat: 6709S; Cell Signaling) for 2 h or overnight at 4 °C. Cells were then washed twice with wash/perm buffer.
For detection of phosphorylated signaling proteins (S6 and STAT5), lymphocytes were rested in complete medium for 1 h at 37 °C. They were fixed with Phosflow Lyse/ Fix buffer (558049; BD Biosciences), followed by permeabilization with Phosflow Perm buffer III (558050; BD Biosciences) and were stained with antibody to PE-conjugated S6 phosphorylated at Ser235 and Ser236 (dilution: 1/100; clone: D57.2.2E; cat: 5316S) and rabbit IgG-PE (dilution: 1/200; clone: DA1E; cat: 5742S; both from Cell Signaling Technology), FITC-conjugated STAT5 phosphorylated at Tyr694 (dilution: 1μg/test; clone: SRBCZX; cat: 11-9010-42) and Mouse IgG1 kappa-FITC (dilution: 1μg/test; clone: P3.6.2.8.1; cat: 11-4714-81; both from eBioscience).
For detection of phosphorylated signaling proteins (Smad2/Smad3), lymphocytes were rested in serum free media for 3 h at 37 °C, prior to 15 min stimulation with 10 ng/ml of TGFβI (Peprotech). They were fixed with Phosflow Lyse/ Fix buffer, followed by permeabilization with Phosflow Perm buffer III and were stained with antibody to PE-conjugated Smad2/Smad3 phosphorylated at Ser465/467 and Ser423/425 (dilution: 1/50; clone: D27F4; cat: 11979S) and rabbit IgG-PE (dilution: 1/100; clone: DA1E; cat: 5742S; both from Cell Signaling Technology).
All flow cytometry data were acquired on LSRII or LSR Fortessa X20 (BD Biosciences) and analyzed with Flowjo software (Tree Star).
In vivo TH1 polarization and intracellular IFNγ staining
Mice were injected i.p. with TMEV and euthanized after seven days. Mesenteric lymph nodes and spleen were collected. Single cells suspension was prepared and stimulated with 50 ng/ml phorbol-12-myristate-13-acetate (PMA, P1585; Sigma) and 0.75 μg/ml ionomycin (13909; Sigma) for 5 h in the presence of 1 μg/ml GolgiStop (555029; BD Biosciences) before intracellular staining. Cells were surface-stained followed by IFNγ (dilution: 1/200; clone: XMG1.2; cat: 17-7311-82; eBioscience) intracellular staining.
In vivo TH17 polarization and intracellular IL-17A staining
Mice were injected intraperitoneally three times with CD3-specific antibody (20 μg per mouse; 2C11; BioLegend) or PBS at 0, 48 and 96 h, as described earlier48. 100 h after the first injection, the small bowel was enzymatically dispersed, intraepithelial cells (IEL) and lamina propria (LP) cells were isolated, and re-stimulated with PMA/Ionomycin and 5 h later were stained for intracellular IL-17A (dilution: 1/300; clone: TC11-18H10; cat: 559502; BD Biosciences).
In vitro T-cell polarization assay
Total CD4+ T-cells from spleen of Foxp3Cre and Foxp3CreTcf7fl/fl mice were negatively isolated through the use of a mouse CD4+ T-cell Isolation Kit (130-104-454; Miltenyi). 1 × 10⁵ CD4+ T-cells were seeded with 1 × 10⁵ irradiated antigen presenting cells, 0.75 μg/ml anti-CD3 (2C11; BioLegend) and 1.5 μg/ml anti-CD28 (37.51; BioLegend) in a coated plate. For TH1 polarization, cells were supplemented with 5 μg/ml of anti-IL-4 (11B11; BD Biosciences), 10 ng/ml of IFNγ (485-MI-100; R & D Systems), and 10 ng/ml of IL-12 (419-ML; R & D Systems). For TH17 polarization, cells were treated with 5 μg/ml of anti-IL-4, 5 μg/ml of anti-IFNγ (XMG1.2; eBioscience), 10 μg/ml of anti-IL-2 (JES6-5H4; Bio Cell), 30 ng/ml of IL-6 (406-ML; R & D Systems) and 1.5 ng/ml of TGFβI (PHG9204; Thermo Fisher). After 65 h, cells were removed from the TCR signaling and recultured in a non-coated plate. Four days after activation, cells were re-stimulated with PMA/Ionomycin/GolgiStop for 5 h, followed by IFNγ and IL-17A staining.
In other experiments, CD4+CD25−CD62LhiCD44lo naïve T-cells were FACS sorted from MACS-pre-purified naïve CD4+ T-cells (130-104-453; Miltenyi) isolated from spleen of WT CD45.1 mouse and labeled with 4 μM Cell Trace Violet (C34557; Thermo Fisher). CD25+YFP+ CD45.2 Treg cells were FACS sorted from MACS-pre-purified CD4+ T-cells (130-104-454; Miltenyi) isolated from spleen of Foxp3Cre and Foxp3CreTcf7fl/fl mice. Cells in equal number were stimulated under TH1 or TH17 polarized conditions in presence of irradiated splenocytes at 1:1:3 ratio for 90 h. Cells were cultured in RPMI-1640 with L-glutamine (12-702F; Lonza) with 10% FBS, 0.5 mM L-glutamine (25030-081; Life Technologies), 1 mM Sodium pyruvate (Sigma), 100 IU/ml penicillin and 100 mg/ml streptomycin (15140-122; both from Life Technologies), 50 μM/ml β-mercaptoethanol (M3148; Sigma). All cultures were performed in a volume of 200 μl in 96-well U-bottomed plates.
T-cell proliferation suppression assay
CD25+YFP+ CD45.2 Treg-cells as suppressor cells were FACS sorted from MACS-pre-purified CD4+ T-cells (130-104-454; Miltenyi) isolated from spleen of Foxp3Cre and Foxp3CreTcf7fl/fl mice. CD4+CD25−CD62LhiCD44lo naïve T-cells as responder cells were FACS sorted from MACS-pre-purified naïve CD4+ T-cells (130-104-453; Miltenyi) isolated from spleen of WT CD45.1 mouse. T responder cells were labeled with 2.5 μM CFSE and then cocultured with Treg-cells (30 × 103) at a 1:1 ratio with or without allogeneic CD11c+ cells (120 × 103) for 72 h. Allogeneic DC from Balb/c mice was obtained by incubation with MACS microbeads coated with anti-CD11c mAb (130-104-453; Miltenyi Biotech) and irradiated at 3,000 rad. Cells were activated with anti-CD3 (0.5 μg/ml) by coating 96-well round bottom plates for 2 h at 37 °C.
Histology and immune staining
Gut tissues were harvested, opened longitudinally and fixed using 10% formalin for 12–18 h, and routinely paraffin embedded and processed. For immune staining, 5-μm thick tissue sections were deparaffinized in xylene and rehydrated in ethanol. Following rehydration, slides were immersed in target retrieval solution (S1699; Dako), and heat-induced epitope retrieval was performed in a Decloaking Chamber (Biocare Medical). Following antigen retrieval, tissues were washed with PBS and nonspecific background staining was blocked using dual endogenous enzyme block (S2003; Dako), Fc-block (2.4G2, Antibody Hybridoma Core, Mayo Clinic; kindly provided by Dr Tom Beito), and Background Sniper (BS966L; BioCare Medical). Nonspecific avidin/biotin was blocked when needed (SP-2001; Vector Laboratories). Primary antibodies were diluted in antibody diluent solution (S0809; Dako) and incubated overnight at 4 °C. For β-catenin staining, anti-β-catenin (dilution: 1/200; clone: 14/ β-catenin (RUO); cat: 610154; BD Biosciences) as primary and Envision + System-HRP-labelled polymer anti-mouse (K4001; Dako) as a secondary antibody was used for 45 min. For Gr1 staining, anti-Gr1 (dilution: 1/50; clone: NIMP-R14; cat: NB600-1387; Novus Biologicals) as primary and biotinylated rabbit anti-rat (BA-4001; Vector Laboratories) as secondary antibodies were applied to the sections for 45 min, followed by streptavidin (HRP conjugate, 016-030-084; Jackson Laboratories) for 30 min. Counterstaining was done using Chromogen DAB+Substrate (K3468; Dako) followed by hematoxylin counterstain. A Leica light microscope mounted with a Zeiss Axiocam 503 camera was used for imaging of Immunohistochemistry staining.
mRNA isolation for RNA sequencing
2-4.0 x 10⁵ CD25+YFP+ Treg-cells were FACS sorted from MACS-pre-purified CD4+ T-cells (mouse CD4+ T-cell Isolation Kit, Miltenyi) isolated from MLNs of Foxp3Cre and Foxp3CreTcf7fl/fl mice. Total RNA was isolated using the PicoPure RNA Isolation Kit (Arcturus) following the manufacturer’s instructions. Libraries were generated and sequenced by the University of Chicago Genomics Facility.
Single cell RNA-Seq
CD25+YFP+ Treg-cells were FACS sorted from MACS-pre-purified CD4+ T-cells (mouse CD4+ T-cell Isolation Kit, Miltenyi) isolated from MLN of Foxp3Cre and Foxp3CreTcf7fl/fl mice and immediately submitted to the Genomics Facility. The cells were first counted and measured for viability using the Vi-Cell XR Cell Viability Analyzer (Beckman-Coulter), as well as a basic hemocytometer with light microscopy. The barcoded Gel Beads were thawed from −80°C and the reverse transcription master mix was prepared according to the manufacturer’s instructions for Chromium Single Cell 3’ v2 library kit (10x Genomics). Based on the desired number of cells to be captured for each sample, a volume of live cells was mixed with the master mix. The cell suspension/master mix, thawed Gel Beads and partitioning oil were added to a Chromium Single Cell A chip. The filled chip was loaded into the Chromium Controller, where each sample was processed and the individual cells within the sample were captured into uniquely labeled GEMs (Gel Beads-In-Emulsion). The GEMs were collected from the chip and taken to the bench for reverse transcription, GEM dissolution, and cDNA clean-up. Resulting cDNA was a pool of uniquely barcoded molecules. Single cell libraries were created from the cleaned and measured, pooled cDNA. During library construction, standard Illumina sequencing primers and unique i7 Sample indices were added to each cDNA pool. Each sample was uniquely indexed.
All cDNA pools and resulting libraries were measured using Qubit High Sensitivity assays (Thermo Fisher Scientific), Agilent Bioanalyzer High Sensitivity chips (Agilent) and Kapa DNA Quantification reagents (Kapa Biosystems).
Libraries were sequenced at 50,000 fragment reads per cell following Illumina’s standard protocol using the Illumina cBot and HiSeq 3000/4000 PE Cluster Kit. The flow cells were sequenced as 100 X 2 paired end reads on an Illumina HiSeq 4000 using HiSeq 3000/4000 sequencing kit and HCS v3.3.52 collection software. Base-calling was performed using Illumina’s RTA version 2.7.3.
Single cell RNA-Seq data analysis
The 10x Genomics Cellranger (v2.0.2) mkfastq was applied to demultiplex the Illumina BCL output into FASTQ files. Cellranger count was then applied to each FASTQ file to align reads to mm10 reference genome and generate barcode and UMI counts. We followed the Seurat 56 (v3.2.2) integrated analysis and comparative analysis workflows to do all scRNA-Seq analyses 56. Genes expressed in < 3 cells and cells with < 200 genes or > 15% mitochondrial genes were excluded for downstream analysis in each dataset. Cell cycle score for each cell was calculated by CellCycleScoring function from Seurat using mouse cell cycle genes. SCTransform function was invoked to normalize the dataset (using default parameters), regress out mitochondrial (percent.MT) and cell cycle (S and G2M) contents and identify variable genes.
The datasets were integrated based on “anchors” identified between datasets (nfeatures = 2000, normalization.method = "SCT") prior to performing linear dimensional reduction by Principal Component Analysis (PCA). The top 25 PCs were included in a Uniform Manifold Approximation and Projection (UMAP) dimensionality reduction. Clusters were identified on a shared nearest neighbor (SNN) graph the top 25 PCs with the Louvain algorithm. Differential gene expression was determined by “findMarkers” function with the default Wilcox Rank Sum test either as one versus rest or as a direct comparison with parameters min.pct = 0.1 and logfc.threshold = 0. For Metascape analysis 57, the 200 upregulated genes were then determined based on reported adjusted p-values. For GSEA analysis, a pre-ranked gene list was created based on sorted scores defined by −log10(reported p-value)×sign(reported average logfc). The cell annotation was based on the top differentially expressed genes.
Gene list module scores were calculated with Seurat function AddModuleScore 58. This calculates the average scaled expression levels of each gene list, subtracted by the expression of control feature sets. To compare the single marker expression between cell types, wilcox-test was used.
To calculate the RNA velocity, the loom files were generated from the bam files by Velocyto 40; The RNA velocity was then calculated using the RunVelocity function in Velocyto.R package. The velocity for each sample was shown by show.velocity.on.embedding.cor function in Velocyto.R package.
Quantification and statistical analysis
Except for deep-sequencing data, statistical significance was calculated with GraphPad Prism software. Error bars in graphs indicate standard error of the mean (SEM) and statistical comparisons were done by unpaired Student’s t-test. p values of ≤ 0.05 were considered statistically significant.
Extended Data
Extended Data Fig 1. TCF-1 deficiency selectively reprograms Treg-cells without compromising their core signature.
Treg-cells were isolated from the mesenteric lymph nodes of Foxp3Cre and Tcf7fl/flFoxp3Cre mice. (a) Representative FACS histograms of MLN purified cells from Foxp3Cre Tcf7fl/fl and control Foxp3Cre showing selective loss of TCF-1 from Treg-cells in Foxp3Cre Tcf7fl/fl mice. (b and c) Histogram plots showing the cumulative data of the same. (b: n = 4; p < 0.0001 & c: n = 5) Data are representative of two independent experiments and n represents biologically independent replicate mice; means ± SEM; two-sided, unpaired t-test. (d) GSEA plot comparing the enrichment of genes expressed more strongly in Foxp3Cre versus Foxp3CreTcf7fl/fl Treg-cells.
Extended Data Fig. 2. Representative FACS plots of cell lymphocytes surface markers expressed by Treg_cells.
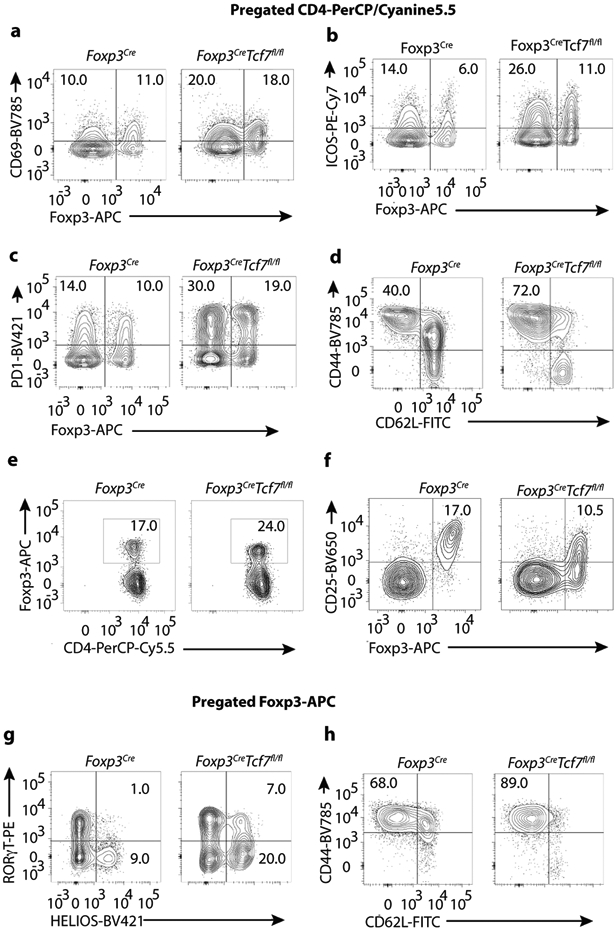
Treg-cells were isolated from the mesenteric lymph nodes of Foxp3Cre and Tcf7fl/flFoxp3Cre mice. See cumulative data presented in Figure 2. (a-c) CD4+ cells were pre-gated and frequency of CD69+, ICOS+, and PD1+ cells among CD4+FOXP3− Tcon or CD4+FOXP3+ Treg-cells was measured, as indicated. (d) CD4+ cells were pre-gated and frequency of CD44+CD62L− cells among CD4+FOXP3− Tcon cells was measured. (e) CD4+ cells were pre-gated and frequency of CD4+FOXP3+ Treg-cells was measured. (f) CD4+ cells were pre-gated and frequency of FOXP3+CD25+ Treg-cells was measured. (g) CD4+FOXP3+ Treg-cells were pre-gated and frequency of RORγT+HELIOS− or RORγT+HELIOS+ was measured. (h) CD4+FOXP3+ Treg-cells and frequency of CD44+CD62L− cells among Treg cells was measured. Numbers inside quadrants indicate percent cells in the respective quadrants.
Extended Data Fig. 3. Treg purification.
Treg-cells were isolated from the mesenteric lymph nodes of Foxp3Cre and Tcf7fl/flFoxp3Cre mice. (a) Schematic representation of magnetic purification of Treg-cells, and FACS analysis showing over 90% purity. (b) Expression changes of the Tcf7 transcripts between TCF-1-deficient and TCF-1-sufficient Treg-cells. The color intensity is proportional to the average gene expression across cells in the indicated Treg cluster. The size of circles is proportional to percentage of cells expressing indicated genes.
Extended Data Fig. 4. Single-cell RNAseq reveals distinct Treg populations.
mRNA expression of select indicated genes projected on the UMAP. Note varied expression of Klf2 but broad and uniform expression of Izumo1r by Treg clusters, high expression of Mif, Vps8, and Ifit1 in the respective Mif (cluster 3), Vps8 (cluster 8), Ifn (cluster 9). Expression of Ccl5 is prominent in the Cd63 (cluster 7), which is likely not Treg-cells.
Extended Data Fig. 5. TCF-1-deficient and sufficient Treg-cells show distinct effector functions.
Treg-cells were isolated from the mesenteric lymph nodes of Foxp3Cre and Tcf7fl/flFoxp3Cre mice. (a) mRNA expression of Maf projected on the UMAP, comparing Treg-cells derived from Foxp3Cre to Tcf7fl/fl Foxp3Cre mice. (b) Violin plots showing expression of Maf in individual Treg clusters. (c) GSEA of MAF downregulated genes and TH17 pathway defined by Stubbington. (d) Kegg IL17 signaling pathway projected on UMAP, comparing TCF-1-sufficient and TCF-1-deficient Treg-cells (e) GSEA analysis for the Kegg IL17 signaling pathway comparing transcriptomes of TCF-1-sufficient and TCF-1-deficient Treg-cells across all cell types. Normalized enrichment scores (NES) are color coded. −log10 (FDR) values are proportional to the circle size. FDR>15% are masked with gray color. (fgh) mRNA expression of Ccr9, Erdr1 and Igfbp4 projected on the UMAP, comparing TCF-1-sufficient and TCF-1-deficient Klf2− cells for the Kegg IL17 pathway.
Extended Data Fig. 6. Treg-cells are activated and polarized during polyposis.
Treg_cells were isolated from the mesenteric lymph nodes of WT and APCΔ486 mice. (a) UMAP projection (left panel) and fraction of cells in each cell type (stack bars; right panel) for APCΔ486 and control B6 Treg-cells. Data are from two replicates. (b) Dot plot showing the expression of Tcf7 across all cell types in ApcΔ486 and control B6 Treg-cells. Color and size of the dots are proportional to the expression level and percent of cells expressing Tcf7 in each indicated cluster. (c) Expression of Socs3, Jund, Lag3 and Maf between APCΔ486 and B6 cells projected on the UMAP. See TableS4 for the full list. The fold change in percent of cells expressing the indicated gene in each cell type is proportional to the circle size. Adjusted-p-values > 0.01 are masked with gray color. (d) Expression changes of the most differentially expressed genes between APCΔ486 and control B6 Treg-cells. See TableS4 for the full list. The fold change in expression intensities is color-coded. (e) RNA velocity vectors overlaid on UMAP for B6 (left) and APCΔ486 (right) Treg-cells.
Supplementary Material
Acknowledgments
This work was supported by NIH R01 AI 108682 (FG & KK), NIH RO1 AI 147652 (FG), NIH R35GM138283 (MK), and Praespero Innovation Award Alberta, Canada (FG & KK). Ms Nicoleta Carapanceanu and Mr. Valentin Carapanceanu are thankfully acknowledged for excellent technical support. Dr. Leesaa Pennell (Biolegend) is gratefully acknowledged for advice with single cell RNA sequencing techniques. Ms. Vernadette Simon (Mayo Clinic, Rochester, MN) is gratefully acknowledged for assistance with single cell RNA sequencing. Dr. Alexandra Vitko Lucs (Eli Lilly) is thankfully acknowledged for providing the TGFβRI inhibitor LY3200882 and for scientific advice. We thank Dr. Katrina Woolcock (Lifesciences Editors) for professional editing of the manuscript.
Footnotes
Conflicting Interests
The authors have no conflicting interests.
Data Availability
The Bulk and scRNAseq datasets were deposited in the Gene Expression Omnibus (GEO) under the accession code GSE163084. The codes used for bulk and single-cell RNA-seq analysis followed typical pipelines from public R packages (DESeq2 and Seurat). All codes are available upon request.
References
- 1.Fontenot JD, Gavin MA & Rudensky AY Foxp3 programs the development and function of CD4+CD25+ regulatory T cells. Nat Immunol 4, 330–336 (2003). [DOI] [PubMed] [Google Scholar]
- 2.Hori S, Nomura T & Sakaguchi S Control of regulatory T cell development by the transcription factor Foxp3. Science 299, 1057–1061 (2003). [DOI] [PubMed] [Google Scholar]
- 3.Khattri R, Cox T, Yasayko SA & Ramsdell F An essential role for Scurfin in CD4+CD25+ T regulatory cells. Nat Immunol 4, 337–342 (2003). [DOI] [PubMed] [Google Scholar]
- 4.Benoist C & Mathis D Treg cells, life history, and diversity. Cold Spring Harb Perspect Biol 4, a007021 (2012). [DOI] [PMC free article] [PubMed] [Google Scholar]
- 5.Ohnmacht C et al. MUCOSAL IMMUNOLOGY. The microbiota regulates type 2 immunity through RORgammat(+) T cells. Science 349, 989–993 (2015). [DOI] [PubMed] [Google Scholar]
- 6.Schiering C et al. The alarmin IL-33 promotes regulatory T-cell function in the intestine. Nature 513, 564–568 (2014). [DOI] [PMC free article] [PubMed] [Google Scholar]
- 7.Pratama A, Schnell A, Mathis D & Benoist C Developmental and cellular age direct conversion of CD4+ T cells into RORγ+ or Helios+ colon Treg cells. J Exp Med 217 (2020). [DOI] [PMC free article] [PubMed] [Google Scholar]
- 8.Zhou J, Nefedova Y, Lei A & Gabrilovich D Neutrophils and PMN-MDSC: Their biological role and interaction with stromal cells. Semin Immunol 35, 19–28 (2018). [DOI] [PMC free article] [PubMed] [Google Scholar]
- 9.Blatner NR et al. Expression of RORgammat marks a pathogenic regulatory T cell subset in human colon cancer. Sci Transl Med 4, 164ra159 (2012). [DOI] [PMC free article] [PubMed] [Google Scholar]
- 10.Miragaia RJ et al. Single-Cell Transcriptomics of Regulatory T Cells Reveals Trajectories of Tissue Adaptation. Immunity 50, 493–504 e497 (2019). [DOI] [PMC free article] [PubMed] [Google Scholar]
- 11.Blatner NR et al. In colorectal cancer mast cells contribute to systemic regulatory T-cell dysfunction. Proc Natl Acad Sci U S A 107, 6430–6435 (2010). [DOI] [PMC free article] [PubMed] [Google Scholar]
- 12.Gounaris E et al. T-regulatory cells shift from a protective anti-inflammatory to a cancer-promoting proinflammatory phenotype in polyposis. Cancer Res 69, 5490–5497 (2009). [DOI] [PMC free article] [PubMed] [Google Scholar]
- 13.Keerthivasan S et al. beta-Catenin promotes colitis and colon cancer through imprinting of proinflammatory properties in T cells. Sci Transl Med 6, 225ra228 (2014). [DOI] [PMC free article] [PubMed] [Google Scholar]
- 14.Quandt J et al. Wnt-beta-catenin activation epigenetically reprograms Treg cells in inflammatory bowel disease and dysplastic progression. Nat Immunol 22, 471–484 (2021). [DOI] [PMC free article] [PubMed] [Google Scholar]
- 15.Sumida T et al. Activated beta-catenin in Foxp3(+) regulatory T cells links inflammatory environments to autoimmunity. Nat Immunol 19, 1391–1402 (2018). [DOI] [PMC free article] [PubMed] [Google Scholar]
- 16.Mosimann C, Hausmann G & Basler K Beta-catenin hits chromatin: regulation of Wnt target gene activation. Nature reviews. Molecular cell biology 10, 276–286 (2009). [DOI] [PubMed] [Google Scholar]
- 17.Barra MM, Richards DM, Hofer AC, Delacher M & Feuerer M Premature expression of Foxp3 in double-negative thymocytes. PLoS One 10, e0127038 (2015). [DOI] [PMC free article] [PubMed] [Google Scholar]
- 18.Barra MM et al. Transcription Factor 7 Limits Regulatory T Cell Generation in the Thymus. J Immunol 195, 3058–3070 (2015). [DOI] [PubMed] [Google Scholar]
- 19.van Loosdregt J et al. Canonical wnt signaling negatively modulates regulatory T cell function. Immunity 39, 298–310 (2013). [DOI] [PubMed] [Google Scholar]
- 20.Xing S et al. Tcf1 and Lef1 are required for the immunosuppressive function of regulatory T cells. J Exp Med 216, 847–866 (2019). [DOI] [PMC free article] [PubMed] [Google Scholar]
- 21.Mielke LA et al. TCF-1 limits the formation of Tc17 cells via repression of the MAF-RORgammat axis. J Exp Med 216, 1682–1699 (2019). [DOI] [PMC free article] [PubMed] [Google Scholar]
- 22.Emmanuel AO et al. TCF-1 and HEB cooperate to establish the epigenetic and transcription profiles of CD4(+)CD8(+) thymocytes. Nat Immunol 19, 1366–1378 (2018). [DOI] [PMC free article] [PubMed] [Google Scholar]
- 23.Rubtsov YP et al. Regulatory T cell-derived interleukin-10 limits inflammation at environmental interfaces. Immunity 28, 546–558 (2008). [DOI] [PubMed] [Google Scholar]
- 24.Chapman NM & Chi H mTOR Links Environmental Signals to T Cell Fate Decisions. Front Immunol 5, 686 (2014). [DOI] [PMC free article] [PubMed] [Google Scholar]
- 25.Neumann C et al. c-Maf-dependent Treg cell control of intestinal TH17 cells and IgA establishes host-microbiota homeostasis. Nat Immunol 20, 471–481 (2019). [DOI] [PubMed] [Google Scholar]
- 26.Kim HJ et al. Stable inhibitory activity of regulatory T cells requires the transcription factor Helios. Science 350, 334–339 (2015). [DOI] [PMC free article] [PubMed] [Google Scholar]
- 27.Thornton AM et al. Expression of Helios, an Ikaros transcription factor family member, differentiates thymic-derived from peripherally induced Foxp3+ T regulatory cells. J Immunol 184, 3433–3441 (2010). [DOI] [PMC free article] [PubMed] [Google Scholar]
- 28.Fassett MS, Jiang W, D'Alise AM, Mathis D & Benoist C Nuclear receptor Nr4a1 modulates both regulatory T-cell (Treg) differentiation and clonal deletion. Proc Natl Acad Sci U S A 109, 3891–3896 (2012). [DOI] [PMC free article] [PubMed] [Google Scholar]
- 29.Kovalovsky D et al. Beta-catenin/Tcf determines the outcome of thymic selection in response to alphabetaTCR signaling. J Immunol 183, 3873–3884 (2009). [DOI] [PMC free article] [PubMed] [Google Scholar]
- 30.Pabbisetty SK et al. Peripheral tolerance can be modified by altering KLF2-regulated Treg migration. Proc Natl Acad Sci U S A 113, E4662–4670 (2016). [DOI] [PMC free article] [PubMed] [Google Scholar]
- 31.Beischlag TV et al. Recruitment of the NCoA/SRC-1/p160 family of transcriptional coactivators by the aryl hydrocarbon receptor/aryl hydrocarbon receptor nuclear translocator complex. Mol Cell Biol 22, 4319–4333 (2002). [DOI] [PMC free article] [PubMed] [Google Scholar]
- 32.Zemmour D et al. Single-cell gene expression reveals a landscape of regulatory T cell phenotypes shaped by the TCR. Nat Immunol 19, 291–301 (2018). [DOI] [PMC free article] [PubMed] [Google Scholar]
- 33.Balderhaar HJ et al. The CORVET complex promotes tethering and fusion of Rab5/Vps21-positive membranes. Proc Natl Acad Sci U S A 110, 3823–3828 (2013). [DOI] [PMC free article] [PubMed] [Google Scholar]
- 34.Kolinski T, Marek-Trzonkowska N, Trzonkowski P & Siebert J Heat shock proteins (HSPs) in the homeostasis of regulatory T cells (Tregs). Cent Eur J Immunol 41, 317–323 (2016). [DOI] [PMC free article] [PubMed] [Google Scholar]
- 35.Joller N et al. Treg cells expressing the coinhibitory molecule TIGIT selectively inhibit proinflammatory Th1 and Th17 cell responses. Immunity 40, 569–581 (2014). [DOI] [PMC free article] [PubMed] [Google Scholar]
- 36.Qiu XB, Shao YM, Miao S & Wang L The diversity of the DnaJ/Hsp40 family, the crucial partners for Hsp70 chaperones. Cellular and Molecular Life Sciences CMLS 63, 2560–2570 (2006). [DOI] [PMC free article] [PubMed] [Google Scholar]
- 37.Weis AM, Soto R & Round JL Commensal regulation of T cell survival through Erdr1. Gut Microbes 9, 458–464 (2018). [DOI] [PMC free article] [PubMed] [Google Scholar]
- 38.Miyagawa I et al. Induction of Regulatory T Cells and Its Regulation with Insulin-like Growth Factor/Insulin-like Growth Factor Binding Protein-4 by Human Mesenchymal Stem Cells. J Immunol 199, 1616–1625 (2017). [DOI] [PubMed] [Google Scholar]
- 39.Bettelli E et al. Reciprocal developmental pathways for the generation of pathogenic effector TH17 and regulatory T cells. Nature 441, 235–238 (2006). [DOI] [PubMed] [Google Scholar]
- 40.La Manno G et al. RNA velocity of single cells. Nature 560, 494–498 (2018). [DOI] [PMC free article] [PubMed] [Google Scholar]
- 41.Chen Z et al. Selective regulatory function of Socs3 in the formation of IL-17-secreting T cells. Proc Natl Acad Sci U S A 103, 8137–8142 (2006). [DOI] [PMC free article] [PubMed] [Google Scholar]
- 42.Meixner A, Karreth F, Kenner L & Wagner EF JunD regulates lymphocyte proliferation and T helper cell cytokine expression. Embo j 23, 1325–1335 (2004). [DOI] [PMC free article] [PubMed] [Google Scholar]
- 43.Woo SR et al. Immune inhibitory molecules LAG-3 and PD-1 synergistically regulate T-cell function to promote tumoral immune escape. Cancer Res 72, 917–927 (2012). [DOI] [PMC free article] [PubMed] [Google Scholar]
- 44.Chen ML et al. Regulatory T cells suppress tumor-specific CD8 T cell cytotoxicity through TGF-beta signals in vivo. Proc Natl Acad Sci U S A 102, 419–424 (2005). [DOI] [PMC free article] [PubMed] [Google Scholar]
- 45.Fahlen L et al. T cells that cannot respond to TGF-beta escape control by CD4(+)CD25(+) regulatory T cells. J Exp Med 201, 737–746 (2005). [DOI] [PMC free article] [PubMed] [Google Scholar]
- 46.Mempel TR et al. Regulatory T cells reversibly suppress cytotoxic T cell function independent of effector differentiation. Immunity 25, 129–141 (2006). [DOI] [PubMed] [Google Scholar]
- 47.Pavelko KD et al. Theiler’s murine encephalomyelitis virus as a vaccine candidate for immunotherapy. PLoS One 6, e20217 (2011). [DOI] [PMC free article] [PubMed] [Google Scholar]
- 48.Esplugues E et al. Control of TH17 cells occurs in the small intestine. Nature 475, 514–518 (2011). [DOI] [PMC free article] [PubMed] [Google Scholar]
- 49.Gounaris E et al. Live imaging of cysteine-cathepsin activity reveals dynamics of focal inflammation, angiogenesis, and polyp growth. PLoS One 3, e2916 (2008). [DOI] [PMC free article] [PubMed] [Google Scholar]
- 50.Zhang Y et al. Deep single-cell RNA sequencing data of individual T cells from treatment-naive colorectal cancer patients. Sci Data 6, 131 (2019). [DOI] [PMC free article] [PubMed] [Google Scholar]
- 51.Blatner NR, Gounari F & Khazaie K The two faces of regulatory T cells in cancer. Oncoimmunology 2, e23852 (2013). [DOI] [PMC free article] [PubMed] [Google Scholar]
- 52.Bos PD & Rudensky AY Treg cells in cancer: a case of multiple personality disorder. Sci Transl Med 4, 164fs144 (2012). [DOI] [PubMed] [Google Scholar]
- 53.Kwon HK, Chen HM, Mathis D & Benoist C Different molecular complexes that mediate transcriptional induction and repression by FoxP3. Nat Immunol 18, 1238–1248 (2017). [DOI] [PMC free article] [PubMed] [Google Scholar]
- 54.van der Veeken J et al. The Transcription Factor Foxp3 Shapes Regulatory T Cell Identity by Tuning the Activity of trans-Acting Intermediaries. Immunity 53, 971–984.e975 (2020). [DOI] [PMC free article] [PubMed] [Google Scholar]
- 55.Pavelko KD, Bell MP, Harrington SM & Dong H B7-H1 Influences the Accumulation of Virus-Specific Tissue Resident Memory T Cells in the Central Nervous System. Front Immunol 8, 1532 (2017). [DOI] [PMC free article] [PubMed] [Google Scholar]
- 56.Butler A, Hoffman P, Smibert P, Papalexi E & Satija R Integrating single-cell transcriptomic data across different conditions, technologies, and species. Nat Biotechnol 36, 411–420 (2018). [DOI] [PMC free article] [PubMed] [Google Scholar]
- 57.Zhou Y et al. Metascape provides a biologist-oriented resource for the analysis of systems-level datasets. Nat Commun 10, 1523 (2019). [DOI] [PMC free article] [PubMed] [Google Scholar]
- 58.Tirosh I et al. Dissecting the multicellular ecosystem of metastatic melanoma by single-cell RNA-seq. Science 352, 189–196 (2016). [DOI] [PMC free article] [PubMed] [Google Scholar]
Associated Data
This section collects any data citations, data availability statements, or supplementary materials included in this article.
Supplementary Materials
Data Availability Statement
The Bulk and scRNAseq datasets were deposited in the Gene Expression Omnibus (GEO) under the accession code GSE163084. The codes used for bulk and single-cell RNA-seq analysis followed typical pipelines from public R packages (DESeq2 and Seurat). All codes are available upon request.


