

Abstract
Background and Objectives:
The aim was to explore the association between community health centers’ (CHC) distance to a “maternity care desert” (MCD) and utilization of maternity-related health care services, controlling for CHC and county-level factors.
Measures:
Utilization as: total number of CHC visits to obstetrician-gynecologists, certified nurse midwives, family physicians (FP), and nurse practitioners (NP); total number of prenatal care visits and deliveries performed by CHC staff.
Research Design:
Cross-sectional design comparing utilization between CHCs close to MCDs and those that were not, using linked 2017 data from the Uniform Data System (UDS), American Hospital Association Survey, and Area Health Resource Files. On the basis of prior research, CHCs close to a “desert” were hypothesized to provide higher numbers of FP and NP visits than obstetrician-gynecologists and certified nurse midwives visits. The sample included 1261 CHCs and all counties in the United States and Puerto Rico (n=3234).
Results:
Results confirm the hypothesis regarding NP visits but are mixed for FP visits. CHCs close to “deserts” had more NP visits than those that were not. There was also a dose-response effect by MCD classification, with NP visits 3 times higher at CHCs located near areas without any outpatient and inpatient access to maternity care.
Conclusions:
CHCs located closer to “deserts” and NPs working at these comprehensive, primary care clinics have an important role to play in providing access to maternity care. More research is needed to determine how best to target resources to these limited access areas.
Key Words: community health centers, nurse practitioners, maternity care deserts, maternity care services utilization.
INTRODUCTION AND PURPOSE
Access to maternity care has received accrued attention in the media and among policymakers in the last few years. For one, closures of rural hospitals appeared to happen in rapid succession across the country, often eliminating the only relatively close access point to obstetric care for women in the region.1–5 For another, adequate access to obstetric care is not just a rural problem. The media has been relaying countless horrific stories about Black women residing in major US cities and experiencing poor quality care.6 Urban areas have also witnessed hospitals closing their obstetrician (OB) units, a practice that seeks to reduce services because of various financial pressures.3,7 The severity of closures’ impacts on women’s access to adequate maternity care services and on birth outcomes depends on a number of factors, including supply and distribution of beds across a geographic area. Evidence is quite scarce and somewhat dated, however. One of the few published studies was conducted in Philadelphia, where nine primarily private OB units, which together delivered a little less than a third of all Philadelphia’s births and provided prenatal care (PNC) in their communities, closed for an 8-year period. Findings on neonatal outcomes showed a statistically significant increase of almost 50% in mortality during the first 3 years after closure, after which time mortality rates returned to original levels but did not improve further.7 Findings on maternal outcomes did not reach statistical significance, but maternal complications increased at a much higher rate throughout the 8-year period.7 Hospitals that remained open reported that more patients delivering at their hospital had not received PNC than before other hospital units in the area shut down.7
Geographic accessibility to adequate health care providers and services, both in terms of distance and time traveled, has been recognized by experts and policymakers alike as a key dimension of access to care, including maternity care.8–10 At the same time, there is evidence of shortages of providers as well as an uneven distribution of existing providers between urban and rural areas. Providers of maternity care, defined as prenatal, labor and delivery (LD), and postpartum services, include obstetrician-gynecologists (OB/GYNs), certified nurse midwives (CNMs), family physicians (FPs)11–13 and nurse practitioners (NPs). OB/GYNs tend to practice in urban or more highly resourced areas.14–16 FPs, who practice obstetrics and perform deliveries, are more likely to work in rural settings but their numbers have been declining.8,15–17 Community health centers (CHCs) by definition are located in medically underserved communities and a primary source of services, including obstetrics, to women of reproductive age. In 2018, CHCs served over 7.2 million women ages 15–44, representing 26% of the total CHC patient population and ∼12% or 1 in 8 women of reproductive age.18,19 Sixty percent of CHCs provided PNC without needing a referral and 74% of their patients started PNC in the first trimester.18 CHCs hire a variety of maternity care providers and staffing varies from CHC to CHC. In 2017, nationally, they reported employing 6117 FP FTEs, the largest group of physicians by far, providing over 17.7 million visits or 23% of all medical visits, and 1301 OB/GYN FTEs who provided 3.5 million visits or 5% of all medical visits.18 There were 9658 NPs working full-time at CHCs and providing over 24.1 million visits or 31% of all medical visits.18 CNMs represented 728 FTEs and over 1.5 million visits or 2% of all medical visits.18
According to the March of Dimes (MOD), a “maternity care desert” (MCD) is defined as “a county in which access to maternity health care services is limited or absent, either through lack of services or barriers to a woman’s ability to access that care.”8 A county deemed a “desert” does not have any hospital with obstetric care, birth centers and obstetric providers defined as OB/GYNs and CNMs (n=1095). A “limited access” county has less than 2 hospitals/birth centers and less than 60 providers per 10,000 births (n=610). In 2018, close to 150,000 infants were born to women living in “deserts” and another 311,686 infants in “limited access” counties for a total of 458,137 births.8 In addition, over 7 million women between the ages of 15 and 44 lived in “deserts”/“limited access” counties.8,14 Without access to routine, quality care, including maternity care, women “have an increased chance of maternal and infant mortality and morbidity.”8
This article aims to describe the results from our analyses of the geographic distance between CHCs and MCDs and its relationship with utilization of CHC-based maternity care providers. On the basis of prior research and the fact that CHCs are by design located in medically underserved areas (MUAs), we hypothesized that CHCs located closer to “deserts” would have higher numbers of visits for general practitioners, such as NPs and FPs, instead of specialists like OB/GYNs and CNMs.20 Specialist supply across the board tends to be lower in rural and MUAs and therefore NPs and FPs often provide the bulk of services in those areas.20 We conclude with a discussion of the possible implications for pregnant women’s access to care and for the women’s health workforce.
METHODS
Research Design and Primary Outcome
This study follows a cross-sectional design to explore whether relationships between distance to “desert” and utilization of maternity care services provided by CHCs could be confirmed through statistical analysis. The main outcome was CHC-level maternal health services utilization, which is a widely accepted measure of access to care.21–27 We operationalized utilization as the total number of visits to health care providers who are trained and certified to provide maternity care services, including OB/GYNs, CNMs, FPs, and NPs. We included FPs because many are trained in obstetrics and NPs because they are trained women’s health providers who are licensed to deliver PNC. Both often staff clinics in harder-to-reach areas, where CHCs tend to be located. However, NPs, unlike FPs, do not perform deliveries. We also operationalized utilization as the total number of PNC visits and total number of deliveries performed by CHC providers. For all utilization measures captured in the Uniform Data System (UDS), a visit is defined from the perspective of the provider; therefore, a visit equals one if the provider saw 1 patient. The UDS provides no information on encounter length and content, postnatal visits, or whether the visit was through emergency referral. Physician visits could include visits for Doctors of Osteopathy or Medical Doctors since CHCs employ both.
Data
Data came from: the 2017 Area Health Resource Files (AHRF), which provide county-level information on population characteristics and health care professionals and helped us classify counties as geographic areas without any maternity care providers supplying outpatient PNC and postpartum care; the 2017 UDS where federally funded CHCs report grantee-level data on site location, health care utilization and the workforce they employ; and the 2017 American Hospital Association (AHA) survey, which we used to classify counties as geographic areas without any hospital LD units or emergency departments (ED). All counties in the United States and Puerto Rico were included in the analyses (n=3234).
Independent Variables
The first independent variable in this analysis was the shortest straight-line distance from a CHC to its nearest county hub, operationalized as a county’s geographic center. Each CHC was linked to only one county based on distance. A county’s classification as a “desert” was the second independent variable. Counties fell into 1 of 4 categories—(1) non-“desert,” (2) “predelivery/postdelivery” MCD, (3) “LD” MCD, or (4) MCD without any outpatient/inpatient maternity care. (More details see Statistical Analyses Section below.)
Covariates
The selection of covariates was informed by prior empirical work using UDS data controlling for community characteristics28 and included: CHC characteristics from the UDS, Medicaid expansion status from the Kaiser Family Foundation, and county-level factors from the GW Workforce Institute 2017 County Demographics Masterfile.
Statistical Analyses
Counties with no registered OB/GYNs or CNMs were classified as predelivery/postdelivery MCDs (n=533); counties with no hospitals offering OB/GYN services, neonatal intensive care, pediatric ED, or general EDs were classified as LD MCDs (n=488); and 692 counties qualified as “deserts.” The total number of “desert”/“limited access” counties was 1713 (53% of all counties included in the study) in 2017. Figure 1 displays counties on the basis of these 4 classifications.
FIGURE 1.
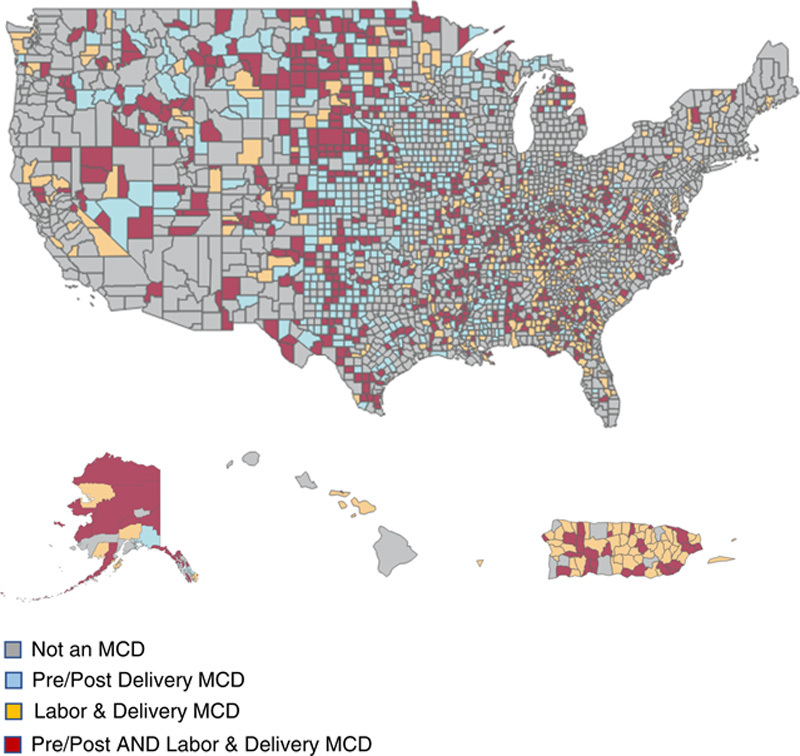
County maternity care desert classification. MCD indicates maternity care desert.
We geocoded 8415 CHC site locations and calculated the shortest straight-line distance between each site and its nearest county hub using QGIS version 3.6. However, since the UDS reports utilization at the health center level, and not the individual site level, we aggregated the 8415 site-level distances to 1261 center-level distances by averaging all the site-level distances for one center to obtain the average distance for that center. As a result, our regression sample was 1261 CHCs whose nearest county hubs were located in: (1) non-MCDs, (2) either type of MCDs, or (3) “deserts.”
We calculated descriptive statistics for county-level demographics and CHC characteristics and stratified results based on the 3 MCD classifications mentioned above. Tables 1 and 2 present these descriptive statistics.
TABLE 1.
County-Level Descriptive Statistics
| Mean (SD) | |||
|---|---|---|---|
| County-Level Demographic Characteristics | Non-MCD Counties (n=1521) | Counties That are One Type of MCD (n=1021)* | Counties That are Both Types of MCDs (n=692) |
| Poverty rate (%) | 14.72 (4.98) | 16.63 (5.98) | 18.95 (6.62) |
| All females (%) | 50.74 (1.47) | 50.14 (2.00) | 49.88 (2.80) |
| White females (%) | 75.23 (17.36) | 78.54 (19.70) | 73.66 (23.05) |
| Black females (%) | 13.63 (15.04) | 12.64 (17.75) | 16.16 (19.81) |
| Asian females (%) | 6.37 (7.75) | 2.59 (4.41) | 1.43 (2.01) |
| Native American females (%) | 1.56 (4.57) | 2.93 (7.96) | 6.45 (17.70) |
| Native Hawaiian females (%) | 0.31 (1.12) | 0.33 (1.28) | 0.1 (0.11) |
Total of1021 counties include either 533 pre-only/post-only MCD counties or 488 labor and delivery-only MCD counties.
MCD indicates maternity care desert.
TABLE 2.
CHC-Level Descriptive Statistics
| Mean (SD) | |||
|---|---|---|---|
| CHC-Level Characteristics | Nearest County is Non-MCD | Nearest County is One Type of MCD | Nearest County is Both Types of MCD |
| Distance to nearest county (miles) | 23.36 (83.81) | 20.86 (44.23) | 28.87 (87.10) |
| OBGYN clinic visits | 2819 (6304) | 2592 (6935) | 2732 (7861) |
| NMW clinic visits | 1376 (3619) | 703 (2582) | 937 (3304) |
| Family physician clinic visits | 13,304 (19,407) | 14,581 (23,880) | 12,929 (14,874) |
| NP clinic visits | 16,234 (19,163) | 18,913 (20,568) | 23,369 (26,489) |
| Prenatal care visits | 439 (742) | 351 (781) | 283 (613) |
| Deliveries performed by CHC provider | 142 (351) | 134 (372) | 124 (359) |
| Individuals at or below 100% FPL (%) | 47.13 (22.49) | 41.01 (21.53) | 41.15 (21.20) |
| Total patients | 20,585 (23,665) | 21,183 (27,470) | 21,502 (20,081) |
| White patients (%) | 38.03 (29.39) | 55.16 (28.67) | 56.41 (28.05) |
| Black patients (%) | 20.14 (23.71) | 16.18 (22.23) | 20.13 (24.41) |
| Asian patients (%) | 4.17 (11.19) | 1.46 (3.31) | 0.75 (1.34) |
| Native American patients (%) | 1.67 (7.60) | 3.31 (10.89) | 8.96 (23.87) |
| Native Hawaiian patients (%) | 0.91 (4.53) | 0.69 (3.06) | 0.28 (0.47) |
| Reproductive age women | 4,850 (5,730) | 4,774 (6,819) | 4,853 (4,973) |
| Uninsured patients (%) | 23.90 (16.53) | 25.06 (15.73) | 23.69 (15.57) |
| Average federal grants per patient ($) | 254.60 (224.73) | 353.87 (682.78) | 292.14 (187.31) |
CHC indicates community health centers; FPL, federal poverty level; MCD, maternity care desert; NMW, nurse midwife; NP, nurse practitioner; OBGYN, obstetrician-gynecologists.
We conducted ordinary least squares regression analyses to examine the association between MCD status and CHC distance to a county and maternal health services utilization, controlling for relevant CHC characteristics and county-level demographics. This approach minimized heteroscedasticity through the use of robust standard errors. All descriptive and regression analyses used cross-sectional data for the year 2017 and were conducted using Stata IC statistical software version 15.1 (StataCorp LLC).
RESULTS
Table 1 presents the demographic distribution in counties stratified by MCD classification. Counties that were any or both types of MCDs had, on average, higher poverty rates and higher proportions of Native American women compared with non-MCD counties.
Table 2 presents descriptive characteristics of CHCs stratified by the MCD classification of the nearest county. CHCs that were closest to counties that were any type of MCD had, on average, fewer CNM and PNC visits but more NP visits compared with CHCs that were closest to non-MCD counties. On average, CHCs that were closest to counties that were any type of MCD saw more White patients and Native American patients compared with CHCs that were closest to non-MCD counties.
Table 3 presents a number of statistically significant ordinary least squares regression results for the association between MCD status, CHC characteristics, and maternal health care utilization. CHCs that were closest to counties that were one type of MCD had 331 fewer CNM clinic visits and 1734 more NP clinic visits (P<0.05) compared with CHCs that were closest to non-MCD counties. What appears to be a dose-response relationship was observed between MCD status and NP clinic visits. CHCs located closest to counties that were both types of MCDs experienced 4997 more NP clinic visits (P<0.01) compared with CHCs that were closest to non-MCD counties, which represents almost 3 times (2.88) many more NP visits than the total number of NP visits at CHCs located closest to counties that lacked either hospital or outpatient maternity services in 2017 (n=1734).
TABLE 3.
Association Between CHC Distance and Maternal Care Utilization
| Variables | OBGYN Clinic Visits | NMW Clinic Visits | Family Physician Clinic Visits | NP Clinic Visits | Prenatal Visits | Deliveries Performed by Health Center Provider |
|---|---|---|---|---|---|---|
| Nearest county is either PP or LD MCD=yes | 148.85 | −331.48** | 544.39 | 1733.50** | −17.34 | −0.74 |
| (292.12) | (167.32) | (841.10) | (766.29) | (23.16) | (16.49) | |
| Nearest county is both PP and LD MCD=yes | 523.96 | −251.94 | −1645.65 | 4997.23*** | −56.60 | −8.46 |
| (566.06) | (331.53) | (1,163.92) | (1,520.61) | (46.41) | (28.00) | |
| Average distance to nearest county (miles): association between distance and utilization | 2.56 | 0.07 | −2.34 | −1.72 | 0.08 | 0.02 |
| (1.75) | (0.40) | (2.46) | (2.45) | (0.09) | (0.05) | |
| Number of patients at or below 100% FPL | −0.06 | 0.04 | −0.12 | −0.08 | 0.00 | 0.00 |
| (0.05) | (0.03) | (0.14) | (0.13) | (0.00) | (0.00) | |
| Number of patients between 100% and 200% FPL | 0.09 | −0.10 | 0.03 | −0.45 | −0.01 | −0.01 |
| (0.13) | (0.07) | (0.30) | (0.27) | (0.01) | (0.01) | |
| Number of patients above 200% FPL | 0.05 | 0.09 | 0.54 | 0.05 | −0.00 | 0.00 |
| (0.12) | (0.07) | (0.36) | (0.40) | (0.01) | (0.01) | |
| Total number of patients | −0.01 | −0.09** | 0.60*** | 0.36** | −0.00 | 0.01*** |
| (0.07) | (0.04) | (0.21) | (0.18) | (0.01) | (0.00) | |
| Number of White patients | −0.10** | −0.02 | 0.10 | 0.29** | −0.01*** | −0.00** |
| (0.05) | (0.03) | (0.11) | (0.13) | (0.00) | (0.00) | |
| Number of Asian patients | 0.03 | −0.01 | −0.07 | −0.21 | −0.01** | −0.01 |
| (0.09) | (0.03) | (0.21) | (0.12) | (0.00) | (0.00) | |
| Number of Native Hawaiian patients | −0.45 | −0.36** | 0.01 | 1.18 | −0.03 | −0.06** |
| (0.34) | (0.15) | (0.98) | (0.64) | (0.03) | (0.02) | |
| Number of Black patients | −0.06 | 0.02 | −0.33** | 0.25** | −0.02*** | −0.01** |
| (0.06) | (0.03) | (0.13) | (0.12) | (0.00) | (0.00) | |
| Number of Native American patients | −0.34** | 0.04 | 0.30 | −0.38 | −0.02 | −0.00 |
| (0.14) | (0.13) | (0.53) | (0.69) | (0.02) | (0.01) | |
| Number of women of reproductive age | 1.21*** | 0.69*** | 0.65 | 1.23 | 0.15*** | 0.03** |
| (0.28) | (0.13) | (0.87) | (0.66) | (0.02) | (0.01) | |
| Number of uninsured patients | −0.14** | −0.04 | −0.21 | 0.15 | −0.00 | −0.01*** |
| (0.07) | (0.04) | (0.27) | (0.18) | (0.01) | (0.00) | |
| Average federal grants per patient ($) | 0.29 | −0.04 | 0.04 | −0.95 | −0.00 | 0.01 |
| (0.23) | (0.10) | (0.47) | (0.58) | (0.02) | (0.01) | |
| Medicaid expansion status=yes | −391.56 | 277.89 | 806.08 | −171.55 | −22.79 | −40.86** |
| (284.19) | (166.12) | (1014.36) | (754.85) | (29.45) | (16.13) | |
| Persons in county living below poverty | 0.01 | −0.01 | −0.05*** | −0.01 | 0.00 | −0.00 |
| (0.01) | (0.00) | (0.01) | (0.01) | (0.00) | (0.00) | |
| County White female population | −0.00 | 0.00 | 0.01 | 0.00 | 0 | 0.00** |
| (0.00) | (0.00) | (0.01) | (0.00) | (0.00) | (0.00) | |
| County Asian female population | −0.01 | 0.00 | 0.02** | 0.01 | −0.00** | −0.00*** |
| (0.00) | (0.00) | (0.01) | (0.01) | (0.00) | (0.00) | |
| County Native Hawaiian female population | 0.01 | 0.04 | −0.04 | −0.11 | 0.01 | 0.01*** |
| (0.05) | (0.03) | (0.16) | (0.12) | (0.01) | (0.00) | |
| County Black female population | −0.00 | 0.00** | 0.03*** | −0.01 | 0.00 | 0.00 |
| (0.00) | (0.00) | (0.01) | (0.01) | (0.00) | (0.00) | |
| County Native American female population | −0.06 | −0.03 | 0.14 | 0.04 | −0.01*** | −0.00 |
| (0.04) | (0.02) | (0.11) | (0.11) | (0.00) | (0.00) | |
| Constant | −786.08** | −221.96 | −885.25 | 2,175.67** | −23.92 | −28.01 |
| (343.20) | (180.08) | (900.84) | (894.36) | (29.87) | (18.24) | |
| Observations | 1261 | 1261 | 1261 | 1261 | 1261 | 1261 |
| R 2 | 0.58 | 0.37 | 0.67 | 0.70 | 0.77 | 0.55 |
Robust standard errors in parentheses.
Visits=number of office visits for each provider type in 2017.
Deliveries=number of deliveries performed by CHC provider in 2017.
CHC indicates community health centers; FPL, federal poverty level; LD, labor and delivery; MCD, maternity care desert; NMW, nurse midwife; NP, nurse practitioner; PP, pre and post-delivery; OBGYN, obstetrician-gynecologists.
P<0.05.
P<0.01.
Table 3 shows that the average distance from a CHC to the nearest county was not significantly associated with any outcomes.
As the number of reproductive age women seen by a CHC increased by one, OB/GYN clinic visits increased by 1.21 (P<0.01), CNM clinic visits increased by 0.69 (P<0.01), PNC visits increased by 0.15 (P<0.01), and deliveries performed by CHC providers increased by 0.03 (P<0.05). As the total number of patients seen by a CHC increased by one, CNM clinic visits decreased by 0.09 (P<0.05), FP clinic visits increased by 0.6 (P<0.01), NP clinic visits increased by 0.36 (P<0.05), and deliveries performed by CHC providers increased by 0.01 (P<0.01). We also find that as the distance to the nearest county (regardless of MCD status) increased, FP and NP visits decreased and OB/GYN and CNM visits increased. However, none of these associations were statistically significant.
As the number of uninsured patients seen by a CHC increased by one, OB/GYN clinic visits decreased by 0.14 (P<0.05) and deliveries performed by CHC providers decreased by 0.01 (P<0.01). For CHCs located in Medicaid expansion states, there were 41 fewer deliveries performed by CHC providers compared with CHCs located in nonexpansion states (P<0.05). There were no differences in the average federal grant levels per patient.
At the county-level, there were a few statistically significant results (Table 3). It is important to take into consideration that the seemingly small but significant changes in maternal health services utilization occur when the number of patients/number of individuals in a population increase by just one. In practice, changes in numbers of patients/individuals are usually larger in magnitude, which implies that changes in utilization will consequently also likely increase.29 For example, based on these regression results, were the number of women of reproductive age seen by a CHC to increase by 100 women, then the total number of PNC visits would increase by 15 and the total number of deliveries by 3.
DISCUSSION
To our knowledge, this study is the first nationwide study to examine the availability of population-based services, more specifically maternal health services, offered by CHCs measured as visits to maternity care providers in relation to CHCs’ geographic distance to a “desert.”30 Our results support our hypothesis according to which CHCs located closer to MCDs would have more visits for NPs and FPs, who are general practitioners, than for specialists, such OB/GYNs and nurse midwifes. This finding is consistent with the existing literature, which shows that specialist supply across the board tends to be lower in rural and MUAs and therefore NPs and FPs fill in the gap.28 We also found that CHCs regardless of location near a MCD served a very high percentage of poor patients, which aligns with the CHC program’s mission and prior analyses, and that users of CHCs near either type of MCDs were disproportionately White and Native American, which comports with the characteristics of rural America. According to Census data, 78% of the population was White in rural areas/small towns compared with 64% nationally and more than half of all Native Americans resided in rural/small town areas.31,32
We used GIS software, which has been used successfully in prior, but very limited research on the “safety net” and geographic access to women’s health services.33 We found that the average CHC distance to the nearest “limited access” and “desert” county was 21 and 29 miles, respectively, and that the distance could be as high as 65 and 116 miles, respectively. Despite the dearth of published studies examining similar questions, our results appear consistent with findings on distance traveled by rural residents.34 More than half of the pregnant women in one rural state had to travel more than 40 miles to the hospital where they had their baby.28 Driving distances for pregnant women living in rural areas could reach 143 miles.35 Travelling more than 50 miles for PNC was associated with a higher percentage of women reporting developing high blood pressure and 3 times the likelihood of having hypertension compared with pregnant women who reported travelling fewer than 5 miles for PNC, suggesting that travel burden may contribute to this condition, which is a risk factor for maternal complications.36
This study did not find a statistically significant association between straight-line distance from a CHC to a nearby county and maternal health services utilization. This could be because straight-line distances do not take into account the actual topography and time it takes to travel. This finding is in contrast with the results from fewer than a handful of studies that found an association between traveled distance both in terms of miles and minutes and pregnant women’s health and birth outcomes. Trips from rural areas typically take on average ∼30% more time than the average 22 minutes.33 Sixty-one percent and 80% of the population was within a 30-minute and a 60-minute drive, respectively, to a hospital with a Level III Unit, which represents the most comprehensive maternal and newborn care and is only available in metropolitan areas.37 Between 2002 and 2013, in at least 9 states, driving distances to the nearest hospitals with obstetrics increased more for rural than urban women.38
Our study has several policy implications. Health centers in rural areas serve double the percentage of uninsured patients compared with the national average (22% vs. 11%) (GW analysis of 2019 UDS data, Jessica Sharac). According to MACPAC, 65% of uninsured rural women had a hospital birth, a much lower rate than the almost 100% for both Medicaid and privately insured, rural women.39 They also had the highest percentage of home births at about 25% compared with Medicaid and private insurance.39 While it could reflect a preference and a choice on the part of women, it could also be an indication of lack of access, given the almost 100% of Medicaid and privately reimbursed hospital deliveries in rural areas. The Health Resources and Services Administration (HRSA), which oversees the CHC program, and others, such as those involved in medical, nursing, and other clinical education, should ensure that there is an adequate supply, an appropriate capacity, and a more equal distribution of providers of maternity care. HRSA’s current loan repayment, the teaching health center, and the access points programs are all specific strategies that can be leveraged to this end by also targeting maternity care providers. In addition, the 2018 federal law, “Improving Access to Maternity Care Act” (Public Law No: 115-320), requires HRSA to designate maternal health professional shortage areas in order to better target resources. These maternal health professional shortage areas must be delineated within existing HPSAs, which are designated based on a ratio of health care professionals to the population. Since HRSA-funded CHCs are automatically designated HPSA facilities, this study may inform HRSA’s decision-making in fulfilling this Congressional mandate.
CHCs in rural locations also disproportionately serve Medicaid patients (34% vs. 19%) (GW analysis of 2019 UDS data, Jessica Sharac). In 2018, Medicaid-covered 17% of pregnant rural women, half of the births, and a disproportionate number of Native American pregnant women compared with other insurers. More Medicaid-covered than privately insured rural women smoked cigarettes before/during pregnancy and entered PNC late with fewer total visits, which have been associated with poorer birth outcomes.39 Although women with Medicaid coverage for LD tend to reside further away from hospital OB units than women with private insurance,33 almost all Medicaid-covered, rural women delivered at a hospital, when it is too late to address health issues. Health centers could establish smoking cessation programs specifically designed for their pregnant patients. Since the ACA of 2010, Medicaid pays for smoking cessation services and related drugs and items although state programs vary in the scope of services they provide.40 In addition, state Medicaid agencies per federal law must articulate maximum access time and distance standards in managed care contracts if their contractors’ networks cover OB/GYNs, hospitals, adult primary care providers, pharmacies among other providers and services. State standards vary greatly and typically distinguish between urban/rural and primary care provider/specialist/hospital, with maximum distances used more frequently than maximum travel time.41 Some states have additional requirements when contractors fail to meet access and choice standards regarding OB/GYNs. Massachusetts, for example, stipulates that when enrollees do not have a choice between two physicians, the contract “must demonstrate to [the state] that it meets this standard when factoring in OB/GYNs in a contiguous [r]egion or [r]egions that are within 15 miles or 30 minutes travel time from the [e]nrollee’s residence.”42,43 Other states could follow this example when renewing contracts.
Limitations
This exploratory study is cross-sectional. Therefore, it cannot ascertain causation or trends over time. In addition, this study used the shortest straight-line distance in miles as a proxy for CHC access, which likely underestimates the travel burden experienced by pregnant women seeking care who live in more remote areas with very limited access to maternity care. Straight-line distances may not be the most accurate measure of access since they do not take into account different terrains, travel time, availability of public transport, and other aspects of geographic distance that make travelling difficult and lengthy regardless of how short the straight-line distance might be. Finally, it is important to emphasize that all analyses, and as a consequence, findings, were at the CHC-level. Therefore, this study cannot be used to draw conclusions or inferences at the individual-level.
CONCLUSION
Our findings suggest that the status of counties based on MCD classifications has a significant association with the use of maternal health services. We find that CHCs experience significantly higher levels of NP office visits if they are located close to MCD counties as compared with non-MCD counties and that this association appears to follow a dose-response relationship. Clinic staffing mix also may be different between CHCs near a MCD and those that are not. Future studies should focus on better understanding the topography and real travel time involved in accessing CHCs as a more precise measure of access to care.
Footnotes
This research was supported by a Cooperative Agreement for a Regional Center for Health Workforce Studies, Bureau of Health Professions, Health Resources and Services Administration, US DHHS, Cooperative Agreement Award Number: U8126493.
The authors declare no conflict of interest.
Contributor Information
Anne R. Markus, Email: armarkus@gwu.edu.
Drishti Pillai, Email: drishti_pillai@gwu.edu.
REFERENCES
- 1.NY Times. It’s 4 A.M. The Baby’s Coming. But the Hospital Is 100 Miles Away. 2018. Available at: https://www.nytimes.com/2018/07/17/us/hospital-closing-missouri-pregnant.html. Accessed July 23, 2018.
- 2.Atlanta Magazine. In much of rural Georgia, maternal healthcare is disappearing. 2017. Available at: https://www.atlantamagazine.com/health/rural-georgia-maternal-healthcare-disappearing-joy-baker/. Accessed July 23, 2018.
- 3.Hung P, Kozhimannil K, Casey M, et al. Why are obstetric units in rural hospitals closing their doors? Health Serv Res. 2016;51:1546–1550. [DOI] [PMC free article] [PubMed] [Google Scholar]
- 4.Hung P, Henning-Smith C, Casey M, et al. Access to obstetric services in rural counties still declining, with 9 percent losing services. Health Affairs. 2017;9:1663–1671. [DOI] [PubMed] [Google Scholar]
- 5.The Texas Tribune. A shrinking number of rural hospitals still deliver babies. Here’s what that means for expecting moms. 2018. Available at: https://www.texastribune.org/2018/01/17/shrinking-number-rural-texas-hospitals-still-deliver-babies-heres-what/. Accessed July 23, 2018.
- 6.Washington Post. Closure of two D.C. maternity wards hurts low-income women most. 2017. Available at: https://www.washingtonpost.com/local/closure-of-two-dc-maternity-wards-hurts-low-income-womenmost/2017/10/28/753e4dee-ad06-11e7-9e58-e6288544af98_story.html?noredirect=on&utm_term=.f502db01bb08. Accessed July 23, 2018.
- 7.Lorch SA, Srinivas SK, Ahlberg C, et al. The impact of obstetric unit closures on maternal and infant pregnancy outcomes. Health Serv Res. 2013;48:455–475. [DOI] [PMC free article] [PubMed] [Google Scholar]
- 8.March of Dimes. Nowhere to go: maternity care deserts across the U.S. 2018. Available at: https://www.marchofdimes.org/materials/Nowhere_to_Go_Final.pdf Accessed June 23, 2020.
- 9.Agency for Healthcare Research and Quality. National Healthcare Quality Report. 2011. Available at: https://www.ahrq.gov/sites/default/files/wysiwyg/research/findings/nhqrdr/nhqr11/nhqr11.pdf. Accessed June 23, 2020.
- 10.Hall A, Harris Lemak C, Steingraber H, et al. Expanding the definition of access: it isn’t just about health insurance. J Health Care Poor Underserved. 2008;19:625–638. [DOI] [PubMed] [Google Scholar]
- 11.Eden A, Barreto T, Hansen E. Experiences of new family physicians finding jobs with obstetrical care in the USA. Fam Med Community Health. 2019;7:e000063. [DOI] [PMC free article] [PubMed] [Google Scholar]
- 12.Rayburn W, Petterson S, Phillips R. Trends in family physicians performing deliveries, 2003-2010. Birth. 2014;41:26–32. [DOI] [PubMed] [Google Scholar]
- 13.Tong S, Makaroff L, Xierali I, et al. Proportion of family physicians providing maternity care continues to decline. J Am Board Fam Med. 2012;25:270–271. [DOI] [PubMed] [Google Scholar]
- 14.Rayburn WF, Klagholz JC, Murray-Krezan C, et al. Distribution of American Congress of Obstetricians and Gynecologists fellows and junior fellows in practice in the United States. Obstet Gynecol. 2012;119:1017–1022. [DOI] [PubMed] [Google Scholar]
- 15.Eden A, Peterson L. Challenges faced by family physicians providing advance maternity care. Matern Child Health J. 2018;22:932–940. [DOI] [PubMed] [Google Scholar]
- 16.Patterson DG, Andrilla CHA, Garberson LA. The supply and rural-urban distribution of the obstetrical care workforce in the U.S. Policy Brief #168. WWAMI Rural Health Research Center, University of Washington. 2020. Available at: https://depts.washington.edu/fammed/rhrc/wp-content/uploads/sites/4/2020/06/RHRC_PB168_Patterson.pdf. Accessed June 24, 2020. [DOI] [PMC free article] [PubMed]
- 17.Baldwin L, Hart L, Rosenblatt R. Differences in the obstetric practices of obstetricians and family physicians in Washington State. J Fam Pract. 1991;32:295–299. [PubMed] [Google Scholar]
- 18.Health Resources and Services Administration. 2018. National Health Center Data. Available at: https://bphc.hrsa.gov/uds/datacenter.aspx. Accessed June 24, 2020.
- 19.Guttmacher Institute. Contraceptive Use in the United States. 2020. Available at: https://www.guttmacher.org/fact-sheet/contraceptive-use-united-states.
- 20.Xue Y, Smith J, Spetz J. Primary care nurse practitioners and physicians in low-income and rural areas, 2010-2016. JAMA. 2019;321:102–105. [DOI] [PMC free article] [PubMed] [Google Scholar]
- 21.Andersen RM. A behavioral model of families’ use of health services. Research Series. Chicago, IL: Center for Health Administration Studies, University of Chicago; 1968:25. Available at: https://chas.uchicago.edu/project/research-series/. [Google Scholar]
- 22.Anderson JG. Health services utilization: framework and review. Health Serv Res. 1973;8:184–199. [PMC free article] [PubMed] [Google Scholar]
- 23.Aday LA, Andersen R. A framework for the study of access to medical care. Health Serv Res. 1974;9:208–220. [PMC free article] [PubMed] [Google Scholar]
- 24.Andersen R, Aday LA. Access to medical care in the U.S.: realized and potential. Med Care. 1978;16:533–546. [DOI] [PubMed] [Google Scholar]
- 25.Phillips KA, Morrison KR, Anderson R, et al. Understanding the context of healthcare utilization: assessing environmental and provider-related variables in the behavioral model of utilization. Health Serv Res. 1998;33:571–596. [PMC free article] [PubMed] [Google Scholar]
- 26.Bradley E, McGraw S, Curry L, et al. Expanding the Andersen Model: the role of psychosocial factors in long-term care use. Health Serv Res. 2002;37:1221–1242. [DOI] [PMC free article] [PubMed] [Google Scholar]
- 27.Andersen R, Newman J. Societal and individual determinants of medical care utilization in the United States. Milbank Q. 2005;83:95–124. [PubMed] [Google Scholar]
- 28.Han X, Luo Q, Ku L. Medicaid expansion and grant funding increases helped improve community health center capacity. Health Affairs. 2017;36:49–56. [DOI] [PubMed] [Google Scholar]
- 29.Rosenbaum S, Paradise J, Markus A, et al. Community Health Centers: Recent Growth and the Role of the ACA. Washington, DC: Kaiser Family Foundation; 2017. [Google Scholar]
- 30.Mathis A, Barnes P, Shah G. Assessing gaps in the maternal and child health safety net. Popul Health Manag. 2013;16:270–275. [DOI] [PubMed] [Google Scholar]
- 31.Dewees S, Marks B.Twice invisible: understanding rural Native America. First Nations Development Institute. 2017. Available at: https://www.usetinc.org/wp-content/uploads/bvenuti/WWS/2017/May%202017/May%208/Twice%20Invisible%20-%20Research%20Note.pdf. Accessed March 31, 2021.
- 32.Parker K Menasce Horowitz J Brown A, et al. Demographic and economic trends in urban, suburban and rural communities. Pew Research Institute. 2018. Available at: https://www.pewresearch.org/social-trends/2018/05/22/demographic-and-economic-trends-in-urban-suburban-and-rural-communities/. Accessed March 31, 2021.
- 33.Gawron L, Pettey W, Redd A, et al. The “safety net” of community care: leveraging GIS to identify geographic access barriers to Texas family planning clinics for homeless women Veterans. American Medical Informatics Association. AMIA Ann Symp Proc. 2017;2017:750–759. [PMC free article] [PubMed] [Google Scholar]
- 34.Probst J, Laditka S, Wang J-Y, et al. Effects of residence and race on burden of travel for care: cross sectional analysis of the 2001 US National Household Travel Survey. BMC Health Serv Res. 2007;7:40. [DOI] [PMC free article] [PubMed] [Google Scholar]
- 35.Gjesfjeld C, Jung J-K. How far? Using geographical information systems (GIS) to examine maternity care access for expectant mothers in a rural state. Soc Work Health Care. 2011;50:682–693. [DOI] [PubMed] [Google Scholar]
- 36.Shi L, MacLeod K, Zhang D, et al. Travel distance to prenatal care and high blood pressure during pregnancy. Hypertens Pregnancy. 2017;36:70–76. [DOI] [PubMed] [Google Scholar]
- 37.Rayburn W, Richards M, Elwell E. Drive times to hospitals with perinatal care in the United States. Obstet Gynecol. 2012;119:611–616. [DOI] [PubMed] [Google Scholar]
- 38.Hung P, Casey M, Kozhimannil K, et al. Rural-urban differences in access to hospital obstetric and neonatal care: how far is the closest one? J Perinatol. 2018;38:645–652. [DOI] [PubMed] [Google Scholar]
- 39.MACPAC. Medicaid’s Role in Financing Maternity Care. Medicaid and CHIP Payment and Access Commission. 2020. Available at: https://www.macpac.gov/wp-content/uploads/2020/01/Medicaid’s-Role-in-Financing-Maternity-Care.pdf. Accessed March 31, 2021.
- 40.Pillai D. State and Medicaid tobacco control policies and their association with conventional and electronic cigarette use, quitting behaviors, and Medicaid spending on cessation products for low-income smokers [unpublished doctoral dissertation]. The George Washington University; 2021.
- 41.Lipson D, Libersky J, Bradley K, et al. Promoting Access in Medicaid and CHIP Managed Care: A Toolkit for Ensuring Provider Network Adequacy and Service Availability. Baltimore, MD: Division of Managed Care Plans, Center for Medicaid and CHIP Services, CMS, U.S. Department of Health and Human Services; 2017. Available at:https://www.mathematica.org/our-publications-and-findings/publications/promoting-access-in-medicaid-and-chip-managed-care-a-toolkit-for-ensuring-provider-network-adequacy. Accessed June 24, 2020. [Google Scholar]
- 42.Centers for Medicare and Medicaid Services. Promoting access in Medicaid and CHIP managed care: a toolkit for ensuring provider network adequacy and service availability. 2017. Available at: https://www.medicaid/gov/medicaid/downloads/adequacy-and-access-toolkit.pdf. Accessed June 24, 2020.
- 43.Commonwealth Fund. Provider networks and access in Medicaid managed care: a look at federal and state standards. 2018. Available at: https://www.commonwealthfund.org/blog/2018/provider-networks-and-access-medicaid-managed-care-look-federal-and-state-standards. Accessed July 7, 2020.