Abstract
Context:
The city homecare unit (CHU) of the Trivandrum Institute of Palliative Sciences was dissatisfied with the quality of care provided to their patient population.
Aims:
This study aims to improve the average satisfaction score of CHU during their daily homecare services.
Settings and Design:
The improvement project for the CHU activities was conducted with a prospective plan-do-study-act design, with stepwise application of improvement tools.
Materials and Methods:
The A3 quality improvement (QI) methodology, which uses tools for (i) analysing contributors (process mapping, cause-effect diagram); (ii) to derive key drivers (Pareto chart) and (iii) for measuring impact of interventions and sustainability (annotated run chart) was applied. The project was conducted as a mentored activity of the PC-PAICE program. The team’s weekly average satisfaction score was recorded prospectively as the outcome parameter, with 0 representing total dissatisfaction and 10 representing total satisfaction. Accuracy of triaging and appropriateness of registration process were the process parameters selected. These were recorded as run charts across the project period of 9 months.
Analysis and Results:
The cause-effect tool and the impact effort tool were used to analyse the mapped CHU processes. Even though we identified 22 contributors to the problem, eight of them were found to be significant. Key drivers were determined based on these eight and applied to the CHU processes. Over the project period, the satisfaction scores of the CHU improved significantly from 5.82 to 7.6 that is, satisfaction levels were high on most days. The triaging and registration goals were achieved. The team also built its own capacity for QI.
Conclusion:
The application of the A3 methodology simplified and streamlined efforts and achieved the quality goal for the CHU team.
Keywords: Quality improvement, Homecare, Palliative care, India, A3 methodology
INTRODUCTION
Background
The Trivandrum Institute of Palliative Sciences (TIPS) is a community-based Palliative Care Centre (PCC) at the state capital, Thiruvananthapuram with a vision to provide quality palliative care services to all those who need it. It has an outpatient and inpatient unit and also conducts a home-based care facility operating within a radius of 30 km around the PCC here instead of facility.
The homecare program is envisioned by the institution as a non-emergency essential service. The city homecare unit (CHU) serves an average of 400 patients at any point of time. The CHU includes a doctor, a nurse and a driver; with access to need-based support from the institution staff. The facility is nurse-led, with a doctor being available for specified visits on 4 days per week. In addition to the 21 days of planned homecare assigned per month, five extra doctor-led visits are usually made available to reassess and review patients.
The CHU members were dissatisfied with the quality of care they provided as they found it difficult to match their time, competence and resources with the intensity of care needs of patients seen. This problem was undermining the sense of purpose, efficacy and fulfilment in their work. This concern was taken up for the quality improvement (QI) project.
Objective
The primary objective was to improve the average satisfaction score of CHU during home visits from the baseline score of 5.8 to 7.5 or more where 0 indicated total dissatisfaction and 10 indicated total satisfaction with the quality of care provided to homecare patients.
In addition to the primary objectives, secondary objectives were identified at process level to help with better planning of home visits. The following processes were selected for improvement: (i) The appropriateness of registration of patients requesting for homecare and (ii) the accuracy of triaging of registered patients into minimal, moderate and intense care needs. The team mapped the whole process.
MATERIALS AND METHODS
A3 methodology for QI offered through the PC-PAICE Stanford-India Collaborative was applied for this study. The assigned international mentors from Stanford Medicine USA, Dr. Stephanie Harman and Dr. Sridhar Seshadri guided the TIPS team leaders through planned weekly virtual meetings. The process for change began with, stating the problem and the goals, clearly and concisely-Box 1.
Box 1:

Problem statement and SMART goal.
The QI methodology tools include problem statement, setting Specific, Measurable, Achievable, Relevant and Time bound (SMART) goal, analysing the current process, fishbone analysis, impact effort diagram, key drivers and interventions. The SMART goal includes outcome goal, process goal and balancing goal. These tools were applied further in two phases: (i) To understand the problem, analyse it and to determine most significant contributors to the problem and (ii) to determine impactful interventions to alleviate the most significant contributors to the problem and improve the quality of care provided through the CHU.
The QI project leaders explored practices, strategies and systems utilised by homecare teams from other parts of the country (Institute of Palliative Medicine – Calicut, Institute of Palliative Care – Thrissur and CanSupport – Delhi) with similar patient load, resources and cultural background.[1] As many had yet to publish their methods, we communicated directly with teams and collated the strategies utilised to balance the resources, with homecare needs in the region. Although there were no specific evidence-based strategies to ensure quality or effectiveness of homecare visits within the Indian scenario, two strategies were commonly used by the teams to organise their visits; (i) applying triaging criteria based on the intensity of care needs and (ii) an active field support team (FST) with defined roles.
All the CHU staff members met together to analyse the problem of dissatisfaction regarding the quality of delivered care. They studied the steps of CHU services and delineated the on-going processes of the CHU from registration of the patient, up to closure of the case file. The process map was analysed for contributors to the problem using the cause-effect tool – the fishbone analysis.
The outcome measure was recorded weekly. It was the average combined satisfaction score of doctors and nurse, on the quality of care they provided. The weekly recordings were maintained in the Microsoft Excel format, right through the 9 months of the QI project.
RESULTS
Phase 1 results
The above methodology helped to clarify factors contributing to the dissatisfaction with services by the CHU staff. Patients reached the CHU for registration through referrals from (i) community volunteers (70%), (ii) other healthcare professionals or hospitals within the city (25%) or (iii) as direct appointments by patients and families (5%). A sample survey of registration process showed that no formal criteria for registration to homecare facility were in place; and 20% of patients did not require home visits to address their needs. The only cause for exit from the homecare register was death of the person. The improvement of health that required transitioning out from CHU to outpatient follow-up was not adequately featured into the processes.
Of the 400 registered patients, 37.5% was seen at home monthly, 10% fortnightly and 2.5% weekly. Approximately 50% of patients were followed up through telephone and seen ad hoc, as per individual needs. Once registered, the home visits and their frequency were decided ad hoc by the CHU team members, based on perceived intensity of care needs, access, distance and duration of travel. There was no specific tool in operation for triaging.
The process improvement outcomes were accordingly selected; (i) improving the accuracy of the triage process from 33% to 66% while, (iii) maintaining appropriateness of registration process at the baseline level of 80%. We wanted to achieve the satisfaction for CHU, without compromising the number of patients seen in the homecare, as each patients, thus maintaining a balance between the quality of the care and quantity of the patients seen. Hence, we introduced the balancing metric, to ensure that the CHU should see at least 6 patients/day.
Although 6–7 patients were scheduled each day, the CHU ended up seeing 50% more patients (9–11 home visits) on an average. The extra visits were due to requests that came directly to CHU while on the road; (i) from new patients or (ii) visit requests from registered patients and (iii) requests from high profile members of the community.
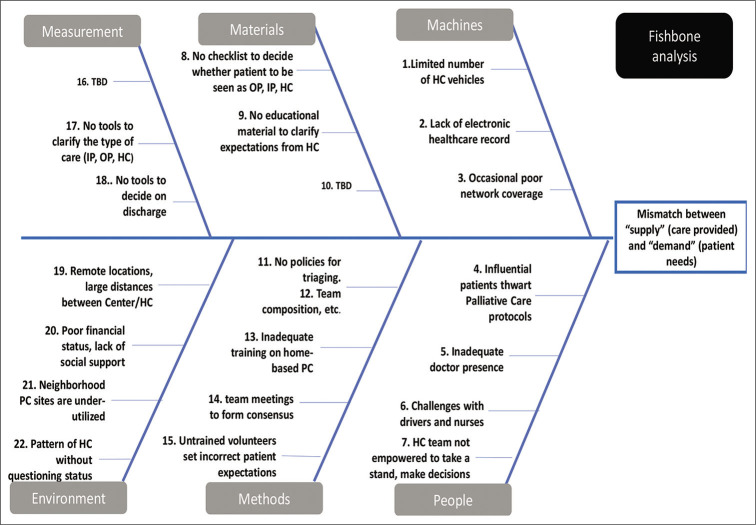
The cause-effect diagram (fishbone tool) surfaced the 22 contributors that affected the team’s ability to match their time, competence and resources, with the intensity of care needs for patients and family seen during the day [Figure 1].
Figure 1:
Fishbone analysis.
Phase 2 analysis and results
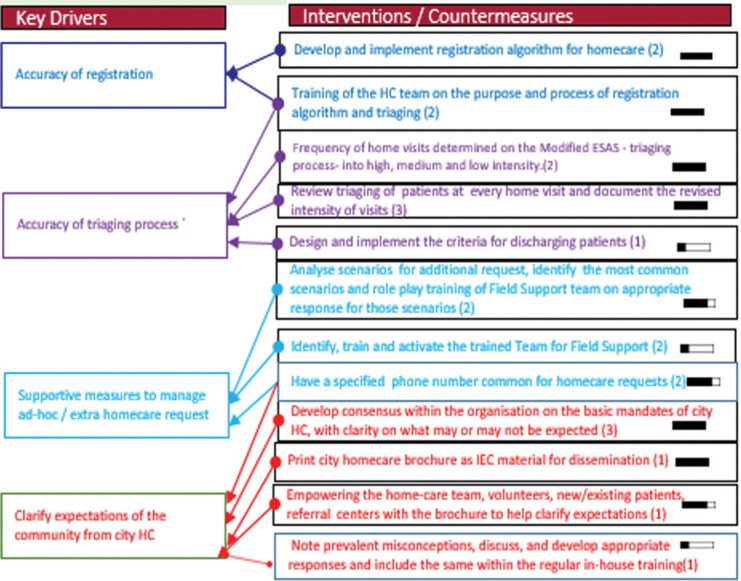
The contributors from the cause-effect diagram were then categorised using the 2x2 impact effort chart with effort on “X” axis and impact on “Y” axis [Figure 2 – impact effort chart]. The left upper quadrant of this box represented those contributors decided unanimously by the team to be most significant contributors. Even though 22 contributors were found, 8 of them were significantly contributing to the dissatisfaction of CHU. Modification of these eight contributors can positively influence the satisfaction of the care. Four key drivers derived from impact effort chart are; improving accuracy of registration, improving accuracy of triaging, providing supportive measures to manage ad hoc/ unplanned homecare and to clarifying expectations of the community from CHU.
Figure 2:
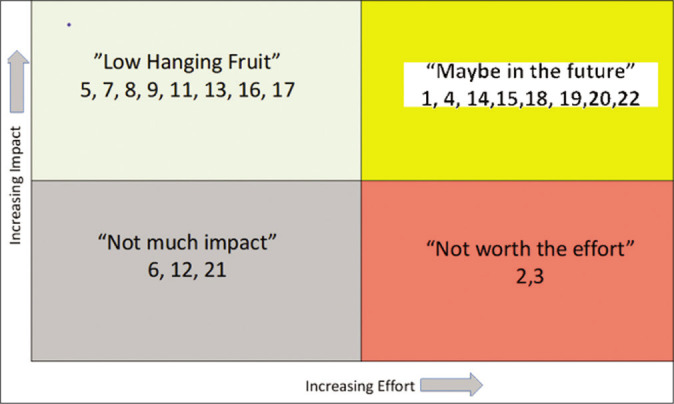
Impact effort chart.
Interventions were chosen accordingly, to activate the key drivers and match the time and resources with the intensity of care needs of patients the team visited. The key drivers and interventions are shown in Figure 3.
Figure 3:
Key drivers and interventions.
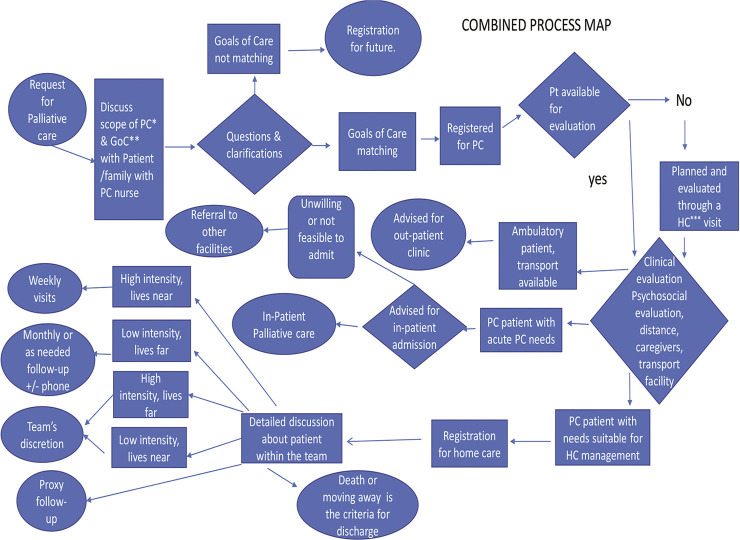
Each intervention was handed over to a team member who took the responsibility to implement it in a monitored time-bound manner. The processes of the CHU became gradually modified during the course of these interventions carried out over the next 4 months [Figure 4 – the combined process chart of registration, discharge and triaging].
Figure 4:
Combined process map of registration, discharge and triage.
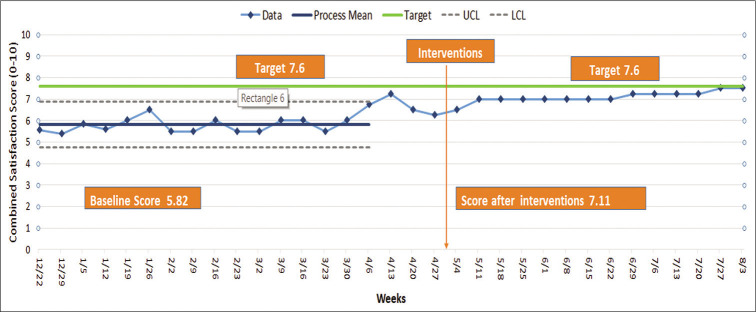
The run chart in Figure 5 shows the impact of the interventions on the satisfaction of CHU staff during the project period which progressively increased from baseline of 5.82–7.6 by the end of the project period of 9 months.
Figure 5:
Run chart for combined satisfaction score for nurse and doctor.
With regard to the process measures, the appropriateness of registration improved from 80% to 96% and accuracy of triaging from 33% to 98%.
DISCUSSION
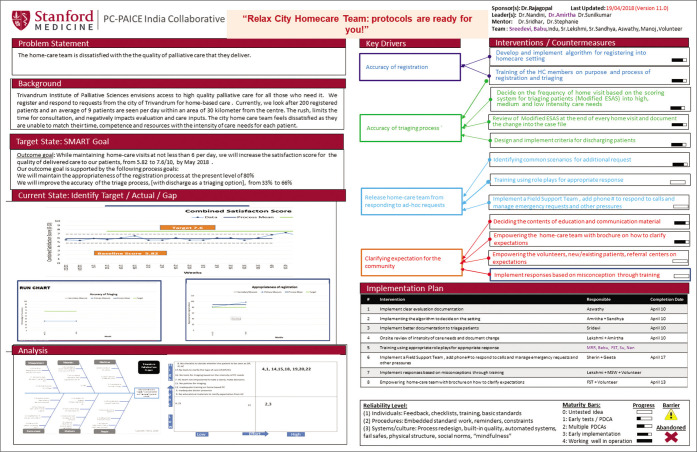
The A3 methodology is a problem solving and continuous improvement tool. It is also a visual report effectively communicating all of the pertinent information. In Figure 6, the A3 report of this team helped the team to visualise the sequential flow of events and summarises the journey across the improvement trajectory.
Figure 6:
A3 methodology report.
The problem stated at the beginning of the project could be impacted as envisaged using this methodology. Based on the learning from this project, the team was provided with clear protocols on initiating, organising and monitoring homecare service. Due to the consensual, inclusive approach of the improvement process, the administration became aware of the challenges of CHU, leading to discussions and the emergence of clear mandates that positively impacted all homecare services conducted by the institution.
The tangible outcomes were; (1) the CHU developed its own algorithms for homecare registration. This helped the nurse who initially evaluated the patient, to register only those for whom home was the optimum setting for providing care. The algorithm also prevented unnecessary registrations into the CHU. (2) Algorithm for triaging the registered homecare patients based on the intensity of their care needs was developed. The new algorithm scored patients’ care needs, using components of the Edmonton Symptom Assessment Scale during each home visit. Based on the scores, patients were categorised into those requiring high, medium and lowintensity homecare. (3) Establishment of a FST, for responding to logistical concerns and additional requests for unplanned homecare. A cell phone dedicated to the FST got duly sanctioned, which took away the burden of decision from the CHU on the road. The identified FST personnel, (experienced nurses), got trained and became competent to respond to the common scenarios of ad hoc extra visit requests. FST, as a single point contact has become an integral part of homecare services, (4) an additional homecare team got activated for important ad hoc requests for home visits and (5) a homecare brochure was developed and printed. This explained home-based care as a non-emergency service and described what may or may not be expected from the CHU. The FST phone number was prominently displayed as the contact number for communication. The brochure became an important information/education tool for patients, families, volunteers and the public.
The improvement has been sustained beyond the project period. Although only two members directly led the QI project, a large section of the clinical team engaged in discussions, consensus building and in selecting and implementing the interventions. Most interventions have since become integral to the daily processes of the CHU and integrated with the team ethos. For example: Triage is done at every home visit and homecare information contents have been integrated into the prescription booklet given to every patient. Overall, it was a win-win situation as the total visits per day was maintained at not <6 patients per day, as we strove to improve the quality of care delivered. This satisfied the pre-decided balancing measure for the project.
KEY LEARNING
Significance of working on problems and solutions with those directly involved in the process of homecare service. We learnt that real problems and feasible solutions emerge with direct engagement with the field-based team
Importance of monitoring the outcome measure: The run chart makes the impact visually evident for all to appreciate. This energised the team, allowed fine tuning as well as early withdrawals of ineffective interventions
Importance of engaging with the administration: The selection of the problem, key drivers and interventions stay in alignment with the larger vision of the institution through constant discussions with the management. The buy-in by the management ensured timely support for the project. The administration in turn got sensitised regarding ground-level concerns that needed to be acknowledged and addressed.
CONCLUSION
Improving quality is not a new theme and there are several methodologies that help to achieve it. Our team found the A3 methodology to be a very flexible tool. Being a consensus building process, it is sensitive to the work culture, the context and scope of the identified problem. Engaging in QI processes using A3 teaches patience and strengthens the reflective approach to problem solving. A3 provides a shared visual insight into the problem through its tools – the process maps, fishbone analysis; 2 × 2 chart to evolve the right key drivers, and applying interventions. The A3 methodology facilitated collective rational thinking and supported the efforts of the team to overcome an important quality concern that was central to the mandate of the institution.
Acknowledgment
We thank Dr. Seshadri and Dr. Harman for their disciplined approach and detailed mentoring that helped us learn the basic tenets of healthcare improvement science and contributed too much to the success of the project. We indebted the Institute of Palliative Medicine, Calicut; Institute of Palliative Care, Thrissur, and CanSupport, New Delhi, for the generous sharing of their homecare experiences and practices with us. We are very grateful to the management, the staff and team members of TIPS for their enthusiastic participation that made this project successful.
Footnotes
How to cite this article: Sunilkumar MM, Thampi A, Lekshmi S, Harman SM, Vallath N. “Relax City Homecare team; protocols are ready for you” – A quality improvement project conducted on behalf of the city homecare unit team at the Trivandrum Institute of Palliative Sciences. Indian J Palliat Care 2021;27(2):204-10.
Declaration of patient consent
Patient’s consent not required as there are no patients in this study.
Financial support and sponsorship
Nil.
Conflicts of interest
There are no conflicts of interest.
References
- 1.Yeager A, LaVigne AW, Rajvanshi A, Mahato B, Mohan R, Sharma R, et al. CanSupport: A model for home-based palliative care delivery in India. Ann Palliat Med. 2016;5:166–71. doi: 10.21037/apm.2016.05.04. [DOI] [PubMed] [Google Scholar]


