Abstract
Social isolation and loneliness have potent effects on public health1–4. Research in social psychology suggests that compromised sleep quality is a key factor linking persistent loneliness to adverse health conditions5,6. Though experimental manipulations have been widely applied to studying sleep/wakefulness control in animal models, how normal sleep is perturbed by social isolation is unknown. Here we report that chronic, but not acute social isolation reduces sleep in Drosophila. We use quantitative behavioral analysis and transcriptome profiling to differentiate acute vs. chronic social isolation brain states. Despite the animal’s uninterrupted access to food, chronic social isolation alters metabolic gene expression and induces a brain state that signals starvation. Chronically isolated animals exhibit sleep-loss accompanied by overconsumption of food, which resonates with anecdotal findings of loneliness-associated hyperphagia in humans. Chronic social isolation reduces sleep and promotes feeding through neural activities in the peptidergic fan-shaped body columnar neurons of the fly. Artificial activation of these neurons causes misperception of acute social isolation as chronic social isolation and thus results in sleep loss and increased feeding. These results together present a mechanistic link between chronic social isolation, metabolism, and sleep, addressing a long-standing call for efficient animal models focused on loneliness7.
Introduction
Fruit flies are social animals8,9, and exhibit dynamic social network structures and collective behaviors, which contribute to environmental sensing, foraging, feeding, fighting, mating, oviposition, circadian time setting and even the existence of “culture”10,11. These important aspects of social interactions imply that insects can provide suitable models to study how the objective absence of social relationships is perceived and represented in the brain.
Social experience affects sleep need in Drosophila12. Here we revisited these phenomena by exploring how social isolation affects sleep in flies that have prior social experience. We tested sleep behavior after maintaining 1, 2, 5, 25 or 100 male flies in a food vial for 7 days. Group housed flies, regardless of their group size (2, 5, 25 or 100), exhibit similar sleep profiles. In contrast, flies housed in isolation displayed a significant loss of sleep, mainly distributed during the daytime (Extended Data Fig. 1 and Supplementary Information).
Acute vs. Chronic Social Isolation
We next manipulated the duration of social isolation: flies were either isolated or housed in a group of 25 flies for 1, 3, 5, or 7 days, before measuring sleep in a Drosophila Activity Monitor (DAM) (Fig. 1a). Sleep profiles assessing proportion of time spent sleeping in consecutive 30min segments over 24 hours, demonstrated that chronic social isolation (5 and 7 days, Fig. 1d and e) changes sleep architecture primarily during the daytime and especially during an interval of several hours following dawn (lights on). While short durations of social isolation (1 and 3 days, Fig. 1b and c) did not produce sleep loss, chronic social isolation (5 and 7 days) significantly reduced daily total sleep, daytime sleep and ZT0-4 sleep (Zeitgeber Time 0–4, corresponding to the first 4 hours following lights on in a Light Dark (LD) cycle) (Fig. 1f–i).
Fig. 1: Sleep is reduced by chronic but not acute social isolation in Drosophila.
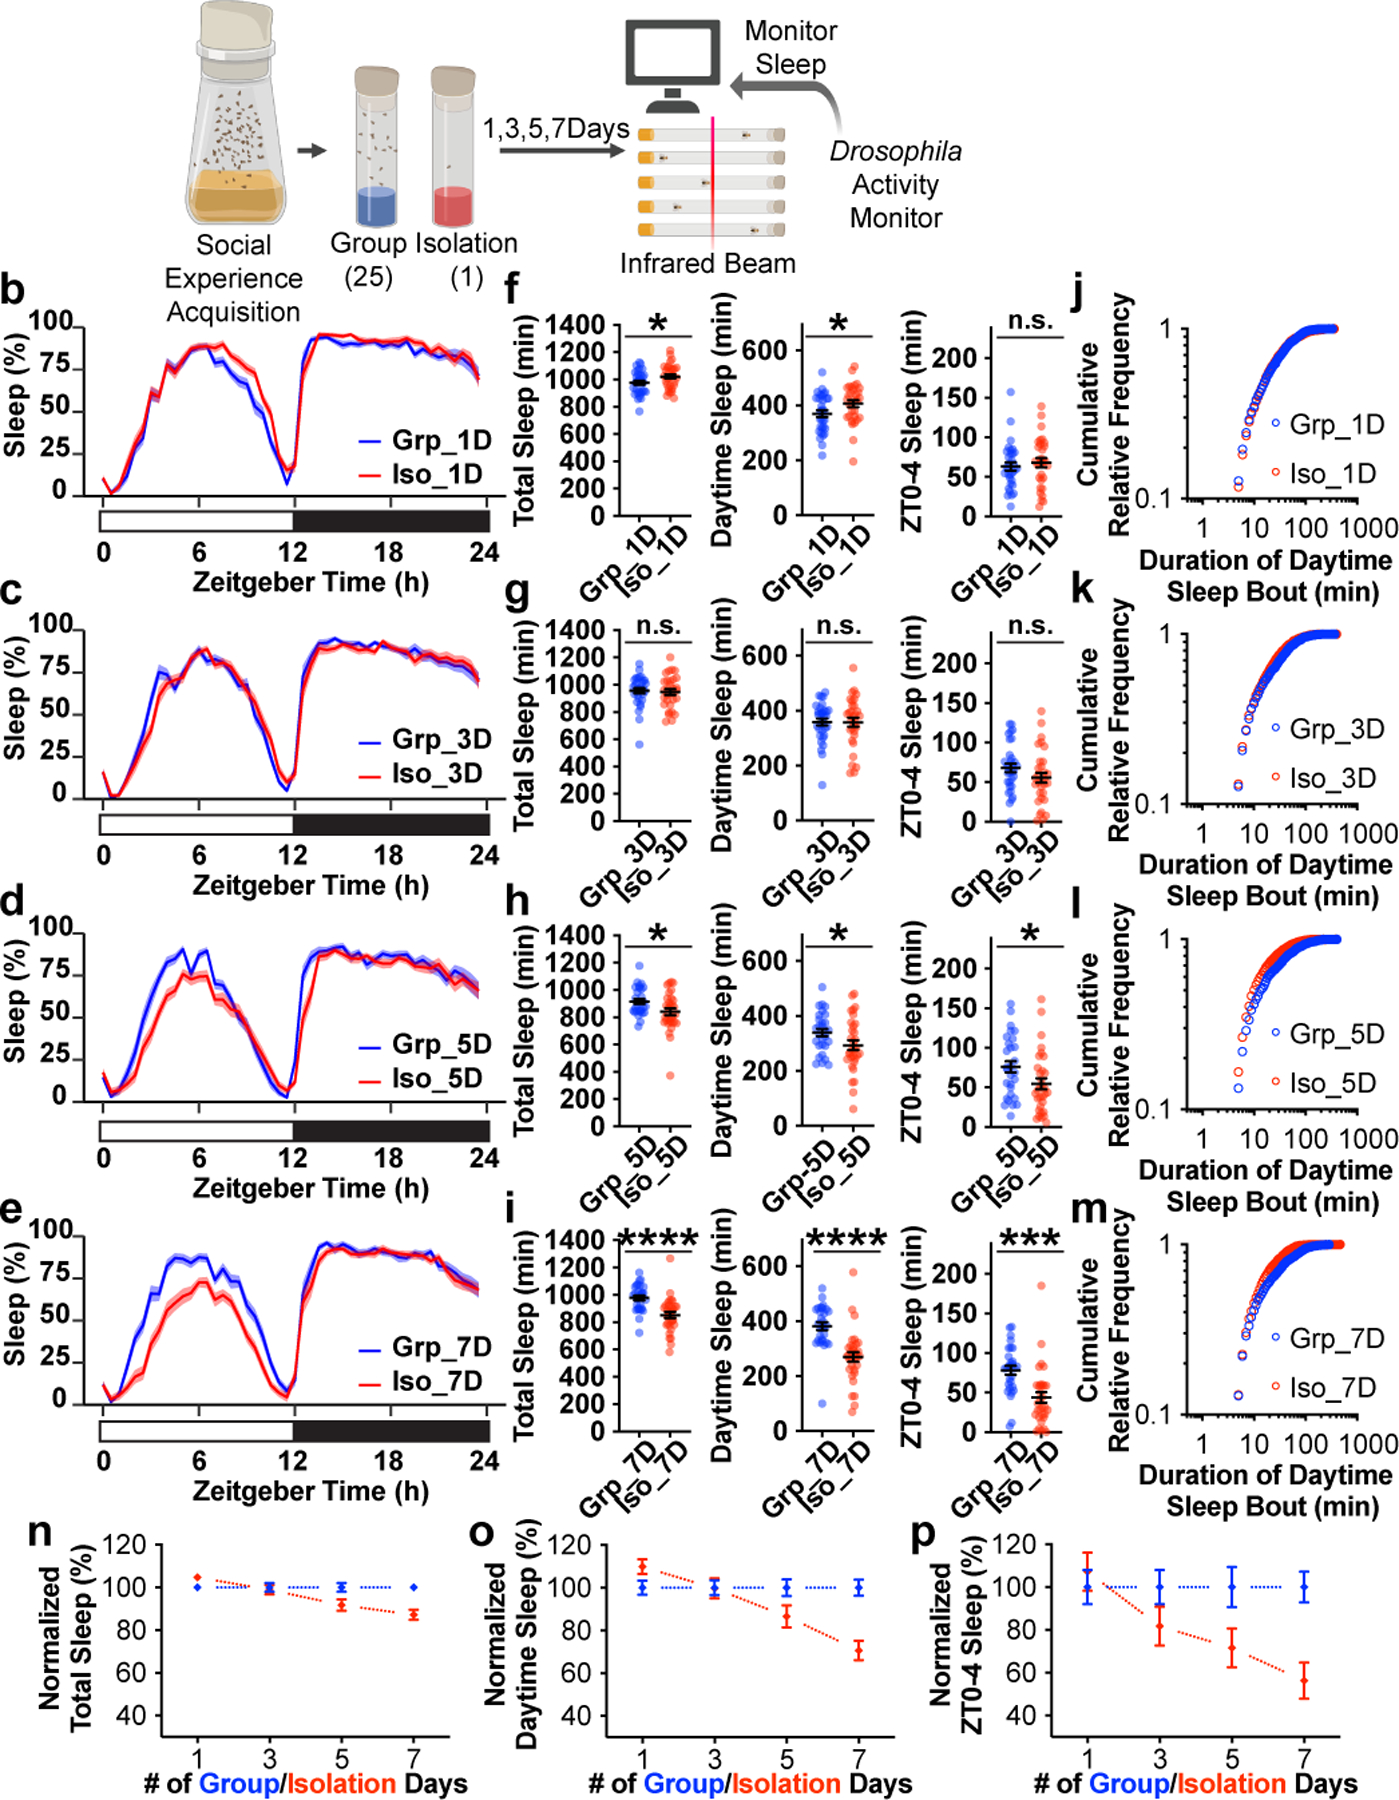
a, Schematics of measuring sleep using Drosophila Activity Monitors after 1, 3, 5 or 7 days of group enrichment/social isolation. b–e, Sleep profiles (displayed as the average proportion of time spent sleeping in consecutive 30min segments during a 24hr LD cycle; solid line, Mean; shaded area, ±SEM) of flies after 1 (b), 3 (c), 5 (d) and 7(e) days of group enrichment/social isolation. f–i, Quantification (Mean±SEM with individual data points) of daily total sleep, daytime sleep and ZT0-4 sleep for flies after 1 (f), 3 (g), 5 (h) and 7(i) days of group enrichment/social isolation. j–m, Plots of cumulative relative frequency for distributions of daytime sleep bouts for flies after 1(j), 3 (k), 5 (l) and 7(m) days of group enrichment/social isolation. (See Extended Data Fig. 2a–d for density plots of the same dataset). n–p, Normalized (Mean±SEM) daily total sleep (n), daytime sleep (o), and ZT0-4 sleep (p) along social isolation/group enrichment process of up to 7 days. For each group enrichment/social isolation duration, sleep parameters for socially isolated animals were normalized to its group-treated counterparts. For b–i and n-p, N=29–32 animals; two-sided unpaired t-tests with Welch’s correction; *P<0.05, **P<0.01, ***P<0.001, ****P<0.0001. For N and P values, see the Source Data.
To observe how social isolation alters daytime sleep bouts, all daytime sleep bouts from all animals tested for a given condition were pooled and their distributions were plotted as cumulative relative fractions for bout lengths. Acute social isolation (1 day) produced sleep bout distributions that were indistinguishable from their group treated counterparts (Fig. 1j and Extended Data Fig. 2a). Social isolation for 3 days produced slightly different sleep bout distributions in comparison to their group treated counterparts (Fig. 1k and Extended Data Fig. 2b). However, no deficit was detected in either total daily sleep, daytime sleep or ZT0-4 sleep in these flies (Fig. 1g). Longer intervals of social isolation (5 and 7 days) produced significantly different distributions compared to their group treated counterparts (Extended Data Fig. 2c and d). Cumulative relative frequency curves from chronically isolated animals climbed faster than those of their group treated counterparts as shorter sleep bouts accumulate (5 and 7 days, Fig. 1l and m). Over the course of a 7-day interval of isolation, daily total sleep, daytime sleep and ZT0-4 sleep all shortened progressively (Fig. 1n–p).
In addition, age matched flies were used to rule out the possibility that chronic social isolation induced sleep loss because the flies were older (Extended Data Fig. 3a–e). Chronic social isolation (7 days) induced sleep loss consistently in various isogenic strains, in aged (4-week-old) wild type animals, and in Sleep Inbred Panel strains with different baseline levels of sleep (Extended Data Fig. 3, 4 and Supplementary Information).
Chronic social isolation induces hunger
We prepared RNA-sequencing (RNA-seq) libraries for three conditions: socially enriched animals (group treated, “Grp”), chronic isolation animals (isolated for 7 days, “Iso_7D”) and acute isolation animals (isolated for 1 day, “Iso_1D”). Raster plots demonstrate sleep bouts of individual animals during a 24hr period measured immediately after group enrichment/social isolation. Under the “Iso_7D” condition, daytime sleep is reduced and much more fragmented than under “Grp” and “Iso_1D” conditions (Fig. 2a–c). Fly heads were collected from ZT0.5 to ZT2 (shown in gray bars in Fig. 2a–c), a window of time within ZT0-4 immediately preceding significant loss of daytime sleep in “Iso_7D” animals compared to “Grp” or “Iso_1D” animals. Using differential gene expression analyses, intersectional and clustering strategies, we identified candidate genes underlying chronic social isolation induced sleep loss. These 214 candidate genes showed expression difference in both “Iso_7D vs. Iso1D” and “Iso_7D vs. Grp” comparisons and underwent unidirectional change during the process of chronic social isolation (Extended Data Fig. 5a–d and Supplementary Information). Gene ontology enrichment analysis suggested that these 214 genes are enriched for biological pathways associated with “oxidation-reduction” processes (P value = 1.92E-18), “one-carbon metabolic” processes (P value = 1.38E-06) and “carbohydrate metabolic” processes (P value = 4.74E-06). The rest of the gene ontology of biological pathways further showed a strong preference for metabolic functions, such as fatty acid, pyruvate, glucose and amino acid metabolic processes. Consistent with the sleep loss phenotype, “sleep” was also among the most overrepresented gene ontology for biological pathways (Extended Data Fig.5e and Supplementary Information)
Fig. 2: Chronic social isolation induces a starvation gene expression program and results in excessive feeding.
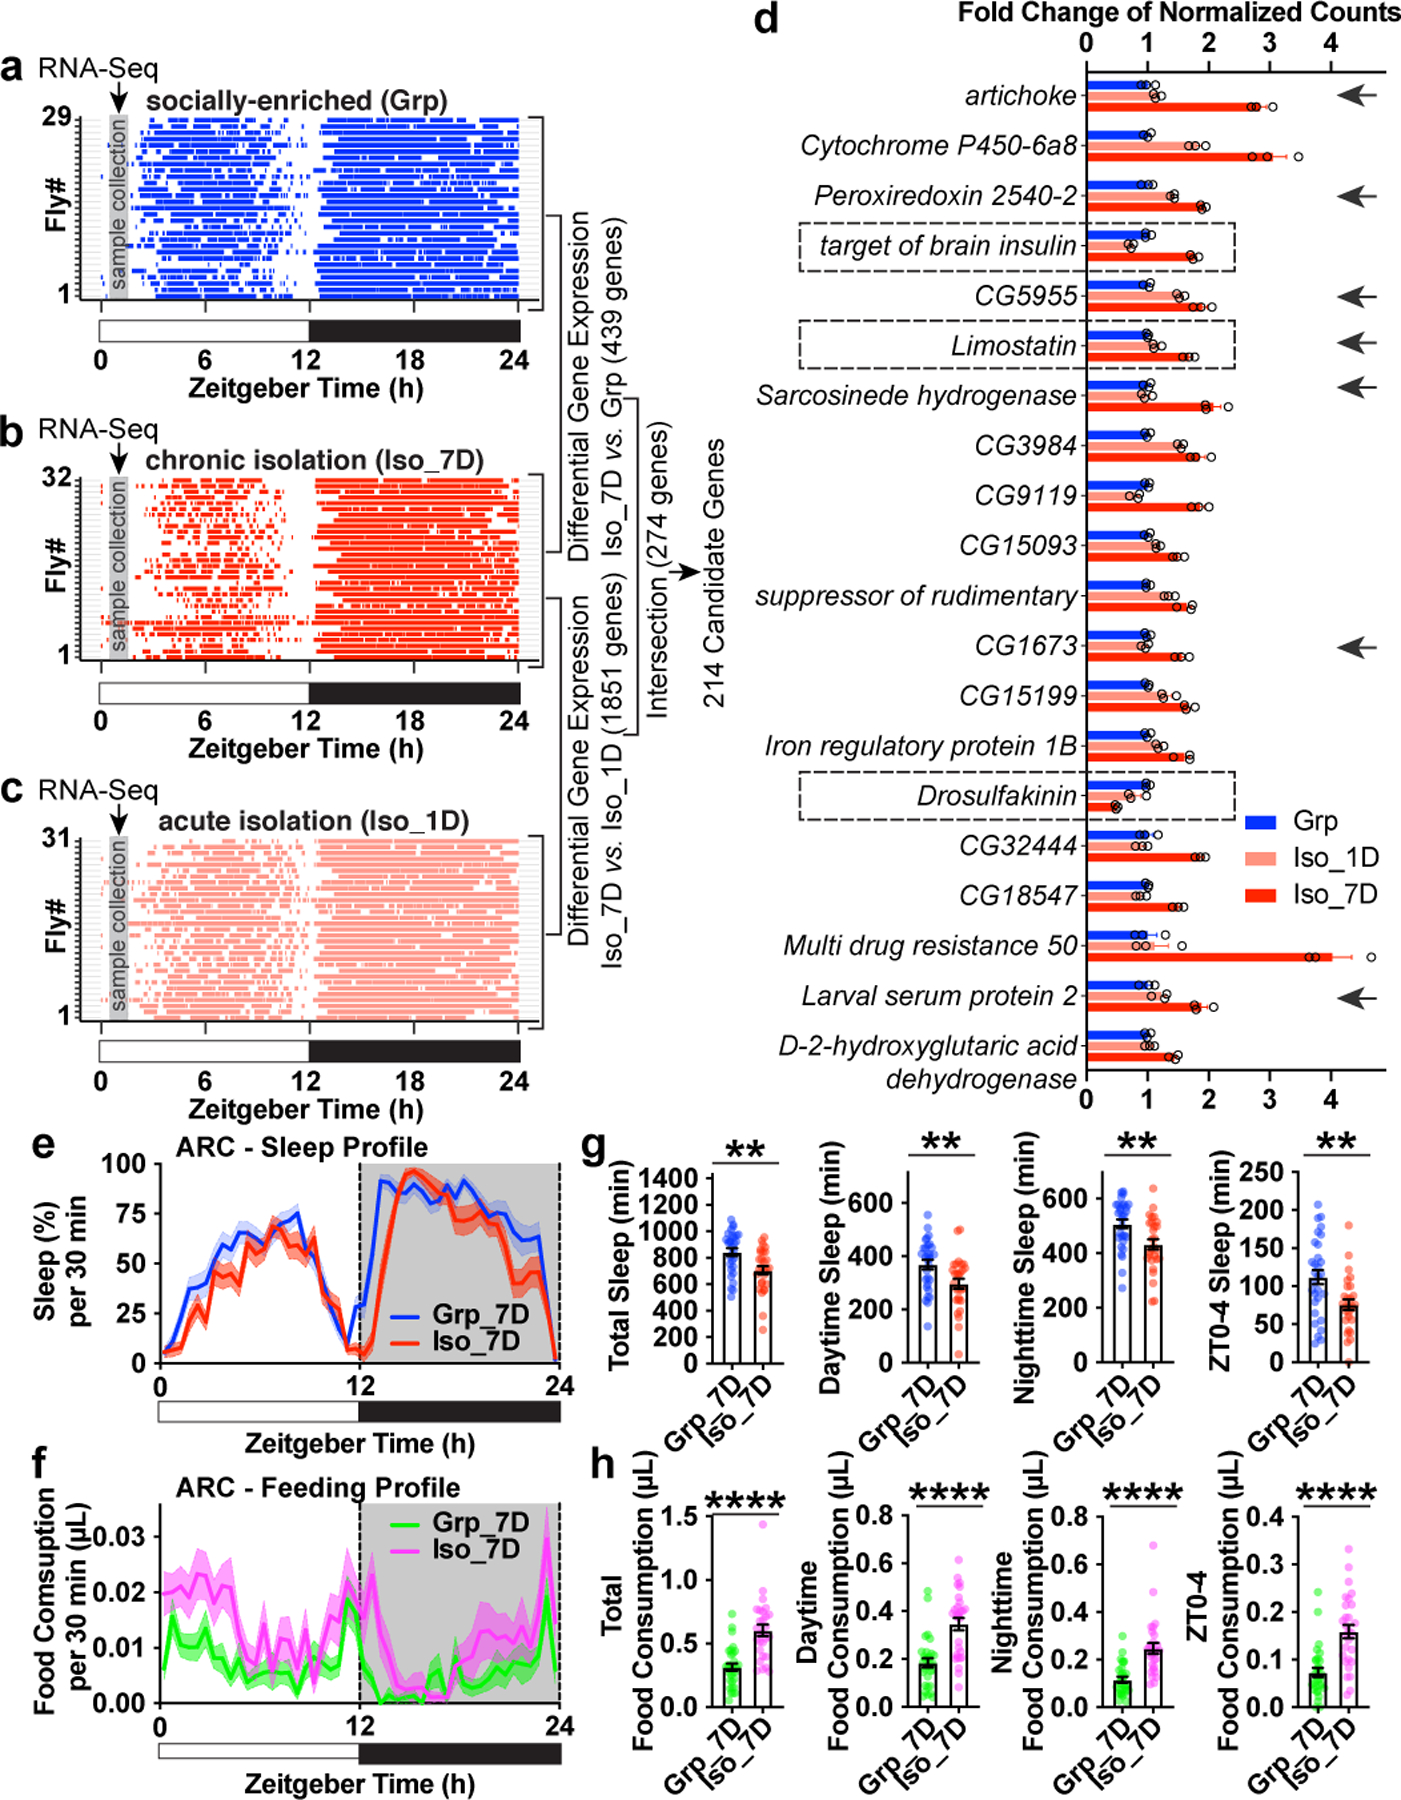
a–c, Raster plot of sleep bouts of individual animals after group enrichment (Grp) (a), 1 day acute social isolation (Iso_1D) (c) and 7 days chronic social isolation (Iso_7D) (b). Each row is an individual animal, with each colored bar representing sleep bouts within a 24hr LD cycle (blue for group enrichment, red for chronic social isolation and light red for acute social isolation). Gray vertical bars indicate a ~1.5hr time window (ZT0.5-ZT2) used for collecting fly heads for RNA-Seq. 29–32 representative animals are shown for each condition. Differential gene expressions were conducted between “Iso_7D vs. Grp” and “Iso_7D vs. Iso_1D”. 274 genes were identified within the intersection of these two comparisons. 214 candidate genes were identified using a clustering approach (Extended Data Fig. 5 and Supplemental Information). d, Fold changes (Mean±SEM) of normalized counts of the top 20 candidate genes (ranked by adjusted P-value in the comparison of “Iso7 vs. Grp”) (N=3 samples). Arrows indicate genes that are regulated after 24hr starvation16. e–f, Sleep (e) and feeding (f) measured by ARC (Activity Recording Capillary Feeder) assay in flies following 7 days of group enrichment/social isolation. Sleep profile is presented as the average proportion of time spent sleeping in consecutive 30min segments during a 24hr LD; Solid line, Mean; Shaded area, ±SEM. Matching average feeding profile is presented as average food consumption (μL) in consecutive 30min segments during a 24hr LD cycle; Solid line, Mean; Shaded area, ±SEM. g, Quantification (Mean±SEM with individual data points) of daily total sleep, daytime sleep, nighttime sleep and ZT0-4 sleep for flies after 7 days of group/social isolation treatment. h, Quantification (Mean±SEM with individual data points) of daily total food consumption, daytime food consumption, nighttime food consumption and ZT0-4 food consumption for flies after 7 days of group enrichment/social isolation. For e-h, N=28–30 animals; two-sided unpaired t-tests with Welch’s correction; *P<0.05, **P<0.01, ***P<0.001, ****P<0.0001. For N and P values, see the Source Data.
Among the top 20 genes in this list, Limostatin, which increased 1.67-fold after chronic isolation (Fig. 2d, ranked No. 6), and Drosulfakinin, which decreased 2.03-fold after chronic isolation (Fig. 2d, ranked No. 15) stood out. Limostatin is a decretin hormone that is induced by starvation and suppresses insulin release13. Drosulfakinin, a satiety-inducing cholecystokinin-like peptide, is secreted when the animal is fed14. As a signal of satiety, Drosulfakinin is depleted under starvation conditions. A third gene, target of brain insulin (tobi), also increased significantly during chronic social isolation (1.76-fold increase after chronic isolation, Fig. 2d, ranked No. 4). tobi encodes an α-glucosidase regulated by Drosophila insulin and glucagon analogs15. In addition, 7 of these top 20 genes and 32 of the total 214 candidate genes were previously identified as genes being regulated after 24hr starvation in Drosophila heads16 (Fig. 2d, and Supplemental Information). Thus, from a transcriptomic perspective, the brain of a fly maintained in chronic social isolation highly resembles the brain of a starving fly, despite the animal’s continuous access to food. We reasoned that such a “starvation brain state” may broadly affect gene expression associated with metabolic processes. Massive changes in mitochondrial functions and oxidation/reduction processes (Extended Data Fig.5e) could be direct consequences of starvation and/or elevated feeding.
We employed the Activity Recording Capillary Feeder (ARC) assay, a video recording (CApillary FEeder) (CAFE) assay that monitors sleep and feeding behaviors simultaneously and continuously in individual Drosophila17. ARC assays validated the isolation-induced sleep loss phenotype previously observed with DAM assays: daily total sleep, daytime sleep and ZT0-4 sleep are reduced significantly after 7 days of social isolation. In addition, nighttime sleep reduction was also observed (Fig. 2e and g) probably due to higher sensitivity in detecting movements using the positional tracking method, or differences in chamber shape and food source between the ARC and DAM systems. As predicted from the gene expression profiling results, we observed increased feeding in socially isolated animals compared to their group-treated counterparts (Fig. 2f and h). Significant increases in total food consumption, daytime food consumption, nighttime food consumption and ZT0-4 food consumption were observed in animals isolated for 7 days in comparison to animals group-treated for 7 days. Extended Data Fig. 6a–b shows sleep and feeding profiles in representative individual animals. Chronic social isolation thus induces a starvation state in Drosophila at both the gene expression level in the brain, and at the behavior level.
The altered feeding pattern produced by chronic social isolation is not merely a consequence of sleep loss because classic sleep mutants all exhibited normal feeding behavior (Extended Data Fig. 6c–e)18–20. Strong increase in food consumption was not observed in animals under acute social isolation (Extended Data Fig. 6f–g).
Neurons for isolation-induced sleep loss
Candidate gene Limostatin (CG8317, LST) is normally induced by nutrient restriction in endocrine neurons in the corpora cardiaca13. However, our RNA profiling experiment suggested that there could be a previously unknown brain source for LST production (Data Fig. 7a–b and Supplementary Information). A resource of high-resolution transcriptomes of 100 GAL4 driver lines suggested that cells labelled by the driver line NPF-GAL4 (NPF, neuropeptide F, the fly homolog of neuropeptide Y) are likely to express LST21. Using a monoclonal antibody against LST13, co-localized LST immunoreactivity and NPF-GAL4 driven GFP signals were detected (Fig. 3a). Among six known neuronal clusters that express NPF (Extended Data Fig.7c–d), LST immunoreactivity appeared to be co-localized with NPF-GAL4 driven GFP signals at the dorsal stratum of the fan-shaped body (dorsal fan-shaped body, dFB) and in a cluster of small cell bodies in the dorsal brain (Fig. 3a). Neurons composing this cluster of NPF cells without known function were previously named P2 (Extended Data Fig. 7c–d)22. A recent study utilized a split-GAL4 driver, SS0020-split-GAL4 (abbreviated as P2-GAL4 below), to strongly label the majority of LST/NPF immunoreactivity-positive P2 neurons22 (Fig. 3b).
Fig. 3: P2 neurons are required for chronic social isolation-induced sleep loss.
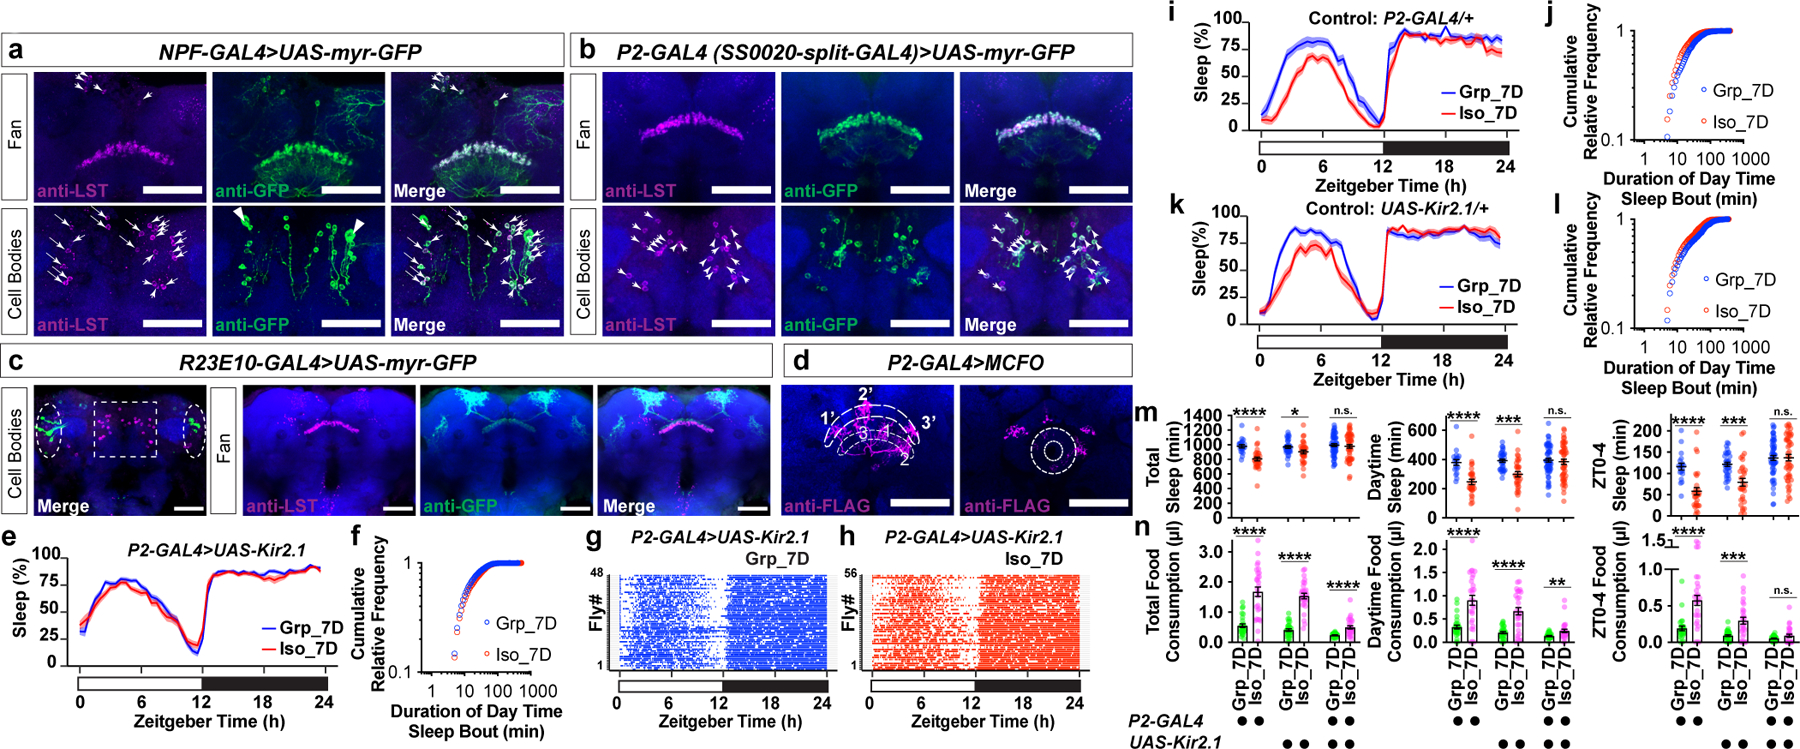
a, LST-immunoreactivity-positive cells overlaps NPF-GAL4-labelled fan-shaped body neurons at fan layer and cell bodies levels. Arrowheads: LST-immunoreactivity-positive cell bodies (magenta) that are also NPF-GAL4 positive (green). Triangles: NPF P1 neurons. b, LST-immunoreactivity-positive cells overlap P2-GAL4(SS0020-split-GAL4)-labelled NPF P2 neurons at fan layer and cell bodies levels. Arrowheads indicate the majority of LST-immunoreactivity-positive cell bodies (magenta) are also P2-GAL4-positive (green), consistent with previous report that P2-GAL4 labels ~85% NPF P2 neurons22. c, Expression pattern of R23E10-GAL4 (dashed ovals: cell bodies) and distribution of LST-immunoreactivity-positive cells (dashed square: cell bodies) (a–d, blue: N-cadherin, scale bar: 50μm). d, Fan-shaped body projections of three P2 neurons are decorated by FLAG tag (magenta). Each arborizes at a column of the lower layer of the FB (thinner dashed line) and projects to a different column of the higher layer of the FB (thicker dashed line, projections: 1->1’, 2->2’, 3->3’). These three neurons also arborize at the ellipsoid body level (donut-shaped area) (blue: Bruchpilot, scale bar: 50μm). e–h, Sleep profile (e), sleep bouts distributions (f) and sleep bouts raster plots (g and h) of flies expressing UAS-Kir2.1 with P2-GAL4 after group enrichment/social isolation for 7 days (N=48–56 animals). i–l, Sleep profile (i, k) and sleep bouts distributions (j, l) of parental control flies after group enrichment/social isolation for 7 days (N=19–32 animals). m, Quantification (Mean±SEM with individual data points) of daily total sleep, daytime sleep and ZT0-4 sleep for all experimental and heterozygous control flies. n, Quantification (Mean±SEM with individual data points) of daily total, daytime, and ZT0-4 food consumption for all experimental and heterozygous control flies (N=27–30 animals). Sleep profiles are displayed as the average proportion of time spent sleeping in consecutive 30min segments during a 24hr LD cycle; solid line, Mean; shaded area, ±SEM. For m–n, two-sided unpaired t-tests with Welch’s correction; *P<0.05, **P<0.01, ***P<0.001, ****P<0.0001. For N and P values, see the Source Data.
Notably, the projections of the LST/NPF-immunoreactivity-positive P2 neurons overlap with the axonal projections of the dorsal fan-shaped body neurons labelled by R23E10-GAL423,24, suggesting that P2 neurons may signal to sleep-promoting dorsal fan-shaped body neurons. At the cell body level, P2 neurons are different from the R23E10-GAL4 labelled cells (Fig. 3c). Using a MultiColor FlpOut (MCFO) approach25, individual neurons labelled by P2-GAL4 can be decorated stochastically, revealing that they are fan-shaped body columnar neurons (Fig. 3d and Supplementary Information). The hemibrain connectome26 allowed us to determine that P2 neurons include, as a dominant constituent, the hDeltaK cell type - a columnar cell class, where each neuron has a stereotypical dendritic input in the ellipsoid body (EB) in addition to the FB innervation26,27 (Fig. 3d and Supplementary Information). hDeltaK cells exhibit extensive synaptic connection with a known subset of R23E10-GAL4-labelled sleep promoting dFB neurons27 (Extended Data Fig. 8 and Supplementary Information). Based on the above connectome data and prior evidence for NPF/NPY’s role in animal metabolism and stress responses, we focused on P2 neurons.
To test whether P2 neurons play a role during chronic social isolation induced sleep loss, we chronically silenced these neurons by expressing the inward-rectifying potassium channel Kir2.128 under the control of P2-GAL4. In animals carrying both P2-GAL4 and UAS-Kir2.1, the sleep profile of isolated animals is no longer different from their group-treated counterparts (Fig. 3e). The cumulative relative frequency curve of daytime sleep bouts for socially isolated animals no longer climbed faster than that of the group reared animals (Fig. 3f). Raster plots of sleep bouts in individual animals demonstrated little difference between chronically isolated and group-treated animals (Fig. 3g–h). No difference between isolated and group-treated animals was found for daily total sleep, daytime sleep, or ZT0-4 sleep (Fig. 3m). In contrast, in heterozygous parental control animals carrying either the P2-GAL4 or the UAS-Kir2.1 transgene, chronic social isolation robustly induced sleep loss (Fig. 3i–m). Temporally silencing P2 neurons using UAS-shibirets1 during group enrichment/social isolation did not block social isolation-induced sleep loss (Extended Data Fig. 7 h–n and Supplementary information). Though some chronic social isolation-induced overconsumption of food was still seen in animals carrying both P2-GAL4 and UAS-Kir2.1, chronic social isolation-induced excessive food consumption for ZT0-4 in these animals was blocked (Fig. 3n), and the increased level of consumed food for daytime was much smaller than that observed in parental controls (Fig. 3n and Extended Data Fig. 7e–g).
Misperceiving social isolation duration
Using [Ca2+]-imaging, we found the activity of P2 neurons is correlated with the flies’ locomotor activity (Extended Data Fig. 8). One might have expected that P2 neurons would be tonically more active in isolated animals compared to group-reared animals, but this is an effect that we could not detect in baseline [Ca2+] levels (Extended Data Fig. 8). Alternatively, we can hypothesize that locomotion drives more P2 neuron total activity during a 7-day duration than a 1-day duration of social isolation.
We therefore tested whether boosting activity in P2 neurons during acute social isolation (1 day) is sufficient to promote behavioral changes resembling chronic social isolation (7 days). To activate P2 neurons, we expressed a Drosophila warmth-gated cation channel, UAS-dTRPA1 with P2-GAL4. The P2-GAL4-labelled neurons were activated by treating the flies at 28°C during acute social isolation or group enrichment (1 day) (for experiments activating P2 neurons for 7 days, see Extended Data Fig. 10 and Supplementary Information). Control experiments, using flies of the same genotype, were conducted by treating the flies at 22°C during acute social isolation or group enrichment (1 day) (Fig. 4a). Following these treatments, all flies were subsequently maintained at 22°C for sleep or feeding behavior measurement (Fig. 4b and c). In animals carrying both P2-GAL4 and UAS-dTRPA1, we observed significant interactions between temperature treatment and group/isolation status for total, daytime, and ZT0-4 sleep/food consumption: Activation of P2 neurons during acute social isolation promoted significant sleep loss and excessive feeding (Fig. 4b, c and Extended Data Fig. 9) whereas activation of P2 neurons during group rearing failed to alter either sleep or feeding behavior. In control experiments, we found no evidence for interactions between temperature treatment and group/isolation status in the heterozygous parental flies (Fig. 4b, c and Extended Data Fig. 9).
Fig. 4: Activation of P2 neurons during acute social isolation induces sleep loss and over consumption of food.
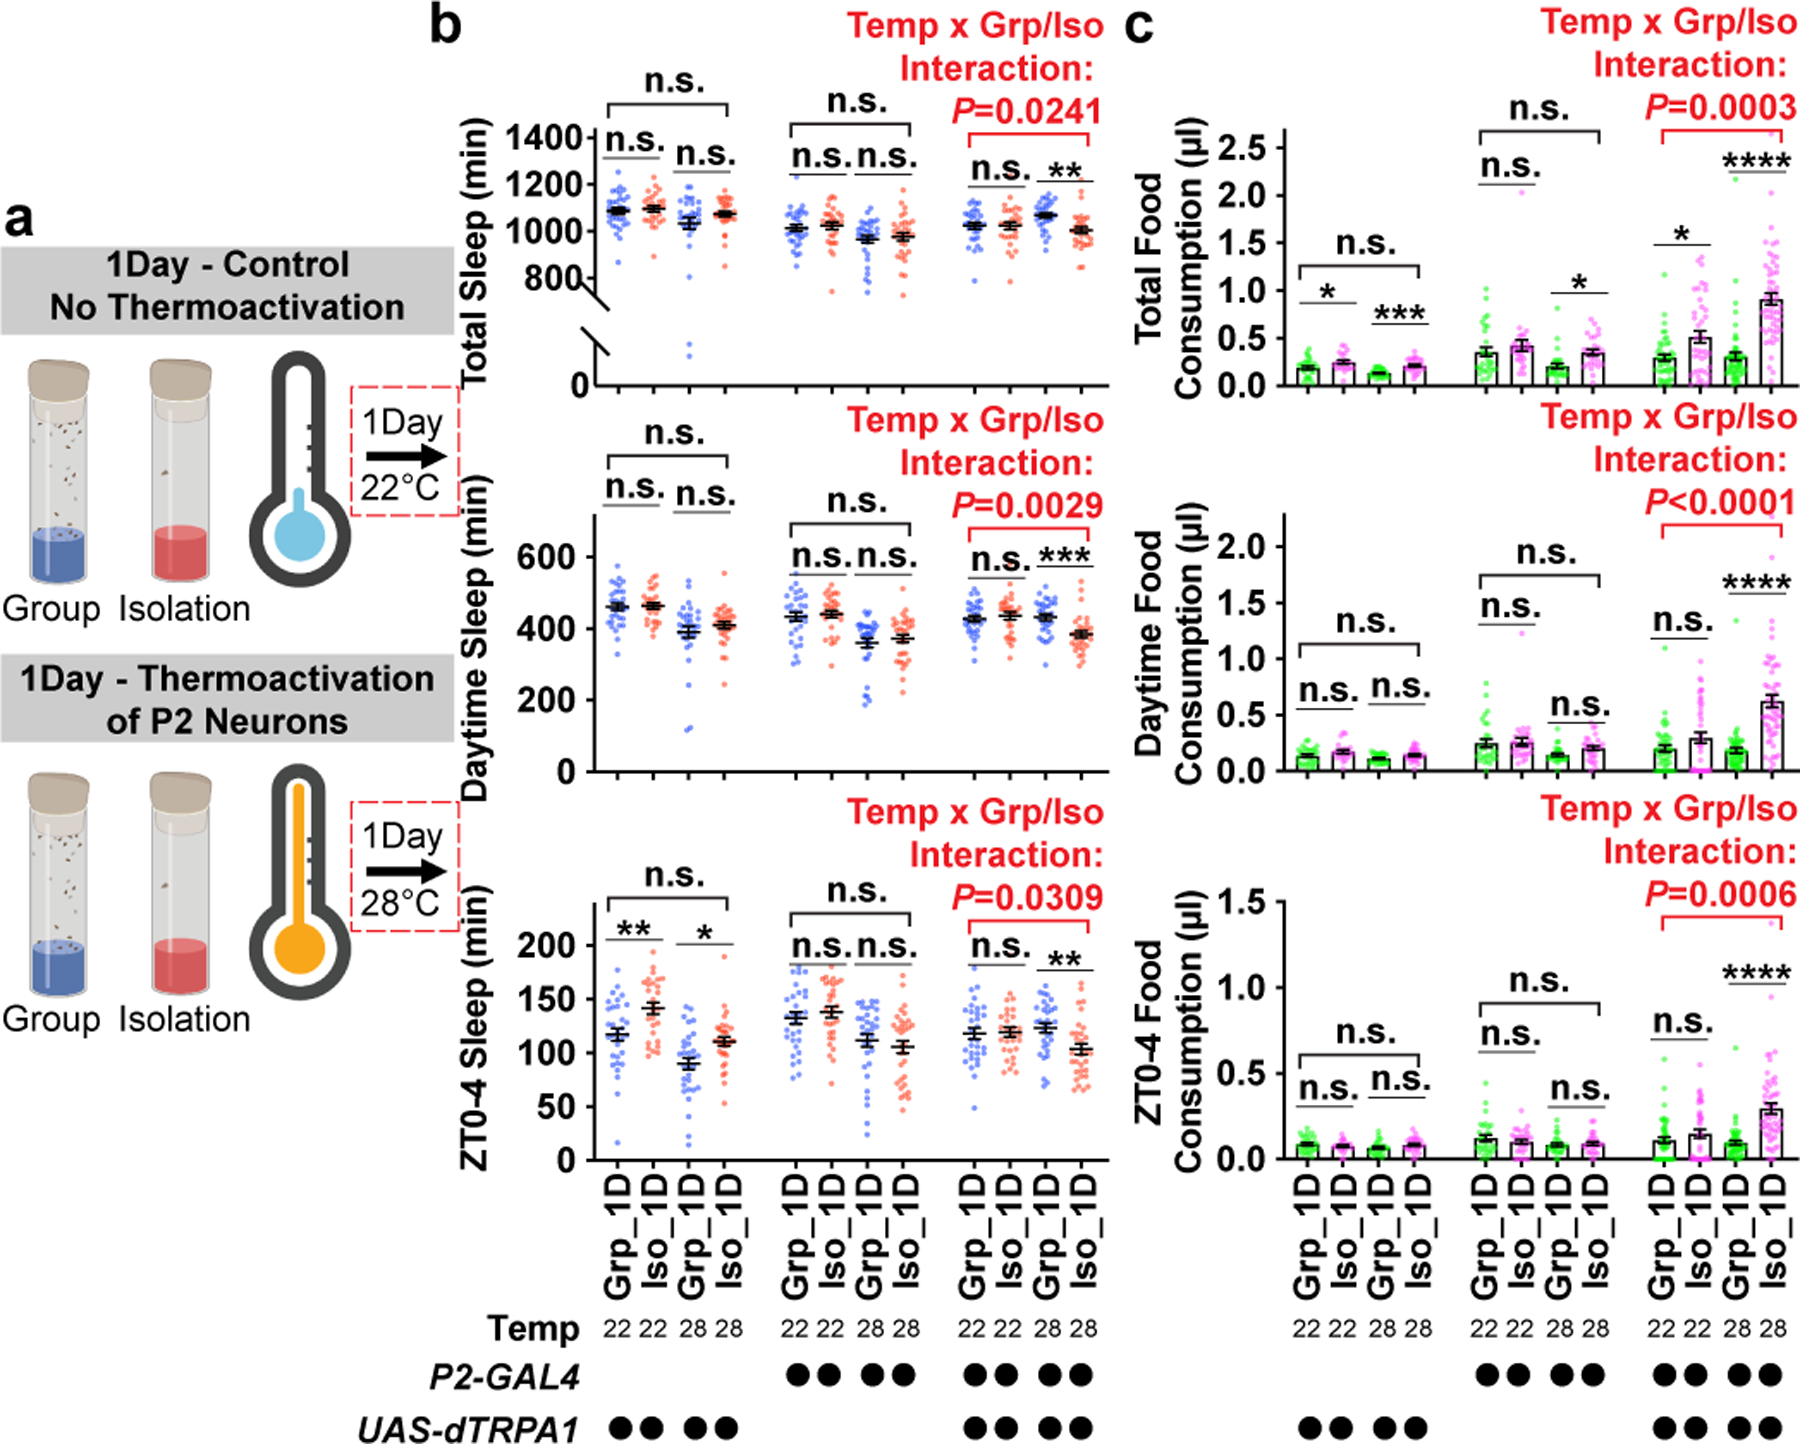
a, Schematics of activating P2 neurons for 1 day of group enrichment/social isolation. 22°C treatments (no thermoactivation) were used as controls. Flies in group enrichment/social isolation were kept at 28°C for 1 day to thermally activate P2 neurons. After 1 day of thermal activation (or no activation), sleep or feeding behavior was measured at 22°C. b, Quantification (Mean±SEM with individual data points) of daily total sleep, daytime sleep and ZT0-4 sleep for experimental and heterozygous control flies grouped or isolated for 1 day with (28°C) or without (22°C) thermal activation of P2-GAL4 labelled neurons (N= 28–32 animals). c, Quantification (Mean±SEM with individual data points) of daily total food consumption, daytime food consumption, and ZT0-4 food consumption for experimental and heterozygous control flies grouped or isolated for 7 days with (28°C) or without (22°C) thermal activation of P2-GAL4 labelled neurons (N=22–57 animals). For b–c, two-way ANOVA were used for detecting interactions between temperature treatment and group/isolation status. Šidák multiple comparisons tests were used for post-hoc analyses between group treated and isolated animals of the same genotype and temperature treatment, *P<0.05, **P<0.01, ***P<0.001, ****P<0.0001. For N and P values, see the Source Data.
Discussion
Notably, P2 neurons are connected to the dorsal fan-shaped body neurons that are known to regulate sleep homeostasis and couple energy metabolism to sleep23,29–31. Artificial activation of P2 neurons can produce a behavioral state resembling chronic isolation after social isolation for a single day, however P2 activation failed to produce these behaviors in the complete absence of social isolation (Fig. 4 and Extended Data Fig. 9). This indicates that activity in P2 neurons and a status of being socially isolated are both required for reduced sleep and increased feeding. Social isolation may be sensed by P2 neurons or elsewhere in the brain, but in either case appears to cause a shift in which activity of P2 neurons is interpreted differently to generate novel behaviors. Ertekin et al. recently found that down-regulation of a secreted cytokine in a non-neural tissue, fat body, suppressed sleep and promoted feeding in Drosophila32. It would be interesting to determine whether these behavioral responses also depend on P2 neuronal activity.
Modifications of feeding circuits appear to be crucial to the evolution of complex social behaviors. For example, in C. elegans, a single residue difference in the Neuropeptide Y receptors of naturally occurring strains determines whether the strains exhibit solitary or social feeding behavior33. As antibodies to Neuropeptide F, the fly homologue of Neuropeptide Y, label P2 neurons, we hope to ascertain in future work whether Drosophila’s P2 neurons influence social patterns of feeding behavior in addition to mediating feeding and sleep responses to social isolation.
In humans, social isolation promotes new emotional states that intensify with the passage of time. We found that sleep loss in Drosophila is a faithful readout of the duration of social isolation and allowed identification of specific patterns of gene and behavioral states that emerge as social isolation becomes chronic. This unexpected association between social isolation, sleep and metabolism in an insect model is reminiscent of the connection observed by social psychologists between loneliness, sleep difficulties and hyperphagia. Such robust findings in Drosophila suggest that studies of animal models may identify conserved brain states, genes, and neural circuits associated with social isolation.
Methods
Drosophila Strains and Culture
Drosophila melanogaster stocks were raised on standard media (cornmeal/ yeast/ molasses/ agar) at 22°C under 12-hour light/12-hour dark (LD) cycles. Wild type isogenic strain Canton-S w1118 (iso1CJ)34 was used as controls for behavior and RNA-seq experiments. Additional isogenic strains, including Canton-S and Berlin-K, were used for testing group/isolation effects on sleep. Canton-S and UAS-GCaMP7f were kindly provided by Dr. Gaby Maimon and Berlin-K was obtained from Bloomington Drosophila Stock Center. Sleep inbred panel (SIP) lines (SIP-L1-3, SIP-L1-4, SIP-L2-1,SIP-L2-6, SIP-S1-1, SIP-S1-9, SIP-S2-3 and SIPS2-9)35,36 were obtained from Bloomington Drosophila Stock Center. Sleep mutant strain insomniac120 was a standing stock of the laboratory. Sleep mutant fumin18 was kindly provided by Dr. Amita Sehgal. Sleep mutant wakeD219 was kindly provided by Dr. Mark Wu. All sleep mutants tested in this study were backcrossed to the wild type: Canton-S w1118 (iso1CJ) for at least 5 generations. NPF-GAL4, SS0020-split-GAL4 (P2-GAL4)22, UAS-Kir2.1 (pJFRC49-10XUAS-IVS-eGFPKir2.1) were gifts from Dr. Lisha Shao and Dr. Ulrike Heberlein. UAS-myr::GFP (attP40) (pJFRC12-10XUAS-IVS-myr::GFP), GMR23E10-GAL4 (attP2), UAS-dTRPA1 (attP16), MCFO-3 (GMR57C10-FlpL(su(Hw)attP8);;10xUAS(FRT.stop)myr::smGdP-HA(VK00005),10xUAS(FRT.stop)myr::smGdP-V5-THS-10xUAS(FRT.stop)myr::smGdP-FLAG(su(Hw)attP1))25, UAS-Shibirets1 (VK0005) (pJFRC100-20xUAS-TTS-Shibire-ts1-p10) were obtained from Bloomington Drosophila Stock Center. All experiments were conducted in male animals. Female animals also exhibit the chronic social isolation-induced sleep loss phenotype but were not used in this study.
Group enrichment/social isolation
Newly eclosed flies were collected and kept in standard fly food bottles (~200 flies per bottle) for 3–5 days to acquire social experience. Mating was allowed to happen freely during this period. Male flies were then sorted into standard fly food vials: 1 fly per vial for social isolation (Iso) and 25 flies per vial for group enrichment (Grp). For Extended Data Fig.1 and Extended Data Fig. 3f and g, we varied group sizes for group enrichment: 2 flies per vial for Grp(2), 5 flies per vial for Grp(5), 25 flies per vial for Grp(25), 100 flies per vial for Grp(100). For Extended Data Fig. 3m and n, we varied sex composition of the group: 30 males were housed in a vial for “male-only group” and 15 male and 15 females were housed in a vial for “mixed-sex” group. For all experiments, the fly sorting day was considered Day0. On Day1, Day3, Day5 or Day7, isolated or group flies were used for sleep measurements, feeding measurements or RNA-seq experiments.
Sleep measurement and analysis
Locomotor activity of flies was monitored using the Drosophila Activity Monitor (DAM) system (TriKinetics, Waltham, MA). Flies with group or isolation experiences were loaded into glass tubes containing fly culture food and assayed at 22°C under 12-hour light/12-hour dark (LD) cycles. Activity counts were collected at 1min bins for 3 LD cycles after the loading day. Sleep parameters, sleep profiles and sleep bout distributions were analyzed based on activity counts with the “R3.6/Rethomics” package37. For sleep profile and sleep parameters presented in the study, data from 3 LD cycles of the same animal were averaged to generate sleep profile, daily total sleep, daytime sleep, nighttime sleep, ZT0-4 sleep.
Sleep bouts distribution analysis
After calculating the duration of every sleep bout for animals measured for 3 LD cycles immediately following sleep/isolation treatment, all daytime (or nighttime) sleep bouts from all animals tested for a given condition (certain genotype, group or isolated after certain number of days) were pooled together. The pooled data was used to generate density plot and cumulative relative fraction plot. For density plot, a bin size of 10min was used and the plot was generated by the geom_histogram function of the R/ggplot2_3.3.3 package. For cumulative relative fraction plot, sleep episode duration was treated as continuous variable with a bin size of 1min. Cumulative relative fraction for any given sleep episode duration (min) was calculated as total number of bouts equal to and shorter than that sleep episode duration divided by the total number of all bouts (daytime or nighttime). The resulting cumulative relative fraction was plotted on the y axis while x axis represented the continuous time interval with a bin size of 1min.
RNA purification
Heads of wild type flies with group/isolation experiences were collected at ZT0.5-2. Flies of three conditions were collected: socially enriched animals (group enrichment for 7 days, “Grp”), chronic isolation animals (isolated for 7 days, “Iso_7D”) and acute isolation animals (isolated for 1 day, “Iso_1D”). For each condition, 3 replicated samples were collected, and each sample contains 200 fly heads. Total RNA was extracted using TRIzol reagents and homogenized using a BeadBug microtube homogenizer (Benchmark Scientific). Samples were further extracted using chloroform and the aqueous phase containing nucleic acid was acquired by the assistance of Phase Lock Gel, Heavy (QuantaBio). We then used the RNeasy Mini Kit (Qiagen) to remove DNA with DNase and further purify the samples, following the manufacturer’s protocol.
RNA-seq and differential gene expression analysis
RNA-seq was conducted at the Genomic Resources Center of the Rockefeller University. Sequencing libraries were prepared with the Illumina TruSeq stranded mRNA LT kit. 100ng of total RNA for each sample was used. Libraries were multiplexed and sequenced on the Illumina NextSeq 500 sequencer using high output V2 reagents and NextSeq Control Software v1.4 to generate 75bp single reads, following manufacturer’s protocol. The sequencing depth was at least 50 million reads per sample. Reads were aligned to the FlyBase release 6.13 (May 2016) genome assembly with STAR_2.4.2a38 and read counts were generated with featureCounts_1.5.039. Differential expression analysis was performed with DESeq2_1.26.040. Gene ontology (GO) analysis was performed using the Database for Annotation, Visualization and Integrated Discovery (DAVID_6.8)41.
Activity Recording Capillary Feeder (ARC) assay
To measure feeding behavior in individual animals, we employed an ARC (Activity Recording Capillary Feeder) assay (detailed protocol described in17). Briefly, in the ARC assay, flies were housed in customized chambers with 1% agar and fed on liquid food (2.5% sucrose and 2.5% yeast) from microcapillaries. Food consumption was measured by video tracking the liquid meniscus (made from Dodecane, a copper dye and mineral oil) over time, while sleep measurements were obtained from positional tracking of the same animal in the chamber. Acquisition of frames at 1Hz were performed with Open CV_3.2.0 (The MacPorts Project). The object tracking was performed using JavaGrinders (Oracle). ARC system data were analyzed with the Python_3.5/Noah_15.8 script. In each experiment, two ARC chambers were recorded simultaneously, and the flies were loaded into the two chambers in a genotype/treatment-balanced manner, so biases from devices were minimized. We loaded flies immediately after group enrichment/social isolation around ZT8-9 and sleep/feeding analyses started at ZT12 on the loading day and ends after ZT36. Sleep or feeding data was binned for every 30-minute for displaying sleep/feeding profile. ZT24-ZT36 was presented as ZT0-12 in figures to display results of a full LD cycle. Dead flies, flies that failed to consume any liquid food from the microcapillaries and flies housed in chambers exhibiting tracking errors were excluded from the analyses.
Immunohistochemistry and confocal microscopy
Flies were briefly anesthetized with CO2 and dissected in cold Schneider’s Drosophila Medium. Dissected brains were fixed in 2% paraformaldehyde in Schneider’s Drosophila Medium at room temperature (RT) for 1 hour in a vacuum chamber. The brains were washed 4 times for 15 minutes each in PBT (PBS with 0.5% Triton X-100) at room temperature, blocked for 2 hours at room temperature with blocking buffer (PBT + 5% Normal Goat Serum) and incubated with primary antibodies in blocking buffer, overnight on a nutator at 4°C. The primary antibodies and their dilutions used were: Rabbit anti-GFP (1:500, Thermo Fisher Scientific, A6455), Mouse anti-GFP (1:500, Thermo Fisher Scientific, A11120), Mouse anti-LST (1:1000, gift from Dr. Seung Kim, Stanford University), Rabbit anti-NPF (1:500, RayBiotech, RB-19–0001), Rat anti-N-cadherin (1:200, Developmental Studies Hybridoma Bank, DN-Ex #8), Rat anti-FLAG-Tag (1:250, Novus, NBP1–06712SS), Rabbit anti-HA-Tag (1:250, Cell Signaling Technology, C29F4), and Mouse anti-Bruchpilot (1:50, Developmental Studies Hybridoma Bank, nc82). This was followed by 4 washes for 20 min each in PBT at room temperature, and incubation overnight on a nutator at 4°C with secondary antibodies in blocking buffer. The secondary antibodies were: Alexa Fluor 488 anti-Rabbit (1:500, Jackson ImmunoResearch, 111-545-144), Alexa Fluor 488 anti-Mouse (1:500, Thermo Fisher Scientific, A11029), Alexa Fluor 568 anti-Mouse (1:500, Thermo Fisher Scientific, A11031), Alexa Fluor 568 anti-Rat (1:500, Thermo Fisher Scientific, A11077), Alexa Fluor 647 anti-Rat (1:500, Jackson Immunoresearch, 112-605-167) and Alexa Fluor Plus 647 anti-Rabbit (1:1000, Thermo Fisher Scientific, A32733). Samples were then washed 4 times for 15 minutes each in PBT at room temperature, 1 time for 15 minutes in PBS, mounted with Fluoromount-G mounting medium (SouthernBiotech, 0100–01) and cured overnight at 4°C. Samples were imaged on a Zeiss LSM710 confocal microscope. Images were processed with Zeiss ZEN 2.3 SP1 software and Fiji (ImageJ2) software.
Thermogenetic neuronal activation during social isolation
For experiments in Fig. 4, Extended Data Fig. 9 and 10, fly crosses were reared at 22°C under 12-hour light/12-hour dark (LD) cycles. Progenies with the expected genotypes were collected and kept at 22°C for 5 days to acquire social experience before sorted for group enrichment/social isolation. Grouped/isolated flies were either incubated at 22°C or 28°C for either 1 day or 7 days. If the progenies express UAS-dTRPA1 transgene in P2-GAL4 labelled neurons, these neurons were thermogenetically activated at 28°C during the 1 day or 7 days period of group enrichment/social isolation. Sleep of all animals was tested at 22°C. P2-GAL4 labelled neurons were not thermogenetically activated during the behavior test phase, and thus activation of these neurons was restricted to the group enrichment/social isolation phase of 1 day or 7 days.
[Ca2+] Imaging
Flies were tethered to a custom plate for imaging and walking on an air-cushioned ball in the dark. Dissection and imaging protocols followed previous studies42. Data were collected using PrairieView 5.4 (Bruker). We used male flies carrying both UAS-GCaMP7f and P2-GAL4 following 7 days of group enrichment/social isolation and the imaging experiments were conducted at ZT0-4. Each fly was imaged for a duration of 5 min. We used the same acquisition parameters across all the flies with laser intensity at the back aperture at 30–40mW. Flies from different groups were tethered and imaged alternatively to minimize potential circadian effects. We defined regions of interest (ROIs) for the lower layer and higher layer of P2 neurons separately and used these ROIs as the unit for calculating fluorescence intensities. For each ROI, we calculated the mean signal value across pixels at each time point. In Extended Data Fig. 8e, we report the raw, amplified photomultiplier tube signal. In Extended Data Fig. 8c–d, we normalized the raw fluorescence values using the ΔF/F0 method, where F0 was defined as the mean of the lowest 5% of raw fluorescence values in a given ROI over time and ΔF was defined as F – F0. Cross-correlation analyses were used to determine the relationship of neural activity and the fly’s locomotion. To compare the activity level of P2 neurons between flies of group enrichment/social isolation, we averaged the raw, amplified photomultiplier tube signal across moments when flies were standing since the activity of P2 neurons is correlated with the fly’s locomotion (Extended Data Fig. 8c–d). For a fly to be detected as standing, the translational speed needed to be less than 2 mm/s and the turning speed less than 50 deg/s.
Statistics and Reproducibility
Statistical analyses for behavioral experiments were performed using GraphPad Prism 8. For comparisons between grouped and isolated animals, two-tailed unpaired t-tests with Welch’s correction were used. For comparisons between multiple groups, ordinary one-way ANOVA followed by Tukey’s multiple comparison tests were used. For comparing sleep bout distributions, Kolmogorov-Smirnov tests were used. For determining whether P2 neuron activation influences social isolation induced behavior change, two-way ANOVA were used for detecting interactions between temperature treatment and group/isolation status and Šidák multiple comparisons tests were used for post-hoc analyses between group treated and isolated animals of the same genotype and temperature treatment, *P<0.05, **P<0.01, ***P<0.001, ****P<0.0001. All behavior experiments were repeated at a different time with different batch of flies to ensure reliable conclusion. Representative confocal images are shown from at least 10 independent samples examined in each case.
Data Availability
The RNA-Seq datasets generated in this study have been deposited in NCBI’s Gene Expression Omnibus43 and are accessible through GEO series accession number GSE137498. Source data are provided with this paper.
Code availability
Customized R script based on “R/rethomics” package is available upon request.
Extended Data
Extended Data Fig. 1. Social isolation reduces sleep in Drosophila.
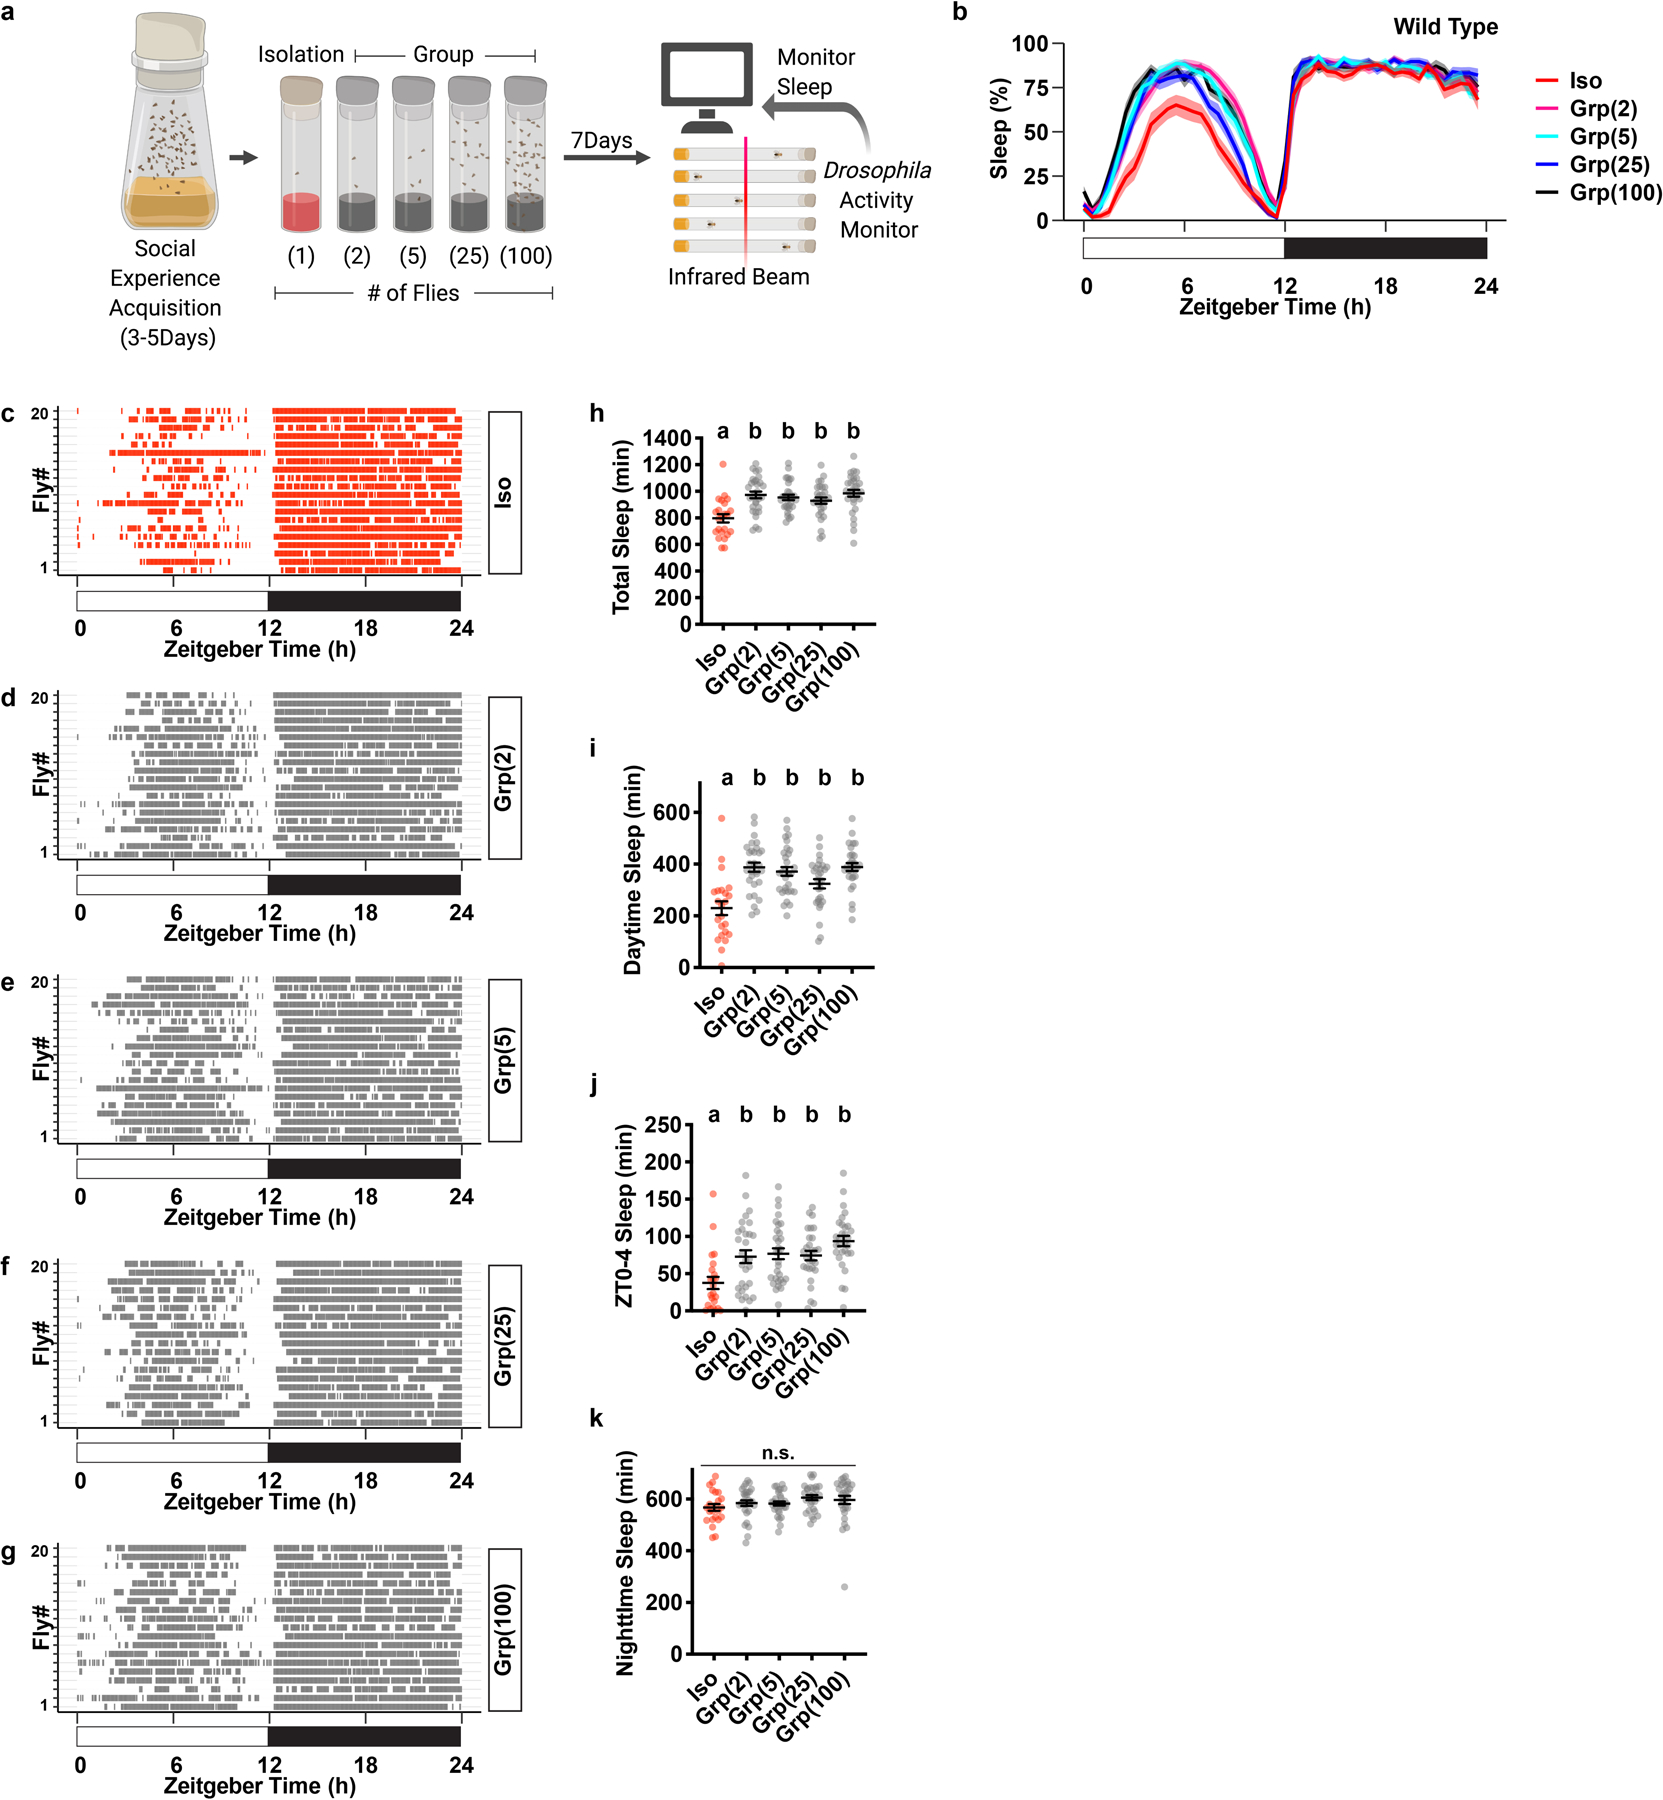
a, Schematic of social isolation paradigm. Adult fruit flies with social experience were subjected to social isolation or group enrichment for 7 days before sleep is measured using Drosophila Activity Monitors. Social isolation is housing 1 fly per vial. Group enrichment is housing 2, 5, 25 or 100 flies per vial. b, Sleep profile (displayed as the average proportion of time spent sleeping in consecutive 30min segments during a 24hr LD cycle, Mean±SEM) of flies after social isolation or group enrichment of different group sizes for 7 days. c–g, Raster plot of sleep bouts of 20 individual animals after social isolation (c), group enrichment in a group of 2 animals (d), group enrichment in a group of 5 animals (e), group enrichment in a group of 25 animals (f) and group enrichment in a group of 100 animals (g). Each row is an individual animal, with each colored bar representing sleep bouts in a 24hr LD cycle. h–k, Quantification (Mean±SEM with individual data points) of daily total sleep (h), daytime sleep (i), ZT0-4 sleep (j) and nighttime sleep (k) for flies after social isolation (Iso) or group enrichment (Grp) of different group sizes. For b and h–k, N=23–30 animals; ordinary one-way ANOVA followed by Tukey’s multiple comparison tests; means sharing the same letter are not significantly different. For N and P values, see the Source Data.
Extended Data Fig. 2. Chronic social isolation does not alter nighttime sleep in wild type Drosophila.
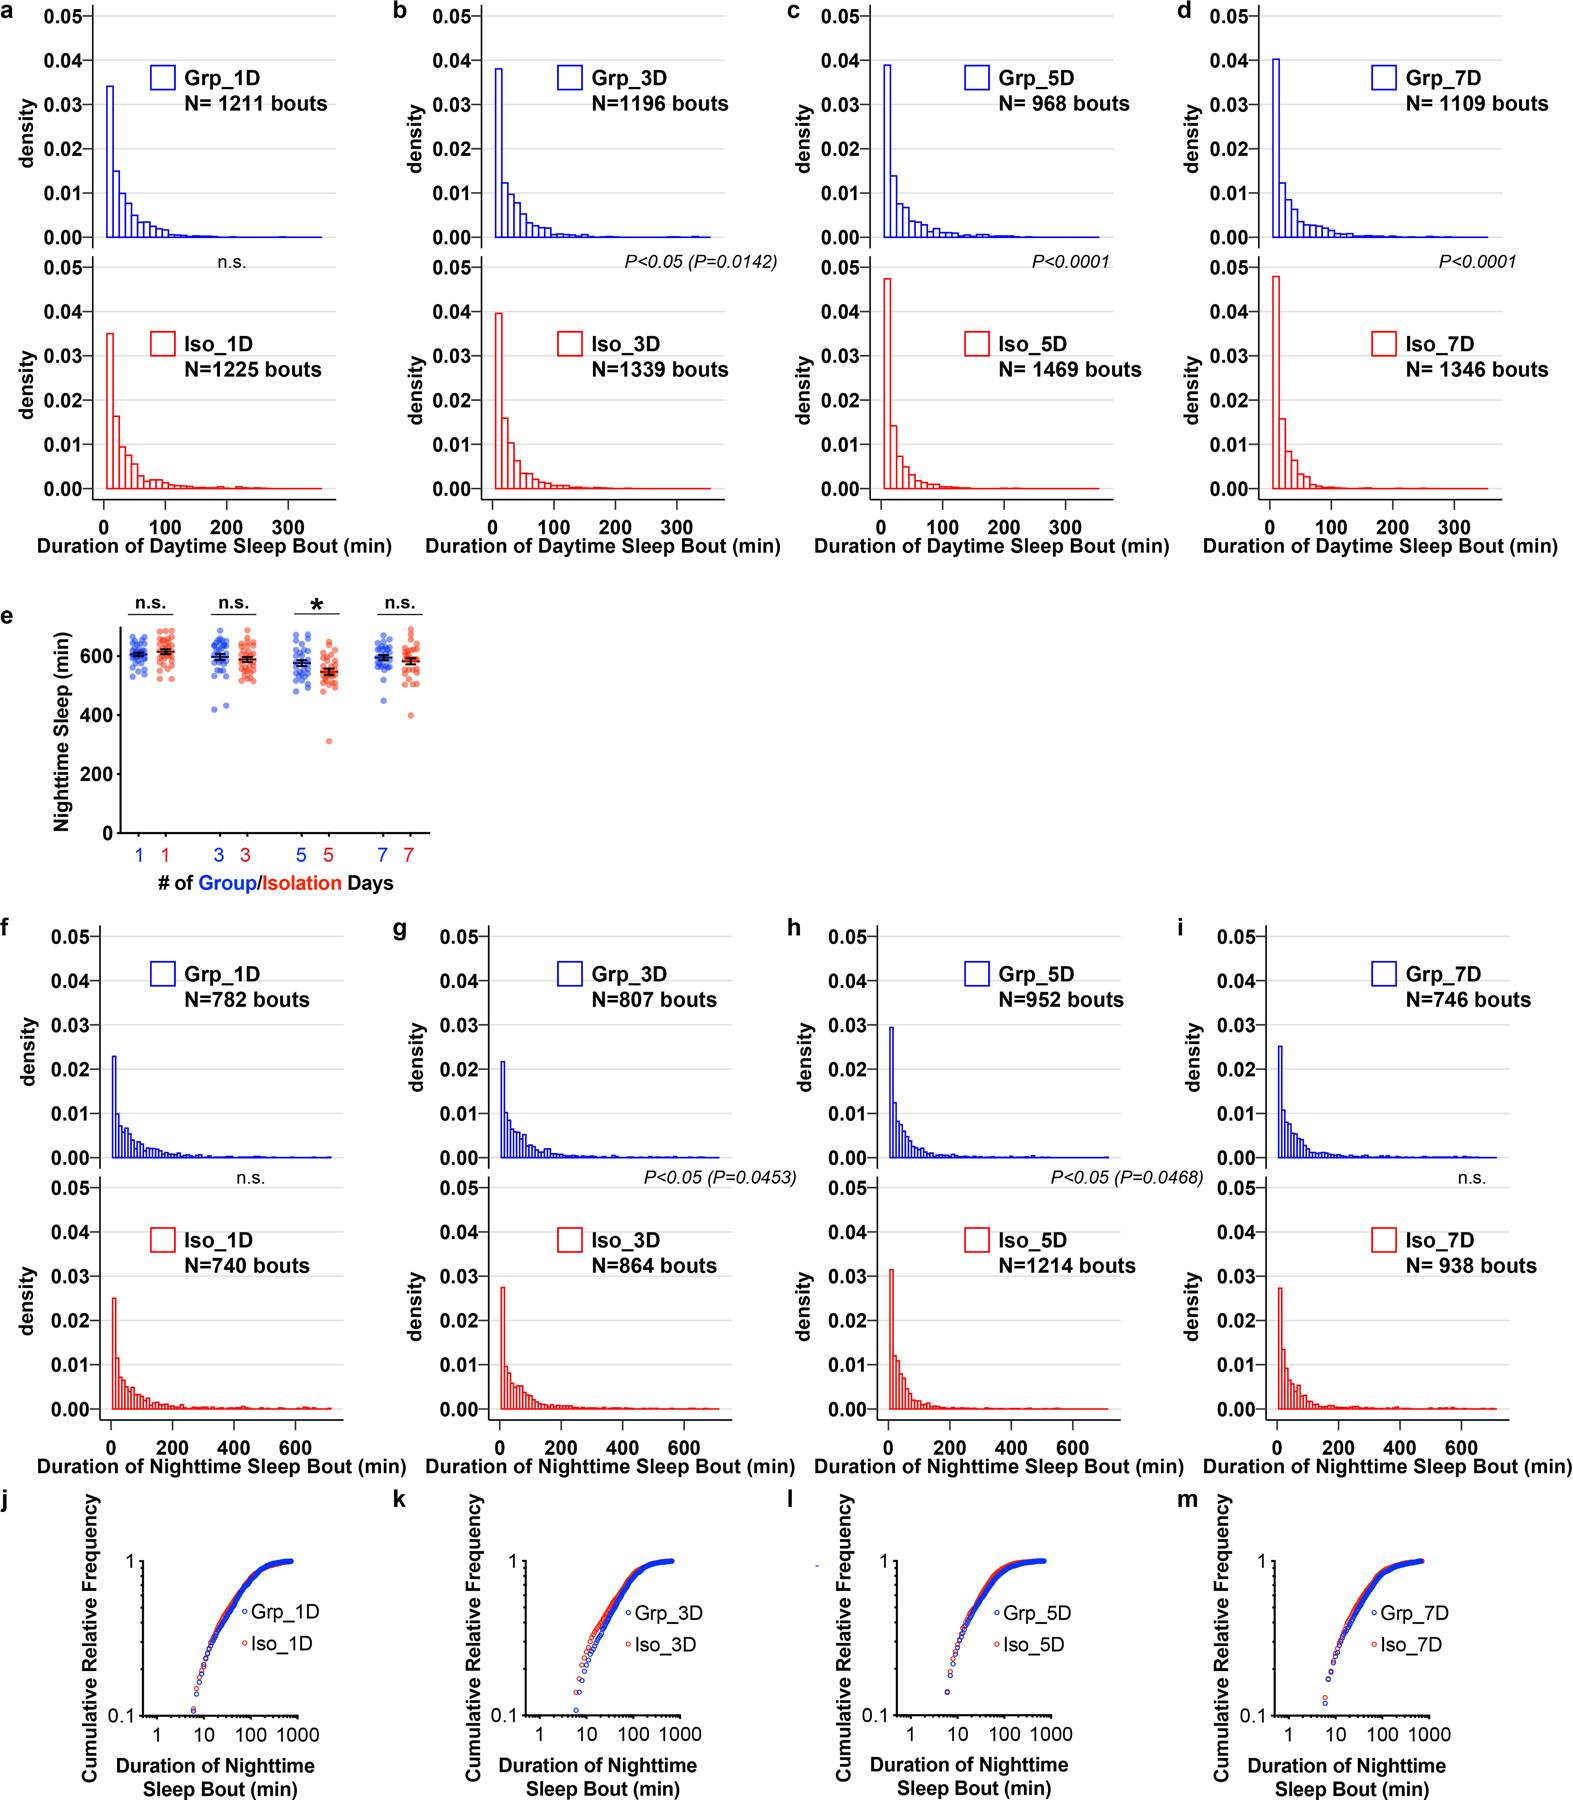
a–d, Density plots for distribution of daytime sleep bouts for flies after 1, 3, 5, 7 days of group enrichment/social isolation. All daytime sleep bouts collected from all animals in each condition were combined. e, Quantification (Mean±SEM with individual data points) of daily nighttime sleep for wild type flies after group enrichment/social isolation for 7 days. f–i, Density plots for distribution of nighttime sleep bouts for flies after 1, 3, 5, 7 days of group enrichment/social isolation. All nighttime sleep bouts collected from all animals in each condition were combined. j–m, Plots of cumulative relative frequency for distributions of nighttime sleep bouts for flies after 1, 3, 5, 7 days of group enrichment/social isolation. Kolmogorov-Smirnov tests were used for comparing distributions. For e, N= 29–32 animals, two-sided unpaired t-test with Welch’s correction; *P<0.05, **P<0.01, ***P<0.001, ****P<0.0001. For N and P values, see the Source Data.
Extended Data Fig. 3. Social isolation reduces Drosophila sleep in age-matched flies, in various isogenic strains, and in aged wild type animals.
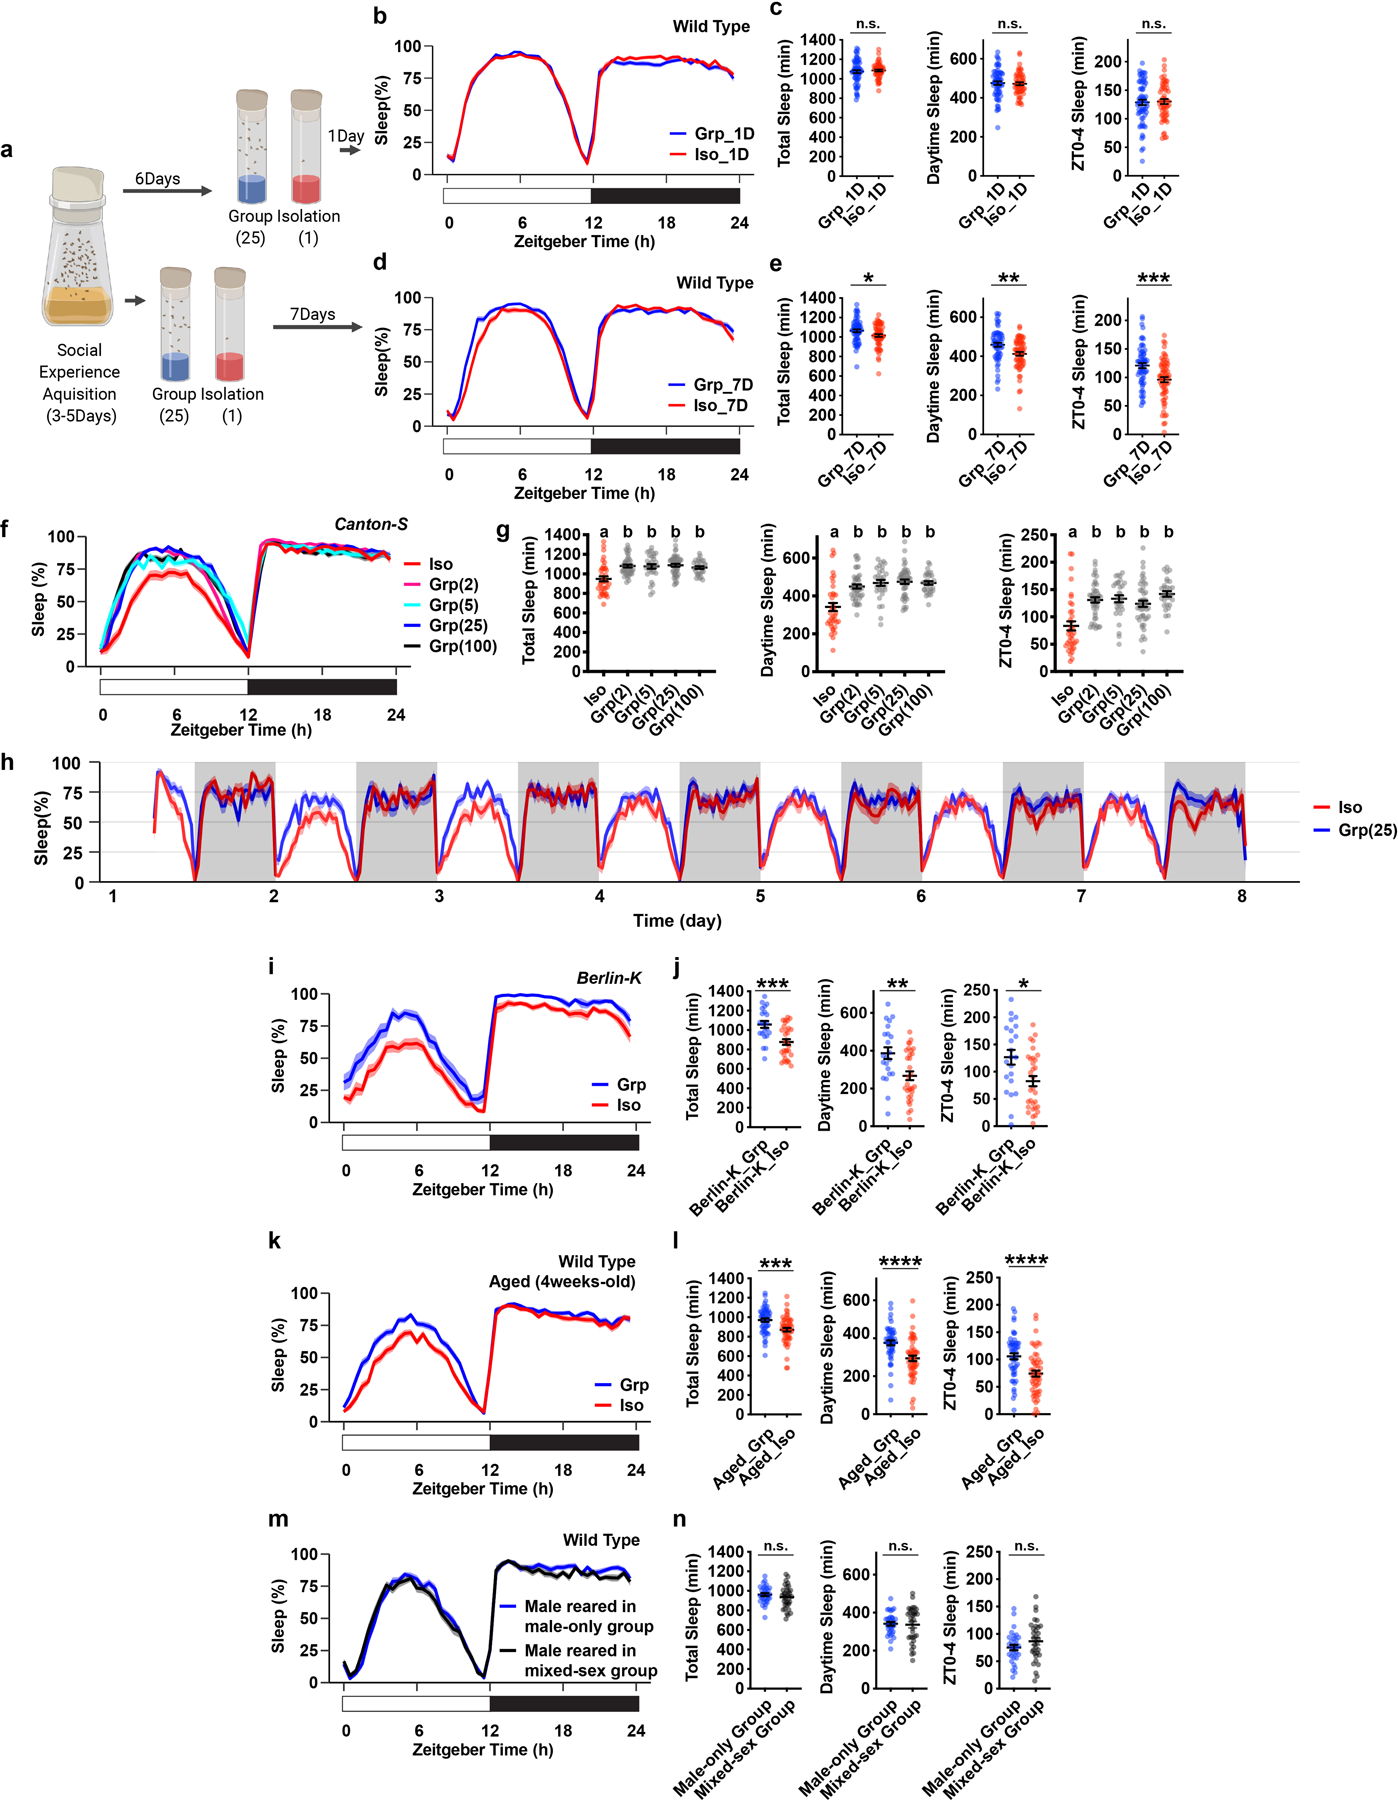
a, Schematics of measuring sleep using Drosophila Activity Monitors after 1 or 7 days of group enrichment/social isolation in age-matched flies. b–e, Sleep profile and quantification of daily total sleep, daytime sleep and ZT0-4 sleep after 1 day (b–c, N=55–64 animals) or 7 days of group enrichment/social isolation (d–e, N=61–64 animals). f–g, Sleep profile and quantification of daily total sleep, daytime sleep and ZT0-4 sleep of the Canton-S isogenic strain after social isolation or group enrichment of different group sizes for 7 days (N=30–47 animals). h, A 7-day long sleep profile of flies after group enrichment/social isolation for 7 days. i–j, Sleep profile and quantification of daily total sleep, daytime sleep and ZT0-4 sleep for Berlin-K flies after social isolation/group enrichment (25 flies in a group) for 7 days (N=22–31 animals). k–l, Sleep profile and quantification of daily total sleep, daytime sleep and ZT0-4 sleep of aged wild type flies after group enrichment/social isolation (25 flies in a group) for 7 days (N=52–54 animals). m–n, Sleep profile and quantification of daily total sleep, daytime sleep and ZT0-4 sleep of male wild type flies after group enrichment in a male only group (30 flies in a group) or in a mixed-sex group (15 male and 15 female flies in a group) for 7 days (N=32 animals). Sleep profiles are displayed as the average proportion of time spent sleeping in consecutive 30min segments during a 24hr LD cycle; solid line, Mean; shaded area, ±SEM. Quantifications are displayed as Mean±SEM with individual data points. For g, ordinary one-way ANOVA followed by Tukey’s multiple comparison test; means sharing the same letter are not significantly different. For c, e, j, l and n, two-sided unpaired t-tests with Welch’s correction; *P<0.05, **P<0.01, ***P<0.001, ****P<0.0001. For N and P values, see the Source Data.
Extended Data Fig. 4. Social isolation reduces sleep in Drosophila Sleep Inbred Panel (SIP) lines.
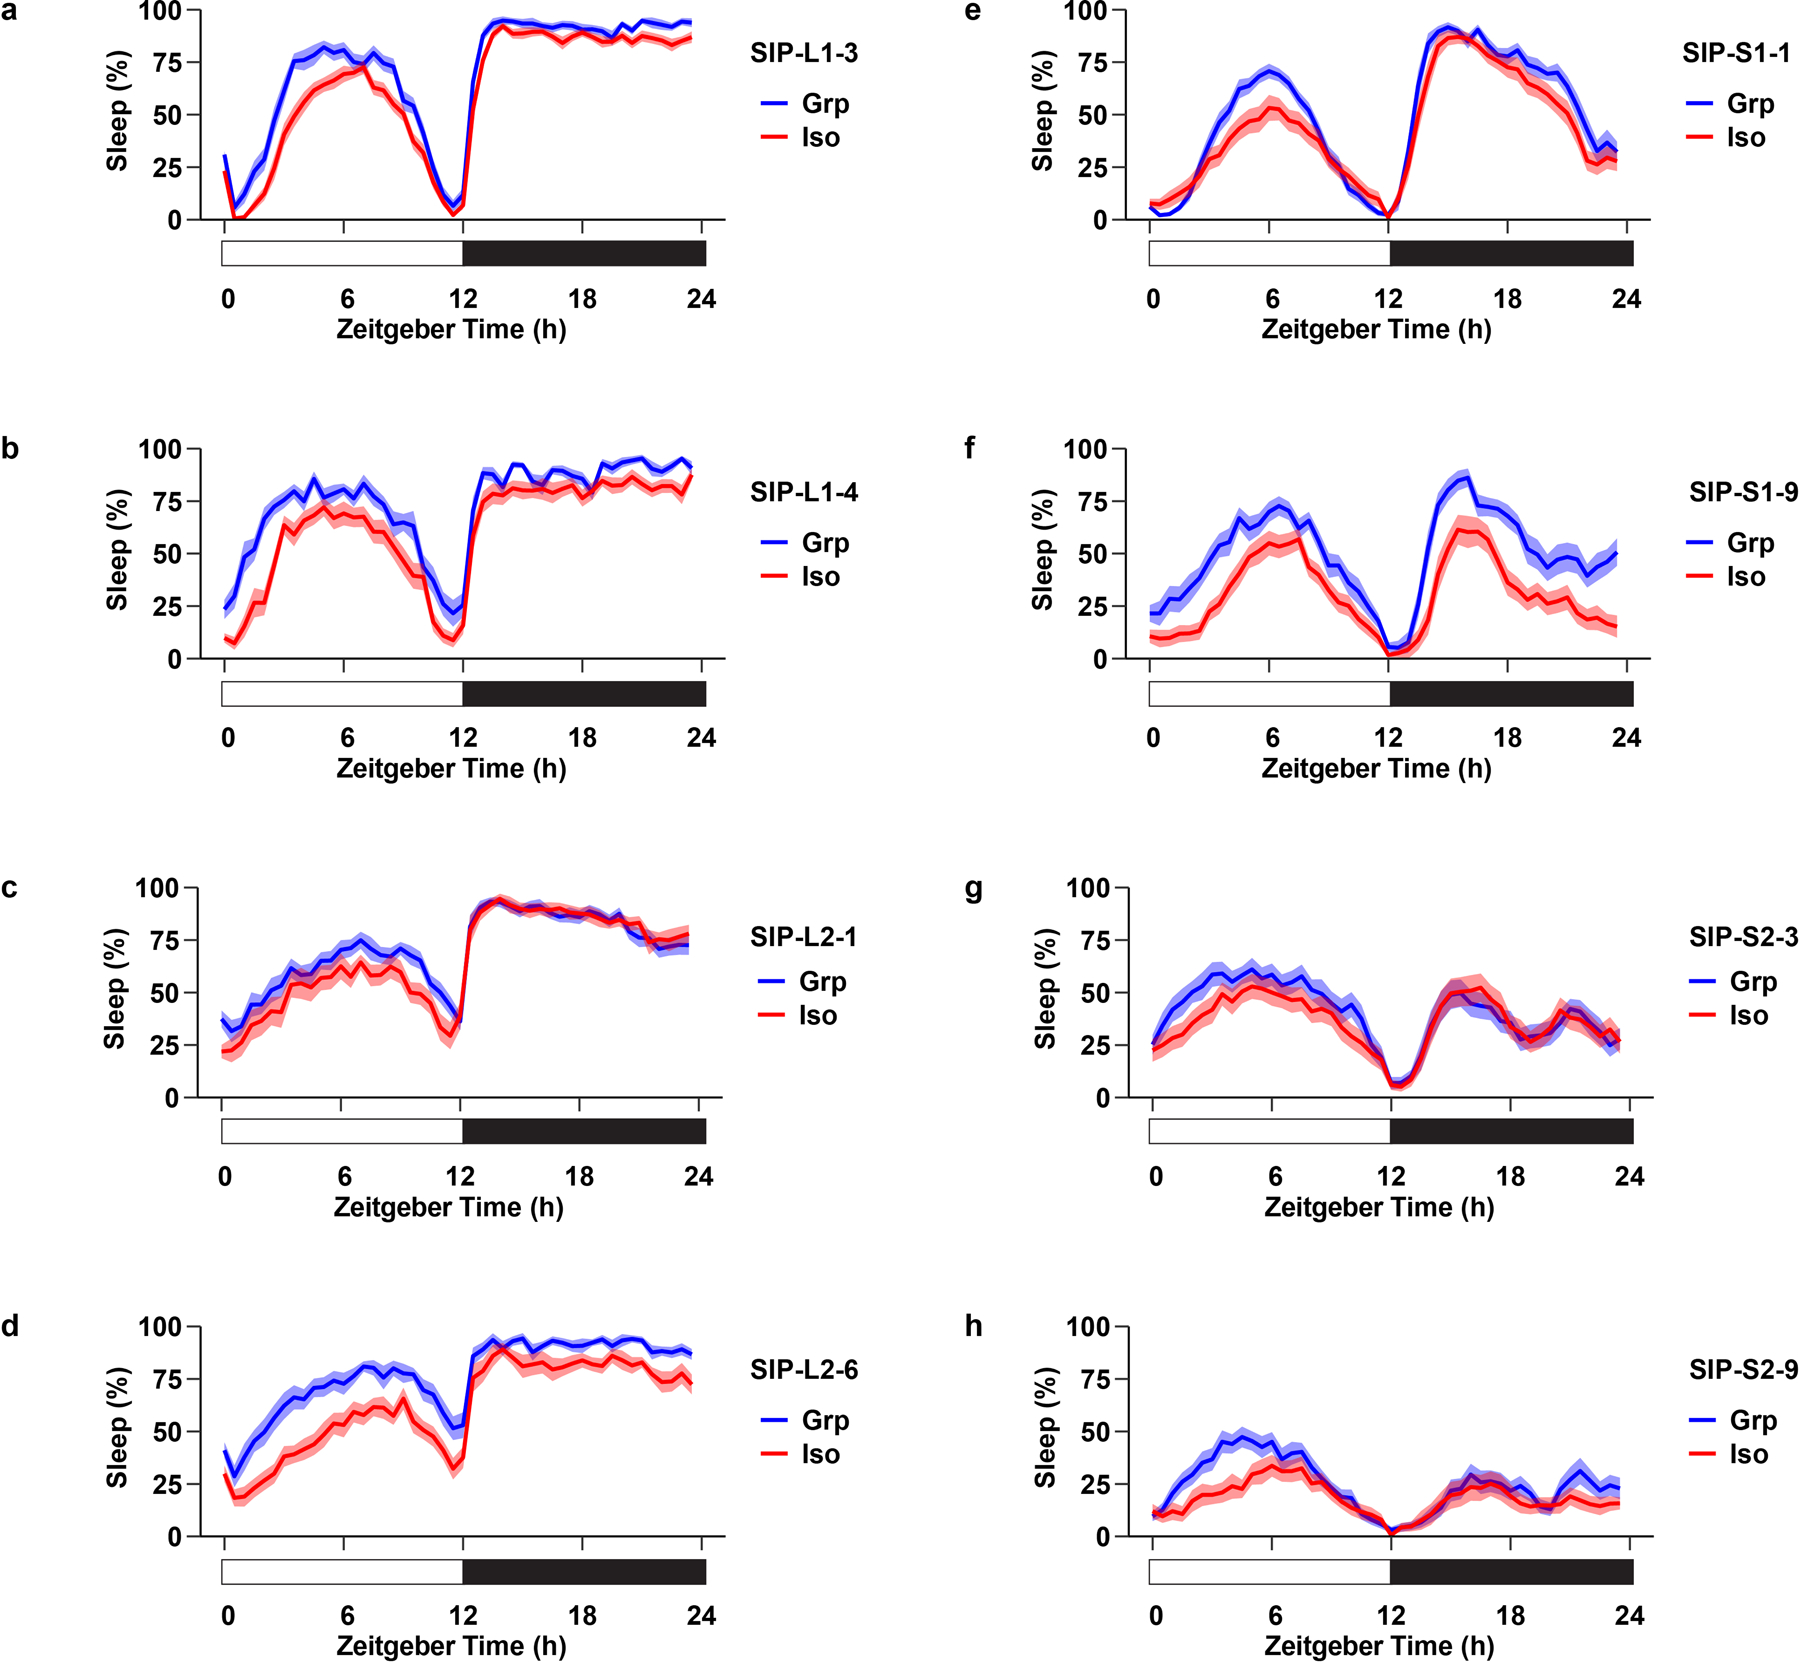
a–d, Sleep profile of long-sleeping flies: SIP-L1-3 (a), SIP-L1-4 (b), SIP-L2-1 (c), and SIP-L2-6 (d) after group enrichment/social isolation (25 flies in a group for group treatment) for 7 days. e–h, Sleep profile of short-sleeping flies: SIP-S1-1 (e), SIP-S1-9 (f), SIP-S2-3 (g), and SIP-S2-9 (h) after group enrichment/social isolation (25 flies in a group for group treatment) for 7 days. Sleep profiles are displayed as the average proportion of time spent sleeping in consecutive 30min segments during a 24hr LD cycle; solid line, Mean; shaded area, ±SEM. The long-sleeping/short-sleep fly lines were randomly selected from the Sleep Inbred Panel (SIP), a panel of inbred Drosophila melanogaster strains with extreme long or short sleep duration phenotypes35,36.
Extended Data Fig. 5. RNA-sequencing experiment reveals gene expression change during chronic social isolation.
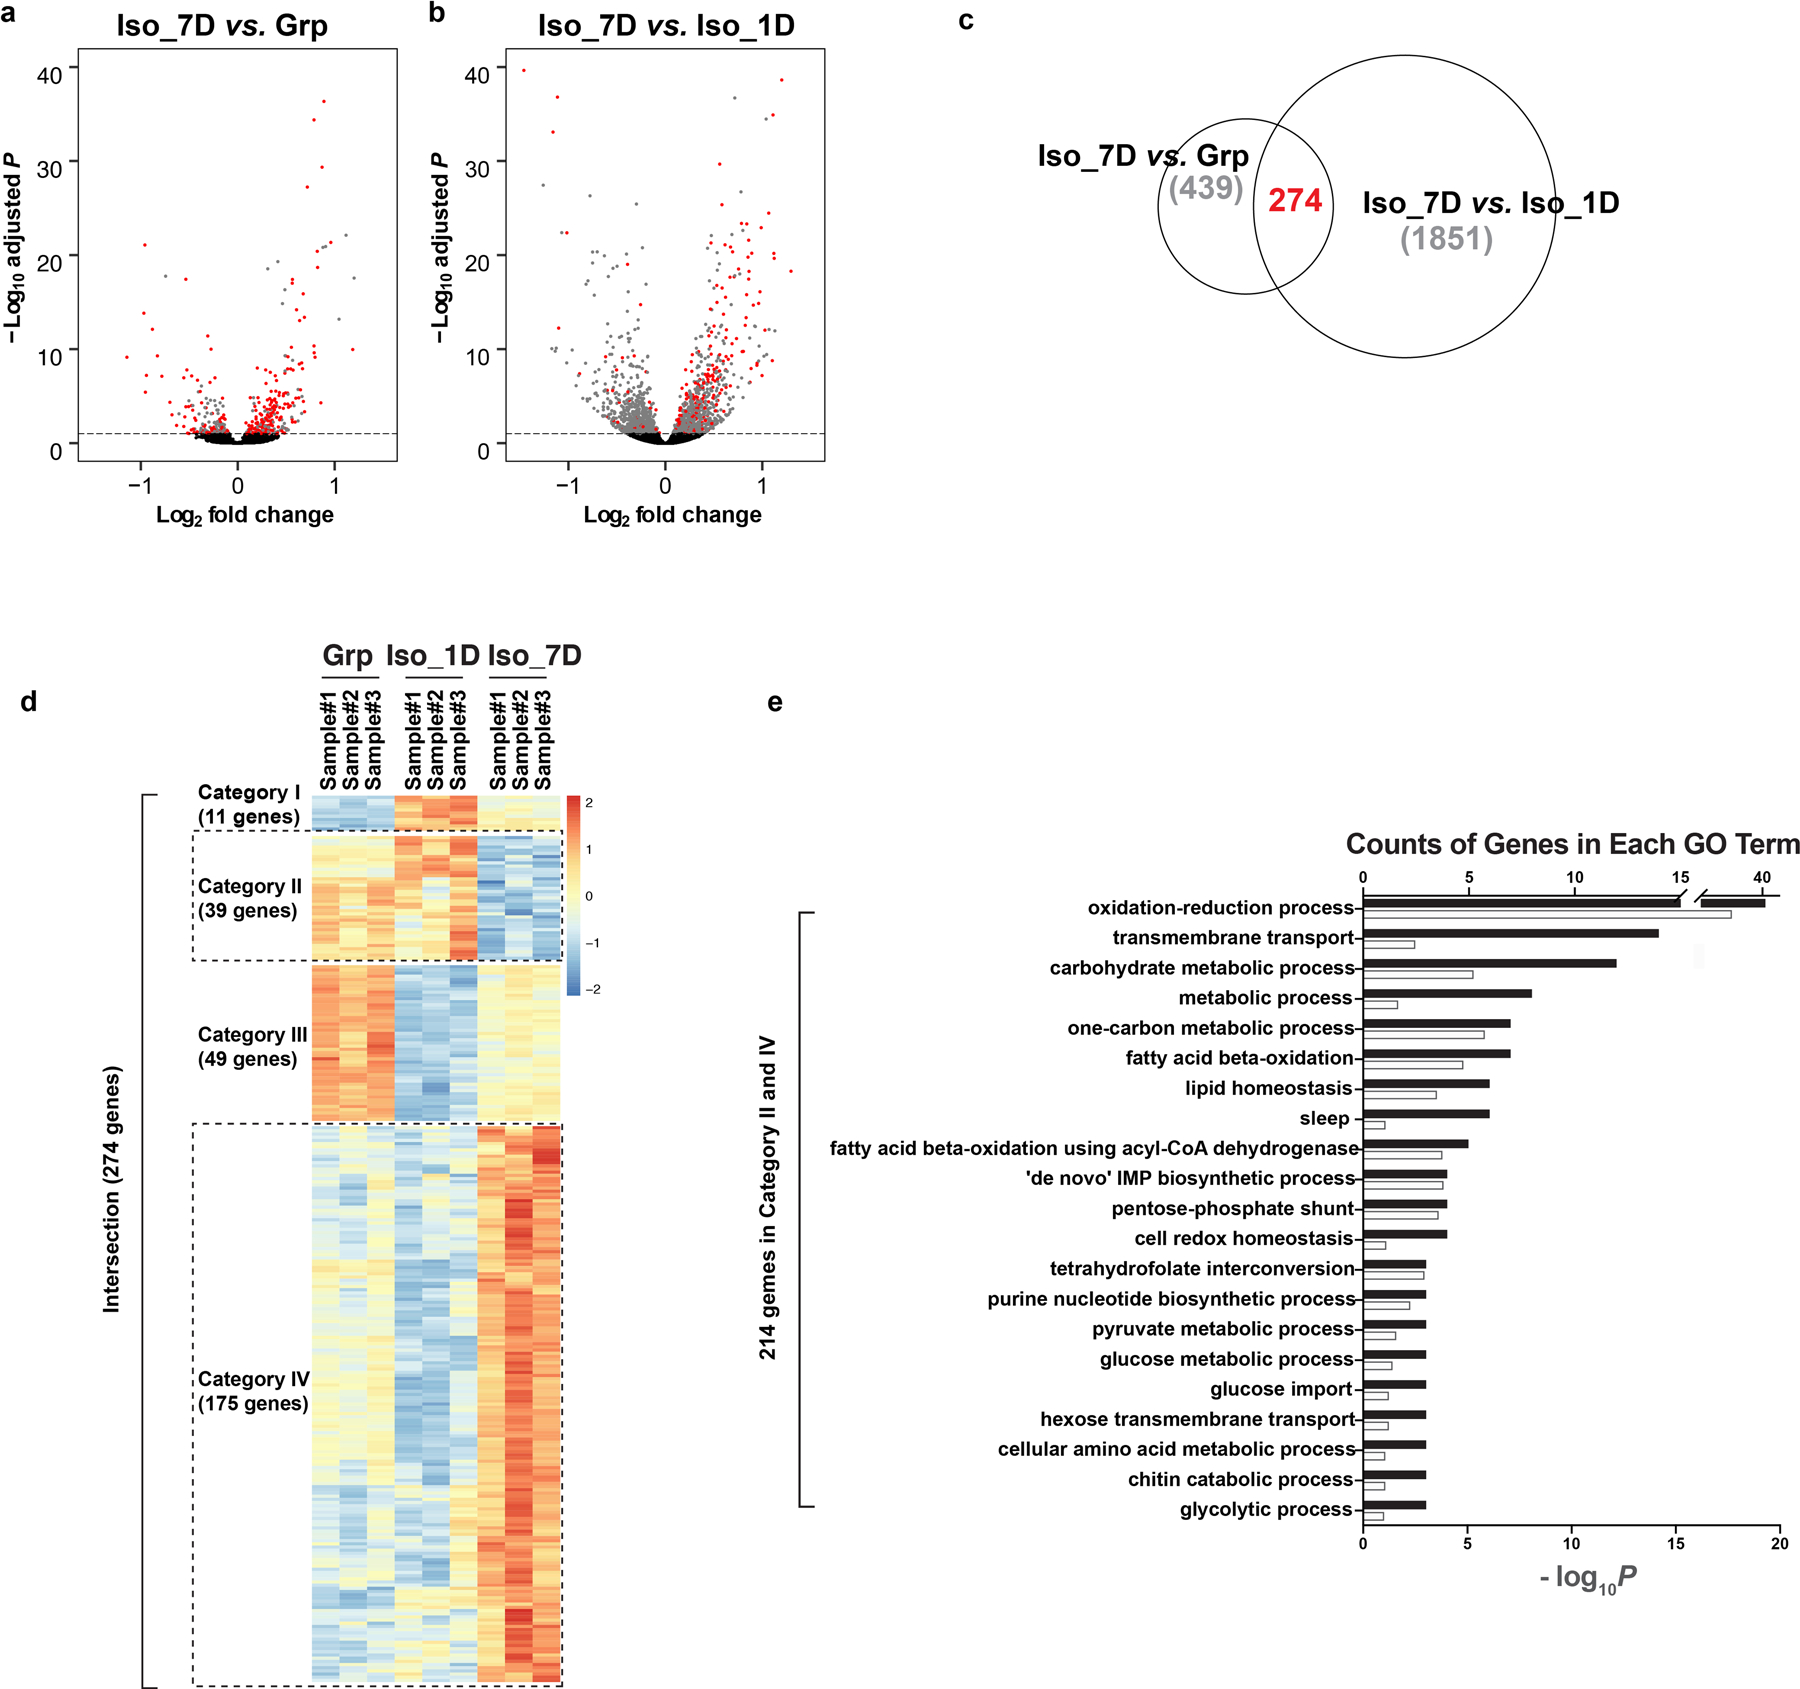
a–b, Volcano plots of differential gene expression from RNA-seq results. Comparison between chronic isolation and group conditions (a, “Iso_7D vs. Grp”). Comparison between chronic isolation and acute isolation conditions (b, “Iso_7D vs, Iso_1D”). Red dots indicate genes showing significant adjusted P-values in both comparisons. Differential gene expression analyses were conducted using DESeq2, which uses two-sided Wald test and Benjamin Hochberg correction. c, Venn diagram showing the intersection of the above two comparisons. d, Heatmap of the 274 intersected genes showing significant differential gene expression changes in both comparisons of “Iso_7D vs. Grp” and “Iso_7D vs. Iso_1D”. e, Gene Ontology of the 214 candidate genes from Category II and Category IV in d; black bar: counts of genes in each GO term; white bar: −log10P values for each GO term. See Methods and Supplementary Information for details on RNA-seq data analyses.
Extended Data Fig. 6. Chronic social isolation results in reduced sleep and excessive feeding, while food consumption is not altered in sleep mutants or after acute social isolation.
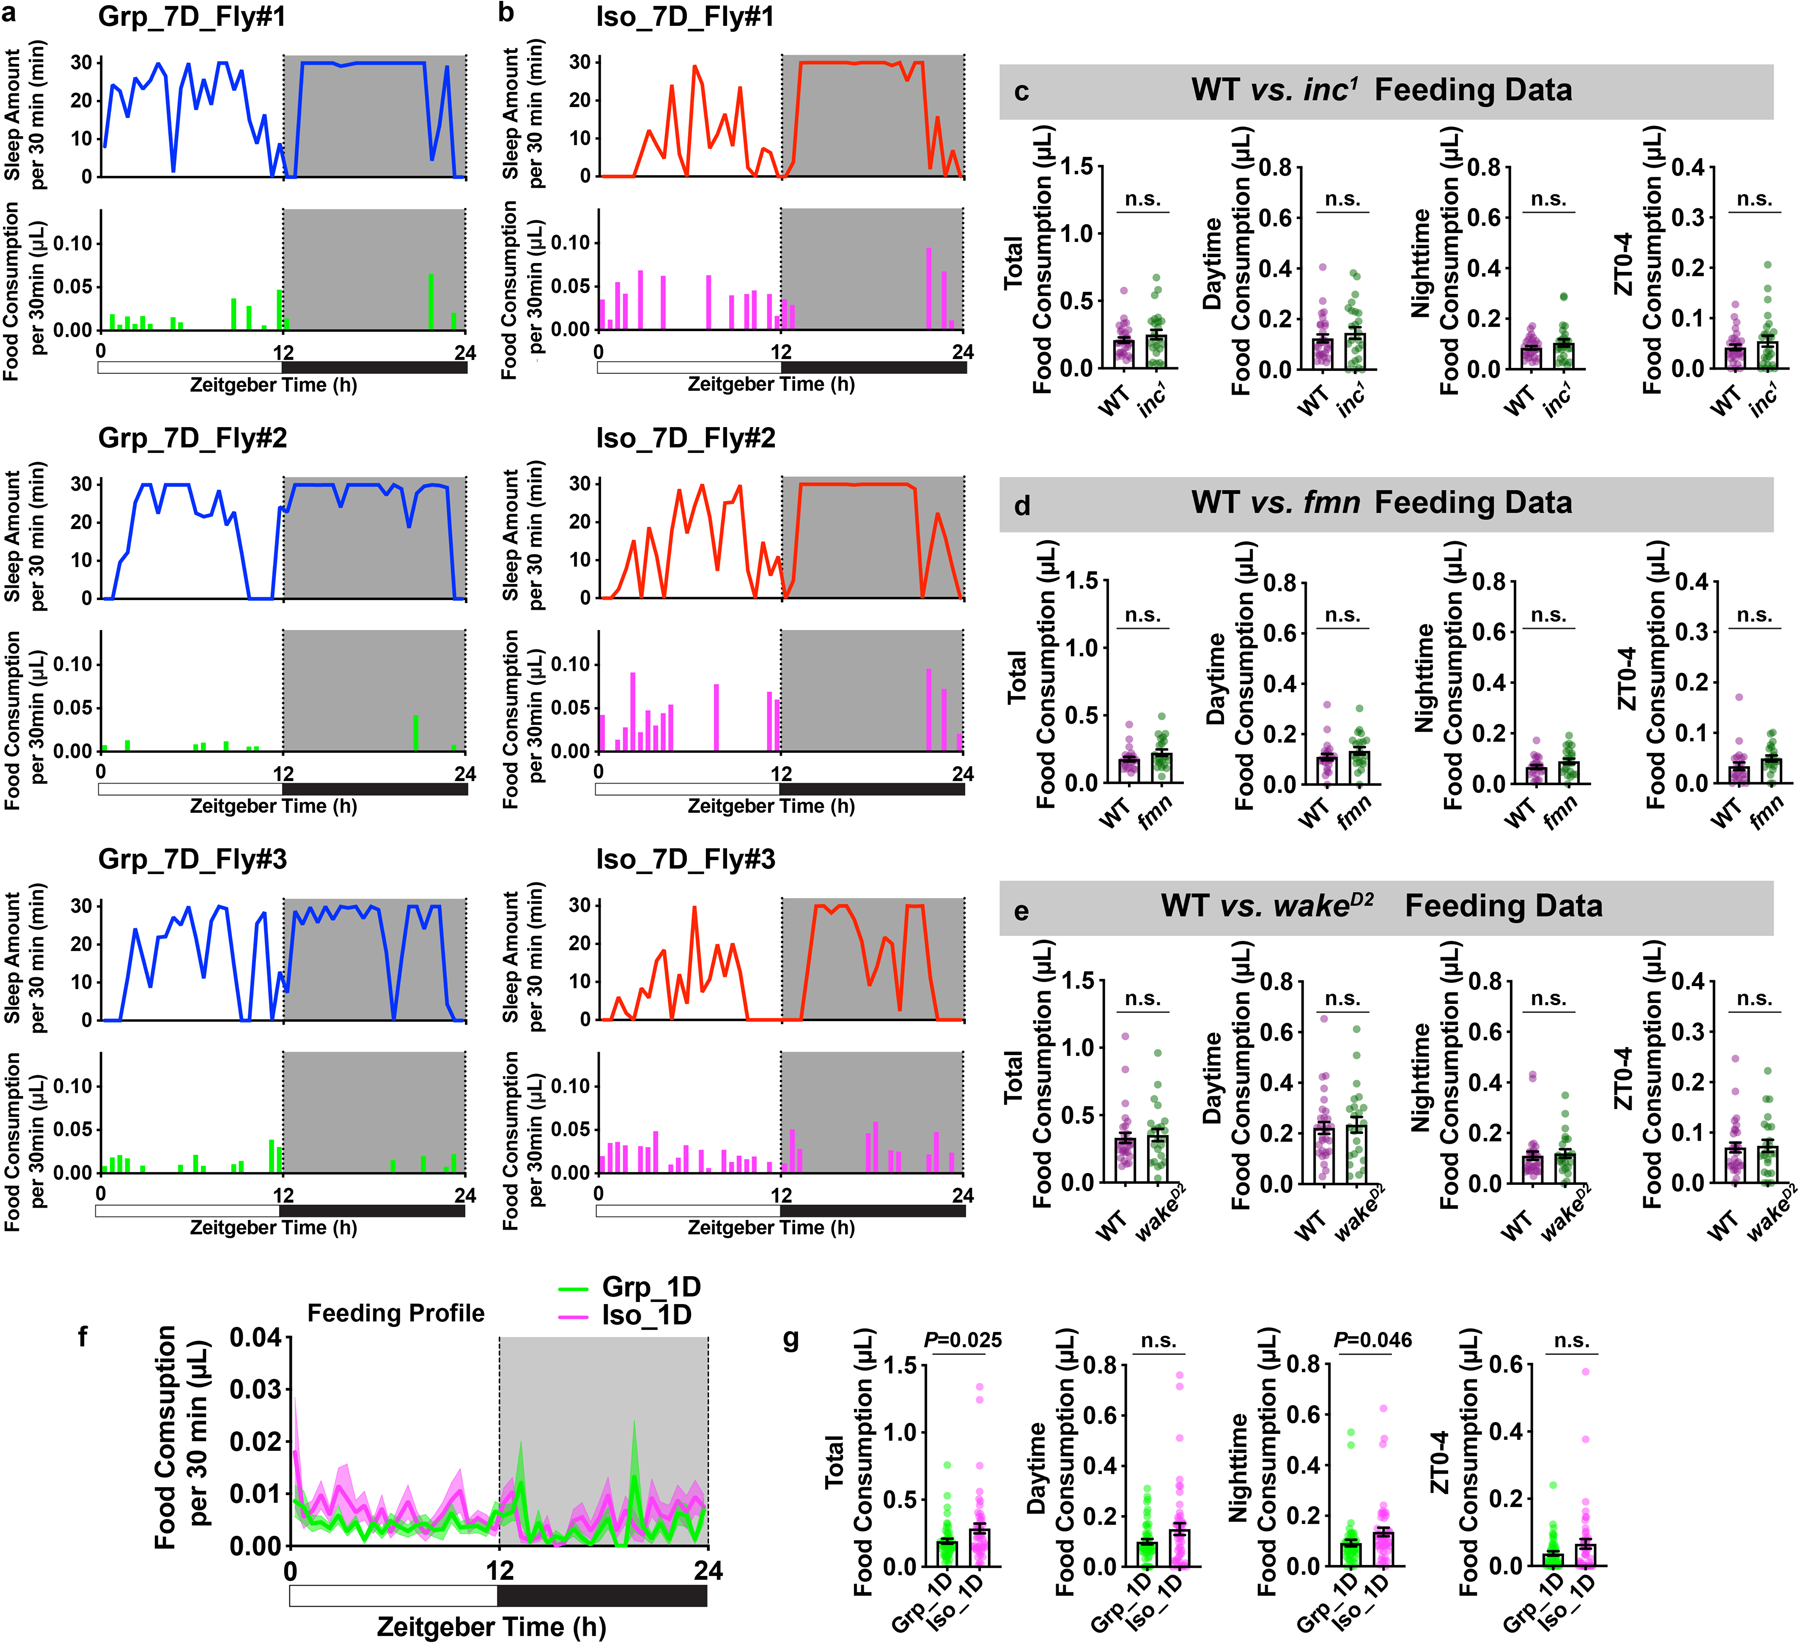
a, Sleep profiles and matching feeding profiles of three representative individual animals after 7 days of group enrichment. b, Sleep profiles and matching feeding profiles of three representative individual animals after 7 days of social isolation. Sleep profile is presented as sleep amount (min) in consecutive 30min segments during a 24hr LD cycle. Matching feeding profile is presented as food consumption (μL) in consecutive 30min segments during a 24hr LD cycle. c, Quantification of daily total food consumption, daytime food consumption, nighttime food consumption and ZT0-4 food consumption for wild type and sleep mutant inc1 flies (N=25–29 animals). d, Quantification of daily total food consumption, daytime food consumption, nighttime food consumption and ZT0-4 food consumption for wild type and sleep mutant fmn flies (N=25–29 animals). e, Quantification of daily total food consumption, daytime food consumption, nighttime food consumption and ZT0-4 food consumption for wild type and sleep mutant wakeD2 flies. (N=23–30 animals). f, Feeding profile measured by ARC (Activity Recording Capillary Feeder) assay in flies following 1 day of group enrichment/social isolation; solid line, Mean; shaded area, ±SEM. g, Quantification of daily total food consumption, daytime food consumption, nighttime food consumption and ZT0-4 food consumption for flies after 1 day of group enrichment/social isolation (f–g, N=49–50 animals). All quantifications are displayed as Mean±SEM with individual data points. Unpaired t-tests with Welch’s correction. For N and P values, see the Source Data.
Extended Data Fig. 7. Limostatin transcripts are detected in fly head RNA-seq sample libraries; NPF-GAL4 expression pattern; feeding profile of flies in experiments silencing P2 neurons; and silencing P2 neurons with UAS-shibirets1 during social isolation is insufficient to block chronic social isolation-induced sleep loss.
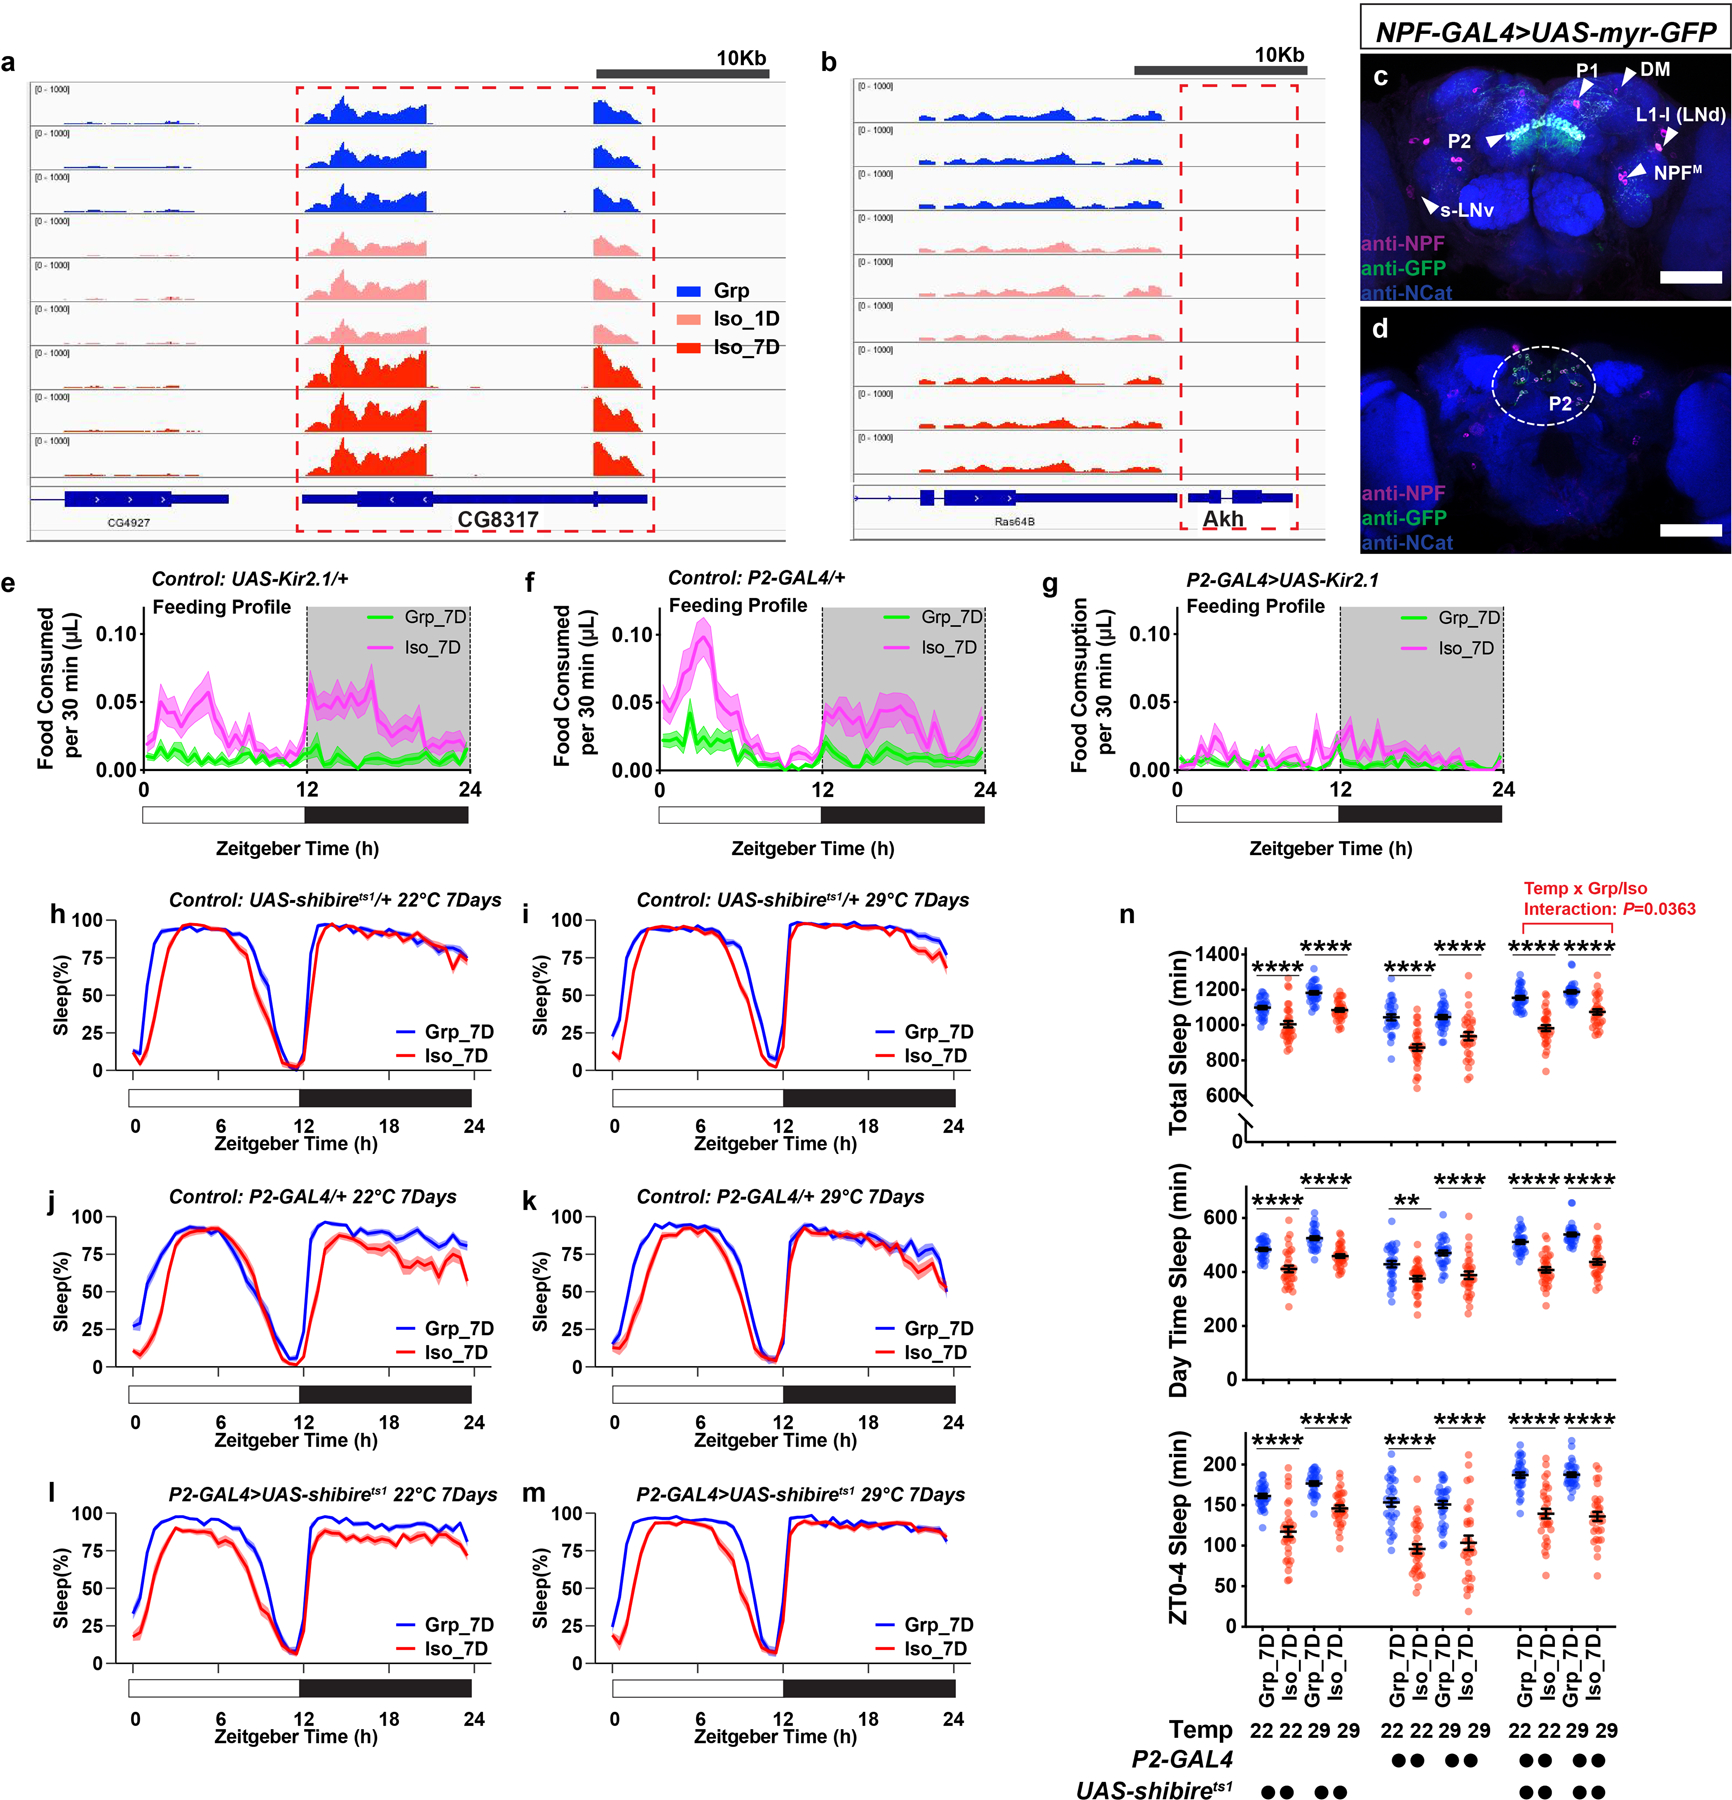
a, Reads from RNA-seq sample libraries (Grp, Iso_1D, and Iso_7D) align to the gene region of Limostatin (CG8317). b, Akh and Lst were known to co-express in the corpora cardiaca13. No reads were detected or aligned to the gene region of Akh, suggesting the RNA-seq samples are free of corpora cardiaca materials and the measured Lst transcripts come from sources in the brain. c, Expression pattern of NPF-GAL4 labeled neurons revealed by UAS-myr::GFP and NPF antibody staining. NPF-immunoreactivity-positive cells overlaps with GFP-positive cells. Triangles indicate P1, P2, DM, L1-l (or LNd)22, s-LNv44 and NPFM45 neurons. d, An additional brain imaged from the posterior end to show NPF and GFP-positive cell bodies of P2 neurons, circled in the dashed line (Magenta: NPF; Green: GFP; Blue: N-cadherin; scale bar: 50μm). e–g, Feeding profiles measured by ARC (Activity Recording Capillary Feeder) assay for parental control flies (e and f) and flies expressing UAS-Kir2.1 with P2-GAL4 (g) following 7 days of group enrichment/social isolation; solid line, Mean; shaded area, ±SEM (N=27–30 animals). h–m, Sleep profiles for parental control flies (h–k) and flies expressing UAS-shibirets with P2-GAL4 (l and m) following 7 days of group enrichment/social isolation at 22°C (h, j, l) or 29°C (i, k, m). All sleep behavior was tested at 22°C. n, Quantification (Mean±SEM with individual data points) of daily total sleep, daytime sleep and ZT0-4 sleep for parental control flies and flies expressing UAS-shibirets with P2-GAL4 following 7 days of group enrichment/social isolation at 22°C or 29°C. Sleep profiles are displayed as the average proportion of time spent sleeping in consecutive 30min segments during a 24hr LD cycle; solid line, Mean; shaded area, ±SEM. For h–n, N=31–32 animals; two-way ANOVA were used for detecting interactions between temperature treatment and group/isolation status; Šidák multiple comparisons tests were used for post-hoc analyses between group treated and isolated animals of the same genotype and temperature treatment; *P<0.05, **P<0.01, ***P<0.001, ****P<0.0001. For N and P values, see the Source Data.
Extended Data Fig. 8. P2 neurons show similar activity patterns after chronic social isolation/group enrichment and P2 neurons synapse onto cell types labelled by R23E20-GAL4.
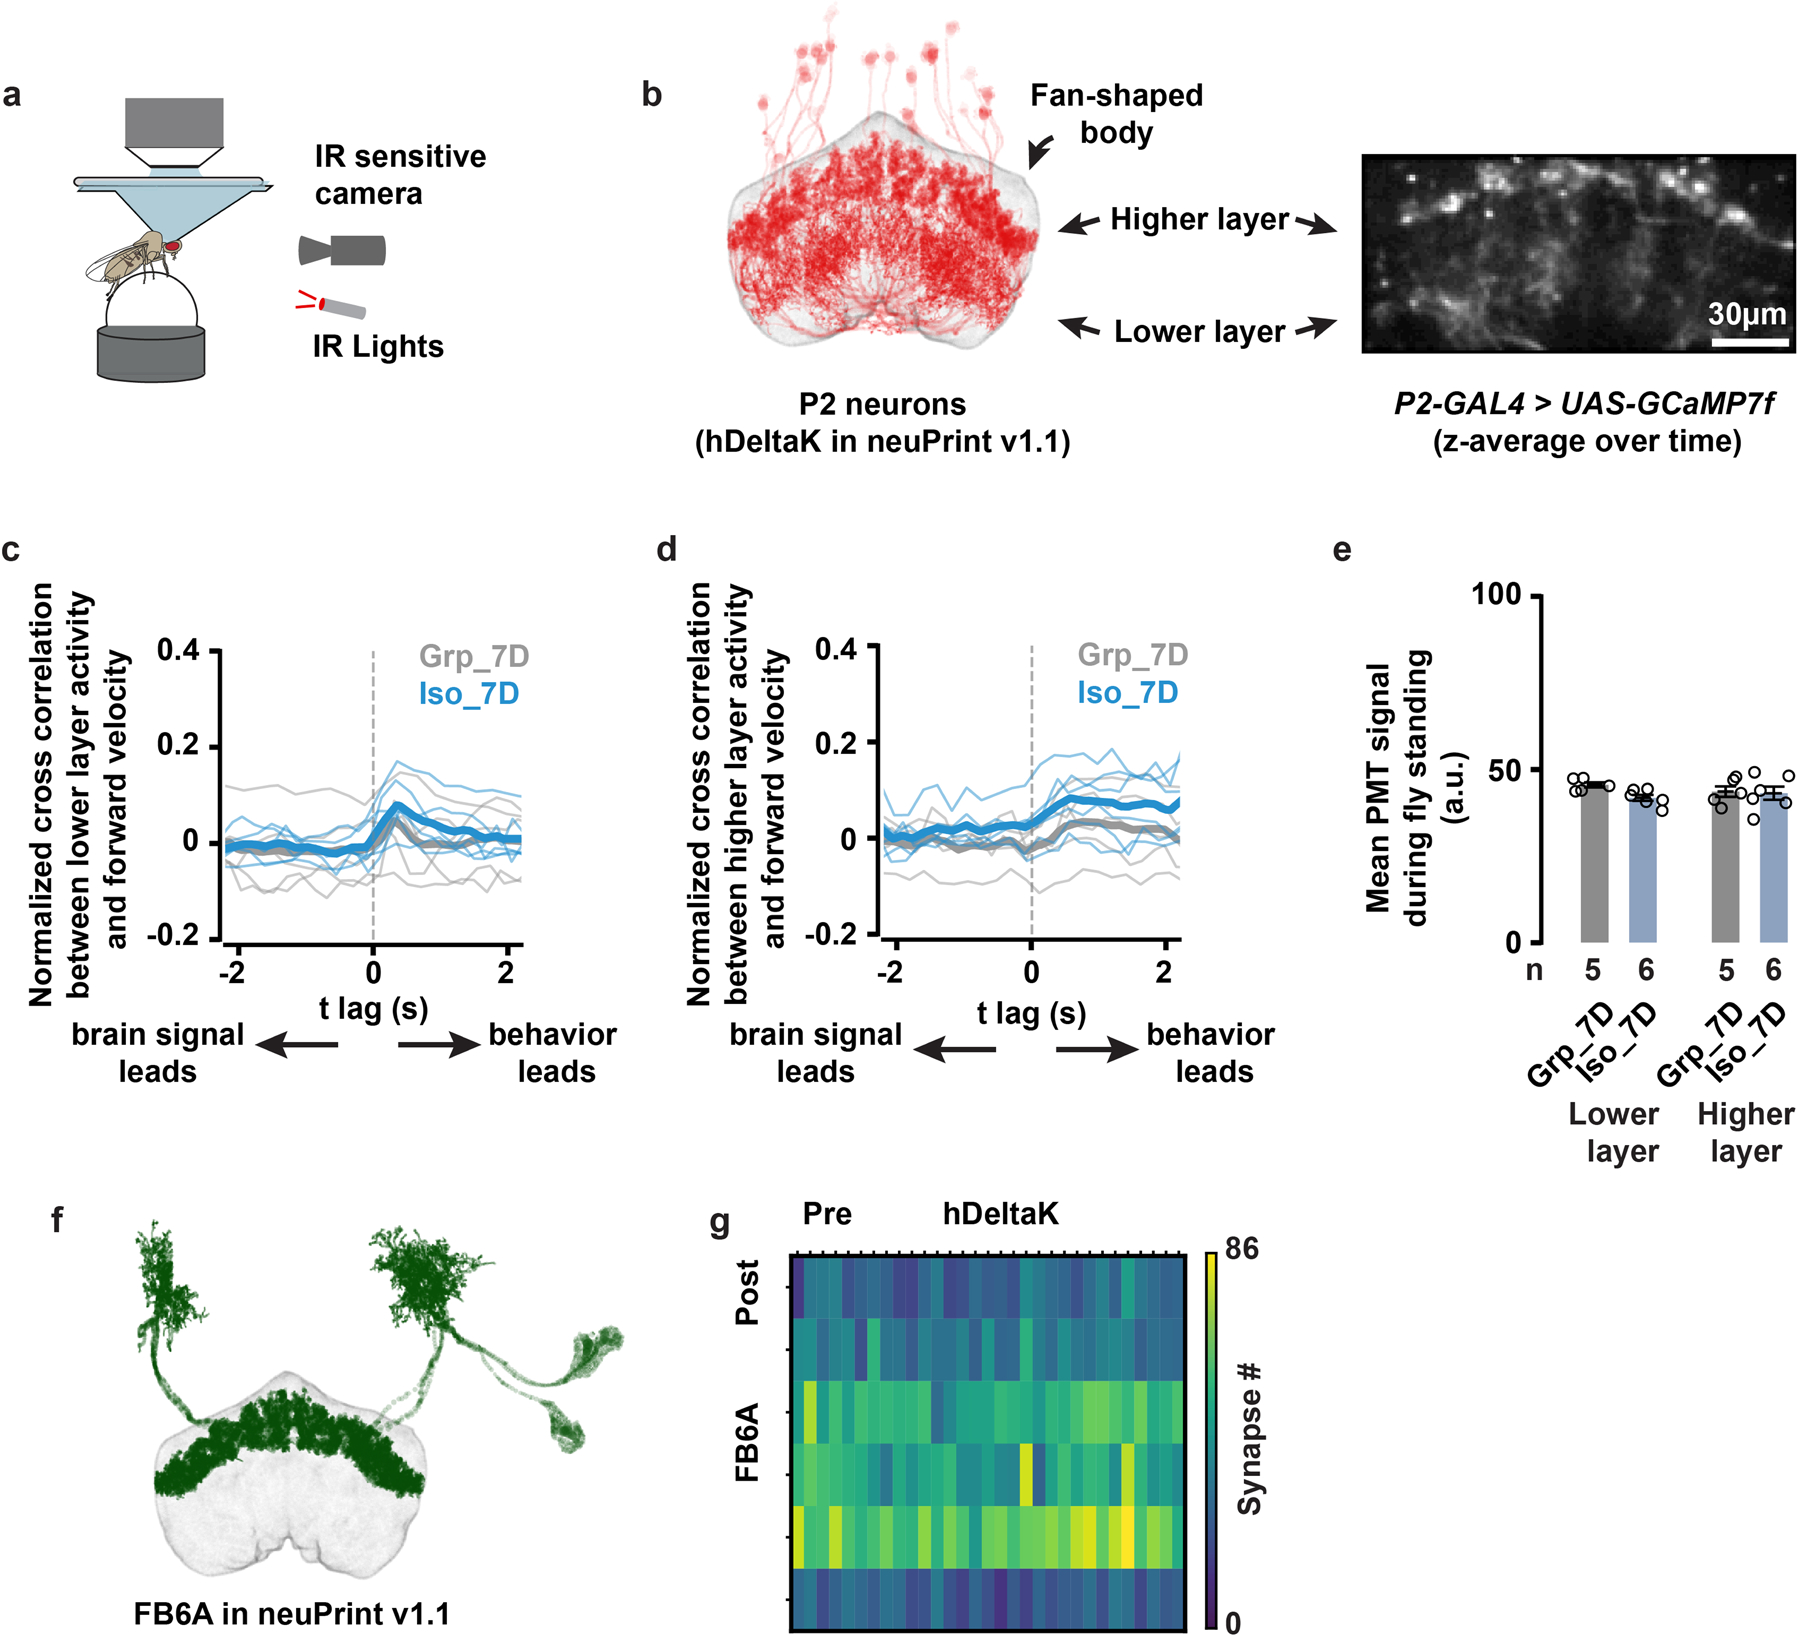
a, Tethered, walking, [Ca2+]-imaging setup with an IR-sensitive camera that tracks the rotation of the ball. b, The anatomy of hDeltaK cells from neuPrint26 (left), compared with time-averaged z projection of GCaMP7f signals driven by P2-GAL4 (right). Both images show two separate layers (higher layer and lower layer) of fan-shaped body neuropils. c, Cross-correlation analysis of the lower-layer GCaMP7f activity and the fly’s forward walking velocity; thin lines: individual fly data; thick lines: population means. d, Cross-correlation analysis of the higher-layer GCaMP7f activity and the fly’s forward walking velocity; thin lines: individual fly data; thick lines: population means. e, Quantification (Mean±SEM with individual data points) of GCaMP7f activity during standing moments of flies following 7 days of group enrichment/social isolation. Identical 2-photon acquisition parameters were used in all experiments (c–e, N=5 to 6 animals). f, The anatomy of FB6A cells from neuPrint. FB6A has been identified as one of the few cell types labelled by R23E10-GAL427. g, Synapse-number matrix for detected synapses from P2 neurons (named hDeltaK cells in neuPrint) to FB6A cells. Connectivity data and cell-type names are based on those in neuPrint, hemibrain: v1.126.
Extended Data Fig. 9. Sleep profiles and feeding profiles of flies in which P2 neurons were thermally activated by expressing UAS-dTPRA1 during acute (1 day) group enrichment/social isolation; parental and temperature controls are included.
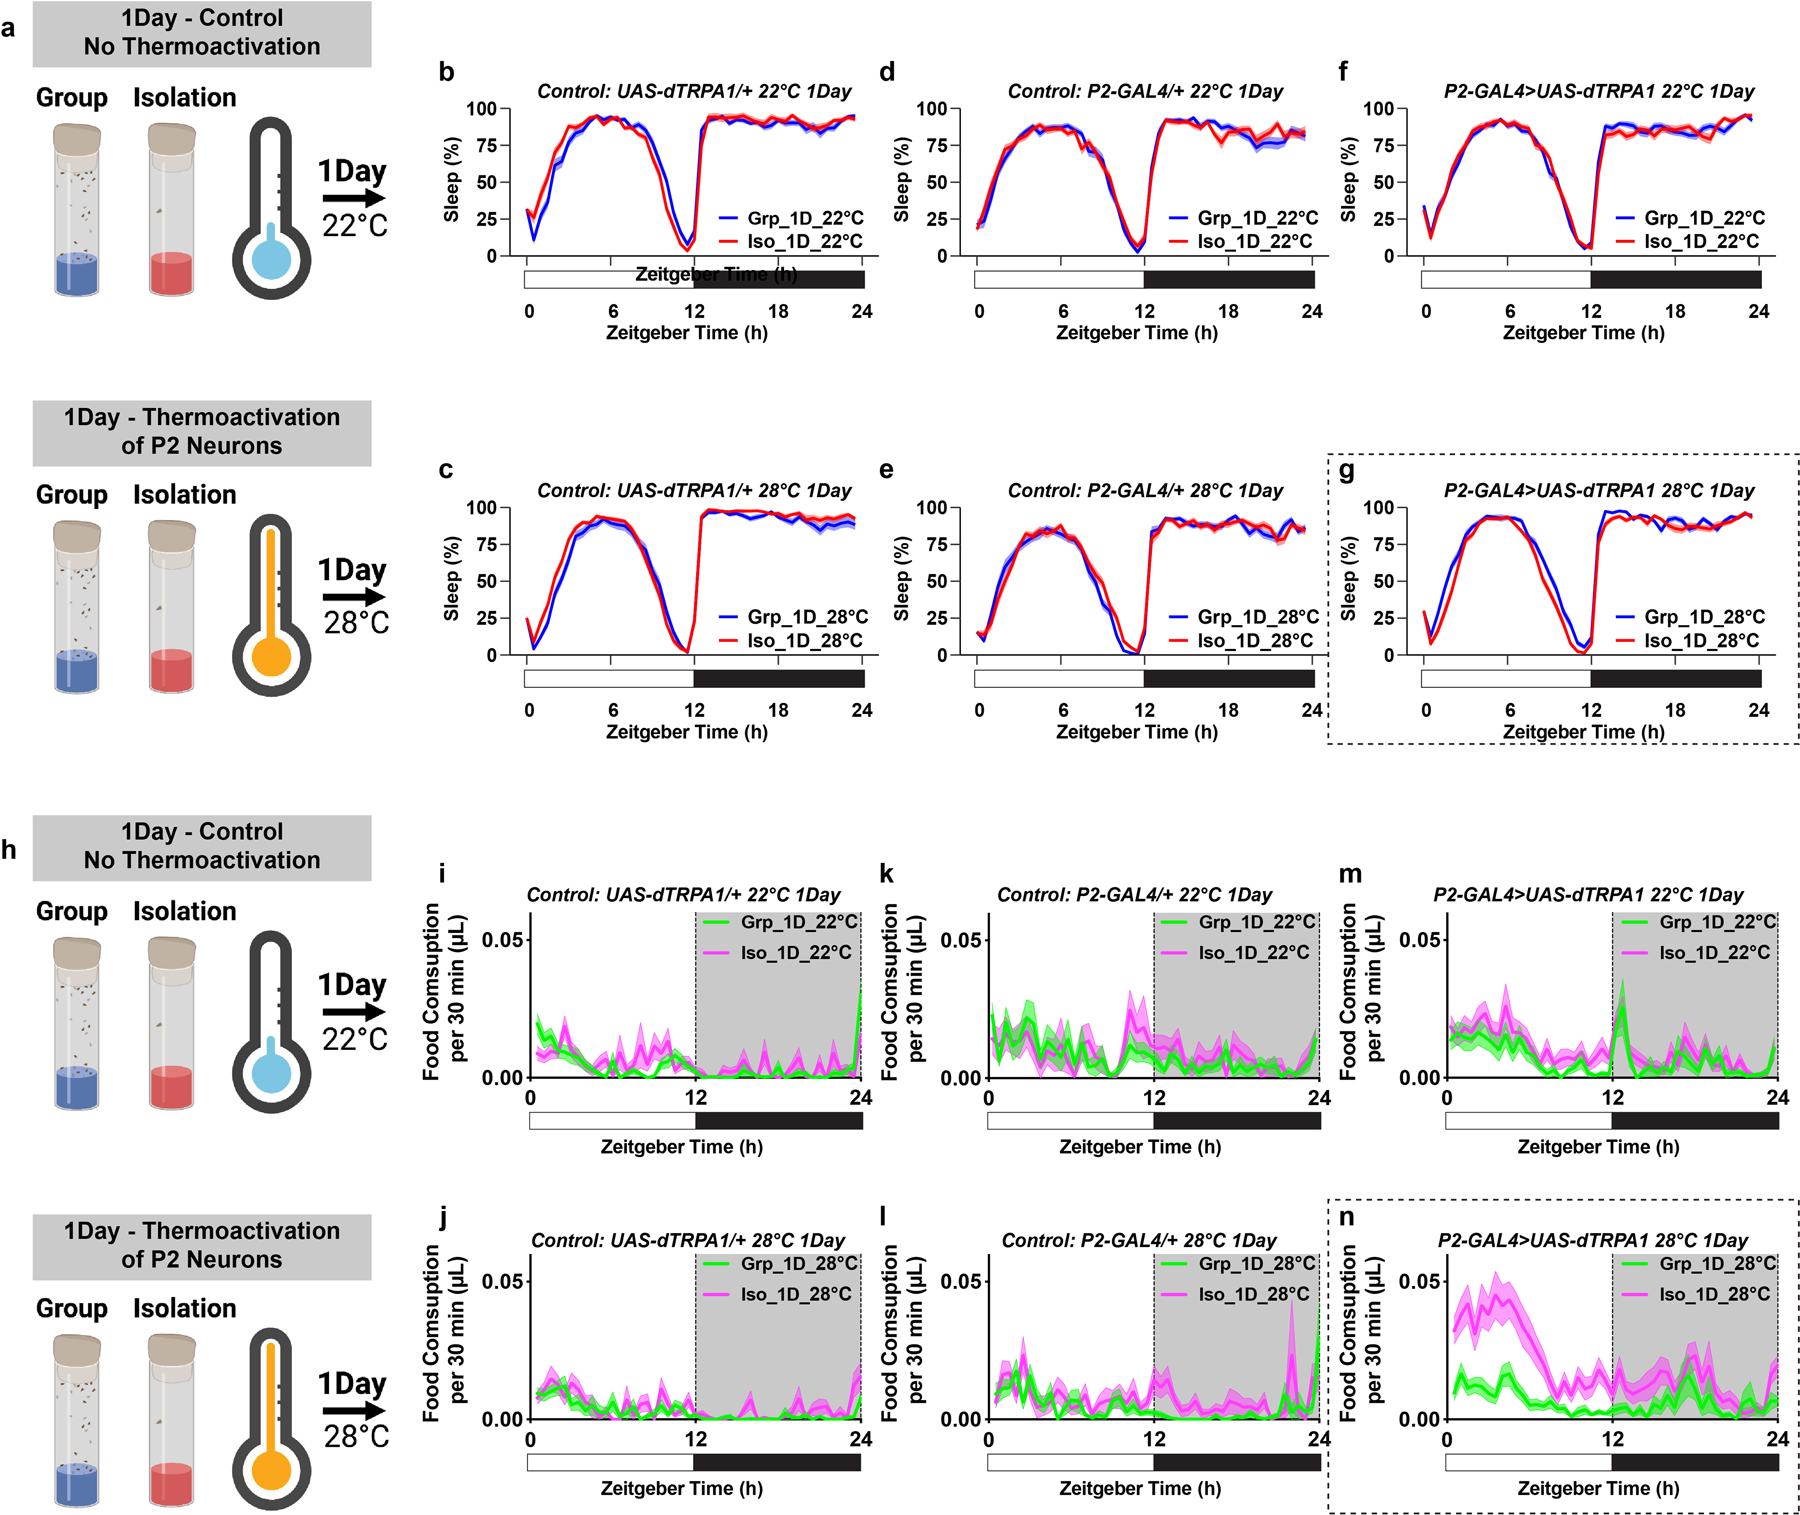
a, Schematics of activating P2 neurons for 1 day of group enrichment/social isolation. 22°C treatments (no thermoactivation) were used as controls. Flies in group enrichment/social isolation were kept at 28°C for 1 day to thermally activate P2 neurons. After 1 day of thermal activation (or no activation), sleep behavior was measured at 22°C. b and c, Sleep profile of UAS-dTRPA1/+ heterozygous control flies after group enrichment/social isolation at 22°C for 1 day or at 28°C for 1 day. d and e, Sleep profile of P2-GAL4/+ heterozygous control flies after group enrichment/social isolation at 22°C for 1 day or at 28°C for 1 day. f and g, Sleep profile of flies expressing UAS-dTRPA1 under the control of P2-GAL4 after group enrichment/social isolation at 22°C for 1 day or at 28°C for 1 day. h, Schematics of activating P2 neurons for 1 day of group enrichment/social isolation. 22°C treatments (no thermoactivation) were used as controls. Flies in group enrichment/social isolation were kept at 28°C for 1 day to thermally activate P2 neurons. After 1 day of thermal activation (or no activation), feeding behavior was measured at 22°C. i and j, Feeding profile of UAS-dTRPA1/+ heterozygous control flies after group enrichment/social isolation at 22°C for 7 days or at 28°C for 7 days. k and l, Feeding profile of P2-GAL4/+ heterozygous control flies after group enrichment/social isolation at 22°C for 7 days or at 28°C for 7 days. m and n, Feeding profile of flies expressing UAS-dTRPA1 under the control of P2-GAL4 after group enrichment/social isolation at 22°C for 7 days or at 28°C for 7 days. Sleep profiles are displayed as the average proportion of time spent sleeping in consecutive 30min segments during a 24hr LD cycle; solid line, Mean; shaded area, ±SEM. Feeding profiles are presented as average food consumption (μL) in consecutive 30min segments during a 24hr LD cycle; solid line, Mean; shaded area, ±SEM; b–e and i–n, N=28–32 animals.
Extended Data Fig. 10. Sleep profiles of flies in which P2 neurons were thermally activated by expressing UAS-dTPRA1 during chronic (7 days) group enrichment/social isolation; parental and temperature controls are included.
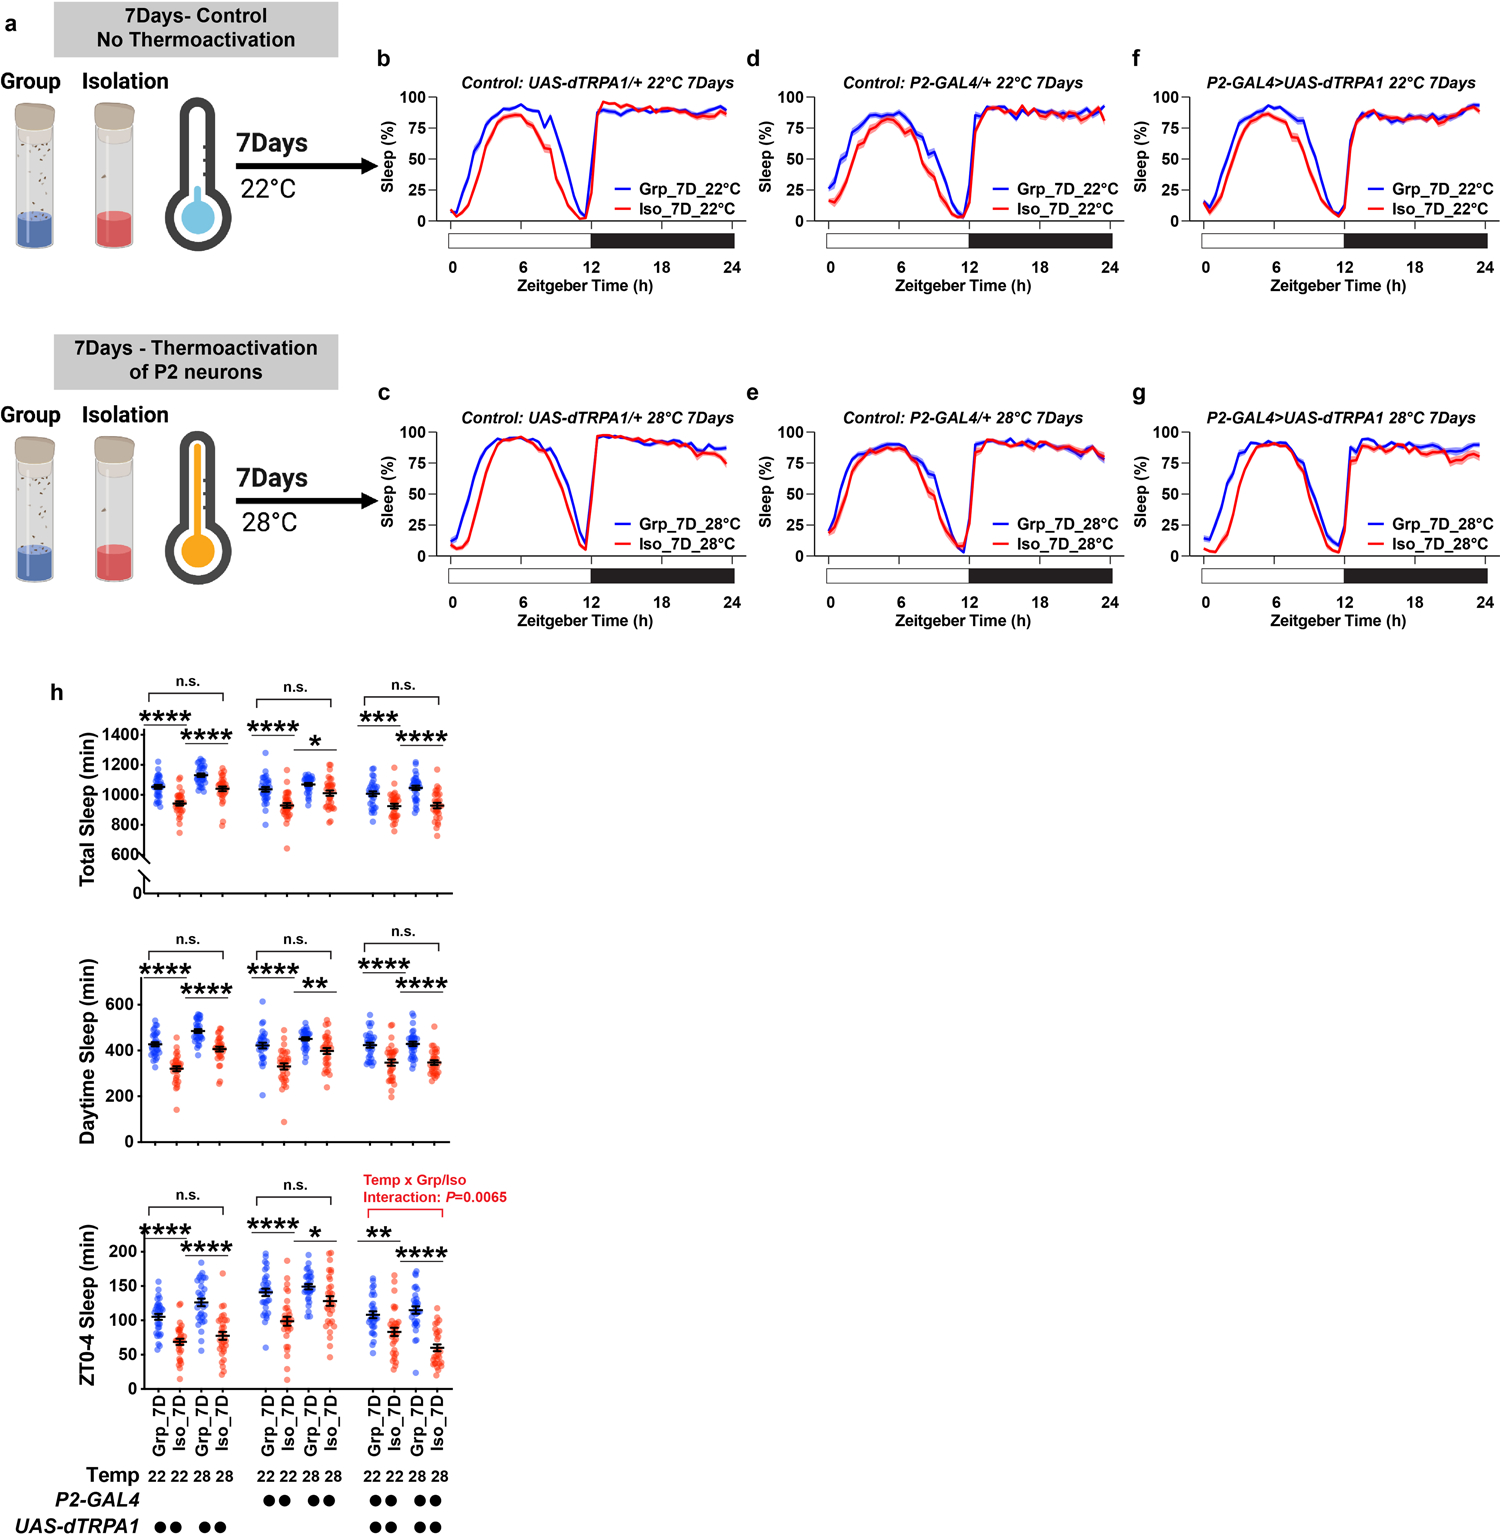
a, Schematics of activating P2 neurons for 7 days of group enrichment/social isolation. 22°C treatments (no thermoactivation) were used as controls. Flies in group enrichment/social isolation were kept at 28°C for 7 days to thermally activate P2 neurons. After 7 days of thermal activation (or no activation), sleep behavior was measured at 22°C. b and c, Sleep profile of UAS-dTRPA1/+ heterozygous control flies after group enrichment/social isolation at 22°C for 7 days or at 28°C for 7 days. d and e, Sleep profile of P2-GAL4/+ heterozygous control flies after group enrichment/social isolation at 22°C for 7 days or at 28°C for 7 days. f and g, Sleep profile of flies expressing UAS-dTRPA1 under the control of P2-GAL4 after group enrichment/social isolation at 22°C for 7 days or at 28°C for 7 days. h, Quantification (Mean±SEM with individual data points) of daily total sleep, daytime sleep and ZT0-4 sleep for experimental and heterozygous control flies grouped or isolated for 7 days with (28°C) or without (22°C) thermal activation of P2-GAL4 labelled neurons. Sleep profiles are displayed as the average proportion of time spent sleeping in consecutive 30min segments during a 24hr LD cycle; solid line, Mean; shaded area, ±SEM. For h, two-way ANOVA were used for detecting interactions between temperature treatment and group/isolation status. Šidák multiple comparisons tests were used for post-hoc analyses between group treated and isolated animals of the same genotype and temperature treatment, *P<0.05, **P<0.01, ***P<0.001, ****P<0.0001; b–h, N=29–32 animals. For N and P values, see the Source Data.
Supplementary Material
Acknowledgements
We thank Gaby Maimon for advice on [Ca2+] imaging experiments and quantitative analysis of the hemibrain connectome. We thank Jinhong Park, William Ja, Lisha Shao, Ulrike Heberlein, Sangbin Park, Seung Kim, Amita Sehgal, Mark Wu, Herman Steller for sharing fly stocks, reagents, protocols, and equipment. We thank Bruce McEwen, Leslie Vosshall, Alina Patke, Li Zhao, Nicolas Svetec, Yichun Shuai, Sofia Axelrod, and Deniz Top for comments on the manuscripts. We thank the Resource Center of Precision Instrumentation Technologies and the Resource Center of Genomics at the Rockefeller University for technical support. We thank Bloomington Drosophila Stock Center for fly stocks and the Developmental Studies Hybridoma Bank for antibodies. This work was supported by NIH grants 5R37 NS053087 and 5R35 GM136237 to M.W.Y. Wanhe Li was supported by fellowships from the Leon Levy Foundation, the Jane Coffin Childs Memorial Fund, and the Grass Foundation. Sheyum Syed was partially supported by NSF IOS# 1656603. Cheng Lyu was supported by a seed grant from the Kavli Foundation.
Footnotes
Declaration of Interest
The author declares no competing interests.
References
- 1.Cacioppo JT & Cacioppo S The growing problem of loneliness. Lancet 391, 426, doi: 10.1016/S0140-6736(18)30142-9 (2018). [DOI] [PMC free article] [PubMed] [Google Scholar]
- 2.Steptoe A, Shankar A, Demakakos P & Wardle J Social isolation, loneliness, and all-cause mortality in older men and women. Proc Natl Acad Sci U S A 110, 5797–5801, doi: 10.1073/pnas.1219686110 (2013). [DOI] [PMC free article] [PubMed] [Google Scholar]
- 3.Holt-Lunstad J, Smith TB & Layton JB Social relationships and mortality risk: a meta-analytic review. PLoS Med 7, e1000316, doi: 10.1371/journal.pmed.1000316 (2010). [DOI] [PMC free article] [PubMed] [Google Scholar]
- 4.Holt-Lunstad J, Smith TB, Baker M, Harris T & Stephenson D Loneliness and social isolation as risk factors for mortality: a meta-analytic review. Perspect Psychol Sci 10, 227–237, doi: 10.1177/1745691614568352 (2015). [DOI] [PubMed] [Google Scholar]
- 5.Cacioppo JT et al. Loneliness and health: potential mechanisms. Psychosom Med 64, 407–417, doi: 10.1097/00006842-200205000-00005 (2002). [DOI] [PubMed] [Google Scholar]
- 6.Kurina LM et al. Loneliness is associated with sleep fragmentation in a communal society. Sleep 34, 1519–1526, doi: 10.5665/sleep.1390 (2011). [DOI] [PMC free article] [PubMed] [Google Scholar]
- 7.Cacioppo JT et al. Loneliness across phylogeny and a call for comparative studies and animal models. Perspect Psychol Sci 10, 202–212, doi: 10.1177/1745691614564876 (2015). [DOI] [PMC free article] [PubMed] [Google Scholar]
- 8.Anderson DJ & Adolphs R A framework for studying emotions across species. Cell 157, 187–200, doi: 10.1016/j.cell.2014.03.003 (2014). [DOI] [PMC free article] [PubMed] [Google Scholar]
- 9.Sokolowski MB Social interactions in “simple” model systems. Neuron 65, 780–794, doi: 10.1016/j.neuron.2010.03.007 (2010). [DOI] [PubMed] [Google Scholar]
- 10.Ramdya P, Schneider J & Levine JD The neurogenetics of group behavior in Drosophila melanogaster. J. Exp. Biol 220, 35–41, doi: 10.1242/jeb.141457 (2017). [DOI] [PubMed] [Google Scholar]
- 11.Danchin E et al. Cultural flies: Conformist social learning in fruitflies predicts long-lasting mate-choice traditions. Science 362, 1025–1030, doi: 10.1126/science.aat1590 (2018). [DOI] [PubMed] [Google Scholar]
- 12.Ganguly-Fitzgerald I, Donlea J & Shaw PJ Waking experience affects sleep need in Drosophila. Science 313, 1775–1781, doi: 10.1126/science.1130408 (2006). [DOI] [PubMed] [Google Scholar]
- 13.Alfa RW et al. Suppression of insulin production and secretion by a decretin hormone. Cell Metab. 21, 323–333, doi: 10.1016/j.cmet.2015.01.006 (2015). [DOI] [PMC free article] [PubMed] [Google Scholar]
- 14.Söderberg JAE, Carlsson MA & Nässel DR Insulin-Producing Cells in the Drosophila Brain also Express Satiety-Inducing Cholecystokinin-Like Peptide, Drosulfakinin. Front. Endocrinol 3, 109, doi: 10.3389/fendo.2012.00109 (2012). [DOI] [PMC free article] [PubMed] [Google Scholar]
- 15.Buch S, Melcher C, Bauer M, Katzenberger J & Pankratz MJ Opposing effects of dietary protein and sugar regulate a transcriptional target of Drosophila insulin-like peptide signaling. Cell Metab. 7, 321–332, doi: 10.1016/j.cmet.2008.02.012 (2008). [DOI] [PubMed] [Google Scholar]
- 16.Sonn JY et al. Serine metabolism in the brain regulates starvation-induced sleep suppression in Drosophila melanogaster. Proc Natl Acad Sci U S A 115, 7129–7134, doi: 10.1073/pnas.1719033115 (2018). [DOI] [PMC free article] [PubMed] [Google Scholar]
- 17.Murphy KR, Park JH, Huber R & Ja WW Simultaneous measurement of sleep and feeding in individual Drosophila. Nat. Protoc 12, 2355–2366, doi: 10.1038/nprot.2017.096 (2017). [DOI] [PMC free article] [PubMed] [Google Scholar]
- 18.Kume K, Kume S, Park SK, Hirsh J & Jackson FR Dopamine is a regulator of arousal in the fruit fly. J. Neurosci 25, 7377–7384, doi: 10.1523/JNEUROSCI.2048-05.2005 (2005). [DOI] [PMC free article] [PubMed] [Google Scholar]
- 19.Liu S et al. WIDE AWAKE mediates the circadian timing of sleep onset. Neuron 82, 151–166, doi: 10.1016/j.neuron.2014.01.040 (2014). [DOI] [PMC free article] [PubMed] [Google Scholar]
- 20.Stavropoulos N & Young MW insomniac and Cullin-3 regulate sleep and wakefulness in Drosophila. Neuron 72, 964–976, doi: 10.1016/j.neuron.2011.12.003 (2011). [DOI] [PMC free article] [PubMed] [Google Scholar]
- 21.Davis FP et al. A genetic, genomic, and computational resource for exploring neural circuit function. Elife 9, doi: 10.7554/eLife.50901 (2020). [DOI] [PMC free article] [PubMed] [Google Scholar]
- 22.Shao L et al. Dissection of the Drosophila neuropeptide F circuit using a high-throughput two-choice assay. Proc Natl Acad Sci U S A 114, E8091–E8099, doi: 10.1073/pnas.1710552114 (2017). [DOI] [PMC free article] [PubMed] [Google Scholar]
- 23.Donlea JM, Pimentel D & Miesenböck G Neuronal machinery of sleep homeostasis in Drosophila. Neuron 81, 860–872, doi: 10.1016/j.neuron.2013.12.013 (2014). [DOI] [PMC free article] [PubMed] [Google Scholar]
- 24.Jenett A et al. A GAL4-driver line resource for Drosophila neurobiology. Cell Rep. 2, 991–1001, doi: 10.1016/j.celrep.2012.09.011 (2012). [DOI] [PMC free article] [PubMed] [Google Scholar]
- 25.Nern A, Pfeiffer BD & Rubin GM Optimized tools for multicolor stochastic labeling reveal diverse stereotyped cell arrangements in the fly visual system. Proc. Natl. Acad. Sci. U. S. A 112, E2967–2976, doi: 10.1073/pnas.1506763112 (2015). [DOI] [PMC free article] [PubMed] [Google Scholar]
- 26.Scheffer LK et al. A connectome and analysis of the adult Drosophila central brain. eLife 9, e57443, doi: 10.7554/eLife.57443 (2020). [DOI] [PMC free article] [PubMed] [Google Scholar]
- 27.Hulse BK et al. A connectome of the Drosophila central complex reveals network motifs suitable for flexible navigation and context-dependent action selection. bioRxiv, 10.1101/2020.12.08.413955 (2020). [DOI] [PMC free article] [PubMed] [Google Scholar]
- 28.Baines RA, Uhler JP, Thompson A, Sweeney ST & Bate M Altered electrical properties in Drosophila neurons developing without synaptic transmission. J. Neurosci 21, 1523–1531 (2001). [DOI] [PMC free article] [PubMed] [Google Scholar]
- 29.Donlea JM et al. Recurrent Circuitry for Balancing Sleep Need and Sleep. Neuron 97, 378–389 e374, doi: 10.1016/j.neuron.2017.12.016 (2018). [DOI] [PMC free article] [PubMed] [Google Scholar]
- 30.Pimentel D et al. Operation of a homeostatic sleep switch. Nature 536, 333–337, doi: 10.1038/nature19055 (2016). [DOI] [PMC free article] [PubMed] [Google Scholar]
- 31.Kempf A, Song SM, Talbot CB & Miesenbock G A potassium channel beta-subunit couples mitochondrial electron transport to sleep. Nature 568, 230–234, doi: 10.1038/s41586-019-1034-5 (2019). [DOI] [PMC free article] [PubMed] [Google Scholar]
- 32.Ertekin D, Kirszenblat L, Faville R & van Swinderen B Down-regulation of a cytokine secreted from peripheral fat bodies improves visual attention while reducing sleep in Drosophila. PLoS Biol 18, e3000548, doi: 10.1371/journal.pbio.3000548 (2020). [DOI] [PMC free article] [PubMed] [Google Scholar]
- 33.de Bono M & Bargmann CI Natural variation in a neuropeptide Y receptor homolog modifies social behavior and food response in C. elegans. Cell 94, 679–689, doi: 10.1016/S0092-8674(00)81609-8 (1998). [DOI] [PubMed] [Google Scholar]
- 34.Li W et al. Activation of transposable elements during aging and neuronal decline in Drosophila. Nat. Neurosci 16, 529–531, doi: 10.1038/nn.3368 (2013). [DOI] [PMC free article] [PubMed] [Google Scholar]
- 35.Serrano Negron YL, Hansen NF & Harbison ST The Sleep Inbred Panel, a Collection of Inbred Drosophila melanogaster with Extreme Long and Short Sleep Duration. G3 (Bethesda) 8, 2865–2873, doi: 10.1534/g3.118.200503 (2018). [DOI] [PMC free article] [PubMed] [Google Scholar]
- 36.Harbison ST, Serrano Negron YL, Hansen NF & Lobell AS Selection for long and short sleep duration in Drosophila melanogaster reveals the complex genetic network underlying natural variation in sleep. PLoS Genet. 13, e1007098, doi: 10.1371/journal.pgen.1007098 (2017). [DOI] [PMC free article] [PubMed] [Google Scholar]
- 37.Geissmann Q, Garcia Rodriguez L, Beckwith EJ & Gilestro GF Rethomics: An R framework to analyse high-throughput behavioural data. PLoS One 14, e0209331, doi: 10.1371/journal.pone.0209331 (2019). [DOI] [PMC free article] [PubMed] [Google Scholar]
- 38.Dobin A et al. STAR: ultrafast universal RNA-seq aligner. Bioinformatics 29, 15–21, doi: 10.1093/bioinformatics/bts635 (2013). [DOI] [PMC free article] [PubMed] [Google Scholar]
- 39.Liao Y, Smyth GK & Shi W featureCounts: an efficient general purpose program for assigning sequence reads to genomic features. Bioinformatics 30, 923–930, doi: 10.1093/bioinformatics/btt656 (2014). [DOI] [PubMed] [Google Scholar]
- 40.Love MI, Huber W & Anders S Moderated estimation of fold change and dispersion for RNA-seq data with DESeq2. Genome Biol. 15, 550, doi: 10.1186/s13059-014-0550-8 (2014). [DOI] [PMC free article] [PubMed] [Google Scholar]
- 41.Huang DW, Sherman BT & Lempicki RA Systematic and integrative analysis of large gene lists using DAVID bioinformatics resources. Nat. Protoc 4, 44–57, doi: 10.1038/nprot.2008.211 (2009). [DOI] [PubMed] [Google Scholar]
- 42.Green J et al. A neural circuit architecture for angular integration in Drosophila. Nature 546, 101–106, doi: 10.1038/nature22343 (2017). [DOI] [PMC free article] [PubMed] [Google Scholar]
Associated Data
This section collects any data citations, data availability statements, or supplementary materials included in this article.
Supplementary Materials
Data Availability Statement
The RNA-Seq datasets generated in this study have been deposited in NCBI’s Gene Expression Omnibus43 and are accessible through GEO series accession number GSE137498. Source data are provided with this paper.


