

SUMMARY
Bacterial ADP-ribosyltransferases (ADPRTs) have been described as toxins involved in pathogenesis through the modification of host proteins. Here, we report that ADPRTs are not pathogen-restricted but widely prevalent in the human gut microbiome and often associated with phage elements. We validated their biochemical activity in a large clinical isolate collection and further examined Bxa, a highly abundant ADPRT in Bacteroides. Bxa is expressed, secreted and enzymatically active in Bacteroides and can ADP-ribosylate non-muscle myosin II proteins. Addition of Bxa to epithelial cells remodeled the actin cytoskeleton and induced secretion of inosine. Bxa-encoding B. stercoris can use inosine as a carbon source and colonizes the gut to significantly greater numbers than a bxa-deleted strain in germ-free and Altered Schaedler Flora (ASF) mice. Colonization correlated with increased inosine concentrations in the feces and tissues. Altogether, our results show that ADPRTs are abundant in the microbiome and act as bacterial fitness factors.
eTOC Summary
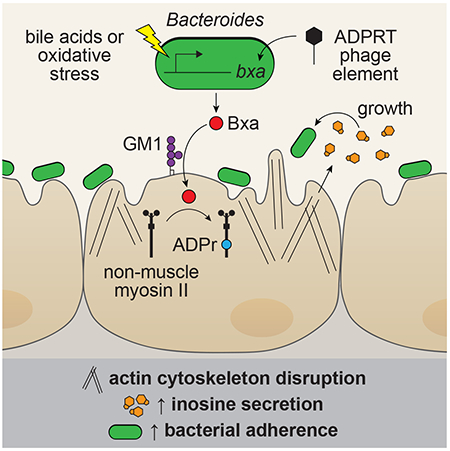
Brown et al. report prevalent ADP-ribosyltransferases in gut microbiome commensals that are associated with bacteriophage elements and secreted as active enzymes. An abundant ADP-ribosyltransferase in Bacteroides, Bxa, is a fitness factor aiding in colonization. Bxa targets non-muscle myosin II in epithelial cells, remodels the actin cytoskeleton and induces inosine secretion.
Graphical Abstract
INTRODUCTION
ADP-ribosyltransferases (ADPRTs) are a class of enzymes present in both eukaryotes and prokaryotes that convert nicotinamide adenine dinucleotide (NAD) into nicotinamide and ADP-ribose (ADPr), which is transferred onto proteins, nucleic acids or small molecules (Simon et al., 2014). Mammalian ADPRTs are predominantly poly-ADP-ribosylating proteins (PARPs) and modulate numerous cellular processes including DNA repair, mitochondrial function and innate immunity (Fehr et al., 2020; Kim et al., 2020; Kraus, 2020). Bacterial ADPRTs are mono-ADPRTs and have primarily been studied in pathogens as toxins, where the ADPr moiety adversely affects the function of the target host protein (Aravind et al., 2015; Cohen and Chang, 2018; Kumar et al., 2019). Four subclasses of bacterial ADPRTs that interact with mammalian cells have been described based on sequence homology and conserved catalytic residues: 1) cholera toxin-like, 2) ExoS toxin-like, 3) C2-like and 4) C3-like, which modify G-proteins, elongation factors, actin and Rho proteins, respectively (Simon et al., 2014).
Many ADPRTs are accessory genes horizontally transferred to confer a fitness advantage for pathogens. One example is cholera toxin (CT), encoded by the CTX phage, in Vibrio cholerae, where only toxin-encoding strains are pathogenic to humans (Sanchez and Holmgren, 2008). CT treatment of epithelial cells results in ADP-ribosylation of G-proteins, leading to a metabolic advantage in the gut to utilize long-chain fatty acids and heme (Rivera-Chavez and Mekalanos, 2019) as well as increased transmission through induction of watery stool and diarrhea (Nelson et al., 2009). A second example is found in the gut pathogen Clostridium difficile, which encodes an ADPRT that modifies actin to induce microtubule alterations and promote mucosal adherence and colonization (Aktories et al., 2017; Schwan et al., 2009).
Numerous studies have attempted to discover novel bacterial ADPRTs, and crystal structures of many toxin ADPRTs are available (Cohen and Chang, 2018; Fieldhouse and Merrill, 2008). Many ADPRTs, however, share less than 10% protein sequence similarity (Kumar et al., 2019), making identification of new family members challenging. Further, bioinformatic searches assume that novel ADPRTs are exclusively present in pathogens (Tremblay et al., 2020). There is also a bias toward pathogenic bacteria in the number of genomes publicly available, although this has been rapidly changing with large microbiome sequencing efforts of commensal genomes (Almeida et al., 2021; Lloyd-Price et al., 2019; Poyet et al., 2019). To date, whether commensals contain representatives of this enzyme class remains unknown.
Here we show that ADPRTs are present, secreted and enzymatically active in commensal isolates spanning the majority of prokaryotic taxa known to colonize the gut, including Archaea. These genes encode a unique protein class we named commensal-associated ribosyltransferase (crt) and are mostly found in bacteriophage elements. To better understand the functions of commensal ADPRTs, we characterized Bxa, one of the most abundant and prevalent ADPRTs in Bacteroides. Bxa is induced by oxidative stress and bile acids, binds to ganglioside lipids on the epithelial cell surface, and targets non-muscle myosin II proteins. Addition of Bxa to epithelial cells alters the actin cytoskeleton and induces secretion of inosine, which Bacteroides can use as a sole carbon source. Bxa also increases mucosal adherence of Bacteroides to epithelial cells in vitro and in vivo. Together, our data suggest ADPRTs are prevalent in commensal bacteria and encode numerous functions that include conferring fitness advantages in the gut environment.
RESULTS
ADP-ribosyltransferases are highly prevalent and abundant in the human gut microbiome
To search for putative ADPRTs in the human gut microbiome we utilized conserved features of known bacterial ADPRTs. The majority of bacterial ADPRTs contain a canonical R-S-ExE motif, where arginine stabilizes NAD in the catalytic pocket and glutamates catalyze the transfer of ADPr to a target protein (Simon et al., 2014). Upstream in many toxins is an STS motif, which is predicted to stabilize NAD in the binding pocket and promote catalytic activity (Simon et al., 2014).
We performed a domain-enhanced lookup time accelerated BLAST (DELTA-BLAST), combined with a position-specific iterated BLAST (PSI-BLAST), searches of ADPRT-related pFAM families and manual curation to report the presence and prevalence of ADPRTs in publicly available bacterial and archaeal strains (File S1). In NCBI genomes from human microbiome strains, we found ADPRT sequences in the majority of phyla known to colonize the gut at abundances ranging from 14% to 35% (Fig. 1A). Aside from the R-S-ExE motif, commensal ADPRTs showed a high degree of variation and sequence divergence. We categorized them into three classes based on protein domain structure, primarily the location of the catalytic domain (Fig. 1A). Of all observed commensal ADPRTs, 28% were composed primarily of the catalytic domain (identified using PFAM classification), 58% had both a putative binding and catalytic domain (identified by other domains next to the ADPRT domain, such as the PFAM 4233 phage MuF domain) and 14% had an N-terminal catalytic domain with no known binding domain identified by PFAM algorithms nested within the sequence.
Figure 1: ADP-ribosyltransferases are highly prevalent and abundant in commensals from the human gut microbiome.
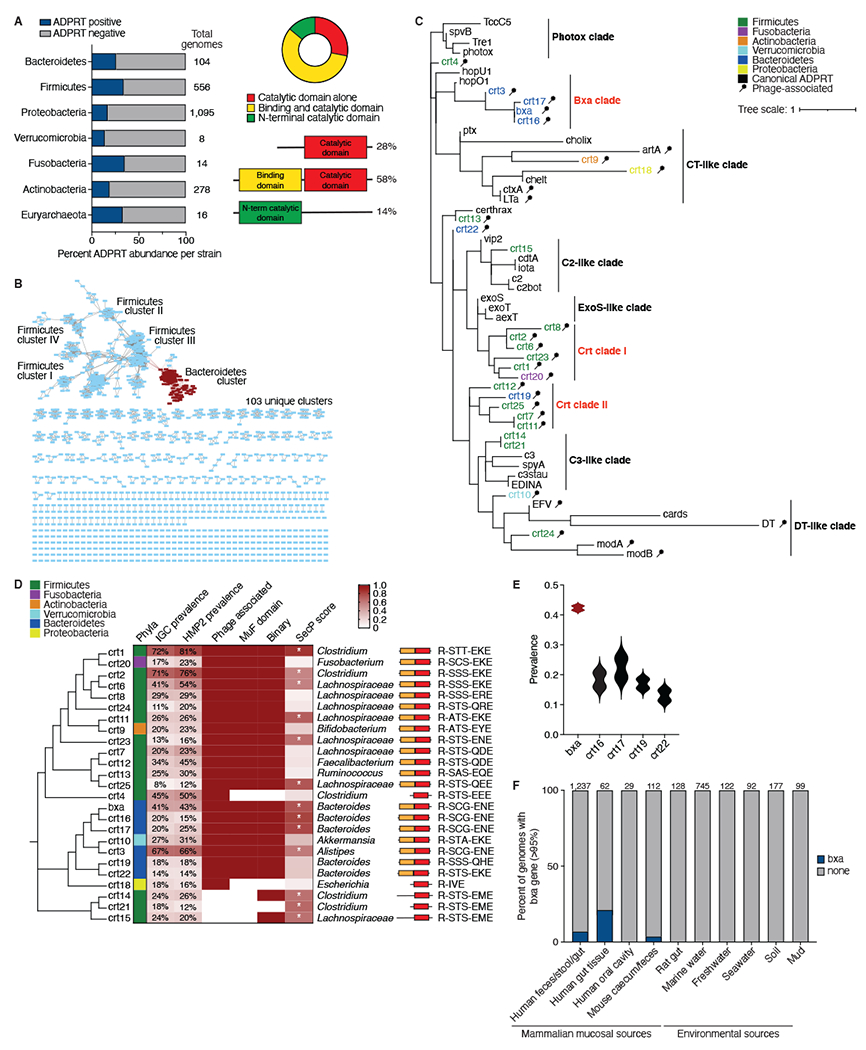
A) Left, Percentage of strains from the 7 most abundant gut phyla with a predicted ADPRT gene (blue) in the NCBI genome database. Total number of genomes per phyla is shown. Right, Protein domain structure of each predicted ADPRT, which exists in 3 permutations: catalytic domain alone, predicted N-terminal binding and catalytic domain together (binary) or N-terminal catalytic domain with an unknown C-terminus. B) Sequence similarity network (SSN) based on the presence of a predicted C-terminal ADPRT domain in 2,500 sequences from the IGC consortium microbiome database. Amino acid sequence similarity cut-off is 60%. The main cluster of Bacteroidetes ADPRTs is shown in red and contains Bxa. C) The top 25 most abundant crts ranked from most (1) to least (25) abundant and clustered based on phylogeny. Crt5 is labelled “bxa.” From left to right, the metrics described are: phyla; percentage of subjects that harbor the crt in the IGC and HMP2 databases; phage association (red is yes); presence of a predicted MuF domain (red is yes); whether the crt is binary (red) or contains the catalytic domain only; and whether the crt is predicted to be secreted by the Sec secretion system (gradient represents SignalP analysis values from 0-1; * denotes yes and a value>0.5). Genus or family taxonomic classification of each crt is shown followed by the predicted domain structure and residues nested within the canonical R-STS-ExE motif. D) Phylogenetic analysis of the 25 crts and 33 toxin ADPRTs from a catalytic region alignment, with the name of the ADPRT at the dendrogram leaves. Nine clusters are labelled based on known toxin ADPRT clusters and our identified commensal ADPRT clusters. crts are colored by taxonomic classification. Phage-associated crts are labelled with a phage symbol. E) Prevalence (scale 0-1) across human subjects of the most abundant Bacteroides crts listed in (C), with bxa in red. F) Percentage of Bacteroidetes genomes that encode the bxa gene (blue). Genomes are grouped based on the environmental source of their isolation, with the number of genomes analyzed indicated. See also Fig. S1 and File S1.
We next probed the catalogue of predicted and known microbial genes available in the IGC Microbiome Database, which includes microbiomes from humans in China, Europe and North America, for the presence of ADPRTs to construct a sequence similarity network based on the catalytic domain (Fig. 1B). We identified 103 unique clusters of ADPRTs with less than 60% similarity and a total of 1,983 distinct sequences (File S1). The cluster of Bacteroidetes ADPRTs was one of the largest, and to date no ADPRTs in Bacteroidetes have been reported. Matrix sequence alignment of the catalytic domains (Fig. S1A) yielded separate clusters, suggesting the possibility of different subclasses, and likely protein targets and functions, of commensal ADPRTs.
To estimate the relative abundances of toxin and commensal ADPRTs in mucosal sites, we searched the Human Microbiome Project dataset (Turnbaugh et al., 2007) for the presence of these enzymes in saliva, throat, nose, tonsil, vaginal and stool microbiome samples (Fig. S1B). We found a much higher prevalence of commensal ADPRTs in the stool relative to toxin ADPRTs (commensal ADPRT 8-62% vs <2% for any toxin ADPRT; File S1). Thus the predominant ADPRTs found at these sites are from commensals rather than pathogens harbored by healthy humans.
We sought to further characterize commensal ADPRTs by selecting the 25 most abundant found in human stool in the IGC Microbiome Database. We named these crt1-25 and clustered them based on sequence similarity of the catalytic domain (Fig. 1C). The crt genes were distributed between six phyla: Firmicutes, Bacteroidetes Verrucomicrobia, Fusobacteria, Actinobacteria and Proteobacteria. We computed the relative abundances of crts in healthy control samples from the Integrative Human Microbiome Project (HMP2) and found them to be similar to the prevalences from the IGC database (Fig. 1C). Of the 25 most abundant crt genes, 22 were associated with a bacteriophage element as identified by the PHASTER algorithm (Arndt et al., 2016), 20 had an N-terminal phage MuF domain (PF 4233) and 13 were predicted by bacteria-specific algorithms (Bendtsen et al., 2005) to be secreted (Fig. 1C). Most crt genes contained the R-S-ExE catalytic domain motif; however, several had a glutamine in place of the first catalytic glutamate, and the Proteobacteria crt18 lacked the serine upstream of the catalytic glutamate (Fig. 1C).
We next analyzed how these crts compared to 33 well-characterized R-S-ExE protein-targeting, pathogen-associated ADPRTs. Clustering of the catalytic domains by sequence similarity using MUSCLE resulted in nine different clades, including the four known toxin subclasses and two toxin clades we named photox and DT-like (Fig. 1D). While the majority of crts clustered together, some sequences clustered into clades with previously characterized ADPRTs. The three crts not associated with a phage (crt14, crt15 and crt21) grouped with C2- and C3-like toxins, and the Actinobacteria crt9 and Proteobacteria crt18 clustered in the CT-like clade. Notably, Bacteroidetes crts clustered together separately from clusters primarily of Firmicutes crts, hinting at taxa-specific functional differences.
Further analysis of the catalytic residues suggested that many commensal ADPRTs contain an SCG motif instead of the STS motif conserved in a majority of toxin ADPRTs (Fig. S1C). Clustering the catalytic domains of a larger set of crts that included more rare genes revealed that, as expected and previously described (Fieldhouse and Merrill, 2008), the toxin ADPRTs grouped into four known subclasses (Fig. S1D). However, more than 50% of the commensal ADPRTs clustered into two distinct groups (Fig. S1D). Thus, our sequence analysis suggests that commensal ADPRTs comprise a wide range of architectures, including some family members with no similarity to canonical toxin ADPRTs, and are found across bacterial clades comprising the majority of the human gut microbiome.
To determine whether the commensal ADPRTs identified were active and secreted, we leveraged the ability of ADPRTs to hydrolyze NAD and implemented a fluorometric NAD-glycohydrolase enzymatic assay using an etheno-labelled NAD (e-NAD). Screening supernatants of over 300 stool isolates from healthy individuals, we detected NAD-glycohydrolase activity in approximately 18% of strains (Fig. S1E; File S1) across Bacteroidetes, Firmicutes, Proteobacteria, Fusobacteria and Actinobacteria, indicating that ADPRTs can be secreted by numerous, taxonomically distinct bacteria. We cannot discount that the assay includes other secreted enzymes responsible for the observed NAD hydrolysis (Skjerning et al., 2019); however, NAD-glycohydrolase activity has been well established to assess ADPRT activity (Chen and Barbieri, 2018). The percentage of strains displaying NAD-glycohydrolase activity is consistent with our bioinformatic observations of crt gene abundance and suggests that ADPRTs are widely prevalent within commensals as both secreted and active enzymes.
To better characterize commensal ADPRTs, we selected one enzyme for an in-depth analysis of its biochemical properties, target and function. We chose crt5 from the most abundant crt genes predicted to be secreted by Bacteroides, given that no ADPRT had previously been described in Bacteroidetes as well as the widely prevalent, abundant and symbiotic nature of Bacteroides strains. Moreover, the B. stercoris strain harboring crt5 had one of the highest NAD-glycohydrolase activities in our assay (Fig. S1E). We named crt5 “Bacteroides toxin-like ADP-ribosyltransferase” or Bxa. The bxa gene was present in approximately 40% of human stool samples in the IGC and HMP2 databases (Fig. 1E). Notably, bxa was only observed in Bacteroidetes isolates from the mammalian gut, suggesting a host-dependent function for this gene (Fig. 1F). We also observed a larger fraction of tissue-associated Bacteroidetes isolates (~17%) encoding the bxa gene than stool isolates (~8%; Fig. 1F). These analyses were performed on over 9,000 Bacteroidetes genomes from the PATRIC database, where we identified 120 bxa sequences (>95% similarity; File S1).
Bacteroides ADPRTs are found in a bacteriophage element that mediates horizontal transfer in the gut
Similar to other identified crt genes, bxa exists in a bacteriophage element. The phage DNA sequence is no more than 70% similar to any known phage genome in NCBI databases, approximately 50kB in length with 73 putative open reading frames and predicted to be active by PHASTER, carrying genes typical of active phages (Fig. 2A; File S1). Upon analysis of the phage DNA sequence within NCBI Bacteroidetes genomes, we found that all 26 genomes with a bxa-like ADPRT gene also had the full-length phage element to 97% similarity (Fig. 2B). The phage includes a number of typical structural and replication genes, and notable genes surrounding bxa include a luxR-like transcriptional regulator, metallo-beta-lactamase and CMP deaminase (Fig. 2A; File S1). Of particular interest is the conserved co-occurrence of a Gp6-like phage portal protein directly next to bxa in all Bacteroidetes strains that integrated the phage as well as a putative ADP-ribosylglycohydrolase (ARH) gene next to bxa on the antisense strand absent only in one Parabacteroides strain (Fig. 2B). We also observed that Bxa phage consistently integrated downstream of the SecD operon (Fig. 2C), suggesting a potential mechanism for bacterial secretion of Bxa.
Figure 2: Bacteroides ADPRTs are found in a bacteriophage element that mediates horizontal transfer in the gut.
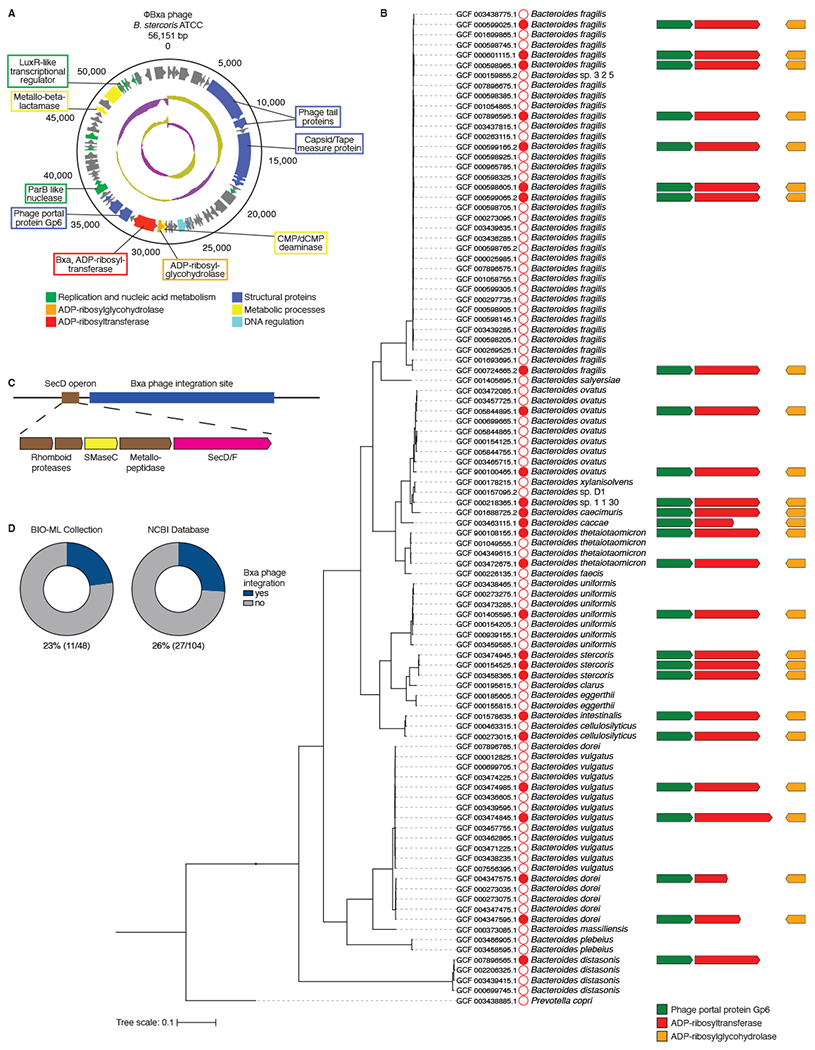
A) Map of the predicted Bxa phage genome sequenced in B. stercoris ATCC 43183. Base pair numbers are shown around the outside. Genes are shown as arrows pointing in the direction of translation and colored by predicted function, with genes of interest labelled. Interior circles indicate GC content (green, high; purple, low). B) Phylogenetic tree of 98 NCBI Bacteroidetes genomes, with sequence accession number listed to the left and species to the right of the red circles. Closed circles indicate the Bxa phage element is present. Arrangements and lengths of the gp6, bxa and arh genes are shown, if present. C) Phage integration site relative to a putative secD operon in bxa-encoding genomes, conserved across multiple Bacteroidetes strains. D) Percentage of Bacteroidetes strains in the BIO-ML and NCBI genome collections with a predicted Bxa phage (blue). See also File S1.
The existence of this phage across multiple genera suggests active horizontal gene transfer. An analysis of NCBI and BIO-ML microbiome strains (Poyet et al., 2019) revealed that each Bacteroides ADPRT gene was in a phage element in 23-26% of all strains available (Fig. 2D). Identical phage DNA sequences were found in different strains from separate donors and in some cases from diverse genera including Parabacteroides (File S1). When representative ADPRTs were clustered and aligned with the taxonomic classification of the strains in which they were found, the protein and taxonomic phylogenies did not align, suggesting that these ADPRTs are not stable, vertically transmitted genetic elements (Fig. S1F). Moreover, protein sequence alignment of crt1-25 highlighted that Bacteroides Bxa are unique in the acquisition of an SCG motif in place of the STS motif (Fig. S1G). These data suggest that commensal ADPRTs exist within phage elements and are likely horizontally transferred among gut bacteria.
Bacteroides ADPRTs are expressed, secreted and enzymatically active
Bxa is an 869-amino acid protein containing an N-terminal phage MuF binding domain and a C-terminal ADPRT domain (Fig. 3A). Many of the Bacteroides ADPRTs have a phage MuF domain, which has a conserved CRC motif and is predicted to contain highly reactive catalytic cysteines with yet unknown functions. In silico structural prediction models suggest Bxa is a multi-domain protein, with a long alpha-helical, finger-like N-terminal domain and a beta-sheet rich C-terminal catalytic domain (Fig. 3A). The bxa gene is absent in strains commonly used for microbiome studies including B. fragilis, B. thetaiotaomicron, B. vulgatus and B. ovatus ATCC strains (Fig. S2A). However, bxa is present in B. stercoris ATCC 43183, which we utilized henceforth as our model strain for studying Bxa function.
Figure 3: Bacteroides ADPRTs are expressed, secreted and enzymatically active.
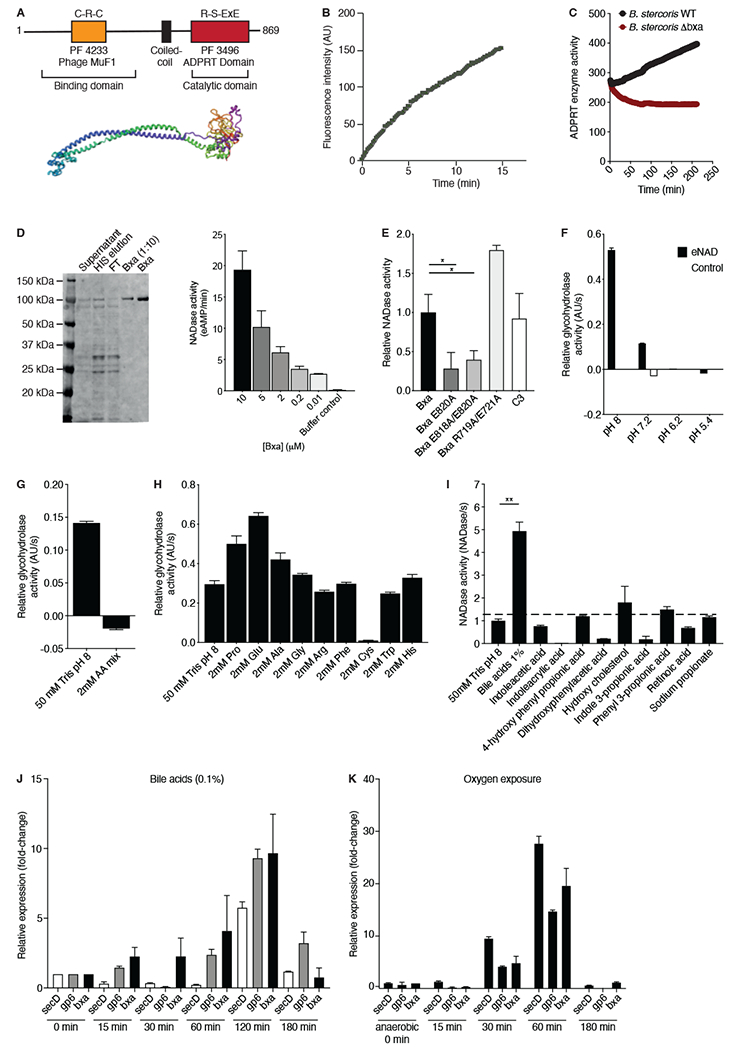
A) Schematic representation and structural prediction of Bxa from B. stercoris showing alignment of the N-terminal binding and ADPRT catalytic domains. B) Relative fluorescence emitted from etheno-NAD over time due to the NAD-glycohydrolase activity of Bxa in B. stercoris supernatant and C) relative comparison of this activity to a Δbxa strain. D) Purified Bxa protein band (~105 kDa) and its NAD-glycohydrolase activity relative to a buffer control. E) Relative NAD-glycohydrolase activities of purified WT Bxa , Bxa E820A, Bxa E818A/E820A, Bxa R719A/E721A and C3 toxin. Relative enzymatic activity of Bxa compared to buffer control measured by NAD-glycohydrolase activity on e-NAD F) at 4 pH conditions, G) with amino acid (AA) mix added to the buffer and H) with individual amino acids added to the buffer. I) NAD-glycohydrolase activity of B. stercoris supernatants treated with common gut metabolites compared to buffer control. Relative expression normalized to pre-treated sample of secD, gp6 and bxa before (0min) and after exposure to J) bile acids or K) oxygen. Representative of 3 independent experiments, n=3. Error bars represent mean, +/− SEM. Statistical analyses were performed using a Mann-Whitney U-test; *p<0.05; **p<0.01; ***p<0.001. See also Fig. S2.
NAD-glycohydrolase activity in B. stercoris supernatants confirmed Bxa is secreted as an active protein (Fig. 3B). Activity was detectable after 2min of B. stercoris being resuspended in a Tris pH 8.0 minimal buffer and increased steadily over time (Fig. S2B), indicating that Bxa is rapidly secreted into the surrounding environment. To determine whether the NAD-glycohydrolase activity observed originated from Bxa, we created a single-crossover mutant strain of B. stercoris lacking bxa (Methods). Upon resuspension of wild-type (WT) and Δbxa B. stercoris, only the WT strain displayed NAD-glycohydrolase activity (Fig. 3C), suggesting bxa encodes the only secreted ADPRT in B. stercoris.
We next purified Bxa from B. stercoris, obtaining a 105kDa protein (Fig. 3D) with a sequence identical to several putative Bacteroides ADPRTs. The purified protein was enzymatically active in a dose-dependent manner and at concentrations as low as 10nM (Fig. 3D). We then introduced mutations in R-S-ExE motif residues through site-directed mutagenesis, substituting alanines for the predicted catalytic glutamates at positions 818 and 820 as well as the arginine at position 719 and the glutamate at 721 (Simon et al., 2014). We confirmed the R719A/E721A double mutant retained NAD-glycohydrolase activity, while the E820A double and single mutants had reduced activity compared to WT Bxa and purified C3 toxin (Fig. 3E). We inferred that the catalytic glutamate decreases NAD-glycohydrolase activity, an observation consistent with other bacterial ADPRTs (Simon et al., 2014). Activity was inhibited by amino benzamide, a small molecule PARP-inhibitor (Fig. S2C), and highest at pH 8 compared to pH 7.2 or lower (Fig. 3F).
Notably, an amino acid mixture inhibited Bxa secretion or activity (Fig. 3G), and this effect was dependent on the presence of cysteine (Fig. 3H). Bxa contains 12 cysteines, suggesting its activity may be regulated by either redox or reactive cysteines. The domain function predictor hhpred (Soding et al., 2005) revealed the Bxa phage MuF domain has a putative autolysis function. We hypothesized that the cysteines are catalytic and may react to cleave the protein in reducing conditions. The B. stercoris secretome revealed a band similar in size to our purified protein (Fig. S2D). Adding reducing agents including glutathione, cysteine and dithiothreitol (DTT) to B. stercoris supernatant or purified Bxa resulted in a reduction of the 105kDa full-length band and the appearance of a band around 55kDa (Fig. S2D). We also observed a decrease in NAD-glycohydrolase activity upon addition of cysteine that correlated with partial cleavage of purified Bxa (Fig. S2E, F). DTT and glutathione also reduced purified Bxa NAD-glycohydrolase activity, but tris(2-carboxyethyl)phosphine (TCEP) and common protein-stabilizing cations including zinc, iron, magnesium or calcium did not (Fig. S2F). These data suggest that Bacteroides Bxa may be redox-sensitive and regulate its activity through autolysis, similar to CT (Wernick et al., 2010).
We then sought to understand signals that may prompt B. stercoris to secrete Bxa. Screening small molecules of high abundance and concentration in the gut, we found that conjugated bile acids increased Bxa secretion 4-fold compared to buffer control (Fig. 3I). Transcription of bxa increased after 15min, peaked after 120min and returned to basal levels after 180min of bile acid exposure (Fig. 3J). We also observed increased expression of the neighboring gp6 and secD genes, suggesting co-regulation (Fig. 3J). To determine whether this response was to a bile acid-specific signal or general stress, we exposed B. stercoris to oxygen for the same time periods and monitored bxa, gp6 and secD expression (Fig. 3K). Oxygen exposure for 30min resulted in robust bxa expression that followed a similar flux as the response to bile acids. Again, gp6 and secD were upregulated with bxa, indicating that Gp6 may interact with Bxa and that secretion may be facilitated by the SecD system.
To understand which other genes in the phage region were co-expressed, we performed RNA-sequencing on B. stercoris cultures exposed to bile acids for 1h or oxygen for 2h. Expression of genes in the phage region was not uniformly regulated, indicating the increase in bxa expression was not due to the whole phage element leaving the cell (Fig. S2G). Several genes were consistent in their co-expression with bxa including a YadA-like domain protein (BACSTE_02197), which was also upregulated and shares homology with collagen binding proteins important for bacterial adhesion to epithelial cells (Fig. S2G, H; File S1). These data suggest Bxa secretion is triggered by an oxidative stress-related mechanism, and bxa is co-expressed with genes relevant to bacterial adhesion and secretion.
Bxa targets non-muscle myosin II proteins and remodels the actin cytoskeleton in epithelial cells
Given active Bxa is expressed and secreted by gut commensals, we sought to determine its effect on host cells. Previous studies report that secreted bacterial ADPRTs can bind to epithelial cells (Simon et al., 2014) and alter cell states to gain a foothold in the gut (Aktories et al., 2017). Therefore, we hypothesized that Bxa could modify an epithelial cell protein and implemented three separate methods to identify the Bxa target (Fig. 4A). First, we added unlabeled NAD to a buffered solution of human epithelial HT-29 cell lysate with and without WT or mutant Bxa and immunoprecipitated ribosylated proteins with an anti-ADP-ribose antibody. Second, we utilized an antibody that recognizes ADP-ribose transferred to a protein using a labelled, clickable-NAD as a substrate. Lastly, we utilized an antibody specific to etheno-adenosine transferred to the protein using etheno-NAD in the reaction (Fig. S3A). These approaches yielded a dominant band at ~230kDa that was only present in lysates with WT Bxa and not the E818A/E820A catalytic mutant (Fig. 4B, C). This band was confirmed to be ADP-ribosylated by western blot using the anti-ADP-ribose antibody, showing a strong band in lysate with WT Bxa and a very faint band in lysate with the mutant (Fig. 4D). Mass spectrometry mapped the 230kDa band to the three mammalian non-muscle myosin II (NMMII) proteins (myosin-9, myosin-10 and myosin-14). All share 98% similarity at the amino acid level and similar domain structures (Fig. 4E, F; Fig. S3B; File S2). A number of cytoskeleton proteins and regulatory proteins co-eluted with myosin including actin, vinculin, villin, plectin and eukaryotic translation factors (Fig. 4E, F; File S2). We tested NMMII proteins as direct Bxa targets by adding NAD to buffered solutions of purified NMMIIa, NMMIIb or a heavy motor myosin fragment of NMMIIa (HMM) with and without purified Bxa. Using our anti-ADP-ribose antibody, we only detected the 230kDa band when both Bxa and NAD were present with NMMIIa or IIb (Fig. 4G), confirming Bxa can ADP-ribosylate non-muscle myosins.
Figure 4: Bxa targets non-muscle myosin II proteins and remodels the actin cytoskeleton in epithelial cells.
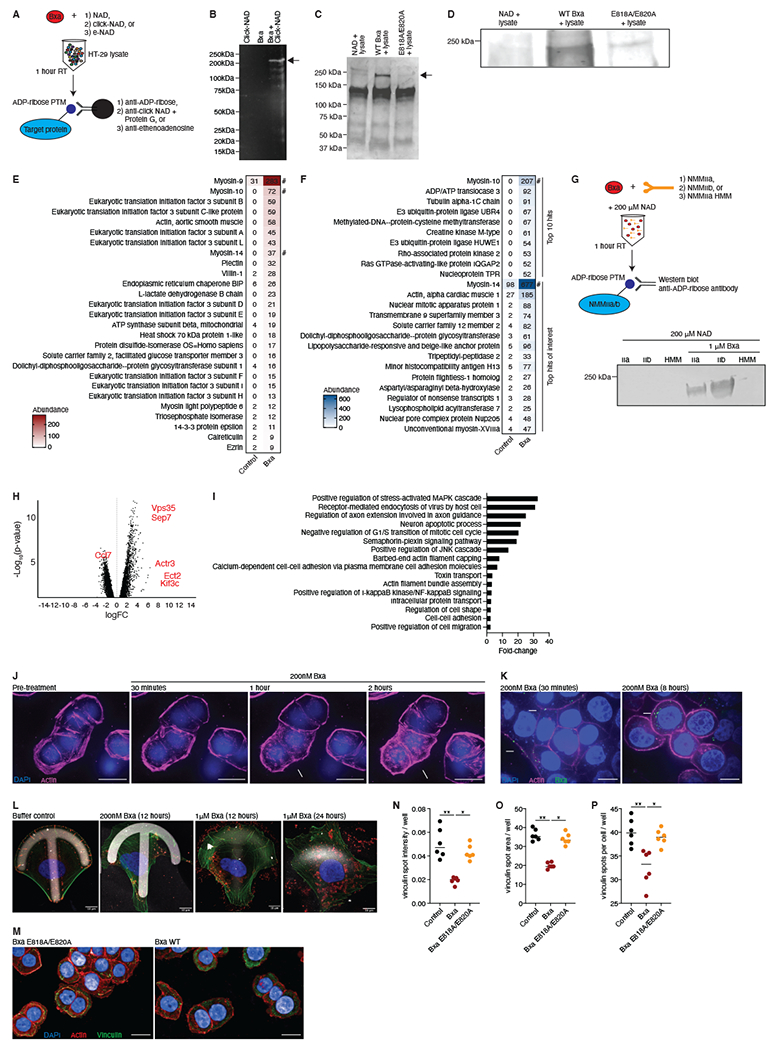
A) Schematic of immunoprecipitation methods utilized to discover the Bxa target protein. B) Proteins immunoprecipitated with a click-NAD antibody from HT-29 cell lysates treated with click-NAD alone (left), Bxa alone (middle) or Bxa plus click-NAD (right). Representative of 2 independent experiments. C) Proteins immunoprecipitated with an anti-ADP-ribose antibody from HT-29 cell lysates treated with NAD alone (left), Bxa plus NAD (middle) and the Bxa E818A/E820A mutant plus NAD (right). Representative of 4 independent experiments. In (B) and (C) protein masses of the ladder are shown, and arrows point to the dominant band seen at ~230kDa. D) Western blot using the gel in (C) and an anti-ADP-ribose antibody. Bands shown were the only major bands detected in the 150-250 kDa region. Representative of 4 independent experiments. Proteins detected using mass spectrometry on the Bxa plus NAD elution (right) compared to the NAD only elution (left) in the immunoprecipitations using E) anti-ADP-ribose and F) anti-click-NAD. Values are the relative abundance by area under the curve of the peptides from the identified proteins. A # indicates the most abundant myosin proteins. Representative of 2 independent experiments. G) Schematic of the method to test direct ADP-ribosylation of NMMII proteins. The resulting western blot is shown, with IIa, IIb and HMM indicating the NMMII isoform used in each well with (right 3 wells) or without (left 3 wells) purified Bxa. H) Genes in murine epithelial monolayers differentially expressed after 4h of Bxa treatment. Genes of interest are in red. The x-axis is the log of the fold-change (FC) and the y-axis is the −log10 of the p-value (Benjamini-Hochberg, FDR-adjusted). Representative of 2 independent experiments, n=3. I) The most significantly upregulated pathways in Bxa-treated monolayers, based on GSEA of each gene that was significantly upregulated (FC>2, FDR <0.01) after Bxa treatment. The x-axis is the fold-change of the pathway over expected values from a control-treated sample. J) Images from time-lapse microscopy of HT-29 cells treated with Bxa. DAPI (blue) shows nuclei and an SiR stain (pink) shows actin. Arrows indicate cells with actin-cytoskeleton disruption; scale bar=20μm. K) HT-29 cells treated with Bxa. Actin (pink), nucleus (blue) and Bxa (green) are shown. 40X magnification, scale bar=50μm. Arrows indicate Bxa bound to the outside of the cell and in the cytosol. L) U2OS cells cultured in a micropattern, crossbow format to test for cell migration and changes in focal adhesions after Bxa treatment. 100X magnification, scale bar=10μm. Actin (green), nucleus (blue) and Bxa or paxillin control (red) are shown. M) HT-29 cells treated with Bxa WT or Bxa E818A/E820A for 18h. Actin (red), nucleus (blue) and vinculin (green) are shown. 40X magnification, scale bar=50μm. Arrows indicate differences in pattern, intensity and shape of vinculin staining. A set of 25 images from 6 biological replicates in 2 independent experiments were quantified for N) vinculin spot intensity per well, O) vinculin spot area per well and P) number of vinculin spots per cell, per well. All microscopy images are representative of at least 2 independent experiments. *p<0.05; **p<0.01. Lines represent mean +/− SEM. See also Fig. S3, File S3 and Videos S1–4.
We next performed RNA-sequencing on murine epithelial cell monolayers treated with 200nM Bxa for 4h and discovered differential expression of approximately 750 genes including downregulation of CCL7 and upregulation of SEP7, VPS35, ECT2 and KIF3C (p<0.01, FC>2; Fig. 4H; File S3). Analyzing the pathways of differentially expressed genes, we discovered enrichment in the semaphorin plexin signaling pathway, toxin transport, MAPK cascade, receptor-mediated endocytosis pathway, toxin transport pathway, regulation of cell shape, actin filament bundle assembly and positive regulation of cell migration (Fig. 4I). A high number of genes were upregulated in the actin cytoskeleton associated and focal adhesion pathway including ARPC3/5, CAV1, ITGAV, EMD and RALA (Fig. S3C). Metabolic pathways, including the TCA cycle, glutathione metabolism and oxidative phosphorylation, were downregulated (Fig. S3D).
To understand how Bxa could be modifying the cytoskeleton, we performed live-cell imaging on HT-29 epithelial cells stained with an SiR-actin probe. We fluorescently tagged purified Bxa and at concentrations between 200nM and 1μM observed Bxa bound to (Fig. 4J; Video S1) and inside cells (Fig. 4K; Fig. S3E). We also observed disorganization and rearrangement of actin fibers 1-4h after addition of 200nM Bxa (Fig. 4J; Fig. S3E; Videos S2–3). Live-cell imaging further revealed loss of focal adhesions in Bxa-treated cells, resulting in cell migration and rounding (Fig. 4K; Video S4). We did not observe cell death or apoptosis in Bxa-treated cells after 24h.
We found 200nM to be the optimal Bxa concentration for treating epithelial cells, observing maximum binding and uptake without cell death and high activity in enzymatic assays. This is also close to the physiological concentration of Bxa that B. stercoris secreted into minimal Tris buffer after induction (Fig. S2B). Thus, we utilized this dose consistently for the rest of the study.
To further investigate cell migration and actin cytoskeleton dynamics upon Bxa addition, we performed a crossbow assay assessing the relative movement and presence of focal adhesions and actin stress fibers (Methods). We utilized U2OS epithelial cells instead of HT-29 cells due to their flat shape and cell anchoring properties, which are essential for the crossbow assay. Bxa treatment resulted in a loss of focal adhesions and marked change in cell migration and cellular protrusions (Fig. 4L). Closer examination showed that Bxa can directly bind in the region of the actin cytoskeleton network and cross-link actin, explaining the disrupted focal adhesions and cellular protrusions observed (Fig. 4L). Cell rounding and actin cytoskeleton changes induced by Bxa were not observed upon treatment with the E818A/E820A mutant, suggesting the phenotypes are dependent on Bxa ADP-ribosyltransferase activity (Fig. S3F). We confirmed focal adhesion loss in HT-29 cells stained for vinculin. WT-treated cells had fewer and smaller vinculin spots with more diffuse staining compared to E818A/E820A-treated cells (Fig. 4M). When these observations were quantified, vinculin spot intensity, area and number of spots per cell were significantly lower in WT Bxa-treated cells compared to control- or E818A/E820A-treated cells (Fig. 4N–P).
We noted cell-to-cell variability in the ability of Bxa to bind, enter and disrupt the cytoskeleton in cells, and not every cell was equally affected. We hypothesized this could be due to Bxa binding lipid rafts, similar to C3-like and cholera ADPRTs. Indeed, Bxa bound GM1 ganglioside but not ceramide (Fig. S3G). The affinity and propensity of Bxa to bind HT-29 cells also increased in a dose-dependent manner in the presence of purified GM1 ganglioside (Fig. S3H). Together, these data indicate that Bxa can bind to lipid rafts to enter epithelial cells and ADP-ribosylate NMMII proteins, which may alter the actin cytoskeleton. The Bxa-induced changes in actin arrangement, focal adhesions and cell shape observed are consistent with known functions for NMMII proteins in epithelial cells (Vicente-Manzanares et al., 2009).
Bxa induces epithelial cells to secrete inosine, which Bacteroides can use as a carbon source
Based on our observations of Bxa-induced changes to the actin cytoskeleton, we wanted to investigate whether Bxa could alter epithelial cell metabolism and whether the resulting metabolic environment of the gut epithelium would benefit Bacteroides strains. We found that B. stercoris reached log phase faster and grew to a higher optical density in the presence of supernatants from Bxa-treated HT-29 cells compared to control-treated cells (Fig. 5A). This suggested that, upon exposure to Bxa, epithelial cells may secrete a metabolite that confers a growth advantage to B. stercoris. To test this, we performed a metabolomic analysis of supernatants from Bxa- and control-treated HT-29 and Caco-2 epithelial cells (File S3). We annotated 560 distinct secreted metabolites and observed increases in the abundances of nucleosides including guanosine and inosine in Bxa-treated cell supernatants (Fig. 5B, C), with no statistically significant changes in cytosine, thymidine, cytidine or adenosine (Fig. S4A–D). While there was a significant change in the amount of guanosine secreted, it did not reach the same level as inosine (Fig. S4E). Inosine was the most upregulated metabolite observed, increasing ~8-fold in Bxa-treated cell supernatants compared to controls (Fig. 5D) and the most significantly changed after PLS-DA analysis (Fig. S4F). We confirmed the presence of inosine in cell supernatants at concentrations of 2-4 nmol/mL using an inosine detection kit (Fig. 5E).
Figure 5: Bxa induces epithelial cells to secrete inosine, which Bacteroides can use as a sole carbon source.
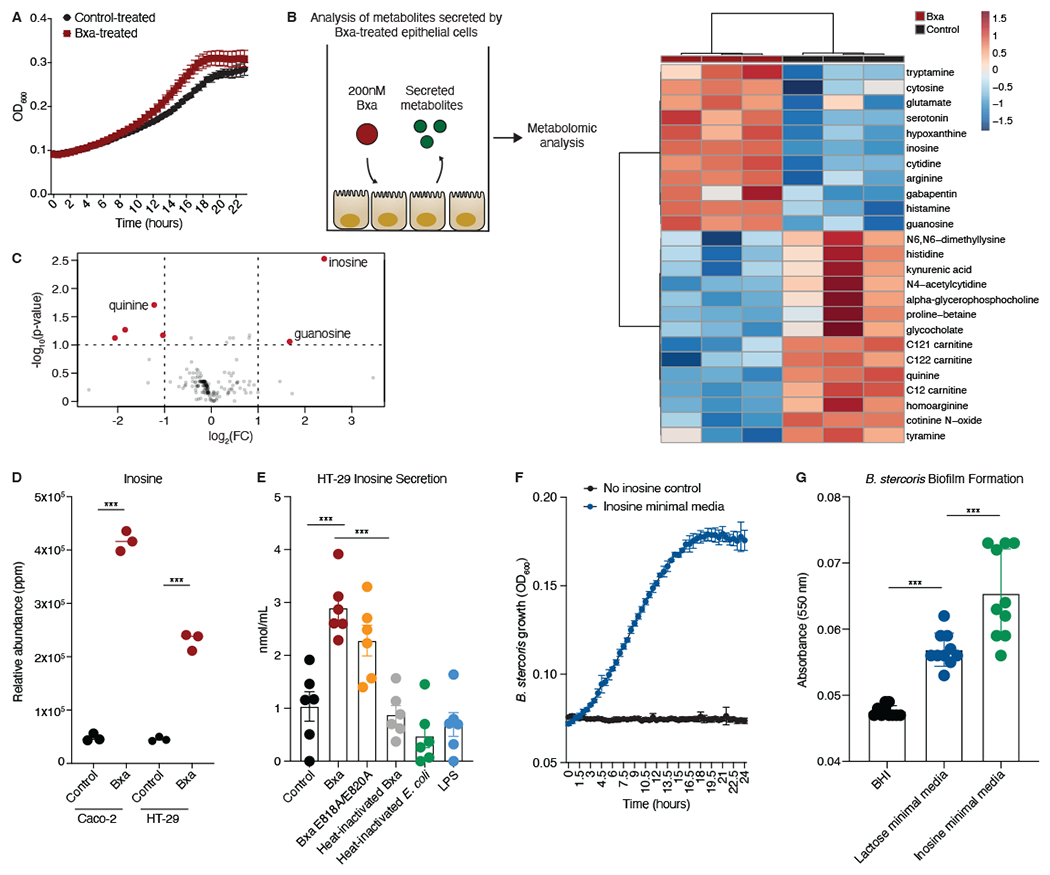
A) Growth curve of B. stercoris cultured with Bxa- or control-treated HT-29 cell media (n=3 biological replicates with 2 technical replicates). B) Schematic of the assay performed to analyze metabolites secreted by Bxa-treated HT-29 epithelial cells. Clustering of the top 25 differentially abundant metabolites increased (red) or decreased (blue) on a log2 scale after Bxa treatment. C) Observed metabolite peaks that were able to be annotated, with log2 fold-change (FC) on the x-axis and −log10 of the p-value (Benjamini-Hochberg) on the y-axis. Metabolites in red were the most significantly changed (p<0.01, FC>2). D) Relative abundance of inosine in HT-29 and Caco-2 supernatants, with and without Bxa treatment. ***p<0.001; Benjamini-Hochberg, FDR adjusted. E) Inosine concentration in the supernatant of HT-29 cells treated with a buffer control, Bxa, Bxa E818A/E820A, heat-inactivated Bxa, heat-inactivated E. coli or LPS for 4h. ***p<0.001; one-way ANOVA. Representative of 2 independent experiments, n=6. F) Growth curve in minimal media with no carbon source (black) or inosine as the sole carbon source (blue). Representative of 4 independent experiments, n=3-6. G) Absorbance after a biofilm assay was performed to measure the relative number of bacteria capable of adhering to the bottom of the plate after 72h of growth in BHI media, lactose minimal media and inosine minimal media. ***p<0.001; one-way ANOVA. Representative of 2 independent experiments, n=10. Error bars represent mean +/− SEM. See also Fig. S4 and File S3.
We next sought to understand how inosine secretion could be induced. Inosine release was significantly reduced in the presence of heat-inactivated Bxa but remained unchanged when cells were treated with the E818A/E820A mutant (Fig. 5E). Treatment of HT-29 cells with NMMII inhibitors blebbistatin and ML-9 reduced baseline inosine concentrations compared to buffer control; however, Bxa treatment was still capable of inducing inosine release (Fig. S4G). Further, inosine secretion is likely unrelated to a general cellular stress mechanism given that heat-inactivated E. coli and LPS did not increase inosine concentration (Fig. 5E). We tested whether the inosine could be derived from extracellular ATP breakdown, but there was no change in extracellular ATP or ADA (which converts adenosine to inosine) enzyme activity upon Bxa treatment of HT-29 cells, even in the presence of ML-9 (Fig. S4H, I). Bacteroides strains have a unique ability to utilize nucleosides as a carbon source in the gut (Glowacki et al., 2020), although utilization of inosine specifically was not reported. Indeed, we confirmed that B. stercoris can utilize inosine as a sole carbon source in minimal media (Fig. 5F). We also noticed changes in adherence to the tube of Bacteroides grown in minimal media containing inosine compared to those grown in minimal media with lactose as a sole carbon source or in rich media (BHI). We quantified this as biofilm formation, which was significantly increased in B. stercoris grown with inosine (Fig. 5G). Given the insoluble nature of guanosine, we could not assess B. stercoris grown in media with this metabolite. These data indicate Bacteroides secrete Bxa to induce metabolic change in host cells, namely inosine secretion, that promotes Bacteroides growth and biofilm formation.
Presence of bxa in Bacteroides enhances bacterial adherence to epithelial cells and colonization of the intestinal epithelium
We next sought to determine whether Bxa could alter the ability of Bacteroides strains to colonize or adhere to epithelial cells, given the increased biofilm formation induced by Bxa-dependent inosine release and the observation that cytoskeleton remodeling can aid in the colonization of bacteria harboring other ADPRTs, such as C. difficile toxin. We optimized an adherence assay in which we pre-treated HT-29 cells for 4h with 200nM Bxa and added 109 cells/mL of Bacteroides thetaiotaomicron or B. stercoris for 4h. After vigorously washing the cells, we measured adherence by CFUs (Fig. 6A). We consistently noticed a 5- to 10-fold increase in the amount of Bacteroides able to adhere to cells after Bxa treatment (Fig. 6B–D). This was partially dependent on Bxa enzymatic activity as heat-inactive Bxa did not promote bacterial adherence and adherence was reduced upon pre-treatment with the E818A/E820A mutant (Fig. 6B, D). The adherence phenotype induced by Bxa was also observed in Caco-2 cells and in Bacteroides without the bxa gene (Fig. S5A, B). We also confirmed increased adherence after Bxa treatment by labelling B. stercoris with SYTO-BC and measuring adherent bacteria by flow cytometry (Fig. S5C).
Figure 6: Presence of bxa in Bacteroides enhances bacterial adherence to epithelial cells and colonization of the intestinal epithelium.
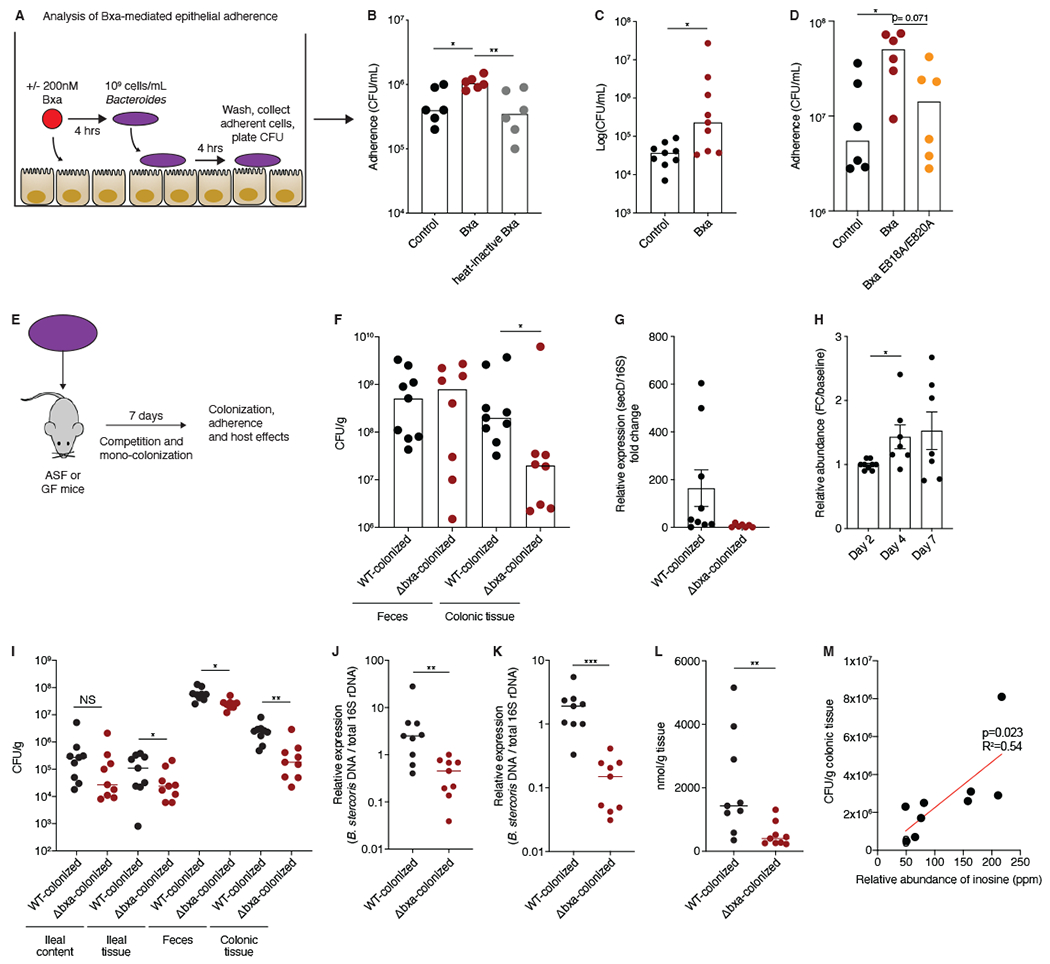
A) Schematic of the method used to test whether Bacteroides adherence to epithelial cells increases with Bxa pretreatment. B) Number of B. thetaiotaomicron colony forming units (CFUs) in control-treated, Bxa-treated or heat-inactivated Bxa-treated HT-29 cells. Number of B. stercoris CFUs in C) control- or Bxa-treated HT-29 cells and D) control-, Bxa- or E818A/E820A-treated HT-29 cells. E) Schematic of protocol used with germ-free (GF) and ASF mice to understand colonization and a potential fitness benefit for bxa-encoding Bacteroides. Differences in mucosal-adherent colonic colonization F) of B. stercoris WT and Δbxa strains 7 days after mono-colonization in GF mice (n=8-9) and G) by qPCR measuring the relative expression of secD in WT and Δbxa B. stercoris 7 days after mono-colonization in GF mice (n=8-9). H) Relative abundance of the WT compared to Δbxa strain during a competition experiment in which each strain was administered to GF mice (n=7) at a 1:1 ratio. A higher number indicates more WT than Δbxa strain in the stool of mice. I) Differences in mucosal-adherent and luminal colonic or ileal colonization of WT and Δbxa B. stercoris 7 days after colonization in ASF mice (n=9). Quantification of WT and Δbxa B. stercoris colonization (7 days after each strain was administered once to ASF mice) using qPCR on J) ileal or K) colonic tissue DNA. Amplification of secD relative to 16S rRNA was quantified and compared. n=9 mice. L) Inosine concentration measured in colonic epithelial cells from the stool of ASF mice (n=9) colonized with WT or Δbxa B. stercoris. M) Correlation between relative inosine abundance measured using LC-MS in the stool of WT-colonized ASF mice and CFU counts from colonic tissue of the same mice (n=9). Statistical analyses were performed using the Mann-Whitney U-test for two comparisons or a one-way ANOVA for multiple comparisons, *p<0.05; **p<0.01; ***p<0.001. HT-29 adherence data is representative of 4 independent experiments. Mouse data is representative of 2 independent experiments. Error bars represent mean +/− SEM. See also Fig. S5.
To test whether Bxa enhances bacterial adherence in vivo, we mono-colonized germ-free mice with WT or Δbxa B. stercoris for one week before assessing bacterial colonization in the gut (Fig. 6E). While there was no significant difference in CFU from the stool, we observed a 10-fold increase in the amount of WT relative to Δbxa bacteria adhered to the colonic epithelium (Fig. 6F). Using qPCR of RNA isolated from proximal colonic tissue, we also observed significantly higher secD expression relative to 16S expression in the WT strain (Fig. 6G), confirming in vivo expression of the sec secretion system in colon-adherent cells. We then tested whether Bxa was a fitness factor that not only resulted in greater adherence but also allowed for bxa-encoding Bacteroides to compete and colonize to a greater efficiency and persistence in the gut than the Δbxa strain. After a single inoculation of germ-free mice with a 1:1 ratio of WT:Δbxa B. stercoris, we found a significant difference in the ratio of WT:Δbxa bacteria present in the stool by day 4 (Fig. 6H). This was also observed by directly comparing the expression of bxa versus tdk in the stool (Fig. S5D).
The germ-free mono-colonization and competition data support that the presence of bxa is a fitness factor for Bacteroides colonization. To further address whether bxa-encoding strains preferentially colonize the gut against bacterial strains from other taxa and whether the metabolic shift induced by Bxa promotes tissue colonization in a community setting, we tested if bxa imparted any colonization fitness benefit in a competitive gut environment. We used Altered Schaedler Flora (ASF) mice, which are colonized with a defined microbial community, to control the experiment and inoculated them once with either WT or Δbxa B. stercoris. After seven days, we plated ileal and colonic content and tissue on antibiotic selective media and observed a significantly higher CFU count of WT relative to Δbxa B. stercoris in ileal tissue, feces and colonic tissue (Fig. 6I). We further confirmed this using qPCR of a B. stercoris-specific gene not part of the phage region (secD) compared to 16S amplification of the community and observed an approximate 10-fold increase in WT relative to Δbxa strain colonization, similar to our CFU results (Fig. 6I–K).
We next assessed whether inosine concentration in the feces or tissues of germ-free or ASF mice inoculated with B. stercoris correlated with tissue colonization. Using targeted metabolomics, we observed an elevated concentration of inosine in the stool of WT- compared to Δbxa-colonized mice. Inosine was one of the most upregulated metabolites observed in the stool of WT-colonized mice (Fig. S5E, F). We also found significantly higher inosine concentrations in colonic epithelial cells from WT-colonized mice using an inosine detection kit, confirming inosine release in vivo is host-derived (Fig. S5G). We similarly measured inosine abundance and concentration in ASF mice colonized with the WT or Δbxa strain. Tissue-associated inosine in the colon was significantly higher in WT-colonized mice (Fig. 6L). We found a significant positive correlation between inosine relative abundance and colonic tissue CFU (Fig. 6M; p=0.023; R2= 0.54), indicating inosine may promote tissue colonization. While inosine concentrations in the feces of WT-colonized ASF mice did not change, we observed increased levels of guanosine, a metabolite that also increased in Bxa-treated HT-29 cells (Fig. 5B,C; Fig. S5H, I). We confirmed Bxa enzymatic activity and persistence of bxa deletion in vivo by measuring NAD-glycohydrolase activity in WT- and Δbxa-colonized mice (Fig. S5J).
We also observed in vivo host consequences of changes in Bacteroides adherence and colonization. Analysis of secreted cytokines from unstimulated cultured immune cells isolated from the mesenteric lymph node showed an increase in IL-10, IL-23 and IL-2 in WT-colonized mice compared to Δbxa-colonized mice (Fig. S5K). Additionally, we detected increased transcript levels of alpha-defensin 2 (DEFA) and the gene encoding IL-22 in RNA extracted from colonic tissue of WT-colonized mice (Fig. S5L).
Together, our data suggests that the secreted Bacteroides ADPRT Bxa can remodel epithelial cells and stimulate the release of host-derived factors that support growth and colonization of bxa-encoding strains in the gut, suggesting Bxa is a commensal fitness factor.
DISCUSSION
Here, we study Bxa as an example to show that commensals from the most abundant phyla known to colonize the gut (Bacteroidetes, Firmicutes, Actinobacteria, Fusobacteria, Verrucomicrobia, Proteobacteria and Euryarchaeota) harbor hundreds of diverse, bacteriophage-associated ADPRTs with characteristics distinct from canonical toxin ADPRTs. The Bacteroides ADPRT Bxa is encoded by a functional phage and targets NMMII proteins to modify epithelial cell biology. Further, presence of bxa enhances colonization of the colonic epithelium and confers a competitive advantage in vivo. Our data suggest that phages transfer fitness factors in the form of ADPRTs, which are utilized by bacteria to promote survival of the strain and the lysogenic phage itself.
Together, the mode by which Bxa binds epithelial cells through GM1 gangliosides, the NMMII target protein and the fitness benefit conferred by bxa represent a unique mechanism for a bacterial ADPRT. These features, however, are consistent with host-targeting toxin ADPRTs found to be fitness factors in the gut, including CT, pertussis toxin and C. difficile toxin (Brussow et al., 2004): Each is phage-encoded, binds lipid rafts to mediate entry, and modulates the cytoskeleton to aid bacterial colonization. With our identification of a vast array of commensal ADPRTs, this indicates that the toxigenicity of pathogen ADPRTs may be the exception rather than the rule in the gut.
Epithelial cell metabolite release stimulated by Bxa to aid growth may be a more general mechanism utilized by other bacterially-secreted proteins. Recent studies identified two additional toxin accessory proteins secreted by bacteria in the gut that stimulate release of a metabolite and confer a fitness benefit: a C. difficile toxin inducing sorbitol (Fletcher et al., 2021) and CT inducing heme and long-chain fatty acids (Rivera-Chavez and Mekalanos, 2019). Inosine secretion alone, however, may not explain out-competition of the Δbxa strain by the bxa-encoding strain in our experiment, and the data are not supportive of a sole role of Bxa-induced inosine utilization as the driver of fitness and colonization. Given the limited understanding of inosine import into Bacteroides, we cannot rule out that inosine induced by Bxa is utilized by the strain lacking bxa, thus potentially reducing the size of the observed effect. Bxa likely imparts multiple functions to Bacteroides that improve fitness, similar to other known phage-encoded ADPRTs like CT (Rivera-Chavez and Mekalanos, 2019).
Given not every strain of Bacteroides harbors bxa, colonization and fitness of a particular commensal is partly mediated by phage activity and function. The host-directed activity of Bxa has implications for numerous strain-specific functions documented for microbiome species, including colonization ability, metabolic adaptation, immune function, probiotic colonization and engraftment during fecal transfers. Phage activity has been shown to increase during inflammation (Gogokhia et al., 2019), and phage have been shown to aid colonization and fitness of E. faecalis in the gut (Duerkop et al., 2012). Although not noted in the study, this strain also harbors an ADPRT (EFV toxin). EFV has a phage MuF domain, which is associated with various C-terminal enzymatic activities, hinting at a modular mechanism for this domain to aid in delivery and function of phage-encoded enzymes (Jamet et al., 2017).
Bxa function within phage biology or in bacteria-bacteria interactions is unknown. We observe no change in bacterial growth or cell death upon treatment with purified Bxa or B. stercoris supernatant. Notably, an ARH gene neighbors bxa in the phage element. ADPRTs in Serratia are secreted by a T6SS to target and kill other bacteria by ADP-ribosylating the FtsZ protein, which is counteracted by an ARH protein (Ting et al., 2018). The presence of bxa is independent of whether the strain has T6SS and Sec secretion signal sequences, leading us to conclude that MuF-linked, Bacteroides ADPRTs are unlikely to play a role in direct bacteria-bacteria killing.
Collectively, we describe how gut microbiome strains co-evolve with bacteriophage to colonize the intestinal epithelium and interact directly with the host. This has numerous implications for colonization potential of bacterial strains, contribution to human health and disease and impact on host coevolution and immunity. Gaining a better understanding of ADPRTs and how these enzymes function in other bacteria will be of critical importance for future host—microbiome interaction studies.
STAR METHODS
RESOURCE AVAILABILITY
Lead Contact
Further information and requests for reagents may be directed to and will be fulfilled by Lead Contact, Ramnik J. Xavier (xavier@molbio.mgh.harvard.edu).
Materials Availability
All plasmids in this study are available from the Lead Contact upon request.
Data and Code Availability
All metabolomics data generated in this study are available at the NIH Common Fund’s Metabolomics Data Repository and Coordinating Center (supported by NIH grant, U01-DK097430); metabolomics workbench (http://www.metabolomicsworkbench.org) accession number PR001176). RNA-sequencing data can be found in SRA: PRJNA742399.
This paper does not report original code.
Any additional information required to reanalyze the data reported in this paper is available from the Lead Contact upon request.
EXPERIMENTAL MODEL AND SUBJECT DETAILS
Germ-free mouse experiments
Six- to eight-week old, male or female C57BL/6N germ-free mice were purchased from Taconic USA and maintained at the gnotobiotic facility at the Broad Institute of MIT and Harvard. A subset of these gnotobiotic mice were also stably colonized over multiple generations with Altered Schaedler Flora (ASF), which was used as a defined minimal community of gut microbes in a manner well-established in the literature (Dewhirst et al., 1999). All mice were housed in cages with 3-5 mice per cage and given access to sterilized food and water ad libitum. Mice were allocated to experimental groups randomly. After inoculation, mice were housed in an IVC rack in sterile conditions, and samples were tested by PCR to ensure sterility was maintained for until the experimental endpoint. All experimental procedures were conducted under protocols approved by the Institutional Animal Care and Use Committee (IACUC) at the Broad Institute.
2D Mouse Monolayer preparation
2D mouse intestinal monolayer culture has been previously described (Brown et al., 2019). Briefly, day-3 colonic spheroids were dissociated into single cells using TrypLE Express and passed through a 70 μm filter into 50% L-WRN conditioned medium containing 10 μM Y27632 (R&D Systems). 3×10⁵ cells were plated on a 24-well transwell insert (Costar, #3470) coated with 1:40 Matrigel diluted in PBS. 150 μL of medium was added to the upper compartment and 600 μL of medium was added to the lower compartment. After 24h, the media in both compartments was replaced with 50% L-WRN medium. After an additional 24h, the media was replaced with 5% L-WRN medium to induce differentiation. Media was replaced daily, and monolayers were maintained for up to 5 days.
Epithelial cell lines
The cell lines utilized in this study were HT-29 cells (ATCC HTB-38), Caco-2 cells (ATCC HTB-37) and U2OS cells (ATCC HTB-96) all obtained directly from ATCC as low passage cells. HT-29, U2OS and Caco-2 cells were grown in standard conditions at 37 degrees under 5% CO2 using DMEM medium (Thermo) supplemented with 1% Pen/Strep, 1% glutamax (Thermo), 10% tetracycline-free FBS and 10mM glutamine. Before use for experiments, cells were passaged at least twice and no more than 12 times total.
Bacterial strains and growth
The strains utilized in this study (Bacteroides stercoris ATCC 43183, Bacteroides stercoris ATCC 43183 Δtdk, Bacteroides stercoris ATCC 43183 Δbxa and Bacteroides thetaiotaomicron VPI-5482) were all grown on BHI agar plates supplemented with vitamin K and hemin (BD Biosciences) before being used for mouse experiments, growth curves or adherence assays. For growth of Bacteroides on inosine, we first sub-cultured B. stercoris grown on a BHI plate into 5 mL of inosine minimal media for 2-5 days to obtain growth. We used this subculture to set up growth curves to assess B. stercoris growth in inosine. To quantify growth on inosine as the carbon source, we measured the increase in culture absorbance (600 nm) in 200mL cultures in 96-well plates was measured at 30-minute intervals for 72h on an automated plate reader (BioTek). Inosine minimal media was adapted from (Glowacki et al., 2020) and made with the following components (see Key Resources Table for more information). To make 200mL, 40mL of the 10X salt solution (KH2PO4, NaCl, (NH4)2SO4); 400μL of a mix of menadione (1 mg/mL), FeSO4 (0.4 mg/mL), MgCl2 (0.1M), CaCl2 (0.8% w/v), and histidine hematin (1.9mM in 0.2M histidine); 200μL of vitamin B12 (0.01 mg/mL); 400mg of L-cysteine, 4mL vitamin supplement (ATCC); 4mL trace minerals (ATCC); carbon source (3g inosine or lactose).
Key Resources Table
| REAGENT OR RESOURCE | SOURCE | IDENTIFIER |
|---|---|---|
| Antibodies | ||
| Anti-ADP-ribose (E6F6A) | Cell Signaling Technologies | Cat. # 83732S RRID: AB_2749858 |
| Anti-ethenoadenosine (1G4) | Thermo Fisher | Cat. # Ma1-40268 RRID: AB_1074293 |
| Anti-vinculin (7F9) | Sigma | Cat. # 90227 RRID:AB_2304338 |
| IRDye 680RD Goat anti-rabbit IgG | LICOR | Cat. # 926-68071 RRID: AB_10956166 |
| IRDye 680RD Goat anti-mouse IgG | LICOR | Cat. # 926-68070 RRID: AB_2651128 |
| Goat anti-rabbit alexa fluor 488 | Thermo Fisher | Cat. # A-11008 RRID: AB_143165 |
| Donkey anti-mouse alexa fluor 488 | Thermo Fisher | Cat. # A-21202 RRID: AB_141607 |
| Anti-paxillin (PXC-10) | Thermo Fisher | Cat. # MA1-24952 RRID: AB_795141 |
| Anti-non-muscle myosin IIA antibody | Abcam | Cat. # ab75590 RRID: AB_10674199 |
| Bacterial strains | ||
| E. coli BL21 | This study | N/A |
| E. coli DE3 | This study | N/A |
| B. stercoris ATCC 43183 | Koropatkin et al., 2008 | N/A |
| B. stercoris ATCC 43183 Δbxa | This study | N/A |
| B. stercoris ATCC 43183 Δtdk | This study | N/A |
| Biological samples | ||
| Strains from human stool from non-IBD and IBD subjects | PRISM cohort at MGH | IRB ref # 2004-P-001067 |
| Cell lines | ||
| HT-29 cells | ATCC | Cat. # HTB-38 |
| Caco-2 cells | ATCC | Cat. # HTB-37 |
| U2OS cells | ATCC | Cat. # HTB-96 |
| Chemicals and reagents | ||
| Ethanol | Sigma | Cat. # 459836 |
| Methanol | Sigma | Cat. # 34860 |
| Inosine | Sigma | Cat. # I4125-10G |
| Hemin | Sigma | Cat. # H9039-1G |
| Vitamin K1 | Sigma | Cat. # V3501-5G |
| M9 salts | Teknova | Cat. # M8008 |
| Ampicillin | Sigma | Cat. # A0166 |
| Gentamicin | Sigma | Cat. # G1397 |
| Erythromycin | Sigma | Cat. # E0774 |
| Kanamycin | Sigma | Cat. # 60615-5G |
| Cellobiose | Becton Dickinson | Cat. # 216010 |
| Maltose | Hardy Diagnostics | Cat. # C6220 |
| Fructose | Sigma | Cat. # F0127 |
| Glucose | Sigma | Cat. # 0188-1Kg |
| TRITC-conjugated Phalloidin | Sigma | Cat. # 90228 |
| DAPI | Sigma | Cat. # 90229 |
| Hoechst | Thermo Fisher | Cat. #62249 |
| SiR actin stain | Cytoskeleton | Cat. # CY-SC001 |
| Fetal Bovine Serum | Thermo Fisher | Cat. # 10438026 |
| Clickable NAD | Biolog | Cat. # N 055 |
| NAD | Sigma | Cat. # 10128965001 |
| Nicotinamide 1,N6-ethenoadenine dinucleotide (etheno-NAD) | Sigma | Cat. # N2630-5MG |
| Fluorescein-NAD | Trevigen | Cat. # 4673-500-01 |
| Tris-HCl pH 8.0 | Thermo Fisher | Cat. # 15568025 |
| Imidazole | Sigma | Cat. # I2399-100G |
| Arginine | Sigma | Cat. # A5006-100G |
| DTT | Sigma | Cat. # 10197777001 |
| PMSF | Thermo Fisher | Cat. # 36978 |
| cOmplete mini-protease inhibitor cocktail (tabs) | Sigma | Cat. # 11836153001 |
| EDTA | Thermo Fisher | Cat. # 15-575-020 |
| Sodium chloride | Sigma | Cat. # S9888 |
| Sucrose | Sigma | Cat. # S0389 |
| Glycerol | Thermo Fisher | Cat. # 15514011 |
| Nitrocellulose membrane | Thermo Fisher | Cat. # IB301002 |
| PVDF membrane | Thermo Fisher | Cat. # IB401031 |
| 15-well 4-20% SDS-PAGE gels | Bio-Rad | Cat. # 4561095 |
| SYBR green | Thermo Fisher | Cat. # A25742 |
| Instant Blue gel stain | Abcam | Cat. # ab119211 |
| His-Pur Nickel beads | Thermo Fisher | Cat. # 88221 |
| Protein G Dynabeads | Thermo Fisher | Cat. # 1004D |
| Tween 20 | Sigma | Cat. # P9416 |
| Triton-X | Sigma | Cat. # X100 |
| Paraformaldehyde | Thermo Fisher | Cat. # 28906 |
| PBS | VWR | Cat. # 45000-446 |
| Blebbistatin | Sigma | Cat. # B0560-1MG |
| ML-9 | Sigma | Cat. # C1172-5MG |
| Crystal Violet | BD Biosciences | Cat. # 212525 |
| Commercial assay kits | ||
| Qiagen RNeasy Plus Mini Kit | Qiagen | Cat. # 74136 |
| Qiagen DNA extraction stool kit | Qiagen | Cat. # 51504 |
| Qiagen Tissue extraction kit | Qiagen | Cat. # 69504 |
| Legendplex Mouse Inflammation Kit | Biolegend | Cat. # 552364 |
| SuperScript III reverse transcriptase kit | Invitrogen | Cat. # 18080051 |
| Direct-Zol RNA MiniPrep Plus | Zymo Research | Cat. # R2060 |
| Fluorometric Inosine Detection Kit | Abcam | Cat. # ab126286 |
| ATP detection kit | Abcam | Cat. # ab113849 |
| ADA activity assay kit | Abcam | Cat. # ab204695 |
| Focal adhesion staining kit | Sigma | Cat. # FAK100 |
| HiFi DNA Assembly Master Mix | New England Biolabs | Cat. # E2621S |
| Q5 High Fidelity DNA Polymerase | New England Biolabs | Cat. # M0491S |
| Deposited Data | ||
| Metabolomic analysis | This study | www.metabolomicsworkbench.org Project ID PR001176 |
| RNA-sequencing data | This study | Sequence Read Archive (SRA), Project ID PRJNA742399 |
| Experimental models | ||
| C57BL/6N mice (Gnotobiotic) | Taconic | B6-M/F |
| C57BL/6N mice (ASF) | Taconic | B6-M/F |
| Plasmids | ||
| pET28b-bxa-snap | This study | N/A |
| pET28b-bxa-818-dbl-cat | This study | N/A |
| pET28b-bxa-719-cat | This study | N/A |
| pET28b-bxa-820-cat | This study | N/A |
| pET28b-bxa | This study | N/A |
| pKNOCK-bla-ermGb | Laurie Comstock; Alexeyev, 1999 |
N/A |
| pKNOCK_erm_BACSTE_02189 | This study | N/A |
| pKNOCK_erm_tdk | This study | N/A |
| Oligonucleotides (5’-3’) | ||
| BS_ADPRT_2_F AGCCCTATGGAGGTGGCTAA |
This study | N/A |
| BS_ADPRT_2_R CTGCCACGTTGGGTACTTCT |
This study | N/A |
| BS_ARH_F GTAGGGCATACCCCAATCCG |
This study | N/A |
| BS_ARH_R TCCTTTAACTCCCTCCGGGT |
This study | N/A |
| BS_SECD_F TGGGACAGGCATCCATCAAC |
This study | N/A |
| BS_SECD_R CCGAGCGACAGTACCATACC |
This study | N/A |
| Bs_tdk_LF_XbaI CCGTCTAGACGCTGAATAATAAGTCAACGGAGTCCG |
This study | N/A |
| Bs_tdk_RF_BamHI GGCGGATCCCGTGTCGCATCTCCGGC |
This study | N/A |
| Bs_bxa_XhoI_F TCCCTCGAGGCGCATCCAACCGCTCC |
This study | N/A |
| Bs_bxa_SalI_R TTAGTCGACGTCGAATGTAATCTTTTTACGTTCCATAGAATCCTGTATTAAATTTATTA |
This study | N/A |
| DEFA_F TGTAGAAAAGGAGGCTGCAATAG |
This study | N/A |
| DEFA_R AGAACAAAAGTCGTCCTGAGC |
This study | N/A |
| REG3G_F ATGCTTCCCCGTATAACCATCA |
This study | N/A |
| REG3G_R GGCCATATCTGCATCATACCAG |
This study | N/A |
| IL22_F TGCTCAACTTCACCCTGG |
This study | N/A |
| IL22_R CTTCTGGATGTTCTGGTCGT |
This study | N/A |
| GAPDH_F AGGTCGGTGTGAACGGATTTG |
This study | N/A |
| GAPDH_R GGGGTCGTTGATGGCAACA |
This study | N/A |
| Software and algorithms | ||
| Prism 9 | GraphPad Software | www.graphpad.com/ |
| FlowJo v11 | FlowJo LLC | www.flowjo.com |
| Tracefinder | Thermo Fisher | www.thermofisher.com/order/catalog/product/OPTON-30491 |
| Progenesis QI | Nonlinear Dynamics | www.nonlinear.com/progenesis/qi/ |
| edgeR | Robinson et al., 2010 | PMID: 19910308 |
| CellQuest | Becton Dickinson | www.bdbiosciences.com |
| PHASTER | Arndt et al., 2016 | www.phaster.ca |
| Harmony High-Content Imaging and Analysis Software v4.9 | Perkin Elmer | www.perkinelmer.com/product/harmony-4-9-office-license-hh17000010 |
| Rich Media and Cell Culture | ||
| 1% vitamin K1-hemin solution | Becton Dickinson | Cat. # 212354 |
| Brain Heart Infusion | Becton Dickinson | Cat. # 241830 |
| Luria Bertani (LB) | Sigma | Cat. # L3522 |
| RPMI 1640 | Thermo Fisher | Cat. # 11875093 |
| DMEM | Thermo Fisher | Cat. # 11965-084 |
| GlutaMAX | Thermo Fisher | Cat. # 35050061 |
| TrypLE-express | Thermo Fisher | Cat. # 12605036 |
| Penicillin-Streptomycin | Thermo Fisher | Cat. # 15140122 |
| Minimal Media | ||
| Menadione | Sigma | Cat. # M5625-100G |
| FeSO4 | Sigma | Cat. # 215422-250G |
| MgCl2 | Sigma | Cat. # M8266-100G |
| CaCl2 | Sigma | Cat. # C5670-100G |
| Hematin | Sigma | Cat. #H3281-5G |
| Vitamin B12 | Sigma | Cat. # V2876-100mg |
| KH2PO4 | Sigma | Cat. # P0662-500G |
| NaCl | Sigma | Cat. # S9888-500G |
| (NH4)2SO4 | Sigma | Cat. # A4915-500G |
| L-cysteine | Sigma | Cat. # C7352-100G |
| Inosine | Sigma | Cat. # I4125-10G |
| Lactose | Sigma | Cat. # I7814-1KG |
| Trace vitamins | ATCC | Cat. # MD-VS |
| Trace minerals | ATCC | Cat. # MD-TMS |
Human fecal samples
Previously frozen fecal samples from healthy human donors were utilized to test NAD-glycohydrolase activity and for isolation of commensal bacteria to screen for ADPRT activity. All samples were obtained with written consent from each donor, under the IRB ref # 2004-P-001067 and had institutional approval for use.
METHOD DETAILS
Bioinformatics and ADPRT characterization
In order to identify ADPRTs in the human microbiome we first performed a bioinformatics analysis mining the NCBI database with complementary approaches. First, we searched for homologous proteins using BLAST with the segmented filamentous bacteria secreted ADPRT as a query (Pamp et al., 2012). Second, we utilized both the full protein sequence and the sequence of the catalytic domain of known bacterial ADPRT toxins and their respective protein sequence alignments as a starting point for PSI-blast searches. Third, we utilized general expressions for canonical ADPRT toxins to perform PHI-blast searches. To limit our findings to microbiome-relevant species we limited all searches to the list of gut microbiota species described in the IGC consortium database (Li et al., 2014). The sequences were further analyzed by HHMER and the NCBI conserved domain database to annotate pFAM regions within the identified sequences to confirm the presence of an ADPRT-relevant pFAM domain (namely, ART, ADPRT_Exo, ADP Ribosyltransferase and VIP2). A number of sequences showed only phage pFAMs and a limited number of sequences were annotated for other enzymatic activities (SAM, DNA binding, B12 binding, etc.). These sequences were not included in subsequent analysis. Complementary, we also mined for existing pFAM domain annotations in bacterial protein sequences of human microbiota species, namely: ADPrib_exo_Tox (PF03496), and ART (PF01129). pFAM annotations were used to separate the sequences into putative N (if domain was within first 33% residues), M (if pFAM domain was within 33%-66% of the sequence length) or C term ADPRTs. Human microbiota ADPRT protein sequences were aligned using ClustalW with known ADPRT toxin sequences to determine its phylogeny as well as create a sequence similarity matrix. Analysis of sequence homology was performed in CytoScape with 60% cut-off as threshold parameters to define sequence clusters. Catalytic domain prediction was performed using PFAM sequence recognition and the catalytic domain alignment was performed using the MUSCLE algorithm. Phylogenetic trees were generated from the MUSCLE alignment using the NGPhylogeny tool using Fastree (Lemoine et al., 2019). Selected human microbiome ADPRT protein sequences were analyzed against the HMP1, IGC microbiome and HMP2 studies to assess the prevalence of the ADPRT sequences in the DNA and RNA databases. For the phylogenetic analysis of the Bxa phage, we projected these Bacteroides isolates containing or those that do not contain the Bxa phage onto a tree in Newick format using Phylophlan (Segata et al., 2013) with default settings. To comprehensively evaluate the distribution of Bxa ADPRT homologs in bacterial species from phylum Bacteroidetes found in any environment (feces, saline water, groundwater, soil, etc.), we downloaded 9236 genomes from isolates annotated to phylum Bacteroidetes from PATRIC database (version January 2020) (Wattam et al., 2014). Using the B. stercoris ADPRT as a query we searched the isolate genomes with protein-protein BLAST 2.2.30+ (-max_target_seqs 100000, -evalue 1e-4) and identified 121 hits with minimum 50% sequence identity and 50% sequence coverage. Of note, all but 1 hit had sequence identity of >95% and these were retained for creating the overview of species encoding Bxa homologs. All of the hits with available annotation in PATRIC (Isolation source, Host name) were host associated, mainly human, and derived from gastrointestinal tract or fecal matter (File S1); in PATRIC, these isolates represented approximately 4.3% of all gastrointestinal tract associated Bacteroidetes isolates.
ADPRT cloning and mutagenesis
The ADPRT sequence from Bacteroides stercoris (Uniprot: B0NRS8_BACSTE) was synthesized (Genewiz) into a pET28b vector with an IPTG inducible promoter to drive expression. A cleavable 6HIS-SNAP tag for purification and fluorescence labelling was fused to the coding sequence through a GGSGGS ENLYFQ linker which includes the TEV protease cleavable sequence. Point mutations in ADPRT were performed using QuikChange XL (Agilent) and verified by DNA sequencing (Genewiz). All residue numbers described in the manuscript correspond to the ADPRT sequence only. Expression plasmids were introduced into chemically competent Escherichia coli BL21(DE3) (NEB) following standard protocols. Disruption of bxa and tdk in Bacteroides stercoris was accomplished leveraging allelic exchange of the ADPRT gene with the suicide vector pKNOCK-bla-erm carrying 750 base pairs of homology with the bxa gene and tdk gene (Alexeyev, 1999). For each genetic mutant, the integration of the vector was confirmed by selection on erythromycin and disruption of the gene was confirmed via DNA sequencing (Genewiz).
Bxa purification
BL21(DE3) cells were grown to an OD600 of 0.4 at 37°C. Protein expression was induced by addition of 0.5mM IPTG for 18h at 30°C. Cells were washed 2x in a pre-lysis buffer (50mM Tris HCl pH8, 300mM NaCl, 40mM Imidazole, 10% glycerol) and cell pellets were frozen in liquid nitrogen and stored at −80°C. Cell pellets were thawed in ice-cold B-PER lysis buffer (Pierce/Thermo) supplemented with EDTA-free complete protease inhibitors (Roche), 2mM DTT, 2mM PMSF and 1mM ATP-MgCl2. They were then dounce-homogenized and incubated for 20 minutes. After the incubation, the cell slurry was supplemented with 300mM NaCl, 50mM Tris HCl pH8, 40mM Imidazole, 10% glycerol and sonicated to ensure complete lysis. After centrifugation at 45000 RPM, 45 minutes (F50L Thermo) at 4°C the supernatant was collected and incubated with Ni2+ sepharose (GE Healthcare) for 30 minutes. The beads were washed 3 times with wash buffer (50mM Tris-HCl pH 8, 300mM NaCl, 10% Glycerol, 25mM Imidazole, 50uM DTT, 1mM PMSF, 0.1mM NAD, EDTA-free complete protease inhibitor (Roche), 1mM Arg). The protein was fluorescently labelled with 30μM SNAP dye on beads for 1h at 4°C. Elution off the Ni beads was performed with a step gradient with elution buffer (50mM Tris-HCl pH 8.0, 300mM NaCl, 180mM Imidazole, 50mM EDTA, 100mM Arg, 100uM DTT). The protein was loaded onto a UnoS ion exchange column (GE Healthcare) equilibrated with 50mM Hepes, 100mM NaCl and 100μM DTT. The protein was eluted by a linear gradient to 1M NaCl, peak fractions were pooled and supplemented with 10% sucrose and centrifuged at 80000 rpm for 5 minutes at 4°C. The supernatant was collected, frozen in liquid nitrogen and stored at −80°C. A parallel purification protocol utilized an analytical size exclusion step in place of the ion exchange step for non-muscle myosin II interaction experiments. Protein from affinity purification was applied at 0.5 mL/min to a 24mL Superose 6 column equilibrated in 50mM HEPES pH 8.0, 100mM NaCl, 0.1 mM DTT using an AKTA Pure FPLC system operating at 4°C. Fractions collected for experiments were checked for purity using Coomassie staining and Western blot before flash-freezing in liquid nitrogen and storage at −80°C.
NAD-glycohydrolase activity assays
Bacterial frozen stocks from the Novartis and Broad Institute library collection were plated onto BHI agarose plates and grown until significant biomass was observed, on average 2 days in anaerobic conditions (2-3% Hydrogen, 20% CO2, 50% humidity) at 37°C. Bacteria was collected and placed in 800ul of pre-reduced assay buffer (20mM Tris pH 7.5, 50mM NaCl), measured by OD600 and incubated for 30 minutes. After centrifugation at 15000g for 3 minutes in a tabletop centrifuge at room temperature, the supernatant was collected and aliquoted on 96-well plates and supplemented to 1mM etheno-NAD (Sigma N2630). To assess NADase activity the fluorescence emission at 410nm (303nm excitation) was measured every 30 seconds for 2h in a spectrophotometer following the method described previously (Visschedyk et al., 2010). A linear fit to the data was performed and the slope of the curve was normalized by the initial OD600 measurement. To convert the data to units of product hydrolyzed, etheno-AMP standards (Jena Biosciences) were used. NAD-glycohydrolase assays using recombinant ADPRT proteins were carried out similarly to the bacterial assays with the following modifications. Purified ADPRT or C3 ADP ribosyltransferase toxin (Cytoskeleton) were diluted directly in assay buffer (50 mM Tris-pH 8.0, 300mM NaCl) and supplemented to 1mM etheno-NAD. Final NAD-glycohydrolase rates were normalized by input protein concentration and the buffer control. For analysis of stool NAD-glycohydrolase activity, supernatants from stool were collected from spun down samples at 10000 g on a tabletop centrifuge. We then assayed for NAD-glycohydrolase activity using the same method as above on supernatants from each mouse normalized by protein concentration.
Preparation of lysates from human cell lines
HT-29 and Caco-2 cells were grown in standard conditions under 5% CO2 using DMEM medium (Thermo) supplemented with 1% Pen/Strep, 10% tetracycline-free FBS and 10mM glutamine. A total of 109 cells were harvested and washed 2x with PBS, flash-frozen and stored at −80°C. Cell pellets were thawed and resuspended in IP lysis buffer (Thermo) at 300ul/50mg wet cell pellet, supplemented with mini-EDTA-free complete inhibitor (Roche) and 1mM PMSF. Cell solutions were then briefly sonicated to ensure complete lysis and lysates were spun for 10 minutes at 15000g in a tabletop centrifuge at 4°C. Supernatants were supplemented with 10% glycerol, flash frozen in liquid nitrogen and stored at −80°C.
ADP-ribosyltransferase activity assays
To assess the ADP ribosyltransferase activity of bacterial enzymes we performed in vitro reactions with NAD analogues in HT-29 and Caco-2 cell lysates. To visualize and label the human target of the bacterial ADP ribosyltransferase reaction we independently utilized four NAD analogues: Biotinylated-NAD (Trevigen; 4670-500-01), etheno-NAD (1,N6-ethenoadenine dinucleotide; N2630 Sigma), click-NAD (8-bu(3-yne)T-NAD); N055 Biolog) and fluorescein-NAD (Trevigen; 4673-500-01). Cell lysates were thawed, pooled and then aliquoted for each reaction. To initiate the reaction 1μM of purified protein was added to the lysates, along with 200μM NAD and incubated for 1h at 37°C. The reaction was performed in a buffer containing 50mM tris pH 8.0, 300mM NaCl, 1mM DTT, 10% sucrose and 1mM arginine. The C3 ADP ribosyltransferase toxin (Cytoskeleton), known to ADP ribosylate RhoA was used in all reactions as a positive control. The reaction was stopped by addition of 4x sample buffer (Bio-Rad), boiled for 5 minutes and analyzed by SDS-PAGE (NuPage Invitrogen) and western blotting. For the reactions involving purified non-muscle myosin II proteins, 5μg of myosin II protein was added to a buffered solution containing 1μM Bxa, and 200μM NAD in 50mM tris pH 8.0, 1mM DTT, 300mM NaCl, 1mM arginine and 10% sucrose for 1h at room temperature. The reaction was stopped by addition of 4x sample buffer (Bio-Rad), boiled for 5 minutes and analyzed by SDS-PAGE (Bio-Rad) and western blotting.
Western blotting
The samples were diluted in 4x sample buffer (in 50mM Tris pH 8.0) and 15 μl of the sample was loaded in an SDS PAGE gel (Novex or Bio-Rad). The gel was run at 150V in SDS-PAGE buffer for 45 minutes. Dry transfer to a nitrocellulose (NC) membrane was carried out in an iBlot 2 (Thermo Fisher) for the pulldown blotting experiments and PVDF membrane was used for the purified non-muscle myosin II blotting experiments. The NC or PVDF membrane was blocked in Odyssey blocking buffer (LI-COR) at room temperature for 1h and incubated with primary antibody diluted in blocking buffer for 18h at 4°C. Anti-mono ADP-ribose (E6F6A, 83732 Cell signaling) was used at 1:800. The antibody was validated using the well-established C3 toxin which specifically labels RhoA with an ADP-ribosyl group. Validation experiments were done using purified C3 and RhoA as well as HT-29 lysate and purified C3 (not shown). All secondary antibodies were diluted at 1:15 000 (LI-COR). All antibody dilutions were performed in TBST. Membranes were washed 3 times for 5 minutes in TBST and then incubated with secondary antibodies (goat-anti-rabbit IRA LI-COR antibody) for 1h. Membranes were then washed 3 times for 5 minutes with TBST and imaged with an Odyssey LI-COR system.
Immunoprecipitations
Immunoprecipitations and target enrichment were carried out similarly to the described ADP ribosyltransferase labelling assay but increasing the final concentration of labelled NAD to 100uM. After ADPRT reactions were completed, the reaction was stopped by addition of 1mM BME, 1mM DTT and heating to 55°C for 5 minutes. Samples were dialyzed overnight in 2k MWCO (Thermo Pierce) in 50mM Tris pH 8.0, 150mM NaCl, 0.01% Triton-X. After dialysis, samples were incubated for 3h with rotation with functionalized dynabeads protein-G (Invitrogen) coupled with the respective antibody anti-mono ADP-ribose (E6F6A, 83732 Cell signaling) or anti-ethenoadenosine (1G4) (Novus). Samples were washed 3 times with IP lysis buffer (Thermo Fischer) and resuspended in 30μL of 50mM Tris pH 8.0. Samples labelled with a clickable NAD analogue (8-bu(3-yne)T-NAD; N055 Biolog) were processed as described for other NAD analogues. After dialysis, click reactions were carried out as described in the standard protocol from Jena Biosciences (click chemistry capture kit; CLK-1065). Briefly, azide-DDE-agarose beads (Jena Biosciences; CLK-1139-2) were added to the reaction mix and samples were supplemented with 2x copper catalyst solution and incubated overnight at 4°C with rotation, washed 3 times with agarose wash buffer (Jena), 3 times with RIPA buffer (Thermo) and twice in PBS pH7.2. To release ADP-ribosylated labeled peptides DDE (1 - ( 4, 4 - dimethyl - 2, 6 - dioxocylohexylidene) ethyl) deprotection reaction was carried out at a final concentration of 2% hydrazide in PBS pH 7.2 at room temperature for 1h.
Metabolomic analysis
Metabolic profiles were measured from cell supernatants and fecal pellets from mice resuspended in 10 mg/mL of 1x PBS. We used liquid chromatography tandem mass spectrometry (LC-MS) to measure polar metabolites (HILIC-pos) using a sensitive, high resolution mass spectrometer (ID-X, Thermo Scientific) that enabled the measurement of known and unknown metabolites. Samples were prepared from 10 μL of supernatant via protein precipitation with the addition of 90 μL of 74.9:24.9:0.2 v/v/v acetonitrile/methanol/formic acid containing stable isotope labeled internal standards (valine-d8, Isotec; and phenylalanine-d8, Cambridge Isotope Laboratories; Andover, MA). The samples were centrifuged (10 minutes, 10,000 x g, 4°C), and the supernatants were injected directly onto a 150 × 2 mm Atlantis HILIC column (Waters; Milford, MA). The column was eluted isocratically at a flow rate of 250 μL/min with 5% mobile phase A (10 mM ammonium formate and 0.1% formic acid in water) for 1 minute followed by a linear gradient to 40% mobile phase B (acetonitrile with 0.1% formic acid) over 10 minutes. MS analyses were carried out using electrospray ionization in the positive ion mode using full scan analysis over m/z 70--800 at 120,000 resolution and 3 Hz data acquisition rate. Additional MS settings were: ion spray voltage, 3.5 kV; capillary temperature, 350°C; probe heater temperature, 300 °C; sheath gas, 40; auxiliary gas, 15; and S-lens RF level 40. Data were analyzed using Progenesis QI peak picking software ThermoScientific Trace Finder 5.0.
Cell culture and Bxa treatment for immunofluorescence and microscopy
U2OS or HT-29 cells were grown at 37°C, 5% CO2, in Dulbecco Modified Eagle’s Medium (DMEM) supplemented with 10mM glutamine 0% tetracycline-free FBS and 100 IU/mL penicillin, and 100 μg/mL streptomycin. P2-P3 cells were seeded at 0.02 cells/ml onto poly L-Lysine coated glass slides (Corning) in 24-well plates and incubated overnight. To remove unbound cells, samples were washed with fresh media, then resuspended at a final volume of 300 μL with the addition of Bxa, E818A/E820A Bxa or control buffer (50mM Tris pH 8.0, 300mM NaCl, 100μM DTT) as indicated in the text. Cells were fixed and stained as previously described (Liu et al., 2018). Briefly, cells were washed in PBS and fixed with 4% paraformaldehyde for 15 minutes; cells were then treated with 0.5% Triton X-100 in PBS for 5 minutes, washed 3 times with PBS, blocked with 3% BSA (PBS-BSA) and incubated with 1/500 of anti-vinculin (Sigma) diluted in 3% BSA-PBS for 60 minutes. These samples were then washed 3 times for 5 minutes with 0.05% Triton X-100 in PBS. Primary antibodies (vinculin) were detected using species-specific fluorescent secondary antibodies (Thermo-Fischer). Finally, the samples were washed 3 times for 5 minutes with 0.05% Triton X-100- PBS before addition of 1/1000 of TRITC-phalloidin (Sigma) if actin labeling was required. Prolong Gold Antifade with DAPI (Life Technologies; Sigma) was used for mounting of all immunofluorescence samples. Images were acquired on a Zeiss LSM880 confocal laser-scanning microscope in Airyscan mode, equipped with a Zeiss Plan-APO ×63–1.46 oil immersion objective. We used the 60x objective with sequential channel acquisition. Quantification of focal adhesions and HT-29 cell fixed microscopy images were obtained with a Perkin Elmer Opera Phenix system using a 60x 1.42 N.A. water objective. After acquisition, the images were projected to form one image by maximum-intensity projection. Analysis of images was performed using Harmony High-Content Imaging and Analysis Software.
Live cell microscopy
For live cell imaging, HT-29 cells were seeded in 3 cm glass wells (Corning) and stained with combinations of either Hoechst (1/2000; BD Biosciences), Bxa (200nM; Alexa-fluor 561), Cell-tracker red-shift stain (Thermo Fischer) and SiR actin live cell stain (Cytoskeleton). Cells were observed in a chamber that provided an atmosphere of 5% CO2 at 37°C (Okolab) and visualized using a Nikon Eclipse Ti2 confocal microscope, with a CSU-W1 confocal scanner and a Zyla SCMDS lens (Nikon). For time lapse observation of Bxa binding, 200nM of Bxa was added to the cells in real time and cells were imaged immediately at 4 frames per minute for a total of 15 minutes at 60x magnification. For time lapse observation of actin dynamics, cells were imaged immediately after 200nM Bxa-treatment at 6 frames per hour for 8 hours at 60x magnification. In live cell imaging experiments photo-bleaching and photo-stress were reduced by minimal aperture of the monochromator exit slit and the microscope was equipped with high speed shutters for fluorescence and transmitted light illumination. Further, a prolong-Gold reagent was used to reduce photo-bleaching of the cells and maintain the fluorescence of the fluorophores over time after rapid light-activation. Control cells with no Bxa treatment were also visualized to confirm there were no changes in ultrastructure of the cells induced by a photobleaching event.
Micropattern cellular imaging assays
Micropattern assays were carried out as described in Margaron et al. 2019 (https://www.biorxiv.org/content/10.1101/797654v1.full). Fibronectin coated cell adhesive micropatterns were obtained from CYTOO and used according to manufacturer instructions. Cells were seeded to the micropattern slides after trypsin treatment (Gibco) cells at a density of 500000 cells per chip in culture medium and incubated for 24h. Samples were then washed 3 times with fresh media to remove unbound cells and treated with recombinant protein or bacterial supernatant. Following treatment cells were fixed and stained as previously described. F-actin and microtubule networks were imaged in 3D in fixed cells using a Zeiss LSM880 confocal laser-scanning microscope in Airyscan mode, equipped with a Zeiss Plan-APO ×63–1.46 oil immersion objective. Airyscan reconstruction was achieved using the Zeiss basic plugin. Z-maximum projections were achieved.
Sample preparation for proteomics
Samples from each immunoprecipitation procedure were prepared for mass spectrometry as follows. Samples were heated at 100°C for 15 minutes in 70μL of 1.5X LDS buffer. Half of each sample was processed by SDS-PAGE using a 10% Bis-Tris NuPAGE gel (Invitrogen) with the MES buffer system. The mobility region was excised into 10 equal sized segments and in-gel digestion was performed on each using a robot (ProGest, DigiLab) with the following protocol: 1) washed with 25mM ammonium bicarbonate followed by acetonitrile; 2) reduced with 10mM dithiothreitol at 60°C followed by alkylation with 50mM iodoacetamide at room temperature; 3) digested with sequencing grade trypsin (Promega) at 37°C; and 4) quenched with formic acid and the supernatant was analyzed directly without further processing.
Mass spectrometry for proteomics
One half of each digest was analyzed by nano LC-MS/MS using a Waters M-Class HPLC system interfaced to a ThermoFisher Fusion Lumos mass spectrometer. Peptides were loaded on a trapping column and eluted over a 75 μm analytical column at 350 nL/min; both columns were packed with Luna C18 resin (Phenomenex). The mass spectrometer was operated in data dependent HCD mode, with MS and MS/MS performed in the Orbitrap at 60,000 FWHM resolution and 15,000 FWHM resolution, respectively. The instrument was run with a 3s cycle for MS and MS/MS. APD was enabled. For data processing, the Data were searched using a local copy of Mascot (Matrix Science) with the following parameters: 1) Enzyme: Trypsin/P; 2) Database: SwissProt Human (concatenated forward and reverse plus common contaminants); 3) Fixed modification: Carbamidomethyl (C); 4) Variable modifications: Oxidation (M), Acetyl (N-term), Pyro-Glu (N-term Q), Deamidation (N,Q), ADP-Ribosylation; 5) Mass values: Monoisotopic; 6) Peptide Mass Tolerance: 10 ppm; 7) Fragment Mass Tolerance: 0.02 Da; and 8) Max Missed Cleavages: 2. Mascot DAT files were parsed using Scaffold (Proteome Software) for validation, filtering and to create a non-redundant list per sample. Data were filtered using 1% protein and peptide FDR and requiring at least two unique peptides per protein.
Ganglioside-binding assays
For quantification of Bxa-bound HT-29 cells, a concentration of either 1 ug/mL or 20 ug/mL GM1a ganglioside (Avanti) was added to the cell culture for 1h and then cells were washed with the cell culture media (DMEM supplemented with 10% FBS, 5 mg of penicillin/streptomycin, 1% non-essential amino acids and 1% sodium-pyruvate). Next, a concentration of 200nM of Bxa (AF 561nm labelled) was added to each well with or without GM1a (n=6) for 4h before cells were collected and washed 3 times in a FACS buffer (1% FBS in PBS). HT-29 cells were then run on a CytoFLEX (Beckman-Coulter) flow cytometer and analyzed for differences in their mean fluorescent intensity on the PE channel (561nm). For further quantification of Bxa ability to bind to gangliosides, an ELISA method was used similar to as previously described (Dawson, 2005). Briefly, either ceramide 18:0 (Avanti) or GM1a ganglioside (Avanti) was coated on a high-binding 96-well flat-bottomed ELISA plate (Corning) at 10 ug/mL in a PBS buffer at pH 7.5 for 18h at 4°C. After washing PBS/Tween 20 (0.1%), the plate was blocked with 5% milk powder (BD Biosciences) and next a PE (AF-561-linked) Bxa was next added to the plate in a dilution curve and incubated at room temperature for 2h. After washing again, we next probed the plate with a 1/1000 dilution of an anti-PE antibody (Thermo Fisher) for 1h at room temperature and then a 1/2000 dilution of anti-mouse-IgG-HRP for 1h. Wells were developed using TMB and read at an absorbance of 450nm on a plate reader (Bio-Rad).
Bacterial adherence assay
HT-29 cells or Caco-2 cells were cultured in Dulbecco’s modified Eagle’s medium (DMEM) supplemented with 10% fetal bovine serum (FBS), 5 mg of penicillin/streptomycin, 1% non-essential amino acids and 1% sodium-pyruvate. Cells were plated at a density of 5x10⁶ cells per well in a 12-well, tissue-culture treated sterile dish (VWR), and let rest for 18h. B. stercoris strain ATCC 43183 was cultured in Brain Heart Infusion (BHI) medium (BD Biosciences) containing vitamin K and hemin at 37°C under anaerobic conditions (Coy anaerobic chamber), and a single colony was utilized to grow overnight in a broth culture in BHI supplemented with vitamin K and hemin. Cells were pre-treated with either purified Bxa protein or a buffer control containing the components of the Bxa buffer (20 mM Tris-HCl (pH 8.0), 1 mM sucrose, 1 mM dithiothreitol, 5 mM MgCl2) for 4h or 8h. For quantification of bacterial adherence, 100 μl of a B. stercoris overnight culture (OD 1.3; approximately 1 × 10⁹ bacteria/mL) were added to either the Caco-2 or HT-29s in a 12-well dish with no spin. The cells were incubated under anaerobic conditions for 4h. After incubation the cells were washed, removed and plated on BHI plates. After 2 days colony forming units (CFUs) were counted. Adherence of B. stercoris after Bxa treatment was quantified and compared to the control-treated sample.
Cytokine profiling
For ex vivo quantification of cytokine secretion, mesenteric lymph node cells were isolated complete tissue culture media (RPMI, 10% FBS, 1% glutamine and 1% of 1:1 penicillin/streptomycin) and cultured in 96-well plates at 100000 cells per well in 200 μL for 18h at 37°C, 5% CO2. The resulting supernatants were used to determine the amount of each cytokine using murine-specific cytokine bead array kit for mouse T-helper and inflammatory cytokines (Biolegend), relative to a standard curve, according to the manufacturer’s recommendations.
RT-qPCR
RNA was extracted from a bacterial pellet collected at each timepoint (bile acid or oxygen exposure) and further purified using the RNeasy kit (Qiagen). Approximately 1 μg was used to generate cDNA using the iScript synthesis kit (Bio-Rad). We then performed qPCR using the SYBR Green Super mix (Bio-Rad). Each sample was run in a 10 μL total volume using a PCR program consisting of: initial denaturation at 95°C for 10 minutes, followed by 40 cycles of 95°C for 15 seconds and 60°C f or 1 minute, and a final extension at 72°C for 10 minutes. The primers used for each gene are listed in the Key Resources Table.
RNA-sequencing
To generate Illumina cDNA libraries, 500 ng-1 μg of total RNA was fragmented, depleted of genomic DNA, dephosphorylated, and ligated to DNA adapters carrying 5’-AN8-3’ barcodes of known sequence with a 5’ phosphate and a 3’ blocking group. Barcoded RNAs were pooled and depleted of rRNA using the RiboZero rRNA depletion kit (Epicentre). Pools of barcoded RNAs were converted to Illumina cDNA libraries in 2 main steps: (i) reverse transcription of the RNA using a primer designed to the constant region of the barcoded adaptor with addition of an adapter to the 3’ end of the cDNA by template switching using SMARTScribe (Clontech) and (ii) PCR amplification using primers whose 5’ ends target the constant regions of the 3’ or 5’ adaptors and whose 3’ ends contain the full Illumina P5 or P7 sequences. cDNA libraries were sequenced on an Illumina NextSeq for monoculture transcriptomic data and on the Illumina HiSeq 2500 platform to generate paired-end reads for the transcriptomic data. Sequencing reads from each sample were demultiplexed based on their associated barcode sequence using custom scripts. Up to 1 mismatch in the barcode was allowed provided it did not make assignment of the read to a different barcode possible. Barcode sequences were removed from the first read as were terminal G’s from the second read that may have been added by SMARTScribe during template switching. Reads were aligned using Burrows-Wheeler Alignment tool (BWA), and read counts were assigned to genes and other genomic features using custom scripts. Differential expression analysis was conducted with edgeR (Robinson et al., 2010). Visualization of raw sequencing data and coverage plots in the context of genome sequences and gene annotations was conducted using GenomeView.
Bacterial cocktail preparation for animal experiments
For all animal experiments, bacterial cultures from frozen stocks of B. stercoris wild-type (Koropatkin et al., 2008) and the B. stercoris Δbxa strain were first plated on BHI supplemented with hemin and vitamin K for 2 days in an anaerobic chamber. For the competition assays, subsequently, pure cultures of each strain diluted to approximately the same OD600(~1.2) and mixed together at a 1:1 ratio in sterile, reduced phosphate-buffered saline (PBS). Bacterial mixtures in PBS were removed from the anaerobic chamber and immediately transported to the animal facility for gavage experiments. The volume of the mixture received per mouse was 100 μL, at a concentration of 109 cells/mL, given in a single dose at day 0. The concentration of the mixture in cell/mL was determined using a UV spectrometer, and gavage doses were confirmed by back-titering the inocula. For the germ-free mice mono-colonization experiments, pure cultures of each strain diluted to approximately the same OD600(~1.2) in sterile, reduced PBS and immediately transported to the animal facility for gavage experiments. The volume of the mixture received per mouse was 100μL, at a concentration of 109 cells/mL, given in a single dose at day 0. The concentration of the mixture in cell/mL was determined using a UV spectrometer, and gavage doses were confirmed by back-titering the inocula. For the colonization of mice with Altered Schaedler Flora (ASF mice), bacterial preparation and inoculation was carried out identical to the protocol above for the germ-free mice except we utilized a B. stercoris Δtdk strain (resistant to erythromycin), which has the same plasmid insert as the Δbxa mutant B. stercoris, and compared colonization of each. We also plated each strain on 50 ug/mL erythromycin for all experiments.
Biofilm assay
Protocol for quantification of biofilms was adopted from (Cepas et al., 2019). Briefly, bacteria were normalized to OD600 of 0.05 and grown in a 96-well plate in either rich media (BHI) or minimal media (lactose or inosine minimal media). Bacteria were let to grow and sit for 7 days in the plate before being washed 5 times with PBS (pipetting up and down vigorously). Wells were dried at 37°C for 1h and then stained with 100μL of 1% crystal violet (BD Biosciences) for 10 minutes. Each well was then washed 5 times with PBS and dried for 1h at 37°C. Remaining crystal violet which was bound to bacteria was re-suspended using a solution of 33% glacial acetic acid and read at 580nm on a spectrometer.
ATP secretion and ADA activity assay
ATP and ADA activity determination was performed on supernatants of HT-29 cells using the ATP Determination Kit (Abcam) based on the luciferase assay and following the manufacturer’s recommendations. Luminescence was measured after 30 minutes of incubation. The concentration of ATP or ADA activity in the cells was determined by using a calibration curve with increasing concentrations of ATP or the adenosine substrate for ADA.
Inosine secretion assays
Inosine concentrations in the mouse colonic tissue and HT-29 cell supernatant were measured using the inosine fluorometric detection assay kit (Abcam) following the manufacturer’s recommendations. A 1/25 dilution of the cell supernatant was made for optimal sensitivity and specificity for the assay and concentrations were calculated by comparing the fluorescence to that of the probe bound to a standard curve of known inosine concentrations.
QUANTIFICATION AND STATISTICAL ANALYSIS
Statistical analysis was performed using GraphPad Prism software. For each experiment, cell sampling and the number of independent replicates are indicated in figure legends. Data sets with normal distributions were analyzed with either the Student’s t test to compare two conditions, or with one-way ANOVA and Tukey tests to compare multiple conditions. Data sets that were not normally distributed in the normality test were analyzed with a Kruskal—Wallis test (multiple comparison). For the metabolomics and RNA-seq analysis, statistical significance was determined by false discovery rate (FDR) analysis using the Benjamini-Hochberg procedure. For assessing statistical significance among three or more groups, a one-way ANOVA with post hoc Tukey’s test was utilized. The “n” number reported in each figure legend refers to biological replicates for mouse, human, growth curves or cultured monolayer studies. Statistical analysis was performed with assistance from R-Studio, metaboanalyst version 4.0 or GraphPad Prism version 7.0. Statistical significance was given as *** p-value < 0.001; ** p-value < 0.01; * p-value < 0.05; NS (not significant) p-value ≥ 0.05. The results are expressed as the mean value with standard error of the mean (SEM), unless otherwise indicated.
Supplementary Material
File S2: Proteomics Data, Related to Figure 4.
Video S1: Bxa binds to the membrane of epithelial cells, Related toFigure 4. Rapid binding of Bxa protein (red) to the cellular membranes of HT-29 cells, with nuclei labelled by Hoechst (blue) and cells labelled with a CellTracker dye (green). A dose of 200nM of Bxa was added to the cells, which were housed in an environmentally controlled chamber at 37°C, 5% CO2. Cells were imaged immediately at 4 frames per minute for a total of 15 min. Displayed are a total of 10 min from the video; 60x magnification.
Video S2: Bxa-treated epithelial cells have a disrupted actin cytoskeleton and cell shape, Related toFigure 4. Bxa-induced epithelial cell remodeling by actin cytoskeleton rearrangement, cell migration and rounding. HT-29 cells, with nuclei labelled by Hoechst (blue) and actin filaments labelled with an SiR stain (pink), were housed in an environmentally controlled chamber at 37°C, 5% CO2 and imaged immediately after Bxa treatment. Cells were imaged at 6 frames per hour for 8 hours. Displayed are a total of 8 hours from the video; 60x magnification.
Video S3: Epithelial actin cytoskeleton remodeling induced by Bxa treatment, Related toFigure 4. Bxa-induced epithelial cell remodeling by actin cytoskeleton rearrangement, cell migration and rounding. HT-29 cells, with nuclei labelled by Hoechst (blue) and actin filaments labelled with an SiR stain (pink), were housed in an environmentally controlled chamber at 37°C, 5% CO2 and imaged immediately after Bxa treatment. Cells were imaged at 6 frames per hour for 8 hours. Displayed are a total of 8 hours from the video; 60x magnification.
Video S4: Bxa internalization in epithelial cells, Related toFigure 4. Bxa-induced epithelial cell remodeling by actin cytoskeleton rearrangement, cell migration and rounding, as well as visualization of Bxa internalization (green). HT-29 cells, with nuclei labelled by Hoechst (blue) and actin filaments labelled with an SiR stain (pink), were housed in an environmentally controlled chamber at 37°C, 5% CO2 and imaged immediately after Bxa treatment. Cells were imaged at 2 frames per hour for 8 hours. Displayed are a total of 8 hours from the video; 60x magnification.
Highlights.
Bacterial ADPRTs are not pathogen-restricted but prevalent in the gut microbiome
Most ADPRTs exist in phage elements and are horizontally transferred
An abundant Bacteroides ADPRT, Bxa, modifies non-muscle myosins in epithelial cells
Bxa disrupts actin cytoskeleton, induces inosine release and aids gut colonization
ACKNOWLEDGEMENTS
We thank Tim Arthur and Henry Haiser for isolating strains used in the study; James Sellers and his laboratory for providing purified NMMII proteins; the gnotobiotic animal facility at the Broad Institute, specifically Carlos Umana and Allan Discua for helping with experiments and Tyler Caron for providing support for running the facility; Theresa Reimels for editing text and figures. EMB was supported by a Canadian Institutes of Health postdoctoral fellowship. This work was funded by the National Institutes of Health (P30DK043351, U19AI109725, U19AI142784 and R01DK097485), Crohn’s and Colitis Foundation, Center for Microbiome Informatics and Therapeutics and Massachusetts General Hospital developmental funds (to RJX).
Footnotes
Publisher's Disclaimer: This is a PDF file of an unedited manuscript that has been accepted for publication. As a service to our customers we are providing this early version of the manuscript. The manuscript will undergo copyediting, typesetting, and review of the resulting proof before it is published in its final form. Please note that during the production process errors may be discovered which could affect the content, and all legal disclaimers that apply to the journal pertain.
DECLARATION OF INTERESTS
RJX is a consultant to Novartis.
REFERENCES
- Aktories K, Schwan C & Jank T 2017. Clostridium difficile Toxin Biology. Annu Rev Microbiol, 71, 281–307. [DOI] [PubMed] [Google Scholar]
- Alexeyev MF 1999. The pKNOCK series of broad-host-range mobilizable suicide vectors for gene knockout and targeted DNA insertion into the chromosome of gram-negative bacteria. Biotechniques, 26, 824–6, 828. [DOI] [PubMed] [Google Scholar]
- Almeida A, Nayfach S, Boland M, Strozzi F, Beracochea M, Shi ZJ, Pollard KS, Sakharova E, Parks DH, Hugenholtz P, Segata N, Kyrpides NC & Finn RD 2021. A unified catalog of 204,938 reference genomes from the human gut microbiome. Nat Biotechnol, 39, 105–114. [DOI] [PMC free article] [PubMed] [Google Scholar]
- Aravind L, Zhang D, De Souza RF, Anand S & Iyer LM 2015. The natural history of ADP-ribosyltransferases and the ADP-ribosylation system. Curr Top Microbiol Immunol, 384, 3–32. [DOI] [PMC free article] [PubMed] [Google Scholar]
- Arndt D, Grant JR, Marcu A, Sajed T, Pon A, Liang Y & Wishart DS 2016. PHASTER: a better, faster version of the PHAST phage search tool. Nucleic Acids Res, 44, W16–21. [DOI] [PMC free article] [PubMed] [Google Scholar]
- Bendtsen JD, Kiemer L, Fausboll A & Brunak S 2005. Non-classical protein secretion in bacteria. BMC Microbiol, 5, 58. [DOI] [PMC free article] [PubMed] [Google Scholar]
- Brown EM, Ke X, Hitchcock D, Jeanfavre S, Avila-Pacheco J, Nakata T, Arthur TD, Fornelos N, Heim C, Franzosa EA, Watson N, Huttenhower C, Haiser HJ, Dillow G, Graham DB, Finlay BB, Kostic AD, Porter JA, Vlamakis H, Clish CB & Xavier RJ 2019. Bacteroides-Derived Sphingolipids Are Critical for Maintaining Intestinal Homeostasis and Symbiosis. Cell Host Microbe, 25, 668–680 e7. [DOI] [PMC free article] [PubMed] [Google Scholar]
- Brussow H, Canchaya C & Hardt WD 2004. Phages and the evolution of bacterial pathogens: from genomic rearrangements to lysogenic conversion. Microbiol Mol Biol Rev, 68, 560–602, table of contents. [DOI] [PMC free article] [PubMed] [Google Scholar]
- Cepas V, Lopez Y, Munoz E, Rolo D, Ardanuy C, Marti S, Xercavins M, Horcajada JP, Bosch J & Soto SM 2019. Relationship Between Biofilm Formation and Antimicrobial Resistance in Gram-Negative Bacteria. Microb Drug Resist, 25, 72–79. [DOI] [PubMed] [Google Scholar]
- Chen C & Barbieri JT 2018. Detection of ADP-Ribosylating Bacterial Toxins. Methods Mol Biol, 1813, 287–295. [DOI] [PubMed] [Google Scholar]
- Cohen MS & Chang P 2018. Insights into the biogenesis, function, and regulation of ADP-ribosylation. Nat Chem Biol, 14, 236–243. [DOI] [PMC free article] [PubMed] [Google Scholar]
- Dawson RM 2005. Characterization of the binding of cholera toxin to ganglioside GM1 immobilized onto microtitre plates. J Appl Toxicol, 25, 30–8. [DOI] [PubMed] [Google Scholar]
- Dewhirst FE, Chien CC, Paster BJ, Ericson RL, Orcutt RP, Schauer DB & Fox JG 1999. Phylogeny of the defined murine microbiota: altered Schaedler flora. Appl Environ Microbiol, 65, 3287–92. [DOI] [PMC free article] [PubMed] [Google Scholar]
- Duerkop BA, Clements CV, Rollins D, Rodrigues JL & Hooper LV 2012. A composite bacteriophage alters colonization by an intestinal commensal bacterium. Proc Natl Acad Sci U S A, 109, 17621–6. [DOI] [PMC free article] [PubMed] [Google Scholar]
- Fehr AR, Singh SA, Kerr CM, Mukai S, Higashi H & Aikawa M 2020. The impact of PARPs and ADP-ribosylation on inflammation and host-pathogen interactions. Genes Dev, 34, 341–359. [DOI] [PMC free article] [PubMed] [Google Scholar]
- Fieldhouse RJ & Merrill AR 2008. Needle in the haystack: structure-based toxin discovery. Trends Biochem Sci, 33, 546–56. [DOI] [PubMed] [Google Scholar]
- Fletcher JR, Pike CM, Parsons RJ, Rivera AJ, Foley MH, Mclaren MR, Montgomery SA & Theriot CM 2021. Clostridioides difficile exploits toxin-mediated inflammation to alter the host nutritional landscape and exclude competitors from the gut microbiota. Nat Commun, 12, 462. [DOI] [PMC free article] [PubMed] [Google Scholar]
- Glowacki RWP, Pudlo NA, Tuncil Y, Luis AS, Sajjakulnukit P, Terekhov AI, Lyssiotis CA, Hamaker BR & Martens EC 2020. A Ribose-Scavenging System Confers Colonization Fitness on the Human Gut Symbiont Bacteroides thetaiotaomicron in a Diet-Specific Manner. Cell Host Microbe, 27, 79–92 e9. [DOI] [PMC free article] [PubMed] [Google Scholar]
- Gogokhia L, Buhrke K, Bell R, Hoffman B, Brown DG, Hanke-Gogokhia C, Ajami NJ, Wong MC, Ghazaryan A, Valentine JF, Porter N, Martens E, O’connell R, Jacob V, Scherl E, Crawford C, Stephens WZ, Casjens SR, Longman RS & Round JL 2019. Expansion of Bacteriophages Is Linked to Aggravated Intestinal Inflammation and Colitis. Cell Host Microbe, 25, 285–299 e8. [DOI] [PMC free article] [PubMed] [Google Scholar]
- Jamet A, Touchon M, Ribeiro-Goncalves B, Carrico JA, Charbit A, Nassif X, Ramirez M & Rocha EPC 2017. A widespread family of polymorphic toxins encoded by temperate phages. BMC Biol, 15, 75. [DOI] [PMC free article] [PubMed] [Google Scholar]
- Kim DS, Challa S, Jones A & Kraus WL 2020. PARPs and ADP-ribosylation in RNA biology: from RNA expression and processing to protein translation and proteostasis. Genes Dev, 34, 302–320. [DOI] [PMC free article] [PubMed] [Google Scholar]
- Koropatkin NM, Martens EC, Gordon JI & Smith TJ 2008. Starch catabolism by a prominent human gut symbiont is directed by the recognition of amylose helices. Structure, 16, 1105–15. [DOI] [PMC free article] [PubMed] [Google Scholar]
- Kraus WL 2020. PARPs and ADP-ribosylation: 60 years on. Genes Dev. [DOI] [PMC free article] [PubMed] [Google Scholar]
- Kumar R, Feltrup TM, Kukreja RV, Patel KB, Cai S & Singh BR 2019. Evolutionary Features in the Structure and Function of Bacterial Toxins. Toxins (Basel), 11. [DOI] [PMC free article] [PubMed] [Google Scholar]
- Lemoine F, Correia D, Lefort V, Doppelt-Azeroual O, Mareuil F, Cohen-Boulakia S & Gascuel O 2019. NGPhylogeny.fr: new generation phylogenetic services for non-specialists. Nucleic Acids Res, 47, W260–W265. [DOI] [PMC free article] [PubMed] [Google Scholar]
- Li J, Jia H, Cai X, Zhong H, Feng Q, Sunagawa S, Arumugam M, Kultima JR, Prifti E, Nielsen T, Juncker AS, Manichanh C, Chen B, Zhang W, Levenez F, Wang J, Xu X, Xiao L, Liang S, Zhang D, Zhang Z, Chen W, Zhao H, Al-Aama JY, Edris S, Yang H, Wang J, Hansen T, Nielsen HB, Brunak S, Kristiansen K, Guarner F, Pedersen O, Dore J, Ehrlich SD, Meta HITC, Bork P, Wang J & Meta HITC 2014. An integrated catalog of reference genes in the human gut microbiome. Nat Biotechnol, 32, 834–41. [DOI] [PubMed] [Google Scholar]
- Liu S, Kwon M, Mannino M, Yang N, Renda F, Khodjakov A & Pellman D 2018. Nuclear envelope assembly defects link mitotic errors to chromothripsis. Nature, 561, 551–555. [DOI] [PMC free article] [PubMed] [Google Scholar]
- Lloyd-Price J, Arze C, Ananthakrishnan AN, Schirmer M, Avila-Pacheco J, Poon TW, Andrews E, Ajami NJ, Bonham KS, Brislawn CJ, Casero D, Courtney H, Gonzalez A, Graeber TG, Hall AB, Lake K, Landers CJ, Mallick H, Plichta DR , Prasad M, Rahnavard G, Sauk J, Shungin D, Vazquez-Baeza Y, White RA 3rd, Investigators I, Braun J, Denson LA, Jansson JK, Knight R, Kugathasan S , Mcgovern DPB, Petrosino JF, Stappenbeck TS, Winter HS, Clish CB, Franzosa EA, Vlamakis H, Xavier RJ & Huttenhower C 2019. Multi-omics of the gut microbial ecosystem in inflammatory bowel diseases. Nature, 569, 655–662. [DOI] [PMC free article] [PubMed] [Google Scholar]
- Nelson EJ, Harris JB, Morris JG Jr., Calderwood SB & Camilli A 2009. Cholera transmission: the host, pathogen and bacteriophage dynamic. Nat Rev Microbiol, 7, 693–702. [DOI] [PMC free article] [PubMed] [Google Scholar]
- Pamp SJ, Harrington ED, Quake SR, Relman DA & Blainey PC 2012. Single-cell sequencing provides clues about the host interactions of segmented filamentous bacteria (SFB). Genome Res, 22, 1107–19. [DOI] [PMC free article] [PubMed] [Google Scholar]
- Poyet M, Groussin M, Gibbons SM, Avila-Pacheco J, Jiang X, Kearney SM, Perrotta AR, Berdy B, Zhao S, Lieberman TD, Swanson PK, Smith M, Roesemann S, Alexander JE, Rich SA, Livny J, Vlamakis H, Clish C, Bullock K, Deik A, Scott J, Pierce KA, Xavier RJ & Alm EJ 2019. A library of human gut bacterial isolates paired with longitudinal multiomics data enables mechanistic microbiome research. Nat Med, 25, 1442–1452. [DOI] [PubMed] [Google Scholar]
- Rivera-Chavez F & Mekalanos JJ 2019. Cholera toxin promotes pathogen acquisition of host-derived nutrients. Nature, 572, 244–248. [DOI] [PMC free article] [PubMed] [Google Scholar]
- Robinson MD, Mccarthy DJ & Smyth GK 2010. edgeR: a Bioconductor package for differential expression analysis of digital gene expression data. Bioinformatics, 26, 139–40. [DOI] [PMC free article] [PubMed] [Google Scholar]
- Sanchez J & Holmgren J 2008. Cholera toxin structure, gene regulation and pathophysiological and immunological aspects. Cell Mol Life Sci, 65, 1347–60. [DOI] [PMC free article] [PubMed] [Google Scholar]
- Schwan C, Stecher B, Tzivelekidis T, Van Ham M, Rohde M, Hardt WD, Wehland J & Aktories K 2009. Clostridium difficile toxin CDT induces formation of microtubule-based protrusions and increases adherence of bacteria. PLoS Pathog, 5, e1000626. [DOI] [PMC free article] [PubMed] [Google Scholar]
- Segata N, Bornigen D, Morgan XC & Huttenhower C 2013. PhyloPhlAn is a new method for improved phylogenetic and taxonomic placement of microbes. Nat Commun, 4, 2304. [DOI] [PMC free article] [PubMed] [Google Scholar]
- Simon NC, Aktories K & Barbieri JT 2014. Novel bacterial ADP-ribosylating toxins: structure and function. Nat Rev Microbiol, 12, 599–611. [DOI] [PMC free article] [PubMed] [Google Scholar]
- Skjerning RB, Senissar M, Winther KS, Gerdes K & Brodersen DE 2019. The RES domain toxins of RES-Xre toxin-antitoxin modules induce cell stasis by degrading NAD+. Mol Microbiol, 111 , 221–236. [DOI] [PubMed] [Google Scholar]
- Soding J, Biegert A & Lupas AN 2005. The HHpred interactive server for protein homology detection and structure prediction. Nucleic Acids Res, 33, W244–8. [DOI] [PMC free article] [PubMed] [Google Scholar]
- Ting SY, Bosch DE, Mangiameli SM, Radey MC, Huang S, Park YJ, Kelly KA, Filip SK, Goo YA, Eng JK, Allaire M, Veesler D, Wiggins PA, Peterson SB & Mougous JD 2018. Bifunctional Immunity Proteins Protect Bacteria against FtsZ-Targeting ADP-Ribosylating Toxins. Cell, 175, 1380–1392 e14. [DOI] [PMC free article] [PubMed] [Google Scholar]
- Tremblay O, Thow Z & Merrill AR 2020. Several New Putative Bacterial ADP-Ribosyltransferase Toxins Are Revealed from In Silico Data Mining, Including the Novel Toxin Vorin, Encoded by the Fire Blight Pathogen Erwinia amylovora. Toxins (Basel), 12. [DOI] [PMC free article] [PubMed] [Google Scholar]
- Turnbaugh PJ, Ley RE, Hamady M, Fraser-Liggett CM, Knight R & Gordon JI 2007. The human microbiome project. Nature, 449, 804–10. [DOI] [PMC free article] [PubMed] [Google Scholar]
- Vicente-Manzanares M, Ma X, Adelstein RS & Horwitz AR 2009. Non-muscle myosin II takes centre stage in cell adhesion and migration. Nat Rev Mol Cell Biol, 10, 778–90. [DOI] [PMC free article] [PubMed] [Google Scholar]
- Visschedyk DD, Perieteanu AA, Turgeon ZJ, Fieldhouse RJ, Dawson JF & Merrill AR 2010. Photox, a novel actin-targeting mono-ADP-ribosyltransferase from Photorhabdus luminescens. J Biol Chem, 285, 13525–34. [DOI] [PMC free article] [PubMed] [Google Scholar]
- Wattam AR, Abraham D, Dalay O, Disz TL, Driscoll T, Gabbard JL, Gillespie JJ, Gough R, Hix D, Kenyon R, Machi D, Mao C, Nordberg EK, Olson R, Overbeek R, Pusch GD, Shukla M, Schulman J, Stevens RL, Sullivan DE, Vonstein V, Warren A, Will R, Wilson MJ, Yoo HS, Zhang C, Zhang Y & Sobral BW 2014. PATRIC, the bacterial bioinformatics database and analysis resource. Nucleic Acids Res, 42, D581–91. [DOI] [PMC free article] [PubMed] [Google Scholar]
- Wernick NL, Chinnapen DJ, Cho JA & Lencer WI 2010. Cholera toxin: an intracellular journey into the cytosol by way of the endoplasmic reticulum. Toxins (Basel), 2, 310–25. [DOI] [PMC free article] [PubMed] [Google Scholar]
Associated Data
This section collects any data citations, data availability statements, or supplementary materials included in this article.
Supplementary Materials
File S2: Proteomics Data, Related to Figure 4.
Video S1: Bxa binds to the membrane of epithelial cells, Related toFigure 4. Rapid binding of Bxa protein (red) to the cellular membranes of HT-29 cells, with nuclei labelled by Hoechst (blue) and cells labelled with a CellTracker dye (green). A dose of 200nM of Bxa was added to the cells, which were housed in an environmentally controlled chamber at 37°C, 5% CO2. Cells were imaged immediately at 4 frames per minute for a total of 15 min. Displayed are a total of 10 min from the video; 60x magnification.
Video S2: Bxa-treated epithelial cells have a disrupted actin cytoskeleton and cell shape, Related toFigure 4. Bxa-induced epithelial cell remodeling by actin cytoskeleton rearrangement, cell migration and rounding. HT-29 cells, with nuclei labelled by Hoechst (blue) and actin filaments labelled with an SiR stain (pink), were housed in an environmentally controlled chamber at 37°C, 5% CO2 and imaged immediately after Bxa treatment. Cells were imaged at 6 frames per hour for 8 hours. Displayed are a total of 8 hours from the video; 60x magnification.
Video S3: Epithelial actin cytoskeleton remodeling induced by Bxa treatment, Related toFigure 4. Bxa-induced epithelial cell remodeling by actin cytoskeleton rearrangement, cell migration and rounding. HT-29 cells, with nuclei labelled by Hoechst (blue) and actin filaments labelled with an SiR stain (pink), were housed in an environmentally controlled chamber at 37°C, 5% CO2 and imaged immediately after Bxa treatment. Cells were imaged at 6 frames per hour for 8 hours. Displayed are a total of 8 hours from the video; 60x magnification.
Video S4: Bxa internalization in epithelial cells, Related toFigure 4. Bxa-induced epithelial cell remodeling by actin cytoskeleton rearrangement, cell migration and rounding, as well as visualization of Bxa internalization (green). HT-29 cells, with nuclei labelled by Hoechst (blue) and actin filaments labelled with an SiR stain (pink), were housed in an environmentally controlled chamber at 37°C, 5% CO2 and imaged immediately after Bxa treatment. Cells were imaged at 2 frames per hour for 8 hours. Displayed are a total of 8 hours from the video; 60x magnification.
Data Availability Statement
All metabolomics data generated in this study are available at the NIH Common Fund’s Metabolomics Data Repository and Coordinating Center (supported by NIH grant, U01-DK097430); metabolomics workbench (http://www.metabolomicsworkbench.org) accession number PR001176). RNA-sequencing data can be found in SRA: PRJNA742399.
This paper does not report original code.
Any additional information required to reanalyze the data reported in this paper is available from the Lead Contact upon request.