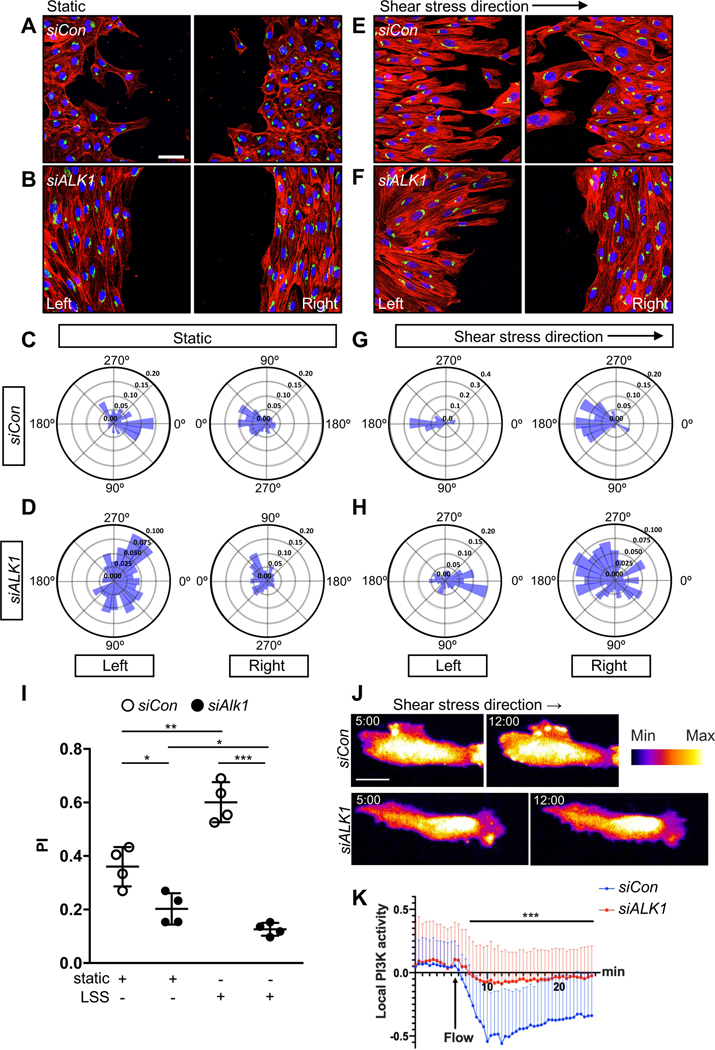
Figure 4. ALK1 controls EC polarization against the flow direction in vitro.
(A-B) Representative images of scratch wound assays after 18 h showing polarity angles of HUVECs transfected with Control (siCon) (A) or ALK1 (siALK1) (B) siRNAs under static conditions and immunolabeled with phalloidin(red), GM130 (green), and DAPI (blue). (E-F) Representative images of scratch wound assays showing polarity angles of siCon (E) or siALK1 (F) HUVECs with 18 h exposure to laminar shear stress (LSS) at 15 dynes/cm2. Left panels are upstream and right panels are downstream of flow. (C-D and G-H) Angular histograms showing polarization angles of siCon (C and G) or siALK1 ECs (D and H) at 18 h after scratch with (G-H) or without (C-D) LSS. Left is upstream and right is downstream of flow (G and H). (I) PI box plots of upstream (left) scratch areas from siCon or siALK1 transfected HUVECs at 18 h after with or without LSS. (C-I) n=6–8 images from 3 independent experiments. Error bars: SEM. *P-value < 0.05, **P-value < 0.01, ***P-value < 0.001, Two-way ANOVA with Sidak’s multiple comparison test. (J) Representative time lapse images of siCon or siALK1 HUVECs stably transduced with PH-AKT-mClover3 and plasma membrane targeting sequence of LCK-mRuby3. HUVEC monolayers in microfluidic chambers were exposed to 12 dynes/cm2 LSS under the microscope. 5 min (static) and 12 min (LSS) images were selected from the movies. The surface is color-coded by the value of PH-AKT intensity. (K) Local activation of PI3K was quantified by image analysis. PH-AKT intensity was normalized with average static intensity at each time point. 0 – 5 min : static and 5 – 24.5 min : LSS, n= 61, 41 cells from 3 independent experiments, Error bar : SEM. ***P-value < 0.001, Two-tailed unpaired t-test between siCon and siALK1 in average over the time. Scale bars : 50 μm (A-B and E-F), 20 μm (J).

