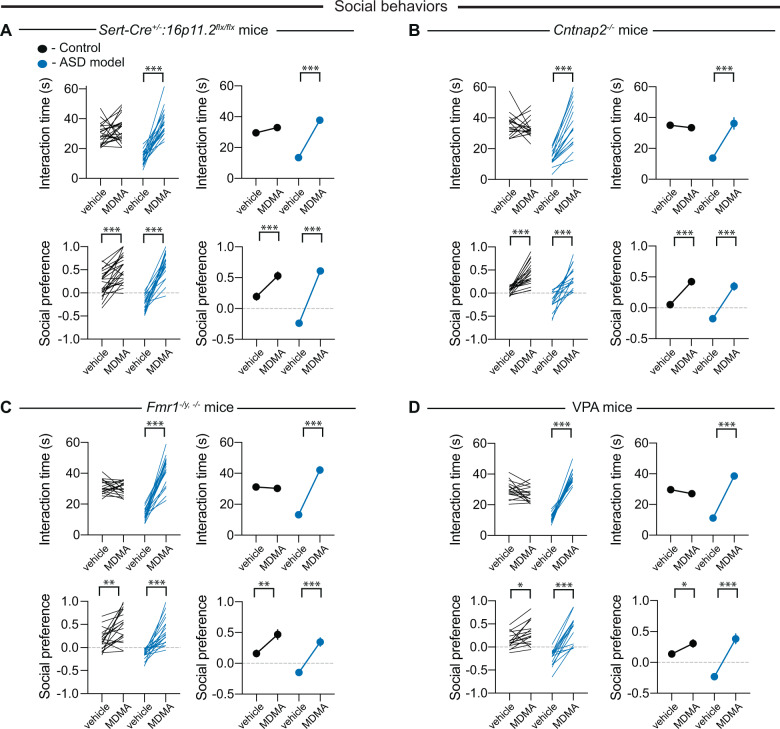
Fig. 2. Systemic administration of MDMA reverses social deficits in four mouse models for ASD.
A Quantification of juvenile interaction (F1,42 = 43.17, P < 0.001, n = 20–24) and three-chamber sociability (F1,42 = 28.06, P < 0.001, n = 20–24) in control or Sert-Cre+/–:16p11.2flx/flx mice with systemic administration of vehicle or MDMA. For all panels, juvenile interaction is on the top and three-chamber sociability is on the bottom with controls in black and ASD models in blue. Individual mice are represented as lines in the left panels and indicate an individual mouse that received vehicle and drug on separate days. If error bars are not clearly visible, they are smaller than the symbol used to represent the SEM. B Quantification of juvenile interaction (F1,33 = 45.46, P < 0.001, n = 16–19) and three-chamber sociability (F1,33 = 10.53, P < 0.001, n = 16–19) in control or Cntnap2−/− mice with systemic administration of vehicle or MDMA. C Quantification of juvenile interaction (F1,36 = 123.1, P < 0.001, n = 19) and three-chamber sociability (F1,36 = 12.34, P < 0.001, n = 19) in control or Fmr1–/y, −/− mice with systemic administration of vehicle or MDMA. D Quantification of juvenile interaction (F1,30 = 172.4, P < 0.001, n = 15–17) and three-chamber sociability (F1,30 = 24.84, P < 0.001, n = 15–17) in control or VPA mice with systemic administration of vehicle or MDMA. In this and all subsequent figures, the left panels illustrate individual subjects; right panels display mean ± SEM. *P < 0.05, ***P < 0.001; two-way ANOVA with Sidak’s multiple comparison post hoc test.

