Abstract
We describe a rapid and reproducible method for assessment of the hepatitis C virus (HCV) load in serum samples. The method combines Taqman technology (Roche) and the ABI Prism 7700 (Perkin Elmer) real-time sequence detection system. We have optimized a single-tube reverse transcription-PCR (RT-PCR) that contains a dual-labeled fluorogenic probe to quantify the 5′ noncoding region (5′ NCR) of HCV. The probe contains a fluorescent reporter at the 5′ end and a fluorescent quencher at the 3′ end. The use of such a probe combined with the 5′-3′ nuclease activity of Taq polymerase allows direct quantitation of the PCR product by the detection of a fluorescent reporter released in the course of the exponential phase of the PCR. For accurate quantitation of the number of copies of HCV in samples containing unknown quantities, we have used serial dilutions of a synthetic 5′ NCR RNA standard of HCV that was previously quantified with an isotopic tracer. The method has a 5-log dynamic range (103 to 107). The coefficient of regression of the standard curve was, on average, 0.98. The intra-assay and the interassay coefficients of variation of the threshold cycle were 1% and 6.2%, respectively. Seventy-nine RNA samples from the sera of infected patients were quantified by this method. Comparison of the results with those obtained by other quantitation methods (the Quantiplex 2.0 branched-DNA assay and the Superquant assay from the National Genetics Institute) revealed a significant correlation with all of the results. The mean values were also statistically comparable. In conclusion, the high sensitivity, simplicity, and reproducibility of the real-time HCV RNA quantitation which allows the screening of large numbers of samples, combined with its wide dynamic range, make this method especially suitable for monitoring of the viral load during therapy and tailoring of treatment schedules.
Hepatitis C virus (HCV) is a positive-stranded RNA virus that has been identified as the agent responsible for the vast majority of cases on transfusion-associated and community-acquired non-A, non-B hepatitis (8, 20). Although generally asymptomatic, about 85% of the infections become chronic. Persistent HCV infection may be associated with a wide spectrum of outcomes, from mild nonprogressive liver damage to severe chronic hepatitis that progresses to cirrhosis, end-stage liver disease, and hepatocellular carcinoma. Several studies have tried to elucidate the viral characteristics involved in the progression of the disease; the infecting genotype, the degree of viral diversity, and the viral load have all been suggested to correlate with disease activity, degree of liver damage, and response to alpha interferon treatment, but the results of different studies are confusing and controversial (3, 15, 19, 23, 25–28). Because it has been established that viral load is relatively stable in the chronic phase of the infection, of these parameters, viral load seems to be more useful for the tailoring of treatment schedules and the monitoring of HCV replication during therapy. The detection and quantitation of HCV RNA in serum requires highly specific and sensitive assays because HCV circulates in the blood at a low copy number and its genome is extremely heterogeneous (24), even though the virus titer covers a wide range (from undetectable values to more than 107 copies/ml). Many efforts have been made to precisely quantify the viral load in HCV-infected patients. To date, methods involve amplification procedures either based on branched-DNA (bDNA) methodology, in which a signal previously hybridized with the template sequence is amplified (1, 33), or based on reverse transcription-PCR (RT-PCR) methods, which directly amplify viral genome sequences (10, 12, 13, 31, 34, 35). Quantitative PCR methods, either competitive or noncompetitive, measure viral load as the amount of amplified product at the end of the reaction. Results are subject, as a consequence, to the errors caused by the plateauing effect that occurs when the reagents are used up (29). Moreover, because target amplification by PCR is exponential in nature, a very small change in the amplification efficiency can produce dramatic differences in the amount of final product. To avoid these problems, quantitative PCR assays should be designed so that product quantity is analyzed during the logarithmic phase of the reaction, before the plateau, and should ideally include internal controls that coamplify with the same efficiency as the target molecule (9, 11). These requirements imply time-consuming post-PCR manipulations that can lead to PCR product carryover contamination, laboratory contamination, high costs for infrastructure, and, therefore, limitations in the screening of large number of samples.
Here we describe a rapid and reproducible method that allows the quantitation of HCV RNA copies in serum samples by using the ABI Prism 7700 real-time sequence detection system (14, 16, 21). We have optimized a single-tube RT-PCR to quantify the 5′ noncoding region (5′ NCR) of HCV that contains a dual-labeled fluorogenic probe (2, 22). The use of such a probe combined with the 5′-3′ nuclease activity of Taq polymerase allows direct detection of the PCR product by detection of a fluorescent reporter released in the course of the PCR. HCV RNA quantitation by our real-time RT-PCR protocol determines the initial copy number in samples with unknown quantities by comparing the results for the samples to those on a curve generated from a standard with a previously known starting quantity.
MATERIALS AND METHODS
Clinical specimens.
Blood samples were obtained from 79 anti-HCV-positive patients (Table 1). Seventy-four patients were HCV RNA positive by a commercial quantitative HCV RNA test with a detection limit of 102 copies/ml (Amplicor HCV-RNA; Roche Molecular Systems) and five were negative. Twenty-seven patients had persistently normal alanine aminotransferase values. All blood samples were drawn into VACUTAINER tubes with no additives (especially, no heparin) (Becton & Dickinson, Meylan, France) containing a silicone separator and centrifuged within 2 h of collection to avoid any sign of hemolysis, and the serum was aliquoted and kept at −80°C until further testing. Viral RNA was extracted from 140 μl of each serum sample by the QIAamp viral RNA purification protocol (Qiagen) and was dissolved in 50 μl of RNase-free water. RNAs were stored at −80°C until use. All samples were genotyped by the Inno-Lipa HCV II test (Innogenetics, Zwijnaarde, Belgium) according to the manufacturer’s protocol (Table 1). The branched-DNA (bDNA) assay was performed as recommended by the manufacturer (Quantiplex; Chiron Corp., Emeryville, Calif.). The design and principles of the bDNA assay are as follows. In brief, HCV RNA is captured by a set of specific, synthetic oligonucleotide target probes. A second set of target probes hybridizes to the viral RNA and bDNA amplifiers. Multiple copies of an alkaline phosphatase-conjugated probe are then hybridized to this immobilized complex to amplify the signal. Detection is achieved by incubating the complex with a chemoluminescent substrate (33). Samples were also tested by a quantitative RT-PCR technique (Superquant assay) developed by the National Genetics Institute (NGI) (Culver City, Calif.), as described elsewhere (30). In brief, the extracted RNA is converted into cDNA and is used as a template for four separate PCR amplifications, each of which is stopped after a different number of cycles to avoid plateauing effects. A digoxigenin-labeled probe is used to find the target DNA by agarose gel electrophoresis. The DNA fragments are then vacuum transferred to Southern blots and are immunostained. Standard curves are constructed from DNA fragments with known copy numbers.
TABLE 1.
Demographic and clinical features of patients
| Feature | Value |
|---|---|
| Total no. of patients | 79 |
| Mean age (yr) | 42 ± 14 |
| Sex | |
| No. of males | 46 |
| No. of females | 33 |
| Percutaneous risk factor (no. [%] of patients | |
| Transfusion | 20 (25) |
| IVDAa | 14 (18) |
| Unknown | 45 (57) |
| Estimated mean duration of infection (yr) | 17 ± 8 |
| HCV viremia (no. of patients) | |
| Positive | 74 |
| Negative | 5 |
| HCV genotype (no. [%] of patients) | |
| Type 1 | 34 (43) |
| Type 2 | 15 (19) |
| Type 3 | 11 (14) |
| Type 4 | 19 (24) |
| Degree of liver damage (no. [%] of patients) | |
| Mild | 8 (10) |
| Moderate | 45 (57) |
| Severe | 24 (30) |
| Unknown | 2 (3) |
IVDA, intravenous drug abuser.
Real-time quantitative RT-PCR.
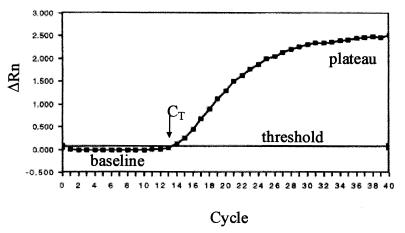
A single-tube RT-PCR was optimized for the quantitation of the 5′ NCR of HCV by using the Taqman technology (Roche Molecular Diagnostics Systems), which exploits the 5′-3′ nucleolytic activity of AmpliTaq DNA polymerase first described by Holland et al. (17). Briefly, the method uses a dual-labeled fluorogenic hybridization probe that specifically anneals the template between the PCR primers. The probe contains a fluorescent reporter (6-carboxyfluorescein [FAM]) at the 5′ end and a fluorescent quencher (6-carboxytetramethylrhodamine [TAMRA]) at the 3′ end. When the probe is intact the emission spectrum of the reporter is suppressed by the quencher. The nuclease degradation of the hybridization probe releases the reporter, resulting in an increase in fluorescence emission. The use of a sequence detector (ABI Prism 7700) allows measurement of the amplified product in direct proportion to the increase in fluorescence emission continuously during the PCR amplification. The amplification plot is examined early in the reaction (Fig. 1), at a point that represents the logarithmic phase of product accumulation. The point representing the detection threshold of the increase in the fluorescent signal associated with the exponential growth of the PCR product for the sequence detector is defined as the cycle threshold (CT). CT values are predictive of the quantity of input target (16); that is, when the conditions of the PCR are the same, the larger the starting concentration of a template, the lower the CT.
FIG. 1.
Typical amplification plot. The graph of the increment of fluorescence reporter signal (ΔRn) versus cycle number during PCR shows three stages: baseline, exponential phase, and plateau. The CT value is calculated by determining the point at which the fluorescence exceeds an arbitrary threshold limit (usually 10 times the standard deviation of the baseline).
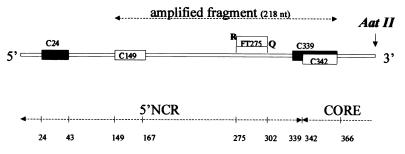
The reaction mixture for RT-PCR was prepared in a single tube as follows: 1× buffer A (50 mM KCl, 10 mM Tris-HCl, 0.01 mM EDTA, 60 nM Passive Reference 1 [pH 8.3]), 5 mM MgCl2, 20 pmol of primer C-149, 20 pmol of primer C-342, each deoxynucleoside triphosphate (Boehringer) at a concentration of 0.3 mM, 0.4 U of RNase inhibitor per μl, 0.4 U of Moloney murine leukemia virus reverse transcriptase per μl, and 0.025 U of Taq Gold Polymerase per μl (the enzymes and the buffer containing passive reference were from Perkin Elmer). Fluorogenic probe [FT-275 5′-(FAM)CACCCTATCAGGCAGTACCACAAGGCC(TAMRA)-3′] was added to the PCR mixture to a final concentration of 150 nM. Forty microliters of the reaction mixture was added to the PCR tubes containing 10 μl of RNA from serum or RNA from a diluted standard that had previously been denatured at 90°C for 90 s. HCV RNA was reverse transcribed into cDNA (30 min at 42°C) and amplified by PCR in a single tube for 40 cycles (15 s at 94°C and 1 min at 60°C) with specific oligonucleotides (C-149 [sense primer], 5′-TGCGGAACCGGTGAGTACA-3′ and C-342 [antisense primer], 5′-CTTAAGGTTTAGGATTCGTGCTCAT-3′) (Fig. 2). We used the program PrimerExpress (Perkin-Elmer) to design the primers and probes, following the guidelines for the best performance of the PCR. From among all the possibilities, we have selected the set that fits with the consensus sequences of published HCV 5′ NCR and core sequences (6, 32).
FIG. 2.
Schematic representation of the transcription fragment from the 5′ NCR of HCV. Oligonucleotide primers C149 and C342 were used for amplification by RT-PCR. Primers C24 and C339 were hybridized to the RNA transcript to assess its integrity. FT275 is the dual-labeled probe. R, reporter; Q, quencher; nt, nucleotides.
Precautions were undertaken to minimize the risk of PCR contamination: two separate rooms, one for HCV RNA extraction and PCR mixture setup and the other for the PCR, were used. Moreover, the amplified product was never reused, and the tube containing it was never opened and was immediately thrown away.
Synthesis and quantitation of a standard RNA.
Absolute precision in the quantification of HCV RNA in samples containing unknown quantities relies definitely on the accuracy with which the amount of HCV RNA standard has been measured. An RNA standard representing the 5′ NCR of HCV was synthesized in vitro, and the purified transcript was quantitated by isotopic tracing (18). This is a reliable method and has been used to quantify the primary reference standard, but because labeled RNA is unstable over time, we have used the hot standard as a reference to quantify a second stable (nonisotopically labeled) reference standard that can be remade periodically as needed. Four micrograms of a plasmid containing the first half of the HCV genome (genotype 1b) was linearized with AatII, and two in vitro transcriptions, one with [α-32P]GTP and the other with no isotopic label, were carried out in parallel. The RNA transcripts were subjected to three successive steps of purification: DNase I degradation, phenol extraction, and CF11 cellulose chromatography to eliminate DNA and the unincorporated nucleotides, followed by polyacrylamide gel electrophoresis to separate the complete RNA transcript from the unfinished transcription fragments and other minor forms. Both labeled and unlabeled RNAs were run in parallel, and bands were eluted from the acrylamide gel. All reactions were done in siliconized-glass tubes with tRNA as a carrier. The amount of isotopically labeled RNA transcript was measured in a scintillation counter, and the amount of RNA synthesized was calculated from the known incorporation percentage, as follows: N × counts per minute incorporated/total counts per minute, where N is the quantity of deoxynucleoside triphosphates (in micrograms) included in the reaction mixture. The following assumptions are made in the calculation: the synthesized RNA contains equimolar amounts of all four ribonucleotides, the average molecular weight of a nucleotide is 325, and the contribution of [α-32P]GTP is negligible. Although the amounts of all four ribonucleotides are not the same, the molecular weight of the RNA synthesized was only 0.2% lower than the estimated molecular weight. Serial dilutions (107 to 103) of the labeled RNA transcript were used as standards to quantify by our RT-PCR protocol the HCV RNA in two dilutions containing unknown quantities of the nonlabeled transcript.
The integrity of the synthesized transcripts, both labeled and nonlabeled, was verified by migration by gel electrophoresis. Two oligonucleotides (C24 [5′-GGGAGTGATCTATGGTGGAG-3′] and C339 [5′-GAGGATCCGGTTTAGGATTCGTGCTCATGGT-3′]) that are known to hybridize efficiently and specifically with the flanking regions of the amplified fragment (23) were labeled at the 5′ end with [γ-32]ATP and were used to analyze the unlabeled RNA transcript. After the annealing reactions, hybrids were subsequently electrophoresed under nondenaturing gel conditions in parallel with an aliquot of the labeled transcript.
Statistical analysis.
The standard curve was created automatically by the ABI Prism 7700 detection system by plotting the CT against each standard dilution of known concentration. The coefficient of linear regression (R) for each standard curve was calculated. The intra-assay and interassay coefficients of variation (CVs) of the technique were calculated for the CT of each standard within runs and between runs, respectively. The CV was obtained by dividing the standard deviation of each standard CT by its mean and dividing that result by 100.
Quantitation results obtained by real-time RT-PCR, the bDNA assay, and the NGI assay were expressed as log10 HCV RNA copies per milliliter of serum. To compare the results obtained by these methods, the Kolmogorov-Smirnov normality test, Spearman’s correlation, and the Mann-Whitney test for comparison of means were performed. Significant differences were considered when the P value was <0.05.
RESULTS
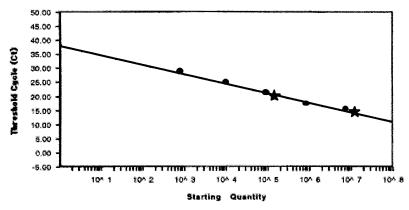
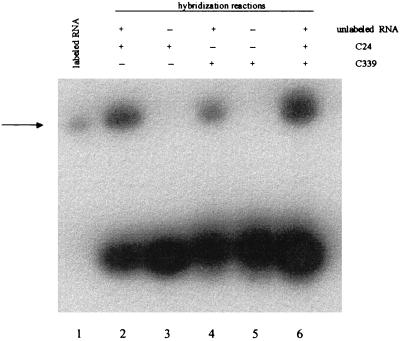
The concentration of HCV RNA in the first reference standard was calculated from its specific activity measured on a scintillation counter. The number of RNA molecules synthesized was 109 copies per μl. Then, real-time RT-PCR amplifications were performed with 1:10 serial dilutions (from 107 to 103 copies of RNA per reaction mixture). Two dilutions of the nonlabeled HCV RNA (unknown quantity) were also amplified in parallel reactions. Figure 3 presents the CT values plotted versus the sample dilution values to produce a standard curve. With the knowledge of the CT values for the samples containing unknown quantities of HCV RNA, the standard curve is then used to interpolate the starting RNA concentration. As expected, the number of nonlabeled RNA molecules that were synthesized was very similar to the number of labeled RNA molecules that were synthesized, that is, 1.5 × 10⁹ copies per μl. In order to prove that this nonlabeled HCV RNA had the correct size and showed no degradation, it was hybridized with two labeled oligonucleotides (C24 and C339 in Fig. 2) corresponding to the flanking regions of the amplified fragment. Autoradiography (Fig. 4) shows a unique band of the same size obtained by hybridization with one oligonucleotide, the other oligonucleotide, and both oligonucleotides, and the sizes of the bands coincide with the size of the first labeled HCV RNA. Moreover, no intermediate bands of degradation products were detected. Finally, serial 10-fold dilutions of this RNA (from 103 to 107 copies of RNA per reaction mixture) were used to generate a standard curve to quantify the RNA from serum samples from HCV-infected patients. The standard curve that was generated spans 5 logs; it shows linearity over the entire quantitation range and provides accurate measurements over a very large range of starting target quantities. No differences in the quantitation results were obtained for diluted standard RNA that was added to and then extracted from a non-HCV-infected serum sample.
FIG. 3.
Standard curve of the input RNA concentration in serial dilutions of the first reference standard versus CT. Each dot represents the result of triplicate PCR amplifications for each dilution. The stars represent the results of PCR amplification of samples containing unknown quantities of HCV RNA tested by this method. R was equal to 0.999, and the slope was −3.429.
FIG. 4.
Assay of the quality of the RNA transcripts. Unlabeled RNA transcript was preheated at 90°C for 1 min, immediately mixed with oligonucleotides C24 (lane 2), C339 (lane 4), and both C24 and C339 (lane 6), and slowly cooled to room temperature. Reactions were conducted in reaction buffer (20 mM HEPES [pH 8], 50 mM KCl, 10 mM MgCl2, 1 mM dithiothreitol) with 0.6 nM unlabeled transcript and 20 nM oligonucleotide. The reaction mixtures in lanes 3 and 5 were identical to those described above, but they lacked the RNA substrate. The arrow indicates a single band corresponding to the labeled RNA transcript (lane 1). Note that the bands in lanes 2, 4, and 6 are slightly higher than the band in lane 1, resulting from the increment in the size due to the hybridized oligonucleotides. Unincorporated oligonucleotides appear at the bottom of the gel in lanes 2 to 6.
The reproducibility of the method was established with the CT values obtained for each dilution (103 to 107) of the standard curve in different assays and within an assay: the intra-assay and interassay CVs of the threshold cycle were 1 and 6.2%, respectively, on average. The average between-run correlation coefficient of the standard curve was 0.98.
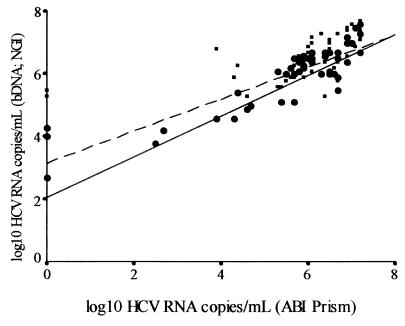
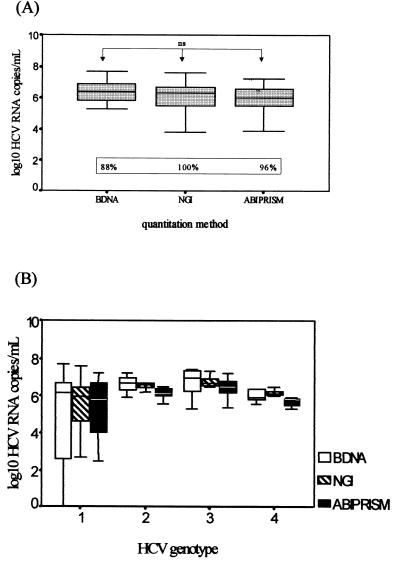
The RT-PCR protocol was then applied to RNA extracted from serum samples from 79 HCV-positive patients. The HCV RNA titer ranged between 3.3 × 10² and 4 × 10⁷ copies/ml when the results were compared to those for our HCV RNA standard. We then compared our results with those obtained by the currently used HCV quantification methods, the bDNA and NGI assays. The correlations were statistically significant (Fig. 5). The best correlation index was that shown with the ABI Prism 7700 and NGI assays; not only in terms of total numbers of patients but also in terms of groups of different genotypes (P < 0.001 for genotypes 1 and 3 and P < 0.05 for genotypes 2 and 4) (Table 2). When the results obtained for groups of different genotypes are compared between the ABI Prism 7700 and bDNA assays, there was a significant correlation between genotypes 1 and 3 (P < 0.001 and P < 0.05, respectively), but the correlation disappeared between genotypes 2 and 4 (Table 2). The mean values of the results obtained with the ABI Prism 7700, Quantiplex, and NGI Superquant assays were statistically comparable; differences in log10 HCV RNA quantitation in terms of both total numbers of patients and groups of different genotypes were not significant (Fig. 6A and B).
FIG. 5.
Spearman’s correlation plot between quantitation results determined by our RT-PCR protocol (ABI Prism 7700 assay) and both the bDNA assay (solid line and squares) and the NGI method (dashed line and dots) (P < 0.001). There is only no correlation between the ABI Prism 7700 assay and the bDNA assay and between the ABI Prism 7700 assay and the NGI method for two and three samples, respectively, all of which contained genotype 1 virus.
TABLE 2.
Correlation coefficients for viral loads obtained with the ABI Prism 7700, NGI, and bDNA quantitation methods according to infecting genotype
| Methods compared |
R value
|
||||
|---|---|---|---|---|---|
| Totals | Type 1 | Type 2 | Type 3 | Type 4 | |
| ABI Prism 7700-NGI | 0.8189a | 0.9112a | 0.7413b | 0.9910a | 0.7615b |
| ABI Prism 7700-bDNA | 0.7250a | 0.7143a | 0.5789 | 0.8829b | 0.7336 |
P < 0.001.
P < 0.05.
FIG. 6.
Mean values of results (expressed as log10 HCV RNA copies per milliliter of serum) determined by our RT-PCR protocol (ABI Prism 7700 assay), the bDNA assay and the NGI method are comparable. (A) Comparison of totals; differences in mean values are not significant (ns). The percentages of samples positive by each method are given in the box. (B) Comparison of mean values for groups of different genotypes; differences are not significant.
DISCUSSION
Most commercial or in-house HCV RNA quantitation methods based on PCR measure the amount of amplified product at the end of the reaction. At any given cycle within the exponential phase of PCR, the amount of product is proportional to the initial number of template copies. However, this correlation tends to be lost as the rate of amplification approaches a plateau. In contrast, the real-time RT-PCR protocol proposed in this study for the quantification of HCV RNA from serum samples provides accurate knowledge of the increment of the amplification product in every cycle through the increment of released fluorescence. Analysis is performed in real time during the exponential phase. This allows many samples to be analyzed simultaneously and eliminates the need to be concerned that a reaction plateau will be reached at different cycles.
Methods for HCV RNA quantitation must be specific, sensitive, reproducible, and accurate, and the analysis of large numbers of samples requires a rapid and manageable protocol that minimizes as much as possible post-PCR manipulations.
The analytical sensitivity of our method, i.e., the smallest amount of HCV RNA tested and reliably quantified, is 1,000 copies/reaction mixture. In practice, however, we have detected up to 3.3 × 10² copies/ml, because the linearity of our standard curve permits us to interpolate values located below the lower limit of the dynamic range (1 × 10³ copies/ml). On the other hand, the system can quantify the HCV RNA in samples with more than 107 copies/reaction mixture. This degree of sensitivity along with a considerably wide dynamic range allows the use of a single method for the detection of the wide range of loads found with HCV.
As far as specificity is concerned, the fluorescence signal due to the cleavage of the Taqman fluorogenic probe is generated only if the target sequence for the probe is amplified by the PCR. Therefore, no signal is generated by nonspecific amplification. On the other hand, the virtual absence of post-PCR manipulation prevents the carryover of amplification products that were synthesized during previous PCRs.
The real-time RT-PCR method for the quantification of HCV RNA was highly reproducible. Triplicate amplifications for each standard dilution were performed in each assay and were used to calculate the intra-assay CV of CT. Also, fluorescent CT values obtained on the different days on which the assays were performed were used to calculate the CV interassay CV. Both CVs were especially low, 1% for the intra-assay CV and 6.2% for the interassay CV. The use of an argon laser as a light source that excites the fluorogenic dyes that act as direct indicators of the amplification introduces minimal variation into the quantitative PCR analysis and contributes to the low degree of variability observed in the results.
The accuracy of the method is supported by comparison of the results with those obtained with an HCV RNA standard previously quantified by isotopic tracing, which is absolute and which is based on physical properties. Nevertheless, we cannot underestimate the variability within serum samples and the RNA standard with regard to the efficiency of amplification. To date, our system does not allow the simultaneous detection of distinguishable reporter dyes that could be used as internal controls that coamplify with our target sequence. Use of such internal controls could allow us to overcome the problem of sample impurities that affect the efficiency of PCR. In contrast, an advantage of our detection system is that the amplification plot is examined early in the reaction (CT). In this sense, we avoid discrepancies due to inhibition late in the cycle.
Comparison of the results obtained by the ABI PRISM 7700 RT-PCR protocol with those obtained by other commercially available techniques (the bDNA and NGI assays) showed a good correlation, although the RT-PCR protocol tended to underestimate the viral load in samples from patients infected with genotypes 2 and 4 by a mean of only 0.2 logs (Table 2). Mutation within the 5′ NCR may affect the secondary and tertiary structures of the RNA and thus the stability and the accessibility of the 3′ primers to the HCV RNA. In fact, internal ribosome entry site activities have been shown to be different among distinct genotypes in vitro and in cell culture (7). Also, differences between the length of the viral RNA compared with that of the standard transcript may be important because long-distance tertiary interactions have been described in other RNAs (4, 5).
Our method has several advantages over the other methods: its dynamic range is much wider than that of Quantiplex 2.0 and it is much less cumbersome than Superquant. The costs associated with the use of this system are the cost of the PCR plus the cost of the Taqman probes, but the high throughput of the system compensates for these costs and allows processing of multiple samples with minimal labor time and without a risk of carryover contamination due to post-PCR sample manipulation. The ABI Prism 7700 quantitation methodology is used in our laboratory to follow the kinetics of the decrease in viral load in patients treated with alpha interferon, as well as in comparative studies of viral load in serial samples from serum and liver.
ACKNOWLEDGMENTS
We acknowledge Cristina Escarmis (Centro de Biología Molecular, CSIC, Madrid, Spain) for valuable and helpful technical advice.
This investigation was supported in part by grant SAF 97-0148 from the Comisión Interministerial de Ciencias y Tecnología (CICYT), by grant 97/2039 from the Fondo de Investigación Sanitaria (FIS), and by the Comisión de Investigación y Docencia of the Hospital Vall D’Hebrón.
REFERENCES
- 1.Alter H J, Sanchez-Pescador R, Urdea M S, Wilber J C, Lagier R J, Di Bisceglie A M, Shih J W, Neuwald P D. Evaluation of branched DNA signal amplification for the detection of hepatitis C virus RNA. J Viral Hepat. 1995;2:121–132. doi: 10.1111/j.1365-2893.1995.tb00017.x. [DOI] [PubMed] [Google Scholar]
- 2.Bassler H A, Flood S J, Livak K J, Marmaro J, Knorr R, Batt C A. Use of a fluorogenic probe in a PCR-based assay for the detection of Listeria monocytogenes. Appl Environ Microbiol. 1995;61:724–728. doi: 10.1128/aem.61.10.3724-3728.1995. [DOI] [PMC free article] [PubMed] [Google Scholar]
- 3.Benvegnu L, Pontisso P, Cavalletto D, Noventa F, Chemello L, Alberti A. Lack of correlation between hepatitis C virus genotypes and clinical course of hepatitis C virus-related cirrhosis. Hepatology. 1997;25:211–215. doi: 10.1053/jhep.1997.v25.pm0008985292. [DOI] [PubMed] [Google Scholar]
- 4.Branch A D, Benenfeld B J, Robertson H D. Ultraviolet light- induced crosslink reveals a unique region of local tertiary structure in potato spindle tuber viroid and HeLa 5S RNA. Proc Natl Acad Sci USA. 1985;82:6590–6594. doi: 10.1073/pnas.82.19.6590. [DOI] [PMC free article] [PubMed] [Google Scholar]
- 5.Branch A D, Benenfeld B J, Baroudy B M, Wells F V, Guerin J L, Robertson H D. An untraviolet-sensitive RNA structural element in viroid-like domain of hepatitis delta virus. Science. 1989;243:649–652. doi: 10.1126/science.2492676. [DOI] [PubMed] [Google Scholar]
- 6.Bukh J, Purcell R H, Miller R H. Sequence analysis of the core gene of 14 hepatitis C virus genotypes. Proc Natl Acad Sci USA. 1994;91:8239–8243. doi: 10.1073/pnas.91.17.8239. [DOI] [PMC free article] [PubMed] [Google Scholar]
- 7.Buratti E, Gerotto M, Pontisso P, Alberti A, Tisminetzky S G, Baralle F E. In vivo translational efficiency of different hepatitis C virus 5′-UTRs. FEBS Lett. 1977;411:275–280. doi: 10.1016/s0014-5793(97)00715-1. [DOI] [PubMed] [Google Scholar]
- 8.Choo Q L, Kuo G, Weiner A J, Overby L R, Bradley D W, Houghton M. Isolation of a cDNA clone derived from a blood-borne non-A, non-B viral hepatitis genome. Science. 1989;244:359–362. doi: 10.1126/science.2523562. [DOI] [PubMed] [Google Scholar]
- 9.Clementi M, Menzo S, Bagnarelli P, Manzin A, Valenza A, Varaldo P E. Quantitative PCR and RT-PCR in virology. PCR Methods Appl. 1993;2:191–196. doi: 10.1101/gr.2.3.191. [DOI] [PubMed] [Google Scholar]
- 10.Farci P, Alter H J, Wong D, Miller R H, Shih J W, Jett B, Purcell R H. A long-term study of hepatitis C virus replication in non-A, non-B hepatitis. N Engl J Med. 1991;325:98–104. doi: 10.1056/NEJM199107113250205. [DOI] [PubMed] [Google Scholar]
- 11.Ferre F. Quantitative or semi-quantitative PCR: reality versus myth. PCR Methods Appl. 1992;2:1–9. doi: 10.1101/gr.2.1.1. [DOI] [PubMed] [Google Scholar]
- 12.Fong T L, Shindo M, Feinstone S M, Hoofnagle J H, Di Bisceglie A M. Detection of replicative intermediates of hepatitis C viral RNA in liver and serum of patients with chronic hepatitis C. J Clin Invest. 1991;88:1058–1060. doi: 10.1172/JCI115368. [DOI] [PMC free article] [PubMed] [Google Scholar]
- 13.Garson J A, Tuke P W, Makris M, Briggs M, Machin S J, Preston F E, Tedder R S. Demonstration of viraemia patterns in haemophiliacs treated with hepatitis-C-virus-contaminated factor VIII concentrates. Lancet. 1990;336:1022–1025. doi: 10.1016/0140-6736(90)92487-3. [DOI] [PubMed] [Google Scholar]
- 14.Gelfand, D. H., P. M. Holland, R. K. Saiki, and R. M. Watson. 1993. U.S. patent 5210015.
- 15.Gretch D, Corey L, Wilson J, dela Rosa C, Willson R, Carithers R, Jr, Busch M, Hart J, Sayers M, Han J. Assessment of hepatitis C virus RNA levels by quantitative competitive RNA polymerase chain reaction: high-titer viremia correlates with advanced stage of disease. J Infect Dis. 1994;169:1219–1225. doi: 10.1093/infdis/169.6.1219. [DOI] [PubMed] [Google Scholar]
- 16.Heid C, Stevens J, Livak K, Williams P M. Real time quantitative PCR. Genome Res. 1996;6:986–994. doi: 10.1101/gr.6.10.986. [DOI] [PubMed] [Google Scholar]
- 17.Holland P M, Abramson R D, Watson R, Gelfand D H. Detection of specific polymerase chain reaction product by utilizing the 5′—3′ exonuclease activity of Thermus aquaticus DNA polymerase. Proc Natl Acad Sci USA. 1991;88:7276–7280. doi: 10.1073/pnas.88.16.7276. [DOI] [PMC free article] [PubMed] [Google Scholar]
- 18.Kinloch R A, Roller R J, Wassarman P M. Quantitative analysis of specific messenger RNAs by ribonuclease protection. Methods Enzymol. 1993;225:294–303. doi: 10.1016/0076-6879(93)25020-3. [DOI] [PubMed] [Google Scholar]
- 19.Koizumi K, Enomoto N, Kurosaki M, Murakami T, Izumi N, Marumo F, Sato C. Diversity of quasispecies in various disease stages of chronic hepatitis C virus infection and its significance in interferon treatment. Hepatology. 1995;22:30–35. [PubMed] [Google Scholar]
- 20.Kuo G, Choo Q L, Alter H J, Glitnick G L, Redekerm A G, Purcell R H, Miyamura T, Dienstag J L, Alter M J, Stevens C E, Tegtmeier G E, Bonino F, Colombo M, Lee W S, Kuo C, Berger K, Shuster J R, Overby L R, Bradley D W, Houghton M. An assay for circulating antibodies to a major etiologic agent of human non-A, non-B hepatitis. Science. 1989;244:362–364. doi: 10.1126/science.2496467. [DOI] [PubMed] [Google Scholar]
- 21.Lawyer F C, Stoffel S, Saiki R K, Chang S Y, Landre P A, Abramson R D, Gelfand D H. High-level expression, purification, and enzymatic characterization of full-length Thermus aquaticus DNA polymerase and a truncated form deficient in 5′ to 3′ exonuclease activity. PCR Methods Appl. 1993;2:275–287. doi: 10.1101/gr.2.4.275. [DOI] [PubMed] [Google Scholar]
- 22.Livak K J, Flood S J, Marmaro J, Giusti W, Deetz K. Oligonucleotides with fluorescent dyes at opposite ends provide a quenched probe system useful for detecting PCR product and nucleic acid hybridization. PCR Methods Appl. 1995;4:357–362. doi: 10.1101/gr.4.6.357. [DOI] [PubMed] [Google Scholar]
- 23.Lyons, A. J., J. R. Lytle, J. Gomez, and H. D. Robertson. Unpublished data.
- 24.Martell M, Esteban J I, Quer J, Genesca J, Weiner A, Esteban R, Guardia J, Gomez J. Hepatitis C virus (HCV) circulates as a population of different but closely related genomes: quasispecies nature of HCV genome distribution. J Virol. 1992;66:3225–3229. doi: 10.1128/jvi.66.5.3225-3229.1992. [DOI] [PMC free article] [PubMed] [Google Scholar]
- 25.Martinot-Peignoux M, Marcellin P, Pouteau M, Castelnau C, Boyer N, Poliquin M, Degott C, Descombes I, Le Breton V, Milotova V, Benhamou J P, Erlinger S. Pretreatment serum hepatitis C virus RNA levels and hepatitis C virus genotype are the main and independent prognostic factors of sustained response to interferon alfa therapy in chronic hepatitis C. Hepatology. 1995;22:1050–1056. [PubMed] [Google Scholar]
- 26.McHutchinson J G, Sedghi-Vaziri A, Russell J, Schmid P, Conrad A. Is there an optimal time to measure quantitative HCV RNA to predict outcome following interferon treatment for chronic HCV infection? Hepatology. 1996;24:356A. doi: 10.1016/s0168-8278(98)80052-4. . (Abstract.) [DOI] [PubMed] [Google Scholar]
- 27.Naito M, Hayashi N, Moribe T, Hagiwara H, Mita E, Kanazawa Y, Kasahara A, Fusamoto H, Kamada T. Hepatitis C viral quasispecies in hepatitis C virus carriers with normal liver enzymes and patients with type C chronic liver disease. Hepatology. 1995;22:407–412. [PubMed] [Google Scholar]
- 28.Pawlotsky J M, Roudot-Thoraval F, Bastie A, Darthuy F, Remire J, Metreau J M, Zafrani E S, Duval J, Dhumeaux D. Factors affecting treatment responses to interferon-alpha in chronic hepatitis C. J Infect Dis. 1996;174:1–7. doi: 10.1093/infdis/174.1.1. [DOI] [PubMed] [Google Scholar]
- 29.Raeymaekers L. Quantitative PCR: theoretical considerations with practical implications. Anal Biochem. 1993;214:582–585. doi: 10.1006/abio.1993.1542. [DOI] [PubMed] [Google Scholar]
- 30.Reichard O, Norkrans G, Fryden A, Braconier J H, Sönnerborg A, Weiland O. Randomised, double-blind, placebo-controlled trial of interferon α-2b with and without ribavirin for chronic hepatitis C. Lancet. 1998;351:83–87. doi: 10.1016/s0140-6736(97)06088-1. [DOI] [PubMed] [Google Scholar]
- 31.Simmonds P, Zhang L Q, Watson H G, Rebus S, Ferguson E D, Balfe P, Leadbetter G H, Yap P L, Peutherer J F, Ludlam C A. Hepatitis C quantification and sequencing in blood products, haemophiliacs, and drug users. Lancet. 1990;336:1469–1472. doi: 10.1016/0140-6736(90)93179-s. [DOI] [PubMed] [Google Scholar]
- 32.Smith D B, Mellor J, Jarvis L M, Davidson F, Kolberg J, Urdea M, Yap P-L, Simmonds P The International HCV Collaborative Study Group. Variation of the hepatitis C virus 5′ non-coding region: implications for secondary structure, virus detection and typing. J Gen Virol. 1995;76:1749–1761. doi: 10.1099/0022-1317-76-7-1749. [DOI] [PubMed] [Google Scholar]
- 33.Urdea M S, Horn T, Fultz T J, Anderson M, Running J A, Hamren S, Ahle D, Chang C A. Branched DNA amplification multimers for the sensitive, direct detection of human hepatitis viruses. Nucleic Acids Symp Ser. 1991;24:197–200. [PubMed] [Google Scholar]
- 34.Weiner A J, Kuo G, Bradley D W, Bonino F, Saracco F, Lee C, Rosenblatt J, Choo Q L, Houghton M. Detection of hepatitis C viral sequences in non-A, non-B hepatitis. Lancet. 1990;355:1–3. doi: 10.1016/0140-6736(90)90134-q. [DOI] [PubMed] [Google Scholar]
- 35.Young K K, Archer J J, Yokosuka O, Omata M, Resnick R M. Detection of hepatitis C virus RNA by a combined reverse transcription PCR assay: comparison with nested amplification and antibody testing. J Clin Microbiol. 1995;33:654–657. doi: 10.1128/jcm.33.3.654-657.1995. [DOI] [PMC free article] [PubMed] [Google Scholar]


