

Graphical abstract

Keywords: Cocos nucifera, Response surface optimization, Polyphenol oxidase (PPO), Extraction process
Highlights
-
•
The water-acetone system had obvious advantages in extracting phenolic substances.
-
•
The TFC and TPC of CM was significantly higher than that of CE.
-
•
Ultrasound-Homogenization-Assisted Extraction was more conducive to phenolic release.
-
•
PPO activity increases with the extension of homogenization time.
Abstract
Coconut pericarp (shell fiber (mesocarp) and shell (endocarp)), the main by-product of coconut production, is often discarded and causing serious environmental pollution. To make better use of coconut pericarp, the extraction process of polyphenols from coconut mesocarp (CM) carefully studied by screening seven solvent systems, optimizing the assisted ultrasonic process by response surface methodology, and comparing the four processes of Ultrasound-Assisted Extraction (UAE), Homogenization-Assisted Extraction (HAE), Homogenization-Ultrasound-Assisted Extraction (HUAE), and Ultrasound-Homogenization-Assisted Extraction (UHAE). The UAE and HAE are considered to be the main methods for efficient extraction of natural active ingredients. The former effectively destroys the cell wall structure and promotes the intermolecular diffusion based on the cavitation, thermal and mechanical effect of ultrasonic, while the latter breaks the material based on strong shear force between the rotor and stator. Their combinations (HUAE and UHAE) enhance the damage to the cell wall of raw materials and improve the extraction efficiency by the synergistic effect. The results showed that using 60% acetone (V : V) as extraction solvent, solid-liquid ratio of 1:5 g mL−1, ultrasonic temperature of 80 ℃, ultrasonic time of 80 min, ultrasonic power of 225 W, and then homogenizing at 10,000 rpm for 10 min, the total flavonoid content of CM reached the maximum value of 551.99 ± 12.69 mg Rutin g−1 dry weight (dw), while the total phenolic content reached the maximum value of 289.48 ± 4.41 mg GAE g−1 dw at 10,000 rpm for 5 min, which may be related to the oxidative degradation of polyphenols caused by the increase of polyphenol oxidase with the extension of homogenization time. This study provides a technical guarantee for the further utilization of phenolic substances in CM.
1. Introduction
Coconut (Cocos nucifera L.), an important monocotyledonous plant, belongs to the coconut genus in the Palmaceae, and widely grows in tropical and subtropical regions [1], [2]. The structure of coconut fruit from the outside to the inside is the pericarp, testa, coconut kernel (solid endosperm), coconut water (liquid endosperm) and embryo. The mesocarp, called as coconut shell fiber, is composed of a large number of fibers inside the smooth exocarp. The endocarp, called as coconut shell, is the hard inner shell in the middle of coconut to protect the seed [3], [4]. The coconut mesocarp (CM) and coconut endocarp (CE) are the main by-products of coconut production, accounting for 50% of the whole coconut. According to the latest statistics of FAO, global coconut production reaches 62.06 million tons in 2019 [5], about 30 million tons of CM and CE. These by-products degrade slowly and are often discarded as solid wastes on beaches and streets, causing serious environmental pollution [6], [7]. At present, in addition to edible coconut water as a beverage and the kernel as the source food or oil, a small amount of CM and CE are used to produce activated carbon, carpets, ropes and agricultural fertilizers, etc. [8], [9]. Recently, the biological activity and nutritional value of coconut pericarp have been studied. It is found that coconut pericarp is rich in phenolic compounds, such as catechin, epicatechin, tannin, coumaric acid and vanillic acid [2], [10]. These phenolic compounds have been widely proved to have antibacterial, antiviral, anti-oxidant and anti-cancer activities [11], [12], [13].
High-efficiency extraction of natural active substances is the key technology for intensive processing of raw materials, obtaining high value-added products, and realizing optimal utilization value. Compared with a single solvent (water, ethanol, methanol, acetone and ether), the simultaneous use of two or more solvents with different polarities can increase the extraction rate of phytochemicals [14], [15]. For example, Chavan et al. [16] used different solvent systems to extract phenolics, tannins and sugars from beach pea (Lathyrus maritimus L.). As a result, the phenolics and condensed tannins extracted by the acetone-water system were more than those by ethanol–water or methanol–water system. Arivalagan et al. [2] found that adding water in the solvent system could improve the yield of phenolics in coconut testa. In addition, Ultrasound-Assisted (UAE) and Homogenization-Assisted Extraction (HAE) are considered to be the main methods for efficient extraction of natural active ingredients. The UAE is to use the cavitation, thermal and mechanical effect of ultrasonic to strengthen the treatment of materials [17], [18], [19], which effectively destroys the cell wall structure and promotes the intermolecular diffusion, resulting in fully release the active intracellular substances [20], [21]. It has the advantages of short extraction time, less solvent consumption, and high extraction rate [22], [23]. For instance, Rodiah et al. [3] found that compared with stirring extraction, UAE improved the yield of colorants in coconut mesocarp and exocarp, and the extraction time was short. However, to release the intracellular substances more fully, a stronger shear force is required. The HAE is to generate strong shear force, which makes the material molecules motion rate increases sharply, and reciprocate at high speed between the stator and rotor on the inner wall of the container, so that the material is split, broken and evenly dispersed in the medium [24], [25]. Ke et al. [26] used a homogenate method to extract crude polysaccharides from lentinus edodes with a yield of 13.2 ± 0.9%, which is 29.82% higher than the traditional heating extraction method, and has better DPPH scavenging activity. Regrettably, the long-term shearing action is easy to cause the oxidation, gelatinization, and the activity decreases of the substances. Among them, polyphenol oxidase (PPO) may increase with the increase of shear time, resulting in the oxidation of the extract substances, then the decrease of their activity. PPO is a kind of highly efficient phenolic oxidase, which can catalyze the generation of catechol from monophenolic hydroxyl compounds under aerobic conditions, and also oxidize the dehydrogenation of catechol to quinone [27]. Finally, the quinone polymerizes and reacts with the amino acids in the cell, resulting in browning reaction, which affects the content of polyphenols and antioxidant activity of the product. Therefore, based on the advantages and disadvantages of the UAE and HAE can be combined to enhance the damage to the cell wall of raw materials by the synergistic effect, based on the less time and energy consumption. It has been reported that the anthocyanins and flavonols from bog bilberry (Vaccinium uliginosum L.) marc with carnosic acid as an antioxidant additive are extracted by Homogenization-ultrasound-assisted extraction (HUAE), and the higher anthocyanins (13.95 ± 0.37 mg g−1) and flavonols (3.51 ± 0.16 mg g−1) were obtained [28]. In short, due to the lack of efficient extraction technology of CM and CE, the further utilization of their phenolic compounds is limited. Hence, optimizing the extraction process and improving the extraction rate are urgent problems. In this study, the effects of different solvents (water, methanol, 60% methanol, ethanol, 60% ethanol, acetone, 60% acetone) were evaluated and different extraction methods (UAE, HAE, Homogenization-Ultrasound-Assisted Extraction (HUAE), and Ultrasound-Homogenization-Assisted Extraction (UHAE) on the extraction rate of phenolic compounds in CM and CE and were optimized. These results will provide a preliminary basis for the further application of CM and CE phenolic extracts.
2. Materials and methods
2.1. Materials and reagents
The CM and CE samples were provided by the Rubber Research Institute of the Chinese Academy of Tropical Agricultural Sciences. They were dried to constant weight in a drying oven (103 ℃), Then, the powder through a 50 mm sieves was collected and stored at – 4 ℃ for future analysis.
Catechol, citric acid, sodium hydroxide, methanol, acetone ethanol and all analytic-grade reagents were purchased from Macklin Biochemical Co. Ltd. (Shanghai, China).
2.2. Determination of total phenolic content (TPC) and total flavonoid content (TFC)
According to Chen et al. [29], the TPC of the samples were determined by the Folin-Ciocalteu method, expressed as mg GAE g−1 dry weight (dw) and the TFC of the samples were determined by the Aluminium salt colorimetry, expressed as mg Rutin g−1 dw.
2.3. Solvent system
According to Li et al. [30] with minor modification, the basic extraction condition: The ultrasonic power of 360 W, the ultrasonic time of 30 min, the ultrasonic temperature of 60 ℃ and the solid–liquid ratio of 1:15 g mL−1. Different solvents (water, methanol, methanol (60%, Vmethanol:Vwater), ethanol, ethanol (60%, VethanolVwater), acetone, acetone (60%, Vacetone:Vwater) were used to extract phenolic compounds from the CM and CE.
2.4. Single factor experiment design of the UAE
Based on the optimum extraction solvent, the effects of ultrasonic temperature, ultrasonic time, solid–liquid ratio and ultrasonic power on TFC in CM and CE were investigated, respectively. The single factor experiment design was shown in Table 1.
Table 1.
Single factor experiment design.
| Factor | Five level | ||||
|---|---|---|---|---|---|
| ultrasonic time (min) | 20 | 40 | 60 | 80 | 100 |
| ultrasonic temperature (℃) | 20 | 40 | 60 | 80 | – |
| solid–liquid ratio (g mL−1) | 1:5 | 1:10 | 1:15 | 1:20 | 1:25 |
| ultrasonic power (W) | 180 | 225 | 270 | 315 | 360 |
2.5. Response surface experiment design of the UAE
According to the results of the single factor experiment, ultrasonic power (A), ultrasonic temperature (B) and ultrasonic time (C) were selected, and the Box-Behnken model was used to the design of the three-factor and three-level optimization experiment. The TFC in CM wasthe response value, and various factors and levels were shown in Table 2.
Table 2.
The experiment design and results of Response Surface Methodology.
| No. | Factor |
TFC (mg Rutin g−1 dw) | ||
|---|---|---|---|---|
| A | B | C | ||
| 1 | 225 | 60 | 60 | 382.86 ± 10.23 |
| 2 | 225 | 40 | 80 | 283.72 ± 11.51 |
| 3 | 225 | 40 | 40 | 301.21 ± 6.71 |
| 4 | 180 | 60 | 80 | 354.5 ± 18.65 |
| 5 | 225 | 60 | 60 | 398.43 ± 7.98 |
| 6 | 270 | 60 | 40 | 297.63 ± 6.16 |
| 7 | 180 | 60 | 40 | 352.25 ± 16.47 |
| 8 | 225 | 60 | 60 | 379.82 ± 8.35 |
| 9 | 180 | 40 | 60 | 351.17 ± 16.47 |
| 10 | 225 | 80 | 40 | 319.19 ± 18.82 |
| 11 | 270 | 60 | 80 | 302.71 ± 8.28 |
| 12 | 225 | 60 | 60 | 369.65 ± 10.21 |
| 13 | 225 | 80 | 80 | 408.56 ± 18.66 |
| 14 | 180 | 80 | 60 | 362.74 ± 8.40 |
| 15 | 225 | 60 | 60 | 365.46 ± 12.36 |
| 16 | 270 | 80 | 60 | 377.81 ± 13.66 |
| 17 | 270 | 40 | 60 | 278.89 ± 11.51 |
A: ultrasonic power (W), B: ultrasonic temperature (℃), C: ultrasonic time (min).
2.6. The HAE experiment design
Based on the experimental results of response surface optimization, the effects of Homogenization time and Homogenization-Ultrasound combination on TFC and TPC in CM were further investigated at the rotational speed of 10,000 rpm. The Homogenization experiment was carried out in Table 3.
Table 3.
Homogeneous experiment design.
| Name | Extraction method |
HAE Time (min) |
|||||
|---|---|---|---|---|---|---|---|
| 1ST step | 2nd step | ||||||
| HAE | HAE | – | 0 | 2.5 | 5 | 7.5 | 10 |
| HUAE | HAE | UAE | 0 | 2.5 | 5 | 7.5 | 10 |
| UHAE | UAE | HAE | 0 | 2.5 | 5 | 7.5 | 10 |
HAE: Homogenization-Assisted Extraction, UAE: Ultrasound-Assisted Extraction, HUAE: Homogenization-Ultrasound-Assisted Extraction, UHAE: Ultrasound-Homogenization-Assisted Extraction.
2.7. Determination of PPO
PPO was determined according to Baltacıoğlu et al. [31] with a slight modification. Briefly, citric acid phosphate buffer (2 mL, 0.1 mol L−1, pH = 6.8) and catechol (1 mL 0.1 mol L−1) were mixed into a test tube and water bath for 10 min at 40 ℃. After it cooled to room temperature, the extract solution (0.1 mL) was added. Then, the absorbance of the mixture was measured every 30 s at 410 nm and the results were expressed as units of PPO activity. One unit of PPO activity was defined as a 0.005 unit changes of absorbance value per minute. The PPO activity was calculated as using Eq. (1):
| (1) |
where ΔA410 is the change of absorbance in reaction time, V (mL) is the volume of extraction solution, Vt (0.1 mL) is the volume of PPO extract used for the reaction, Δt (min) is the reaction time, and W (g) is the weight of sample.
2.8. Statistical analysis
Each experiment was repeated at least three times, and the experimental results were expressed as the mean ± standard deviation (n = 3). The data were analyzed by IBM SPSS statistics 22.0 software, which was significant at 95% confidence level (P < 0.05). The response surface data were analyzed by Design-Expert 11 software, and the figures were completed by origin software (2016).
3. Results and discussion
3.1. Solvent systems analysis
Solvents play a vital role in the extraction of phenolic compounds. Therefore, the effect of different solvents on the extraction rate of phenolic compounds in CM and CE were evaluated by measuring TFC and TPC in different solvent extracts. The results showed that the mixture of water and organic solvent had a higher extraction rate than single solvent. For example, the TFC of 60% acetone, 60% ethanol and 60% methanol were higher than water, anhydrous acetone, ethanol, and methanol (Fig. 1a). Especially, 60% acetone had the highest TFC extraction rate of CM (274.99 ± 7.92 mg Rutin g−1 dw), while anhydrous acetone had the lowest extraction rate of CM (18.99 ± 1.00 mg Rutin g−1 dw) (Fig. 1a). Meanwhile, the TFCs of CE showed a similar trend to those of CM, and were relatively lower than those of CM. The TFC of CE at 60% acetone was 21.65 ± 1.42 mg Rutin g−1 dw, only accounting for 7.87% of CM. In addition, the change trend of TPC in CM and CE were like to that of TFC, and their highest TPCs were 196.98 ± 5.92 mg GAE g−1 dw and 7.77 ± 0.85 mg GAE g−1 dw at 60% acetone (Fig. 1b). In previous studies, Zhao et al. [32] reported that the TPCs of three Chinese barley varieties (Ken-3, KA4B, and Gan-3) were extracted using four solvent (80% acetone, 80% ethanol, 80% methanol, water). Their TPC values varied from 1.03 (water extract from Ken-3 barley) to 1.87 mg GAE g−1 dw (80% acetone extract from Gan-3 barley). Saifullah et al. [33] also reported the effect of five solvents on the extraction yields of phenolic compounds and antioxidant properties of lemon scented tea tree leaves. The results showed that 50% acetone (60.24 ± 6.21 mg GAE g−1 dw) > 50% ethanol (35.11 ± 2.84 mg GAE g−1 dw) > water (22.46 ± 3.68 mg GAE g−1 dw) > acetone (7.99 ± 0.08 mg GAE g−1 dw) > ethanol (7.35 ± 1.03 mg GAE g−1 dw). On the whole, the extraction solvent had a significant effect on the extraction rate of phenolics, and acetone–water system had obvious advantages.
Fig. 1.

Effects of extraction solvent systems on TFC and TPC in CM and CE Different lowercase letters (a-g) indicate significant differences in TPC or TFC among different solvents of CM or CE (p < 0.05), Different uppercase letters (A-B) indicate significant differences in TPC or TFC between CM and CE (p < 0.05), CM: coconut mesocarp, CE: coconut endocarp. W: Water, M: Methanol, 60%M: 60% Methanol, E: Ethanol, 60%E: 60% Ethanol, A: Acetone, 60%, A: 60% Acetone.
3.2. Single factor experiment analysis of the UAE
Using 60% acetone as extraction solvent, the effects of ultrasonic temperature, ultrasonic time, solid-liquid ratio and ultrasonic power on the extraction rate of phenolic compounds in CM and CE were studied. Under the same basic conditions, single factor experiments were carried out at five levels. As shown in Fig. 2a, b, d, with the increase of ultrasonic temperature, ultrasonic time and ultrasonic power, the TFC of CM and CE initially increased and then decreased. The increase of TFC may be the destruction of the surface of the solid matrix, which makes it easier for the solvent to penetrate into the solid matrix and increases the solubility of the solute. When the ultrasonic power, temperature and time reach a certain threshold, the cell wall rupture caused by the ultrasonic effect tends saturated. However, the extensive ultrasound degraded and destroyed phenolic compounds extracted from CM and CE, resulting in the thermal degradation of phenolic compounds [19]. Previous reports on the yield of phenolic compounds extracted from olive fruits using the UAE also demonstrated increase of yield with increasing time from 4 to 20 min, whereas prolonged treatment of ultrasound after 20 min declined the yield [34]. Therefore, after reaching a certain threshold, the TFC does not increase but decrease. Additionally, with the increase of the solid–liquid ratio, the TFC showed a downward trend in CM and an unchanged trend in CE (Fig. 2c). The high ratio reduces the recovery rate and increases the energy and reagents consumption. Thus, the ultrasonic power, time and temperature will be further optimized by response surface methodology (RSM), except that the material-liquid ratio is 1 : 5 g mL−1 to minimize energy consumption.
Fig. 2.

Effects of ultrasonic temperature (a), ultrasonic time (b), solid–liquid ratio (c) and ultrasonic power (d) on TFC CM: coconut mesocarp, CE: coconut endocarp.
3.3. Response surface experiment analysis of the UAE
Considering the high TPC and TFC in CM, the optimization experiment took CM as an example. According to the results of single factor experiment, the three factors and three levels was carried out by RSM. A total of 17 experiments were designed, including 5 central point experiments shown in Table 2. The data were fitted by multiple regression with Design-Expert software, and the quadratic multiple regression equation was obtained. The ultrasonic power (A), ultrasonic temperature (B) and ultrasonic time (C) were taken as independent variables, and the TFC was taken as the response value. The regression equation (Eq. (2)) was as follows: TFC (mg Rutin g−1 dw) = 379.24–20.45 × A + 31.66 × B + 9.90 × C + 21.84 × AB + 0.7075 × AC + 26.72 × BC − 18.99 × A2 − 17.60 × B2 − 33.48 × C2. (2)
From the results of variance analysis in Table 4, the regression equation of the model had significant difference (P < 0.01), and significantly affected of ultrasonic power (A) and temperature (B). The reciprocal action of AB and BC displayed a stronger influence on TFC values, but the reciprocal action of AC was shown to be insignificant. Furthermore, the second-order reciprocal action of A2, B2 and C2 had significant effects on TFC values, and compared with A2 and B2, C2 had more significant effects. The reliable predictive value of the model (R2 = 0.9398) supported its good predictability for the response variables. The adjusted coefficient of determination was RAdj2 = 0.8623, suggesting that the model reflected 86% of the data and had a good fitting degree. The “Lack of Fit F-value” of 1.92 implied that the model equation was sufficient to predict the extraction rate of TFC in CM within the range of experimental variables.
Table 4.
Analysis of variance of Response Surface Methodology for the for TFC values.
| Source | Sum of Squares | df | Mean Square | F-value | P-value | Significant |
|---|---|---|---|---|---|---|
| Model | 25235.55 | 9 | 2803.95 | 12.13 | 0.0017 | ** |
| A- ultrasonic power | 3346.44 | 1 | 3346.44 | 14.48 | 0.0067 | ** |
| B- ultrasonic temperature | 8020.74 | 1 | 8020.74 | 34.71 | 0.0006 | ** |
| C- ultrasonic time | 784.28 | 1 | 784.28 | 3.39 | 0.1080 | |
| AB | 1907.51 | 1 | 1907.51 | 8.25 | 0.0239 | * |
| AC | 2.00 | 1 | 2.00 | 0.0087 | 0.9284 | |
| BC | 2854.76 | 1 | 2854.76 | 12.35 | 0.0098 | ** |
| A2 | 1519.12 | 1 | 1519.12 | 6.57 | 0.0373 | * |
| B2 | 1303.81 | 1 | 1303.81 | 5.64 | 0.0492 | * |
| C2 | 4718.78 | 1 | 4718.78 | 20.42 | 0.0027 | ** |
| Residual | 1617.62 | 7 | 231.09 | |||
| Lack of Fit | 954.07 | 3 | 318.02 | 1.92 | 0.2683 | |
| Pure Error | 663.55 | 4 | 165.89 | |||
| Cor Total | 26853.18 | 16 |
* Indicates significant difference P < 0.05, ** Indicates significant difference P < 0.01.
According to the regression equation, the shape of the fitted response surface was investigated, and the interaction of various factors on the TFC in CM was analyzed. As shown in Fig. 3, The influence of each variable on TFC showed a trend of initially increased and then decreased, and the steeper the slope of the response surface, the more significant the interaction [35]. With the change of ultrasonic power (A) and temperature (B), the response surface tended to be parabola, and the slope of the surface was steep, indicating that there was an interaction between A and B in Fig. 3a, which was consistent with those of ANOVA (PAB < 0.05). Similarly, there was an interaction between B and C (PBC < 0.01) (Fig. 3c). However, the curved surface was flat (Fig. 3b), indicating that the interaction between ultrasonic power (A) and ultrasonic time (C) was not significant (PAC > 0.05).
Fig.3.

Response surface methodology of various factors on TFC in CM, ultrasonic power and ultrasonic temperature (a), ultrasonic power and ultrasonic time (b), ultrasonic temperature and ultrasonic time (c). CM: coconut mesocarp.
Based on the Design-Expert software prediction, the optimum extraction process of TFC in CM was as follows: ultrasonic power of 227.11 W, ultrasonic temperature of 80 ℃, ultrasonic time of 70.94 min, and the maximum TFC was 416.636 mg Rutin g−1 dw. Considering the convenience and feasibility of practical operation, the process was adjusted as follows: ultrasonic power of 225 W, ultrasonic temperature of 80 ℃, ultrasonic time of 80 min and the practical value was 408.56 mg ± 18.66 Rutin g−1 dw. Saifullah et al. [33] extracted phenolic compounds from lemon flower tea with 50% acetone as solvent, ultrasonic time of 60 min, ultrasonic temperature of 50 ℃ and ultrasonic power of 200 W, and the TFC was 76.12 ± 0.79 mg CE g−1 dw. Under the same conditions, the TFC in CM was 369.65 ± 10.21 mg Rutin g−1 dw. These differences indicated that the optimum extraction process was related to the properties of plant materials.
3.4. HAE experiment analysis
To evaluating the effect of the combination of UAE and HAE on the extraction rate of phenolic compounds from CM, the optimal UAEo (ultrasonic power of 225 W, ultrasonic temperature of 80 ℃, ultrasonic time of 80 min) and the worst UAEw (ultrasonic power of 270 W, ultrasonic temperature of 60 ℃, ultrasonic time of 40 min) and HAE (0, 2.5, 5.0, 7.5, and 10 min) at 10,000 rpm were selected. The results showed that compared with the TFC of 60% acetone (266.99 ± 4.45 mg Rutin g−1 dw), the TFCs of UAEo, UAEw and HAE were 408.56 ± 18.66, 297.63 ± 4.04 and 309.48 ± 7.85 mg Rutin g−1 dw, respectively. The TFC was enhanced to 514.59 ± 21.02 mg Rutin g−1 dw by HUAEo and 551.99 ± 12.69 mg Rutin g−1 dw by UHAEo (Fig. 4a). Under the same homogenization time in all combinations, the TFCs of UHAEo and UHAEw were higher than those of HUAEo and HUAEw (Fig. 4), respectively. Moreover, with the increase of homogenization time, TFC showed an upward trend from 408.56 ± 18.66 to 551.99 ± 12.69 mg Rutin g−1 dw under UHAEo and 297.63 ± 4.04 to 385.81 ± 10.69 mg Rutin g−1 dw under UHAEw. These results indicated that ultrasound before homogenization is more conducive to the release of phenolics, and they increases with the prolongation of homogenization time.
Fig. 4.

Effects of UAE, HAE, HUAE and UHAE on TFC in CM Different lowercase letters (a-e) indicate significant differences in TFC among different extraction methods of CM (p < 0.05), Different uppercase letters (A-B) indicate significant differences in TFC among HAE, HUAE and UHAE (p < 0.05), CM: coconut mesocarp, HAE: Homogenization-Assisted Extraction, UAE: Ultrasound-assisted extraction, HUAE: Homogenization-Ultrasound-assisted extraction, UHAE: Ultrasound-Homogenization-Assisted Extraction, o: ultrasonic power of 225 W, ultrasonic temperature of 80 ℃, ultrasonic time of 80 min, w: ultrasonic power of 270 W, ultrasonic temperature of 60 °C, ultrasonic time of 40 min.
However, the change trend of TPC was slightly different from that of TFC. By contrast, TPC initially increased (0 to 5 min) and then decreased (5 to 10 min) (Fig. 5). This initial increase can damage cell wall or cell structure by homogenization, lead to the release of phenolic compounds, and increase TPC, antioxidant activity. After 5 min, the long-term shear effect continued to destroy the cell structure, which may lead to the dissolution of PPO. PPO is a copper containing oxido reductase, which is an important enzyme to accelerate the oxidative degradation of polyphenols and their derivatives [36]. He et al. [37] reported that the total phenolic bioaccessibility of apple juice decreased 29.3% after long-term high-pressure homogenization. To track whether PPO increases with homogenization time, the contents of PPO in the extract at 0, 2.5, 5, 7.5 and 10 min were investigated (Fig. 6). The results showed that the PPO in CM gradually increased with increasing homogenization time. Therefore, long-term homogenization can promote the release of PPO in cell tissues, resulting in the decrease of TPC in the system. Orak also found that there was a negative correlation between PPO and TPC (R = – 0.390) [38]. Furthermore, there was no significant difference between HUAE and UHAE on the extraction rate of TPC. Therefore, exploring the specific extraction process of CM can maximize the extraction efficiency and lay a good foundation for the further study of effective components.
Fig. 5.

Effects of UAE, HAE, HUAE and UHAE on TPC in CM Different lowercase letters (a-e) indicate significant differences in TPC among different extraction methods of CM (p < 0.05), Different uppercase letters (A-B) indicate significant differences in TPC among HAE, HUAE and UHAE (p < 0.05), CM: coconut mesocarp, HAE: Homogenization-Assisted Extraction, UAE: Ultrasound-Assisted Extraction, HUAE: Homogenization-Ultrasound-Assisted Extraction, UHAE: Ultrasound-Homogenization-Assisted Extraction, o: ultrasonic power of 225 W: ultrasonic temperature of 80 ℃, ultrasonic time of 80 min, w: ultrasonic power of 270 W, ultrasonic temperature of 60 ℃, ultrasonic time of 40 min.
Fig. 6.
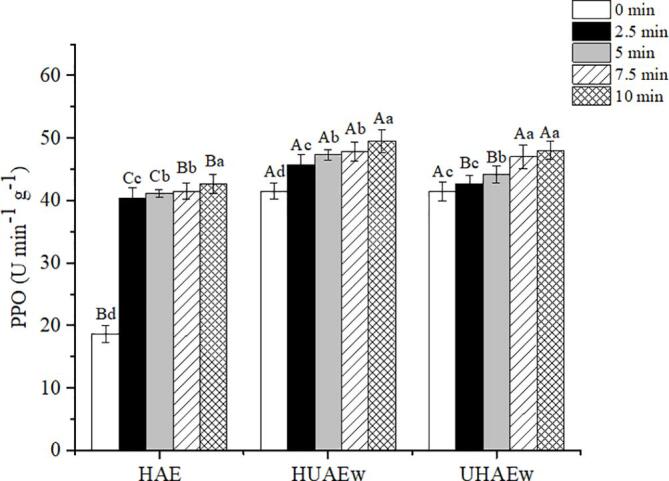
Effect of homogenization on PPO content Different lowercase letters (a-e) indicate significant differences in PPO among different extraction methods of CM (p < 0.05), Different uppercase letters (A-B) indicate significant differences in PPO among HAE, HUAE and UHAE (p < 0.05), CM: coconut mesocarp, HAE: Homogenization-Assisted Extraction, UAE: Ultrasound-Assisted Extraction, HUAE: Homogenization-Ultrasound-Assisted Extraction, UHAE: Ultrasound-Homogenization-Assisted Extraction, w: ultrasonic power of 270 W, ultrasonic temperature of 60 ℃, ultrasonic time of 40 min.
4. Conclusion
In this study, the extraction process of phenolic compounds from CM and CE was optimized. Based on 60% acetone as the optimum solvent, the UAE of TFC was further optimized by single factor experiment and three-factor and three-level response surface design. With solid–liquid ratio of 1:5 g mL−1, ultrasonic temperature of 80 ℃, ultrasonic time of 80 min and ultrasonic power of 225 W, the TFC reached the maximum of 408.56 ± 18.66 mg Rutin g−1 dw. Then compared with the four process systems of UAE, HAE, UHAE and HUAE, the TFC with UHAE (10 min, 10,000 rpm) reached the highest of 551.99 ± 12.69 mg Rutin g−1 dw. However, TPC reached a maximum of 289.48 ± 4.41 mg GAE g−1 dw at UHAE (5 min, 10,000 rpm), which might be related to the increase of PPO content. Long time homogenization would promote the release of PPO to degrade phenolic substances. In conclusion, the process UHAE is more conducive to the release of phenolic substances in CM, which provides a new idea for the extraction of active substances in plants, and also provides a technical guarantee for the further utilization of phenolic substances in CM.
CRediT authorship contribution statement
Jing Yang: Data curation, Visualization, Writing - review & editing. Nana Li: Writing - original draft, Visualization. Chunyu Wang: Data curation, Visualization. Tao Chang: Validation, Formal analysis. Huichuan Jiang: Supervision, Funding acquisition.
Declaration of Competing Interest
The authors declare that they have no known competing financial interests or personal relationships that could have appeared to influence the work reported in this paper.
Acknowledgment
Research Project Supported by Shanxi Scholarship Council of China (2020-101).
References
- 1.Editorial Board of Flora of China . Science Press; 2004. Chinese Academy of Sciences, Flora of China; pp. 41–59. in Chinese. [Google Scholar]
- 2.Arivalagan M., Roy T.K., Yasmeen A.M., Pavithra K.C., Jwala P.N., Shivasankara K.S., Manikantan M.R., Hebbar K.B., Kanade S.R. Extraction of phenolic compounds with antioxidant potential from coconut (Cocos nucifera L.) testa and identification of phenolic acids and flavonoids using UPLC coupled with TQD-MS/MS. LWT-Food Sci. Technol. 2018;92:116–126. doi: 10.1016/j.lwt.2018.02.024. [DOI] [Google Scholar]
- 3.Rodiah M.H., Nur Asma Fhadhila Z., Noor Asiah H., Aziah M.Y., Kawasaki N. Ultrasound-assisted extraction of natural colourant from husk of Cocos nucifera: A comparison with agitated-bed extraction. Pertanika J. Sci. Technol. 2018;26(3):1039–1052. [Google Scholar]
- 4.Lima E.B., Sousa C.N., Meneses L.N., Ximenes N.C., Santos Junior M.A., Vasconcelos G.S., Vasconcelos S.M. Cocos nucifera (L.) (Arecaceae): A phytochemical and pharmacological review. Braz. J. Med. Biol. Res. 2015;48(11):953–964. doi: 10.1590/1414-431X20154773. [DOI] [PMC free article] [PubMed] [Google Scholar]
- 5.FAOSTAT. 2021. http://www.fao.org/faostat/en/?data/QC.
- 6.Schena T., Lazzari E., Primaz C., Canielas Krause L., Machado M.E., Bastos Caramão E. Upgrading of coconut fibers bio-oil: An investigation by Gc×Gc/Tofms. J. Environ. Chem. Eng. 2020;8(2):103662. doi: 10.1016/j.jece.2020.103662. [DOI] [Google Scholar]
- 7.Quinones-Bolanos E., Gomez-Oviedo M., Mouthon-Bello J., Sierra-Vitola L., Berardi U., Bustillo-Lecompte C. Potential use of coconut fibre modified mortars to enhance thermal comfort in low-income housing. J. Environ. Manage. 2021;277 doi: 10.1016/j.jenvman.2020.111503. [DOI] [PubMed] [Google Scholar]
- 8.Israel A.U., Ogali R.E., Akaranta O., Obot I.B. Extraction and characterization of coconut (Cocos nucifera L.) coir dust, Songklanakarin. J. Sci. Technol. 2011;33(6):717–724. [Google Scholar]
- 9.Diaz P., Jeong S.C., Lee S., Khoo C., Koyyalamudi1 S.R. Antioxidant and anti-inflammatory activities of selected medicinal plants and fungi containing phenolic and flavonoid compounds. Chin. Med. 2012;7:26. doi: 10.1186/1749-8546-7-26. [DOI] [PMC free article] [PubMed] [Google Scholar]
- 10.Appaiah P., Sunil L., Prasanth Kumar P.K., Gopala Krishna A.G. Composition of coconut Testa, coconut kernel and its oil. J. Am. Oil. Chem. Soc. 2014;91(6):917–924. doi: 10.1007/s11746-014-2447-9. [DOI] [Google Scholar]
- 11.Yao J., Chen J., Yang J., Hao Y., Fan Y., Wang C., Li N. Free, soluble-bound and insoluble-bound phenolics and their bioactivity in raspberry pomace. LWT-Food Sci. Technol. 2021;135 doi: 10.1016/j.lwt.2020.109995. [DOI] [Google Scholar]
- 12.Buamard N., Benjakul S. Improvement of gel properties of sardine (Sardinella albella) surimi using coconut husk extracts. Food Hydrocolloid. 2015;51:146–155. doi: 10.1016/j.foodhyd.2015.05.011. [DOI] [Google Scholar]
- 13.Dzialo M., Mierziak J., Korzun U., Preisner M., Szopa J., Kulma A. The potential of plant phenolics in prevention and therapy of skin disorders. Int. J. Mol. Sci. 2016;17(2):160. doi: 10.3390/ijms17020160. [DOI] [PMC free article] [PubMed] [Google Scholar]
- 14.Jaiswal A.K., Abu-Ghannam N., Gupta S. A comparative study on the polyphenolic content, antibacterial activity and antioxidant capacity of different solvent extracts of Brassica oleracea vegetables. Int. J. Food. Sci. Tech. 2012;47(2):223–231. doi: 10.1111/j.1365-2621.2011.02829.x. [DOI] [Google Scholar]
- 15.Iloki-Assanga S.B., Lewis-Lujan L.M., Lara-Espinoza C.L., Gil-Salido A.A., Fernandez-Angulo D., Rubio-Pino J.L., Haines D.D. Solvent effects on phytochemical constituent profiles and antioxidant activities, using four different extraction formulations for analysis of Bucida buceras L and Phoradendron californicum. BMC Res. Notes. 2015;8:396. doi: 10.1186/s13104-015-1388-1. [DOI] [PMC free article] [PubMed] [Google Scholar]
- 16.Chavan U.D., Amarowicz R. Effect of various solvent systems on extraction of phenolics, tannins and sugars from beach pea (Lathyrus maritimus L.) Int. Food. Res. J. 2013;20(3):1139–1144. [Google Scholar]
- 17.Hammi K.M., Jdey A., Abdelly C., Majdoub H., Ksouri R. Optimization of ultrasound-assisted extraction of antioxidant compounds from Tunisian Zizyphus lotus fruits using response surface methodology. Food Chem. 2015;184:80–89. doi: 10.1016/j.foodchem.2015.03.047. [DOI] [PubMed] [Google Scholar]
- 18.Dos Santos J.M., de Andrade J.K., Galvao F., Felsner M.L. Optimization and validation of ultrasound-assisted extraction for the determination of micro and macro minerals in non- centrifugal sugar by F AAS. Food Chem. 2019;292:66–74. doi: 10.1016/j.foodchem.2019.04.037. [DOI] [PubMed] [Google Scholar]
- 19.Bhagya Raj G.V.S., Dash K.K. Ultrasound-assisted extraction of phytocompounds from dragon fruit peel: optimization, kinetics and thermodynamic studies. Ultrason. Sonochem. 2020;68:105180. doi: 10.1016/j.ultsonch.2020.105180. [DOI] [PubMed] [Google Scholar]
- 20.Maran J.P., Priya B. Ultrasound-assisted extraction of polysaccharide from Nephelium lappaceum L. fruit peel. Int. J. Biol. Macromol. 2014;70:530–536. doi: 10.1016/j.ijbiomac.2014.07.032. [DOI] [PubMed] [Google Scholar]
- 21.Chen Y., Yin L., Zhao L., Shu G., Yuan Z., Fu H., Lin J. Optimization of the ultrasound-assisted extraction of antioxidant phloridzin from Lithocarpus polystachyus Rehd. using response surface methodology. J. Sep. Sci. 2017;40(22):4329–4337. doi: 10.1002/jssc.201700686. [DOI] [PubMed] [Google Scholar]
- 22.Tatke P., Rajan M. Comparison of conventional and novel extraction techniques for the extraction of scopoletin from convolvulus pluricaulis. Indian J. Pharm. Educ. 2014;48(1):27–31. doi: 10.5530/ijper.48.1.5. [DOI] [Google Scholar]
- 23.Rodrigues S., Pinto G.A.S. Ultrasound extraction of phenolic compounds from coconut (Cocos nucifera) shell powder. J. Food Eng. 2007;80(3):869–872. doi: 10.1016/j.jfoodeng.2006.08.009. [DOI] [PubMed] [Google Scholar]
- 24.Duan M., Xu W., Yao X., Zhang D., Zhang Y., Fu Y., Zu Y. Homogenate-assisted negative pressure cavitation extraction of active compounds from Pyrola incarnata Fisch. and the extraction kinetics study. Innov. Food Sci. Emerg. 2015;27:86–93. doi: 10.1016/j.ifset.2014.12.008. [DOI] [Google Scholar]
- 25.Hua J., Feng Z., Liu Y., Pei D., Sun X., Feng S., Di D. Extraction kinetics research of flavonoids from radix astragali based on high shear dispersing emulsifier. Chinese J. Anal. Chem. 2012;40(5):752–756. doi: 10.3724/SP.J.1096.2012.10915. [DOI] [Google Scholar]
- 26.Ke L., Chen H. Homogenate extraction of crude polysaccharides from Lentinus edodes and evaluation of the antioxidant activity. Food Sci. Tech-Brazil. 2016;36(3):533–539. doi: 10.1590/1678-457x.00916. [DOI] [Google Scholar]
- 27.He Q., Luo Y., Chen P. Elucidation of the mechanism of enzymatic browning inhibition by sodium chlorite. Food Chem. 2008;110(4):847–851. doi: 10.1016/j.foodchem.2008.02.070. [DOI] [PubMed] [Google Scholar]
- 28.Jin Y., Zhang Y., Liu D., Zhang C., Qi H., Zhou Z. Efficient homogenization-ultrasound-assisted extraction of anthocyanins and flavonols from bog bilberry (Vaccinium uliginosum L.) marc with carnosic acid as an antioxidant additive. Molecules. 2019;24(14):2537. doi: 10.3390/molecules24142537. [DOI] [PMC free article] [PubMed] [Google Scholar]
- 29.Chen J., Yang J., Ma L., Li J., Shahzad N., Kim C.K. Structure-antioxidant activity relationship of methoxy, phenolic hydroxyl, and carboxylic acid groups of phenolic acids. Sci. Rep. 2020;10:2611. doi: 10.1038/s41598-020-59451-z. [DOI] [PMC free article] [PubMed] [Google Scholar]
- 30.Li N., Jiang H., Yang J., Wang C., Wu L., Hao Y., Liu Y. Characterization of phenolic compounds and anti-acetylcholinase activity of coconut shells. Food Biosci. 2021;42 doi: 10.1016/j.fbio.2021.101204. [DOI] [Google Scholar]
- 31.Baltacıoğlu H., Coruk K.S. Determination of conformational changes of polyphenol oxidase and peroxidase in peach juice during mild heat treatment using FTIR spectroscopy coupled with chemometrics. Int. J. Food. Sci. Tech. 2021;5(6):2915–2925. doi: 10.1111/ijfs.14930. [DOI] [Google Scholar]
- 32.Zhao H., Dong J., Lu J., Chen J., Shan L., Lin Y., Gu G. Effects of extraction solvent mixtures on antioxidant activity evaluation and their extraction capacity and selectivity for free phenolic compounds in barley (Hordeum vulgare L.) J. Agr. Food Chem. 2006;54(19):7277–7286. doi: 10.1021/jf061087w. [DOI] [PubMed] [Google Scholar]
- 33.Saifullah M., McCullum R., McCluskey A., Vuong Q. Comparison of conventional extraction technique with ultrasound assisted extraction on recovery of phenolic compounds from lemon scented tea tree (Leptospermum petersonii) leaves. Heliyon. 2020;6(4) doi: 10.1016/j.heliyon.2020.e03666. [DOI] [PMC free article] [PubMed] [Google Scholar]
- 34.Jerman T., Trebše P., Mozetič Vodopivec B. Ultrasound-assisted solid liquid extraction (USLE) of olive fruit (Olea europaea) phenolic compounds. Food Chem. 2010;123(1):175–182. doi: 10.1016/j.foodchem.2010.04.006. [DOI] [Google Scholar]
- 35.Fan Y., Yang J., Duan A., Li X. Pectin/sodium alginate/xanthan gum edible composite films as the fresh-cut package. Int. J. Biol. Macromol. 2021;181:1003–1009. doi: 10.1016/j.ijbiomac.2021.04.111. [DOI] [PubMed] [Google Scholar]
- 36.Li F., Chen G., Zhang B., Fu X. Current applications and new opportunities for the thermal and non-thermal processing technologies to generate berry product or extracts with high nutraceutical contents. Food Res. Int. 2017;100:19–30. doi: 10.1016/j.foodres.2017.08.035. [DOI] [PubMed] [Google Scholar]
- 37.He Z., Tao Y., Zeng M., Zhang S., Tao G., Qin F., Chen J. High pressure homogenization processing, thermal treatment and milk matrix affect in vitro bioaccessibility of phenolics in apple, grape and orange juice to different extents. Food Chem. 2016;200:107–116. doi: 10.1016/j.foodchem.2016.01.045. [DOI] [PubMed] [Google Scholar]
- 38.Orak H.H. Total antioxidant activities, phenolics, anthocyanins, polyphenoloxidase activities of selected red grape cultivars and their correlations. Sci. Hortic-Amsterdam. 2007;111(3):235–241. doi: 10.1016/j.scienta.2006.10.019. [DOI] [Google Scholar]