Abstract
Multiple sclerosis (MS) is a chronic inflammatory and degenerative disease of the central nervous system (CNS). MS commonly affects the cerebellum causing acute and chronic symptoms. Cerebellar signs significantly contribute to clinical disability, and symptoms such as tremor, ataxia, and dysarthria are difficult to treat. Fibroblast growth factors (FGFs) and their receptors (FGFRs) are involved in demyelinating pathologies such as MS. In autopsy tissue from patients with MS, increased expression of FGF1, FGF2, FGF9, and FGFR1 was found in lesion areas. Recent research using mouse models has focused on regions such as the spinal cord, and data on the expression of FGF/FGFR in the cerebellum are not available. In recent EAE studies, we detected that oligodendrocyte-specific deletion of FGFRs results in a milder disease course, less cellular infiltrates, and reduced neurodegeneration in the spinal cord. The objective of this study was to characterize the role of FGFR1 in oligodendrocytes in the cerebellum. Conditional deletion of FGFR1 in oligodendrocytes (Fgfr1ind−/−) was achieved by tamoxifen application, EAE was induced using the MOG35-55 peptide. The cerebellum was analyzed by histology, immunohistochemistry, and western blot. At day 62 p.i., Fgfr1ind−/− mice showed less myelin and axonal degeneration compared to FGFR1-competent mice. Infiltration of CD3(+) T cells, Mac3(+) cells, B220(+) B cells and IgG(+) plasma cells in cerebellar white matter lesions (WML) was less in Fgfr1ind−/−mice. There were no effects on the number of OPC or mature oligodendrocytes in white matter lesion (WML). Expression of FGF2 and FGF9 associated with less myelin and axonal degeneration, and of the pro-inflammatory cytokines IL-1β, IL-6, and CD200 was downregulated in Fgfr1ind−/− mice. The FGF/FGFR signaling protein pAkt, BDNF, and TrkB were increased in Fgfr1ind−/− mice. These data suggest that cell-specific deletion of FGFR1 in oligodendrocytes has anti-inflammatory and neuroprotective effects in the cerebellum in the EAE disease model of MS.
Keywords: FGFR1, oligodendrocytes, demyelination, inflammation, cerebellum, EAE, MS
1. Introduction
Multiple sclerosis (MS) is a chronic inflammatory and degenerative disease of the central nervous system (CNS) associated with oligodendrocyte injury, demyelination, and degeneration of axons [1]. As a consequence of demyelination, oligodendrocytes differentiate, proliferate, and migrate to repair damaged myelin sheaths [2,3,4]. This repair mechanism is effective in early stages of MS, but it deteriorates with disease progression [5,6,7,8,9]. The underlying mechanisms of impaired remyelination include failure of oligodendrocyte progenitor cell (OPC) recruitment and differentiation of OPCs into mature oligodendrocytes [8,10], oxidative stress, and mitochondrial dysfunction [11].
FGF/FGFR signaling pathways are involved in the pathogenesis of MS and its disease models. In autopsy tissue, an increased number of FGF1/2+ macrophages and astrocytes were observed in and around active lesions in the cerebral cortex and periventricular white matter; additionally, FGFR1 was upregulated in oligodendrocyte progenitor cells (OPC) in active lesions and around chronic lesions [12,13]. Analysis of the cerebrospinal fluid (CSF) of patients with relapsing-remitting MS showed higher levels of FGF2 expression than healthy controls and revealed that an increased concentration of FGF2 positively correlates with lesion load of disease activity [14]. Human data indicate the implication of FGF2 in the pathogenesis of MS. We have investigated oligodendrocyte-specific deletion of FGFR in experimental autoimmune encephalomyelitis (EAE) [15,16]. Fgfr1ind−/− and Fgfr2ind−/− mice showed less motor deficits, reduced inflammation, and demyelination in the spinal cord. Phosphorylation of Akt and ERK was regulated in the spinal cord of both Fgfr1ind−/− and Fgfr2ind−/− mice [15,16]. Consequently, data from this disease model of MS suggest that FGFR in oligodendrocytes exert negative effects.
The cerebellum plays a crucial role in coordination and balance [17]. In MS studies one third of subjects have functionally relevant cerebellar deficits [18,19]. Disabling symptoms such as nystagmus, ataxia, dysphagia, or dysarthria are caused by destruction within the cerebellum [20,21]. In fact, the prognosis is worse when patients have early signs of cerebellar deficits [22,23], and symptoms caused by lesions in the cerebellum respond poorly to symptomatic therapies [24,25]. Impairment of cerebellar function may also lead to a lower quality of life [26]. Thus, cerebellar dysfunction in MS has clinically relevant consequences, its underlying mechanism and treatment strategies remains poorly understood. Inflammation, demyelination, and axonal damage can be found in the whole CNS of patients with MS [17]; however, comparative data on the extent of damage in various regions of the CNS are limited. The number of lesions in the cerebellar white matter is lower than the number in the forebrain white matter. Further, axonal loss or remyelination differs between cerebellar and forebrain plaques, the underlying mechanisms are unclear [25]. Magnetic resonance imaging studies have confirmed extensive cerebellar involvement in both relapsing-remitting and progressive MS. Persistent cerebellar dysfunction has been linked with axonal loss in the cerebellum of patients with progressive MS [27].
In EAE, inflammation, demyelination, or neurodegeneration have been found in various regions of the CNS including the cerebrum, corpus callous, hippocampus, and the cerebellum [28]. Several studies have focused on the pathology of cerebellar structures in EAE [29,30,31,32]. In MOG35-55-induced EAE, demyelinating lesions and infiltrates of T cells and macrophages were detected in the cerebellum [28]. A reduced number of CD4 and CD8 positive T cells was found in the cerebellum of mice treated with an anti-CX3CL1 antibody [33]. Multilocular neuroinflammation and demyelination was found in the spinal cord and the cerebellum of astrocyte specific IL-23 producing mice [31]. Increased neutrophil infiltrations and demyelination were found in the cerebellum of Socs3 deficient mice [34], and hypoxia and increased variations in oxygenation were found in the grey matter of the cortex and the cerebellum [35]. In another study using MRI, a significant reduction in cerebellar and cerebral cortex volumes was detected [36].
Based on data from previous EAE studies, we hypothesized that oligodendrocyte-specific deletion of FGFR1 results in reduced inflammation and degeneration in the cerebellum. In agreement with our hypothesis, we found reduced inflammatory infiltrates as well as less myelin and axonal degeneration in the cerebellum of Fgfr1ind−/− mice. Akt phosphorylation, TrkB, and BDNF expression were upregulated in Fgfr1ind−/− mice. In addition, we found reduced IL-6, IL-1β, and CD200 expression in Fgfr1ind−/− mice. The expression of FGF2 and FGF9 was reduced, and myelin protein PLP expression was increased. These data suggest that FGF/FGFR pathways are associated with proinflammatory mechanisms and myelination, and they may contribute to disability of EAE caused by cerebellar damage.
2. Results
2.1. Reduced Inflammatory Infiltrates in WML of the Cerebellum in Fgfr1ind−/− Mice
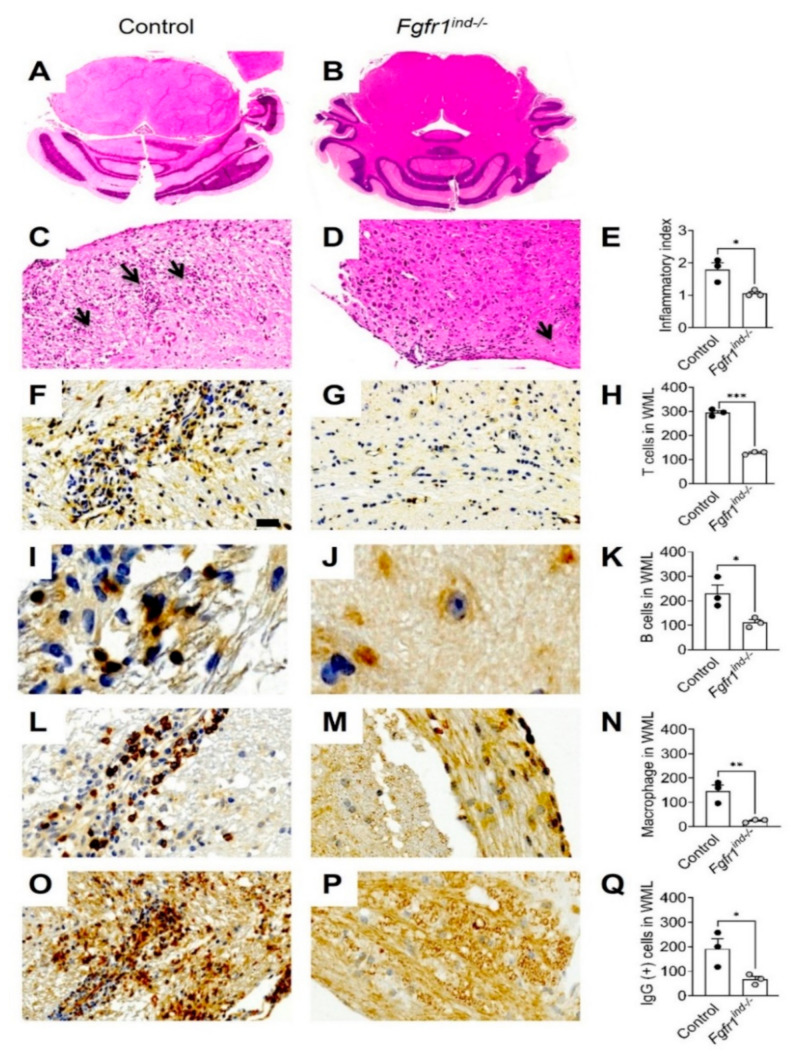
To assess the effects of oligodendrocyte-specific deletion of FGFR1 in the spinal cord, we previously reported a reduction in CD3(+) T cells, B220(+) B cells and Mac3(+) macrophages/activated microglia in Fgfr1ind−/− mice on day 62 p.i. [16]. In the cerebellum, Fgfr1ind−/− mice showed less inflammatory infiltrates at day 62 p.i. (p = 0.0251; Figure 1C–E). To study the composition of these infiltrates in WML of the cerebellum, we analysed different immune cell populations. CD3(+) T cells (p < 0.0001), B220(+) B cells (p = 0.0321), Mac3(+) activated microglia/macrophages (p = 0.0092) and IgG(+) plasma cells (p = 0.0428) were decreased in Fgfr1ind−/− mice (Figure 1F–Q).
Figure 1.
Inflammation and immune cell infiltration in the cerebellum at day 62 p.i. Cross section of the control and Fgfr1ind−/− mice cerebellum (A,B), and inflammation was shown as inflammatory index (C–E). Inflammation was less in Fgfr1ind−/− mice cerebellum (C–E). Arrowheads indicate immune cell clustering (C–E). Immune cell infiltration in cerebellar WML at day 62 p.i. Fgfr1ind−/− mice showed a decreased number of CD3(+) T cells (F–H), B220(+) B cells (I–K), MAC3(+) macrophages/microglia activation (L–N), and reduced IgG(+) plasma cell infiltration (O–Q) in WML of the cerebellum. n = 3/group. Scale bar depicts 50 μm (F–P). Data are expressed as the mean ± SEM. * p < 0.05, ** p < 0.01. *** p < 0.001.
2.2. Oligodendroglia-Specific Deletion of FGFR1 Is Associated with a Reduction in Inflammatory Mediators in the Cerebellum
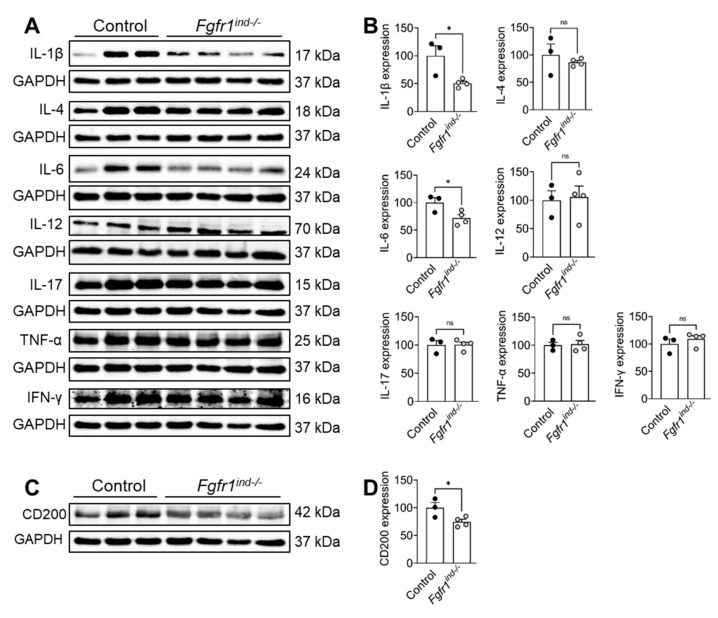
To investigate the effect of oligodendroglia-specific deletion of FGFR1 on cytokine regulation in the cerebellum, whole cerebellar lysates were analysed by western blot. The proinflammatory cytokines IL-1β (p = 0.0254) and IL-6 (p = 0.0438) were downregulated in Fgfr1ind−/− mice (Figure 2A,B). In contrast, IL-12 (p = 0.834), IL-17 (p = 0.9600), TNFα (p = 0.8400) and IFNγ (p = 0.4240) were not regulated (Figure 2A,B). CD200 was expressed less in Fgfr1ind−/− mice (p = 0.0463, Figure 2C,D). Phosphorylation of JNK (p = 0.809) and P38 (p = 0.312) were not regulated in the cerebellum by the deletion of FGFR1.
Figure 2.
Protein expression of pro- and anti-inflammatory cytokines and CD200 in cerebellar lysates at day 62 p.i. (A,B) IL-1β and IL-6 expression were less in Fgfr1ind−/− mice. IL-4, IL-12, IL-17, TNF-α, and IFNγ expressions were not different between controls and Fgfr1ind−/− mice. (C,D) CD200 expression was reduced in Fgfr1ind−/− mice. n = 3–4/group. Data are expressed as the mean ± SEM. ns = not significant, * p < 0.05.
2.3. Oligodendroglia-Specific Deletion of FGFR1 Reduces Myelin Loss and Axonal Damage in the Cerebellum
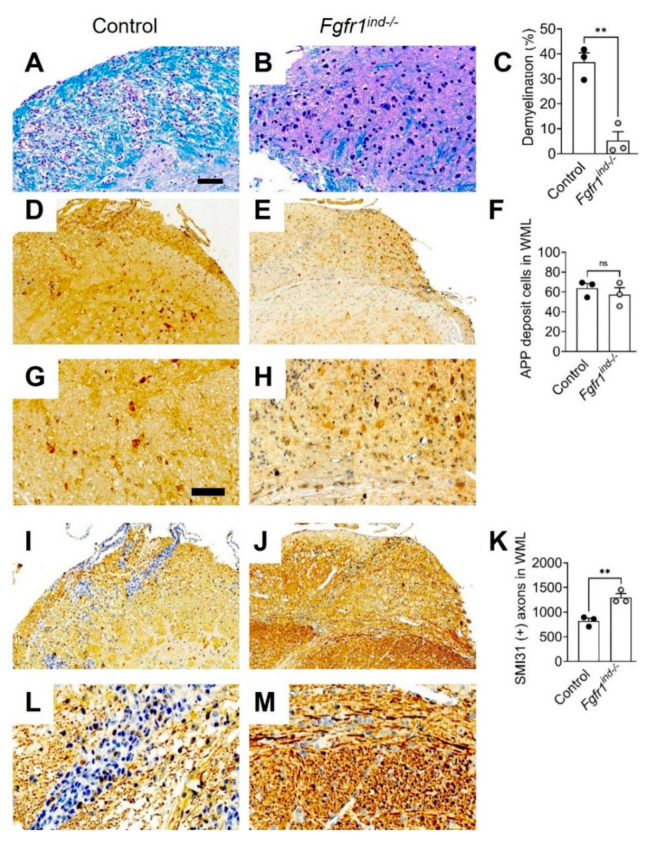
In our recent study Fgfr1ind−/− mice showed less myelin and axon degeneration in the spinal cord at day 62 p.i. [16]. In the cerebellum, myelin loss (p = 0.0034; Figure 3A–C) was reduced in Fgfr1ind−/− mice at day 62 p.i. Although the number of APP(+) axons in WML was not altered at day 62 p.i. (p = 0.4857) (Figure 3D–F; G,H higher magnification), the number of SMI31(+) axons in WML was higher in Fgfr1ind−/− mice than controls (p = 0.0077) (Figure 3I–K; L,M higher magnification).
Figure 3.
Demyelination (A–C) in the cerebellum at day 62 p.i. Demyelination was reduced in Fgfr1ind−/− mice (A–C). Quantification of the number of amyloid precursor protein (APP) (+) and SMI31(+) phosphorylated axons at day 62 p.i. The number of APP (+) axons was not different between controls and Fgfr1ind−/− mice (D–F). The number of SMI31(+) phosphorylated axons were higher in Fgfr1ind−/− mice (I–K). The dark yellow or brown staining was counted as APP and SMI31 positive cells. (G,H,L,M) were higher magnification of (D,E,I,J). Scale bars depicts 100 μm (A,B,D,E,I,J), scale bar depicts 50 μm (G,H,L,M). n = 3/group. Data are expressed as the mean ± SEM., ** p < 0.01.
2.4. Number of Oligodendrocytes in WML and Myelin Expression in the Cerebellum of Fgfr1ind−/− Mice
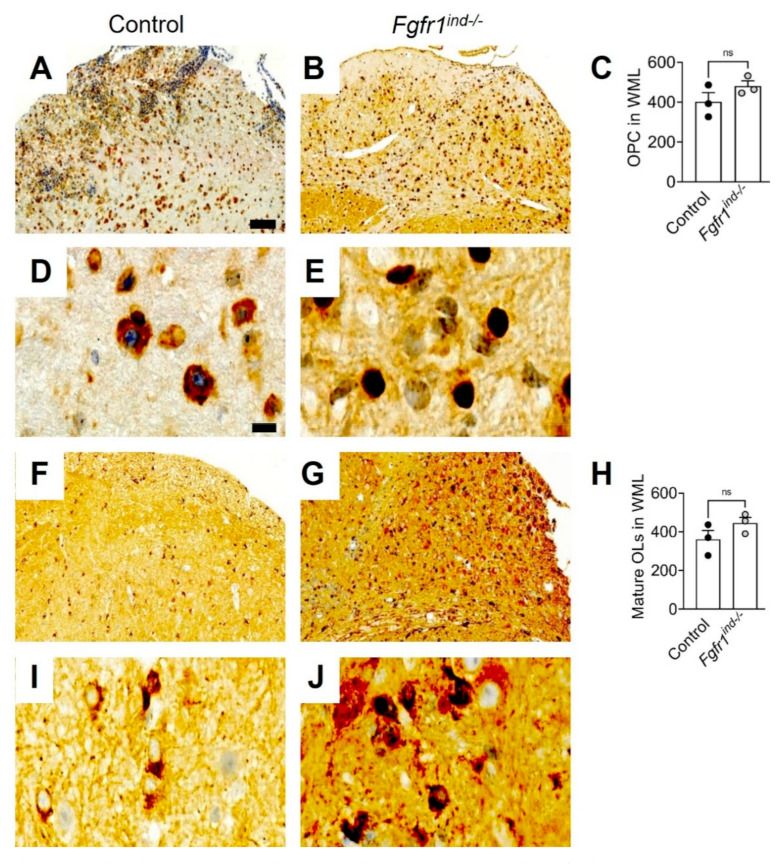
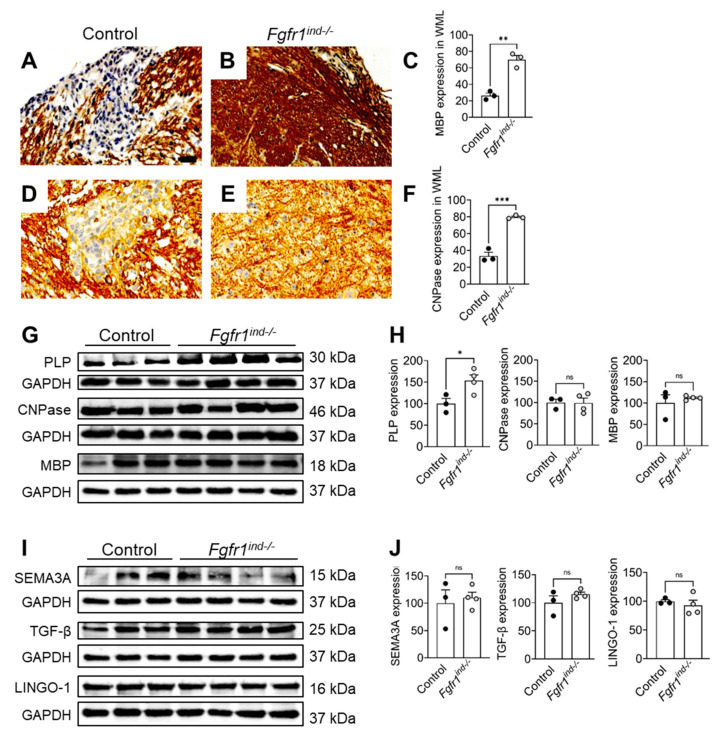
We previously reported there were no alterations in the Olig2(+) (OPCs) and NogoA(+) (mature oligodendrocytes) oligodendroglial populations in spinal cord WML of Fgfr1ind−/− mice [16]. In the cerebellum, FGFR1 deletion did not change the number of olig2(+) (p = 0.2125, Figure 4A–E) or NogoA(+) (p = 0.1998, Figure 4F–J) oligodendrocytes in WML. Expression of MBP (p = 0.0018, Figure 5A–C) and CNPase (p = 0.0005; Figure 5D–F) was higher in Fgfr1ind−/− mice. PLP (p = 0.0334) was increased in the cerebellum of Fgfr1ind−/− mice (Figure 5G,H). There was no effect of FGFR deletion on the myelin proteins CNPase (p = 0.955) and MBP (p = 0.504) (Figure 5G,H), or the myelin inhibitors SEMA3A (p = 0.684), TGFβ (p = 0.238), Lingo-1 (p = 0.537) in the cerebellum (Figure 5I,J).
Figure 4.
Oligodendrocyte populations at day 62 p.i. The number of Olig2(+) and NogoA(+) oligodendrocytes in WML of the cerebellum for controls (A,D,F,I) and Fgfr1ind−/− mice (B,E,G,J). There were no differences in Olig2(+) (A–E) and NogoA(+) (F–H) oligodendrocyte numbers between controls and Fgfr1ind−/− mice. (D,E,I,J) were magnified views of (A,B,F,G). n = 3/group. Scale bar depicts 50 μm (C,D). Data are expressed as the mean ± SEM. ns = not significant.
Figure 5.
Myelin protein and myelin inhibitor expression at day 62 p.i. Increased MBP(+) (A–C) and CNPase(+) cells (D–F) in WML of the cerebellums of Fgfr1ind−/− mice. Myelin protein PLP was upregulated in Fgfr1ind−/− mice (G,H). Myelin proteins CNPase and MBP (G,H), and myelin inhibitors SEMA3A, TGF-β, LINGO-1 (I,J) were not regulated. Cerebellar tissue immunostaining: n = 3/group, cerebellar tissue lysate western blot: n = 3–4/group. Data are expressed as the mean ± SEM. ns = not significant, * p < 0.05, ** p < 0.01, *** p < 0.001.
2.5. FGF/FGFR Signaling Proteins and TrkB/BDNF Protein Expression in the Cerebellum of Fgfr1ind−/− Mice
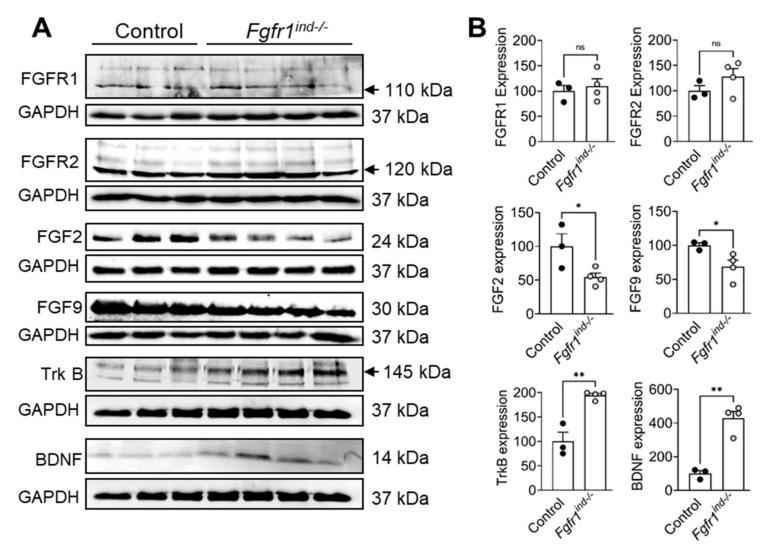
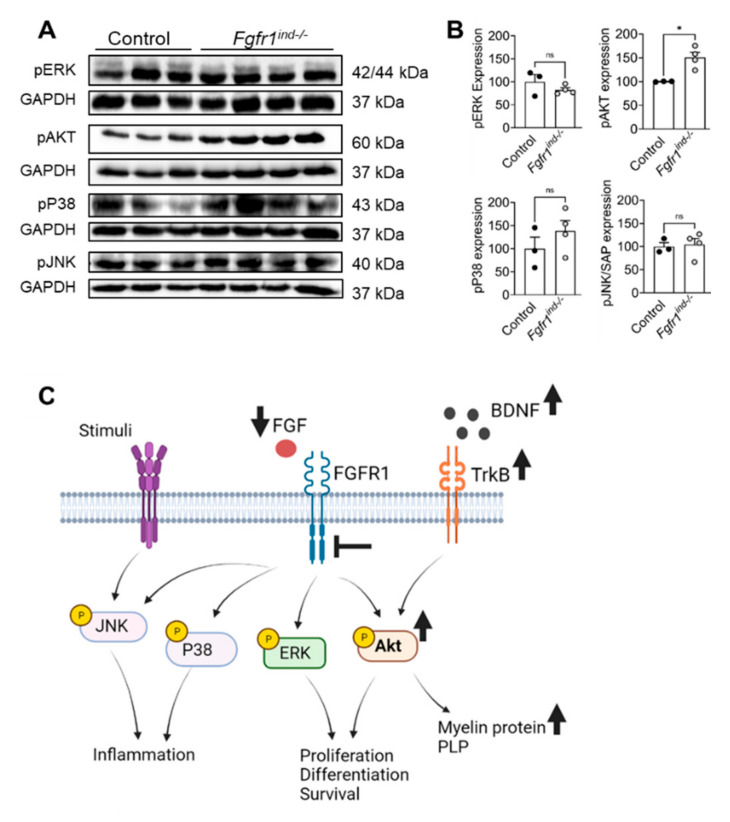
In the present study, we investigated the role of oligodendroglia-specific deletion of FGFR1 on FGF/FGFR signaling proteins and TrkB/BDNF protein expression in cerebellar lysates by western blot. Fgfr1ind−/− mice showed a decrease in the expression of FGF2 (p = 0.0453) and FGF9 (p = 0.0442) (Figure 6A,B). Phosphorylation of Akt (p = 0.0109, Figure 7A,B), and expression of TrkB (p = 0.0023) and BDNF (p = 0.0012) were increased in the cerebellum of Fgfr1ind−/− mice (Figure 6A,B). There was no regulation in phosphorylation of ERK1/2 in the cerebellum (Figure 7A,B).
Figure 6.
FGF/FGFR1 signaling and BDNF/TrkB expression in the cerebellum at day 62 p.i. FGFR1 and FGFR2 protein expression was not different between Fgfr1ind−/− mice and controls. The FGFR ligands FGF2 and FGF9 were decreased in Fgfr1ind−/− mice. BDNF and TrkB protein expression was increased in Fgfr1ind−/− mice (A,B). n = 3–4/group. Data are expressed as the mean ± SEM. ns = not significant, * p < 0.05, ** p < 0.01.
Figure 7.
FGFR1 downstream protein expression in the cerebellum at day 62 p.i. (A,B). Phosphorylation of Akt was increased in Fgfr1ind−/− mice. ERK, P38 and JNK phosphorylation was not different between Fgfr1ind−/− mice and controls. n = 3–4/group. Data are expressed as the mean ± SEM. ns = not significant, * p < 0.05. Graphical abstract (C): deletion of FGFR1 leads to increase of the myelin protein PLP via increasing phosphorylation of Akt, TrkB and BDNF expression.
3. Discussion
In the present EAE study, we investigated the function of FGFR1 in the cerebellum by generating an inducible and cell-specific deletion of FGFR1 in oligodendrocytes. At day 62 p.i. chronic phase of EAE, myelin and axon degeneration were less severe; furthermore, lymphocyte and macrophage/microglia cell infiltration reduced. Further analyses revealed enhanced expression of the FGF/FGFR1 signaling molecule Akt activation, upregulation of BDNF/TrkB, and reduced expression of proinflammatory cytokines.
In MS and its EAE model, inflammatory infiltrates cause destruction of oligodendrocytes and myelin sheaths [37]. In EAE, oligodendrocytes directly involved in inflammation and immune modulation in the CNS [38]. FGFs (1, 2, 3, 21, 23)/FGFRs (FGFR1) play important roles in the regulation of inflammatory responses in various diseases including multiple sclerosis [39]. In the spinal cord, oligodendroglia FGFR1 and FGFR2 mice showed less infiltrating CD3(+) T-cells, B220(+) B-cells, and Mac3(+) macrophages/activated microglia during chronic phase of EAE. In agreement with recent findings in the spinal cord, the number of infiltrating CD3(+) T-cells, B220(+) B-cells, Mac3(+) macrophages/activated microglia, or IgG producing plasma cells were reduced in the cerebellum of Fgfr1ind−/− mice. Our data supports the notion that FGFR1 may directly influence the immune cell infiltration in the cerebellum.
At day 62 p.i., Fgfr1ind−/− mice showed less FGF2 and FGF9 expression in the cerebellum. To date, it is unclear why deletion of FGFRs in oligodendrocytes causes a reduction in inflammation in the spinal cord and the cerebellum [15,16]. One may speculate that deletion of FGFRs results in a reduction of FGF2 and FGF9 by regulating the downstream signaling of ERK and Akt, which may reduce inflammation by altering the proinflammatory cytokines. In the cerebellum, the proinflammatory cytokines IL1β and IL6 were reduced in Fgfr1ind−/− mice at day 62 p.i. Cytokines play a key role in recruiting activated immune cells into the CNS [40,41,42]. IL1β plays a role in neuronal degeneration via p53-mediated apoptosis of neurons [43]. IL1β-deficient mice are resistant to EAE [44], and IL1β promotes differentiation of pathogenic Th17 and lymphocyte trafficking into the CNS [45]. FGF2 was downregulated in this study. FGF2 enhances the inflammatory response of monocytes/macrophages, which increases the concentrations of cellular IL-1β in human vascular smooth muscle cells [39]. IL6-deficient animals are fully resistant to EAE [46] and astrocytic deletion of IL-6 leads less inflammatory infiltrates and decreased demyelination in the spinal cord at day 20 p.i [47]. These findings demonstrate that reduced FGF expression was associated with less inflammation and reduced proinflammatory cytokines in the cerebellum of Fgfr1ind−/− mice.
FGF2 induces downregulation of myelin proteins in vitro [48]. In contrast, conditional deletion of either FGF2 or FGFR enhances remyelination in the cuprizone demyelination model at 12 weeks of cuprizone ingestion. Extended and elevated expression of FGF9 causes failure of remyelination [49]. In vitro, inhibition of FGFR in oligodendrocytes enhances myelin protein expression of PLP and CNPase [50]. Consistent with the cuprizone demyelination model and oligodendrocyte cell culture findings, our results demonstrate that oligodendrocyte-specific deletion of FGFR1 in MOG35-55-induced EAE leads to increased PLP expression in the cerebellum and less FGF2 and FGF9 at day 62 p.i. Two different stains were used to assess axonal damage in the cerebellum, namely SMI-31 (NF-H) and APP. To investigate the extent of neurofilaments in the cerebellum, tissues were stained with the SMI31 antibodies. APP is a well-characterized marker to detect axonal injury in neurodegenerative diseases such as MS [51,52]. In damaged axons, the accumulation of APP occurs in case of a disturbed fast axonal transport. Analysis of axonal structure revealed that there were increased phosphorylated neurofilaments in Fgfr1ind−/− mice cerebellums. This indicates that FGFR1 deletion in oligodendrocytes protected myelin against inflammation and resulted in reduction of axon degeneration and myelin loss in during EAE.
FGFR1 is upregulated in OPCs in active and chronic demyelinating lesions in the cortical and periventricular brain tissue of MS patients [12]. Further, extensive demyelination was present in the cerebellum of patients with progressive MS [25]. In cuprizone and lysolecithin models, FGFR1/2 double knockout mice showed less differentiated oligodendrocytes and suppressed myelin recovery [53]. In our previous EAE studies, we found oligodendrocyte-specific deletion of FGFR1 and FGFR2 does not alter oligodendroglial cell numbers in the spinal cord. In agreement with these recent studies, we did not observe an effect on the number of OPC or mature oligodendrocytes in the cerebellar WML at day 62 p.i. These findings suggest that the impaired FGFR1 in oligodendrocytes does not inhibit oligodendrocyte differentiation in the cerebellum during EAE. The differences in the findings of oligodendrocyte populations could be the lack of inflammatory signals in the cuprizone and lysolecithin model in comparison to the inflammatory environment in the EAE model.
In the cerebellum, Fgfr1ind−/− mice show increased Akt phosphorylation, which is known to modulate inflammation and TrkB/BDNF expression and enhance myelination in the EAE model. In our previous studies, Fgfr1ind−/− mice had an increased expression of TrkB and increased phosphorylation of downstream Akt kinase in the spinal cord [15,16]. Akt kinase is a key downstream protein that regulates inflammation [54], and continuous activation of Akt in oligodendrocytes increases myelin synthesis [55]. Due to the suppressive character of Akt2 on the expression of Th1/Th17 cells by increasing the number of T regulatory cells [56,57], a loss of Akt3 leads to severe EAE symptoms and reduces neuroregeneration [58]. Compared to our previous study on the effects of FGFR1 knockout in the spinal cord [16], we could not find an increased phosphorylation of ERK1/2 in the cerebellum. The importance of the functional ERK signaling for adequate remyelination and axon integrity were described in several investigations [59,60]. However, there might be an alternative pathway to ensure sufficient remyelination or decrease axonal loss without upregulation of ERK. Increased expression of BDNF and its corresponding receptor TrkB could possibly enhance remyelination [61].
4. Methods
4.1. Ethics Statement
All scientific procedures on animals were approved by the regional council of Hesse, Giessen, Germany (GI 20/23-Nr. 31/2008) in accordance with the German animal welfare act and the European legislation for the protection of animals used for scientific purposes (2010/63/EU). AVMA guidelines for the euthanasia of animals were followed. Animal studies were performed according to the guidelines of FELASA. All efforts were made to minimize pain and suffering
4.2. Generation of Cell-Specific FGFR1 Knockout Mice
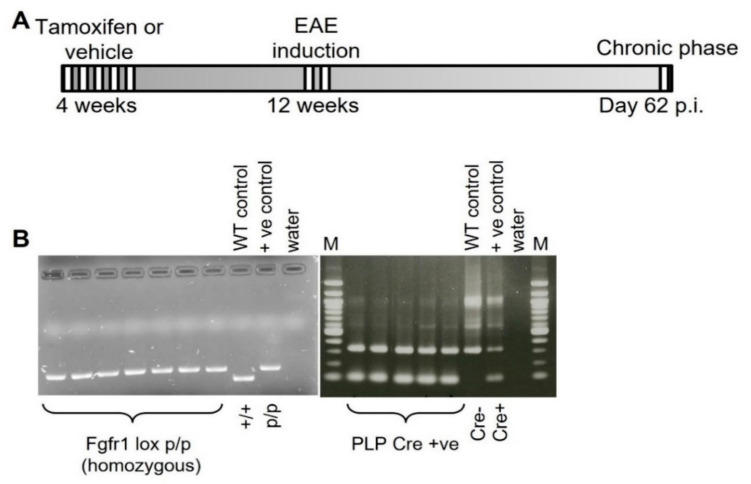
To study the cell-specific function of FGFR1 in EAE, a conditional knockout of FGFR1 in oligodendrocytes was generated. A detailed description of the generation of B6.Cg-Tg(PLP1-cre/ERT)3Pop:Fgfr1tm5.1Sor mice has been reported previously [16]. Briefly, B6;129S4-Fgfr1tm5.1Sor/J mice (The Jackson Laboratories, Bar Harbor, ME, USA) were crossbred with B6.Cg-Tg(Plp1-cre/ERT)3Pop/J mice (The Jackson Laboratories, Bar Harbor, ME, USA) and backcrossed to a C57BL/6J background. For induction of the Cre recombinase, 4-week-old B6.Cg-Tg(PLP1-cre/ERT)3Pop Fgfr1tm5.1Sor recipient female mice received i.p. injections of 1 mg of tamoxifen (Sigma-Aldrich, Steinheim, Germany) in a sunflower oil/ethanol mixture daily over 5 consecutive days (referred to as Fgfr1ind−/− mice). B6.Cg-Tg(PLP1-cre/ERT)3Pop Fgfr1tm5.1Sor littermate controls received a sunflower oil/ethanol mixture (referred to as controls) (Figure 8A). To confirm deletion of the FGFR1 floxed allele and the PLP transgene, genomic DNA was isolated (DirectPCR-Tail, Peqlab, Erlangen, Germany) and mice were genotyped by PCR as recommended by The Jackson Laboratories. PCR products were detected by agarose gel electrophoresis (Peqlab, Erlangen, Germany) (Figure 8B).
Figure 8.
Experimental design of tamoxifen-induced conditional deletion of Fgfr1 in oligodendrocytes and EAE induction with the MOG35-55 peptide. (A) In 4-week-old female B6.Cg-Tg(PLP1-cre/ERT)3Pop Fgfr1tm5.1Sor mice, tamoxifen was administered to induce nuclear translocation of the Cre recombinase fusion protein and subsequent deletion of floxed gene alleles. (B) Confirmation of FGFR1 lox and PLP-Cre expression in mutant mice by PCR and agarose gel electrophoresis. EAE was induced with the MOG35-55 peptide at 8–12 weeks of age, and samples were collected on day 62 p.i.
4.3. Induction and Clinical Assessment of MOG35-55-Induced EAE
Induction and clinical evaluation of EAE was done as previously described [15,16]. Briefly, 8- to 12-week-old female Fgfr1ind−/− and control mice were injected subcutaneously in the flank with 300 µg of myelin oligodendrocyte glycoprotein peptide (MOG35-55; Charité Hospital, Berlin, Germany) that was emulsified in complete Freund’s adjuvant (Sigma, Steinheim, Germany) containing 10 mg of Mycobacterium tuberculosis (Difco, Detroit, MI, USA). Pertussis toxin was administered i.p. on days 0 and 2 postimmunization (p.i.). Symptoms were evaluated using a scale that ranged from 0 to 5 as described and presented earlier [16]. Mice were sacrificed in the chronic phase of EAE on day 62 postimmunization.
4.4. Histology and Immunohistochemistry
Fgfr1ind−/− mice and controls were anesthetized and transcardially perfused with 4% paraformaldehyde on day 62 p.i. The cerebellum was dissected, embedded in paraffin blocks, and stained for inflammatory infiltrates (hematoxylin and eosin) and myelin loss (Luxol fast blue/periodic acid-Schiff) as described recently [16]. For immunohistochemistry, the cerebellum was deparaffinized, rehydrated, and antigen retrieval was performed by boiling the sections in citrate buffer (10 mM, pH 6). Macrophages/activated microglia (Mac 3, clone M3/84, 1:200, Pharmingen, San Diego, CA, USA), activated B cells (B220, clone RA3-6B2, 1:200, Pharmingen, San Diego, CA, USA), T cells (CD3, clone CD3-12, 1:150, Serotec, Oxford, UK), Olig2(+), and NogoA(+) oligodendrocyte populations (Olig 2, 1:300, IBL, Gunma, Japan; NogoA(+), 1:50, Santa Cruz Biotechnology, CA, USA) were stained. To analyze the axonal damage or swelling and neurofilaments associated with axonal diameter, sections were stained with APP (1:500; Merck Millipore, Darmstadt, Germany) and SMI31 (1:500; Pharmingen, San Diego, CA, USA) antibodies. Sections were counterstained with hematoxylin, signals were detected by incubation with an avidin-biotin complex. Microscopic images were captured using Axio Scan Z1 Microscope (Carl Zeiss, Göttingen, Germany) with the ZEN software (ZEN 3.1, Carl Zeiss Microscopy GmbH, Jena, Germany). The average numbers of positive cells were normalized to an area of 1 mm2.
4.5. Protein Extraction and Western Blot Analysis
The cerebellum from Fgfr1ind−/− mice and controls were separately homogenized in an ice-cold lysis buffer with TissueRuptor (Qiagen Instruments, Hombrechtikon, Switzerland). The amount of protein was quantified (Pierce® BCA Protein Assay Kit, Thermo Scientific, IL, USA) and normalized. Protein was loaded and separated by 10% SDS-PAGE and transferred (Trans Blot, Semi-dry Transfer cell, BioRad) to a nitrocellulose membrane (GE Healthcare, AmershamTM Hybond ECL, Buckinghamshire, UK). The membranes were incubated overnight at 4 °C with the target-specific primary antibodies (Table 1). After that, membranes were incubated with respective secondary antibodies (Table 1) and developed with SuperSignal West Pico Chemiluminescent Substrate (Thermo, Pierce Biotechnology, Rockford, IL, USA) using an ECL ChemoCam Imager (INTAS Science Imaging Instruments GmbH, Göttingen, Germany). GAPDH (Santa Cruz Biotechnology, CA, USA) (Table 1) was used as a loading control; proteins were analyzed using the ImageJ 1.53b software (National Institute of Health, Bethesda, MD, USA).
Table 1.
List of antibodies used for Western blot and IHC.
| Primary Antibodies | Host | Mol. Weight | Method | Art. No | Manufacturer |
|---|---|---|---|---|---|
| Anti-FGF2 (G2) | Mouse | 18, 21, 24 kDa | WB | sc-365106 | Santa Cruz Biotech, CA, USA |
| Anti-FGF9 (D8) | Mouse | 30 kDa | WB | sc-8413 | Santa Cruz Biotech, CA, USA |
| Anti-CNPase (B1) | Mouse | 46 kDa | WB | sc-166019 | Santa Cruz Biotech, CA, USA |
| Anti-MBP | Mouse | 12, 18 kDa | WB | 78896S | Cell Signaling Tech, MA, USA |
| Anti-PLP | Rabbit | 30 kDa | WB | 85971 | Cell Signaling Tech, MA, USA |
| Anti-pERK p-44/42 | Rabbit | 44, 42 kDa | WB | 4370s | Cell Signaling Tech, MA, USA |
| Anti-pAkt (Ser473) | Rabbit | 60 kDa | WB | 4060s | Cell Signaling Tech, MA, USA |
| Anti-Flg (M2F12) (FGFR1) | Rabbit | 110 kDa | WB | sc-57132 | Santa Cruz Biotech, CA, USA |
| Anti-Bek (C-8) (FGFR2) | Rabbit | 120 kDa | WB | sc-6930 | Santa Cruz Biotech, CA, USA |
| Anti-GAPDH | Mouse | 37 kDa | WB | sc-365062 | Santa Cruz Biotech, CA, USA |
| Anti-Trk B (794):sc12 | Rabbit | 145 kDa | WB | sc-377218 | Santa Cruz Biotech, CA, USA |
| Anti-pro BDNF | Rabbit | 14 kDa | WB | sc-65514 | Santa Cruz Biotech, CA, USA |
| Anti-IL-1β | Mouse | 17, 31 kDa | WB | 12242 | Cell Signaling Tech, MA, USA |
| Anti-IL-4 | Mouse | 18 kDa | WB | sc-53084 | Santa Cruz Biotech, CA, USA |
| Anti-IL-6 | Rabbit | 24 kDa | WB | 12912 | Cell Signaling Tech, MA, USA |
| Anti-IL-12 | Rat | 70 kDa | WB | sc-65355 | Santa Cruz Biotech, CA, USA |
| Anti-IL-17 | Mouse | 15 kDa | WB | sc-374218 | Santa Cruz Biotech, CA, USA |
| Anti-TNFα | Rabbit | 17, 25, 28 kDa | WB | 11948 | Cell Signaling Tech, MA, USA |
| Anti-IFNγ | Rat | 16 kDa | WB | MM700 | Thermo Fisher Scientific, Waltham, MA, USA |
| Anti-Lingo-1 | Rabbit | 98 kDa | WB | 49389 | Cell Signaling Tech, MA, USA |
| Anti-TGF-β | Rabbit | 12, 25, 45–65 kDa | WB | 3711 | Cell Signaling Tech, MA, USA |
| Anti-SEMA3A | Rabbit | 89 kDa | WB | Ab23393 | Abcam, Cambridge, UK |
| Anti-CD200 | Goat | 42 kDa | WB | AF2724 | R&D Systems, MN, USA |
| Anti-pP38 | Rabbit | 43 kDa | WB | 9215 | Cell Signaling Tech, MA, USA |
| Anti-pJNK | Rabbit | 46, 54 kDa | WB | 4668 | Cell Signaling Tech, MA, USA |
| Mac 3 Clone M3/84 | Rat | staining | IHC | 553322 | Pharmingen, USA |
| B220 clone RA3-6B2 | Rat | staining | IHC | 557390 | Pharmingen, USA |
| CD3, clone CD3-12 | Rat | staining | IHC | MCA 1477 | Serotec, UK |
| MBP | Rabbit | staining | IHC | 62301 | Dako, Germany |
| Olig2 | Mouse | staining | IHC | MABN50 | MerckMillipore, Germany |
| Nogo-A | Rabbit | staining | IHC | sc-25660 | Santa Cruz Biotech, CA, USA |
| MBP | Rabbit | staining | IHC | 62301 | Dako, Germany |
| CNPase | Mouse | staining | IHC | SMI-91R | Covance Inc., NJ, USA |
| APP | Mouse | staining | IHC | MAB348 | Merck KGaA, Darmstadt, Germany |
| SMI31 | Mouse | staining | IHC | SMI-31R | Covance Inc., NJ, USA |
| Secondary Antibodies | Host | Method | Art. No | Manufacturer | |
| Anti-Rabbit-HRP | Goat | WB | 7074 | Cell Signaling Tech, MA, USA | |
| Anti-mouse-HRP | Horse | WB | 7076 | Cell Signaling Tech, MA, USA | |
| Mouse anti-goat | Mouse | WB | SC-2354 | Santa Cruz Biotech, CA, USA | |
| Goat anti-rat | Goat | WB | 7077 | Cell Signaling Tech, MA, USA | |
4.6. Statistics
All analyses were performed blinded to the genotype. For histology and immunohistochemistry, positively labelled cells in lesions from the cerebellum were counted. Numbers of animals per group are noted in the figure legends. Student’s t-tests were performed to indicate differences between the genotypes. Statistical significance was set at p ≤ 0.05. Values are expressed as mean ± SEM. * indicates p < 0.05, ** indicates p < 0.01, *** indicates p < 0.001. Statistical analysis and graphs were prepared using the GraphPad Prism 9 (GraphPad Software, San Diego, CA, USA).
5. Conclusions
In the cerebellum, cell-specific deletion of FGFR1 in oligodendrocytes exhibited less axonal damage, less myelin loss, and decreased inflammation in EAE. These effects in the cerebellum were associated by changes in FGF/FGFR signaling, increased BDNF/TrkB and PLP expression. Impaired FGFR1 signaling was associated with reduced expression of proinflammatory cytokines such as IL1β and IL6. In addition, reduced expression of FGF2 and FGF9 as well as increased phosphorylation of Akt were found in FGFR1 knockout mice cerebellums. Furthermore, FGFR1 deletion has no effect on the number of oligodendrocytes. Taken together, inhibiting FGF receptors in the CNS may protect the cerebellum against inflammation and degeneration.
Acknowledgments
We thank Salar Kamali and Liza Mittal for help with animal experiments. We thank Olga Kowatsch for excellent technical assistance.
Author Contributions
Conceptualization, M.B. and R.R.; methodology, R.R., V.R., M.G.-V., C.S. and M.B.; validation, formal analysis, investigation, R.R., V.R., S.K. and M.B.; writing—original draft preparation and review and editing, R.R., V.R., F.-F.M., F.G., C.S., S.K. and M.B.; supervision, M.B.; project administration, M.B.; funding acquisition, M.B. All authors have read and agreed to the published version of the manuscript.
Funding
The study was supported by Merck Serono GmbH, Darmstadt, Germany.
Institutional Review Board Statement
The study was conducted according to the guidelines of Justus Liebig University, Giessen, and approved by regional council of Hesse, Giessen, Germany (GI 20/23-Nr. 31/2008, approved on 19 August 2008) in accordance with the German animal welfare act and the European legislation for the protection of animals.
Data Availability Statement
The data presented in this study are available upon request to corresponding author.
Conflicts of Interest
The authors declare no competing financial interest.
Footnotes
Publisher’s Note: MDPI stays neutral with regard to jurisdictional claims in published maps and institutional affiliations.
References
- 1.Lassmann H., Bradl M. Multiple sclerosis: Experimental models and reality. Acta Neuropathol. 2017;133:223–244. doi: 10.1007/s00401-016-1631-4. [DOI] [PMC free article] [PubMed] [Google Scholar]
- 2.Skaper S.D. Oligodendrocyte precursor cells as a therapeutic target for demyelinating diseases. Prog. Brain Res. 2019;245:119–144. doi: 10.1016/bs.pbr.2019.03.013. [DOI] [PubMed] [Google Scholar]
- 3.Tripathi R.B., Rivers L.E., Young K.M., Jamen F., Richardson W.D. NG2 glia generate new oligodendrocytes but few astrocytes in a murine experimental autoimmune encephalomyelitis model of demyelinating disease. J. Neurosci. 2010;30:16383–16390. doi: 10.1523/JNEUROSCI.3411-10.2010. [DOI] [PMC free article] [PubMed] [Google Scholar]
- 4.Zawadzka M., Rivers L.E., Fancy S.P., Zhao C., Tripathi R., Jamen F., Young K., Goncharevich A., Pohl H., Rizzi M., et al. CNS-resident glial progenitor/stem cells produce Schwann cells as well as oligodendrocytes during repair of CNS demyelination. Cell Stem Cell. 2010;6:578–590. doi: 10.1016/j.stem.2010.04.002. [DOI] [PMC free article] [PubMed] [Google Scholar]
- 5.Boyd A., Zhang H., Williams A. Insufficient OPC migration into demyelinated lesions is a cause of poor remyelination in MS and mouse models. Acta Neuropathol. 2013;125:841–859. doi: 10.1007/s00401-013-1112-y. [DOI] [PMC free article] [PubMed] [Google Scholar]
- 6.Dutta R., Trapp B.D. Mechanisms of neuronal dysfunction and degeneration in multiple sclerosis. Prog. Neurobiol. 2011;93:1–12. doi: 10.1016/j.pneurobio.2010.09.005. [DOI] [PMC free article] [PubMed] [Google Scholar]
- 7.Goldschmidt T., Antel J., König F.B., Brück W., Kuhlmann T. Remyelination capacity of the MS brain decreases with disease chronicity. Neurology. 2009;72:1914–1921. doi: 10.1212/WNL.0b013e3181a8260a. [DOI] [PubMed] [Google Scholar]
- 8.Hagemeier J., Heininen-Brown M., Poloni G.U., Bergsland N., Magnano C.R., Durfee J., Kennedy C., Carl E., Weinstock-Guttman B., Dwyer M.G., et al. Iron deposition in multiple sclerosis lesions measured by susceptibility-weighted imaging filtered phase: A case control study. J. Magn. Reson. Imaging. 2012;36:73–83. doi: 10.1002/jmri.23603. [DOI] [PubMed] [Google Scholar]
- 9.Hollingsworth E., Khouri J., Imitola J. Endogenous repair and development inspired therapy of neurodegeneration in progressive multiple sclerosis. Expert Rev. Neurother. 2017;17:611–629. doi: 10.1080/14737175.2017.1287564. [DOI] [PubMed] [Google Scholar]
- 10.Saraswat D., Shayya H.J., Polanco J.J., Tripathi A., Welliver R.R., Pol S.U., Seidman R.A., Broome J.E., O’Bara M.A., van Kuppervelt T.H., et al. Overcoming the inhibitory microenvironment surrounding oligodendrocyte progenitor cells following experimental demyelination. Nat. Commun. 2021;12:1923. doi: 10.1038/s41467-021-22263-4. [DOI] [PMC free article] [PubMed] [Google Scholar]
- 11.Koutsoudaki P.N., Papadopoulos D., Passias P.G., Koutsoudaki P., Gorgoulis V.G. Cellular senescence and failure of myelin repair in multiple sclerosis. Mech. Ageing Dev. 2020;192:111366. doi: 10.1016/j.mad.2020.111366. [DOI] [PubMed] [Google Scholar]
- 12.Clemente D., Ortega M.C., Arenzana F.J., de Castro F. FGF-2 and Anosmin-1 are selectively expressed in different types of multiple sclerosis lesions. J. Neurosci. 2011;31:14899–14909. doi: 10.1523/JNEUROSCI.1158-11.2011. [DOI] [PMC free article] [PubMed] [Google Scholar]
- 13.Thummler K., Rom E., Zeis T., Lindner M., Brunner S., Cole J.J., Arseni D., Mucklisch S., Edgar J.M., Schaeren-Wiemers N., et al. Polarizing receptor activation dissociates fibroblast growth factor 2 mediated inhibition of myelination from its neuroprotective potential. Acta Neuropathol. Commun. 2019;7:212. doi: 10.1186/s40478-019-0864-6. [DOI] [PMC free article] [PubMed] [Google Scholar]
- 14.Sarchielli P., Di Filippo M., Ercolani M.V., Chiasserini D., Mattioni A., Bonucci M., Tenaglia S., Eusebi P., Calabresi P. Fibroblast growth factor-2 levels are elevated in the cerebrospinal fluid of multiple sclerosis patients. Neurosci. Lett. 2008;435:223–228. doi: 10.1016/j.neulet.2008.02.040. [DOI] [PubMed] [Google Scholar]
- 15.Kamali S., Rajendran R., Stadelmann C., Karnati S., Rajendran V., Giraldo-Velasquez M., Berghoff M. Oligodendrocyte-specific deletion of FGFR2 ameliorates MOG35-55 -induced EAE through ERK and Akt signalling. Brain Pathol. 2021;31:297–311. doi: 10.1111/bpa.12916. [DOI] [PMC free article] [PubMed] [Google Scholar]
- 16.Rajendran R., Giraldo-Velasquez M., Stadelmann C., Berghoff M. Oligodendroglial fibroblast growth factor receptor 1 gene targeting protects mice from experimental autoimmune encephalomyelitis through ERK/AKT phosphorylation. Brain Pathol. 2018;28:212–224. doi: 10.1111/bpa.12487. [DOI] [PMC free article] [PubMed] [Google Scholar]
- 17.Parmar K., Stadelmann C., Rocca M.A., Langdon D., D’Angelo E., D’Souza M., Burggraaff J., Wegner C., Sastre-Garriga J., Barrantes-Freer A., et al. The role of the cerebellum in multiple sclerosis-150 years after Charcot. Neurosci. Biobehav. Rev. 2018;89:85–98. doi: 10.1016/j.neubiorev.2018.02.012. [DOI] [PubMed] [Google Scholar]
- 18.Kalron A., Givon U., Frid L., Dolev M., Achiron A. Static Posturography and Falls According to Pyramidal, Sensory and Cerebellar Functional Systems in People with Multiple Sclerosis. PLoS ONE. 2016;11:e0164467. doi: 10.1371/journal.pone.0164467. [DOI] [PMC free article] [PubMed] [Google Scholar]
- 19.Makhoul K., Ahdab R., Riachi N., Chalah M.A., Ayache S.S. Tremor in Multiple Sclerosis-An Overview and Future Perspectives. Brain Sci. 2020;10:722. doi: 10.3390/brainsci10100722. [DOI] [PMC free article] [PubMed] [Google Scholar]
- 20.Haines J.D., Inglese M., Casaccia P. Axonal damage in multiple sclerosis. Mt. Sinai J. Med. 2011;78:231–243. doi: 10.1002/msj.20246. [DOI] [PMC free article] [PubMed] [Google Scholar]
- 21.Mazumder R., Murchison C., Bourdette D., Cameron M. Falls in people with multiple sclerosis compared with falls in healthy controls. PLoS ONE. 2014;9:e107620. doi: 10.1371/journal.pone.0107620. [DOI] [PMC free article] [PubMed] [Google Scholar]
- 22.Amato M.P., Ponziani G. A prospective study on the prognosis of multiple sclerosis. Neurol. Sci. 2000;21(Suppl. 2):S831–S838. doi: 10.1007/s100720070021. [DOI] [PubMed] [Google Scholar]
- 23.Scalfari A., Neuhaus A., Daumer M., Muraro P.A., Ebers G.C. Onset of secondary progressive phase and long-term evolution of multiple sclerosis. J. Neurol. Neurosurg. Psychiatry. 2014;85:67–75. doi: 10.1136/jnnp-2012-304333. [DOI] [PubMed] [Google Scholar]
- 24.Mandolesi G., Gentile A., Musella A., Fresegna D., De Vito F., Bullitta S., Sepman H., Marfia G.A. Synaptopathy connects inflammation and neurodegeneration in multiple sclerosis. Nat. Rev. Neurol. 2015;11:711–724. doi: 10.1038/nrneurol.2015.222. [DOI] [PubMed] [Google Scholar]
- 25.Weier K., Banwell B., Cerasa A., Collins D.L., Dogonowski A.M., Lassmann H., Quattrone A., Sahraian M.A., Siebner H.R., Sprenger T. The role of the cerebellum in multiple sclerosis. Cerebellum. 2015;14:364–374. doi: 10.1007/s12311-014-0634-8. [DOI] [PubMed] [Google Scholar]
- 26.Schreck L., Ryan S., Monaghan P. Cerebellum and cognition in multiple sclerosis. J. Neurophysiol. 2018;120:2707–2709. doi: 10.1152/jn.00245.2018. [DOI] [PubMed] [Google Scholar]
- 27.Wilkins A. Cerebellar Dysfunction in Multiple Sclerosis. Front. Neurol. 2017;8:312. doi: 10.3389/fneur.2017.00312. [DOI] [PMC free article] [PubMed] [Google Scholar]
- 28.Hamilton A.M., Forkert N.D., Yang R., Wu Y., Rogers J.A., Yong V.W., Dunn J.F. Central nervous system targeted autoimmunity causes regional atrophy: A 9.4T MRI study of the EAE mouse model of Multiple Sclerosis. Sci. Rep. 2019;9:8488. doi: 10.1038/s41598-019-44682-6. [DOI] [PMC free article] [PubMed] [Google Scholar]
- 29.Muller D.M., Pender M.P., Greer J.M. A neuropathological analysis of experimental autoimmune encephalomyelitis with predominant brain stem and cerebellar involvement and differences between active and passive induction. Acta Neuropathol. 2000;100:174–182. doi: 10.1007/s004019900163. [DOI] [PubMed] [Google Scholar]
- 30.Muller M., Carter S.L., Hofer M.J., Manders P., Getts D.R., Getts M.T., Dreykluft A., Lu B., Gerard C., King N.J., et al. CXCR3 signaling reduces the severity of experimental autoimmune encephalomyelitis by controlling the parenchymal distribution of effector and regulatory T cells in the central nervous system. J. Immunol. 2007;179:2774–2786. doi: 10.4049/jimmunol.179.5.2774. [DOI] [PubMed] [Google Scholar]
- 31.Nitsch L., Petzinna S., Zimmermann J., Schneider L., Krauthausen M., Heneka M.T., Getts D.R., Becker A., Muller M. Astrocyte-specific expression of interleukin 23 leads to an aggravated phenotype and enhanced inflammatory response with B cell accumulation in the EAE model. J. Neuroinflammation. 2021;18:101. doi: 10.1186/s12974-021-02140-z. [DOI] [PMC free article] [PubMed] [Google Scholar]
- 32.Quintana A., Muller M., Frausto R.F., Ramos R., Getts D.R., Sanz E., Hofer M.J., Krauthausen M., King N.J., Hidalgo J., et al. Site-specific production of IL-6 in the central nervous system retargets and enhances the inflammatory response in experimental autoimmune encephalomyelitis. J. Immunol. 2009;183:2079–2088. doi: 10.4049/jimmunol.0900242. [DOI] [PubMed] [Google Scholar]
- 33.Mills J.H., Alabanza L.M., Mahamed D.A., Bynoe M.S. Extracellular adenosine signaling induces CX3CL1 expression in the brain to promote experimental autoimmune encephalomyelitis. J. Neuroinflammation. 2012;9:193. doi: 10.1186/1742-2094-9-193. [DOI] [PMC free article] [PubMed] [Google Scholar]
- 34.Yan Z., Yang W., Parkitny L., Gibson S.A., Lee K.S., Collins F., Deshane J.S., Cheng W., Weinmann A.S., Wei H., et al. Deficiency of Socs3 leads to brain-targeted EAE via enhanced neutrophil activation and ROS production. JCI Insight. 2019;5:e126520. doi: 10.1172/jci.insight.126520. [DOI] [PMC free article] [PubMed] [Google Scholar]
- 35.Johnson T.W., Wu Y., Nathoo N., Rogers J.A., Wee Yong V., Dunn J.F. Gray Matter Hypoxia in the Brain of the Experimental Autoimmune Encephalomyelitis Model of Multiple Sclerosis. PLoS ONE. 2016;11:e0167196. doi: 10.1371/journal.pone.0167196. [DOI] [PMC free article] [PubMed] [Google Scholar]
- 36.MacKenzie-Graham A., Rinek G.A., Avedisian A., Gold S.M., Frew A.J., Aguilar C., Lin D.R., Umeda E., Voskuhl R.R., Alger J.R. Cortical atrophy in experimental autoimmune encephalomyelitis: In vivo imaging. Neuroimage. 2012;60:95–104. doi: 10.1016/j.neuroimage.2011.11.099. [DOI] [PMC free article] [PubMed] [Google Scholar]
- 37.Patel J., Balabanov R. Molecular mechanisms of oligodendrocyte injury in multiple sclerosis and experimental autoimmune encephalomyelitis. Int. J. Mol. Sci. 2012;13:10647–10659. doi: 10.3390/ijms130810647. [DOI] [PMC free article] [PubMed] [Google Scholar]
- 38.Madsen P.M., Desu H.L., de Rivero Vaccari J.P., Florimon Y., Ellman D.G., Keane R.W., Clausen B.H., Lambertsen K.L., Brambilla R. Oligodendrocytes modulate the immune-inflammatory response in EAE via TNFR2 signaling. Brain Behav. Immun. 2020;84:132–146. doi: 10.1016/j.bbi.2019.11.017. [DOI] [PMC free article] [PubMed] [Google Scholar]
- 39.Xie Y., Yang J., Tan Q., Huang S., Jin M., Ni Z., Zhang B., Zhang D., Luo F., Chen H., et al. FGF/FGFR signaling in health and disease. Signal Transduct. Target. Ther. 2020;5:181. doi: 10.1038/s41392-020-00222-7. [DOI] [PMC free article] [PubMed] [Google Scholar]
- 40.Bakhuraysah M.M., Theotokis P., Lee J.Y., Alrehaili A.A., Aui P.M., Figgett W.A., Azari M.F., Abou-Afech J.P., Mackay F., Siatskas C., et al. B-cells expressing NgR1 and NgR3 are localized to EAE-induced inflammatory infiltrates and are stimulated by BAFF. Sci. Rep. 2021;11:2890. doi: 10.1038/s41598-021-82346-6. [DOI] [PMC free article] [PubMed] [Google Scholar]
- 41.Filippi M., Bar-Or A., Piehl F., Preziosa P., Solari A., Vukusic S., Rocca M.A. Multiple sclerosis. Nat. Rev. Dis. Primers. 2018;4:43. doi: 10.1038/s41572-018-0041-4. [DOI] [PubMed] [Google Scholar]
- 42.Sinha S., Boyden A.W., Itani F.R., Crawford M.P., Karandikar N.J. CD8(+) T-Cells as Immune Regulators of Multiple Sclerosis. Front. Immunol. 2015;6:619. doi: 10.3389/fimmu.2015.00619. [DOI] [PMC free article] [PubMed] [Google Scholar]
- 43.Rossi S., Motta C., Studer V., Macchiarulo G., Volpe E., Barbieri F., Ruocco G., Buttari F., Finardi A., Mancino R., et al. Interleukin-1beta causes excitotoxic neurodegeneration and multiple sclerosis disease progression by activating the apoptotic protein p53. Mol. Neurodegener. 2014;9:56. doi: 10.1186/1750-1326-9-56. [DOI] [PMC free article] [PubMed] [Google Scholar]
- 44.Lin C.C., Edelson B.T. New Insights into the Role of IL-1beta in Experimental Autoimmune Encephalomyelitis and Multiple Sclerosis. J. Immunol. 2017;198:4553–4560. doi: 10.4049/jimmunol.1700263. [DOI] [PMC free article] [PubMed] [Google Scholar]
- 45.Rodgers J.M., Miller S.D. Cytokine control of inflammation and repair in the pathology of multiple sclerosis. Yale J. Biol. Med. 2012;85:447–468. [PMC free article] [PubMed] [Google Scholar]
- 46.Gobel K., Ruck T., Meuth S.G. Cytokine signaling in multiple sclerosis: Lost in translation. Mult. Scler. J. 2018;24:432–439. doi: 10.1177/1352458518763094. [DOI] [PubMed] [Google Scholar]
- 47.Erta M., Giralt M., Jimenez S., Molinero A., Comes G., Hidalgo J. Astrocytic IL-6 Influences the Clinical Symptoms of EAE in Mice. Brain Sci. 2016;6:15. doi: 10.3390/brainsci6020015. [DOI] [PMC free article] [PubMed] [Google Scholar]
- 48.Fortin D., Rom E., Sun H., Yayon A., Bansal R. Distinct fibroblast growth factor (FGF)/FGF receptor signaling pairs initiate diverse cellular responses in the oligodendrocyte lineage. J. Neurosci. 2005;25:7470–7479. doi: 10.1523/JNEUROSCI.2120-05.2005. [DOI] [PMC free article] [PubMed] [Google Scholar]
- 49.Rajendran R., Bottiger G., Stadelmann C., Karnati S., Berghoff M. FGF/FGFR Pathways in Multiple Sclerosis and in Its Disease Models. Cells. 2021;10:884. doi: 10.3390/cells10040884. [DOI] [PMC free article] [PubMed] [Google Scholar]
- 50.Rajendran R., Bottiger G., Dentzien N., Rajendran V., Sharifi B., Ergun S., Stadelmann C., Karnati S., Berghoff M. Effects of FGFR Tyrosine Kinase Inhibition in OLN-93 Oligodendrocytes. Cells. 2021;10:1318. doi: 10.3390/cells10061318. [DOI] [PMC free article] [PubMed] [Google Scholar]
- 51.Kuhlmann T., Lingfeld G., Bitsch A., Schuchardt J., Bruck W. Acute axonal damage in multiple sclerosis is most extensive in early disease stages and decreases over time. Brain. 2002;125 Pt 10:2202–2212. doi: 10.1093/brain/awf235. [DOI] [PubMed] [Google Scholar]
- 52.Pierce J.E., Trojanowski J.Q., Graham D.I., Smith D.H., McIntosh T.K. Immunohistochemical characterization of alterations in the distribution of amyloid precursor proteins and beta-amyloid peptide after experimental brain injury in the rat. J. Neurosci. 1996;16:1083–1090. doi: 10.1523/JNEUROSCI.16-03-01083.1996. [DOI] [PMC free article] [PubMed] [Google Scholar]
- 53.Furusho M., Roulois A.J., Franklin R.J., Bansal R. Fibroblast growth factor signaling in oligodendrocyte-lineage cells facilitates recovery of chronically demyelinated lesions but is redundant in acute lesions. Glia. 2015;63:1714–1728. doi: 10.1002/glia.22838. [DOI] [PMC free article] [PubMed] [Google Scholar]
- 54.Tsiperson V., Gruber R.C., Goldberg M.F., Jordan A., Weinger J.G., Macian F., Shafit-Zagardo B. Suppression of inflammatory responses during myelin oligodendrocyte glycoprotein-induced experimental autoimmune encephalomyelitis is regulated by AKT3 signaling. J. Immunol. 2013;190:1528–1539. doi: 10.4049/jimmunol.1201387. [DOI] [PMC free article] [PubMed] [Google Scholar]
- 55.Flores A.I., Narayanan S.P., Morse E.N., Shick H.E., Yin X., Kidd G., Avila R.L., Kirschner D.A., Macklin W.B. Constitutively active Akt induces enhanced myelination in the CNS. J. Neurosci. 2008;28:7174–7183. doi: 10.1523/JNEUROSCI.0150-08.2008. [DOI] [PMC free article] [PubMed] [Google Scholar]
- 56.Hou Y., Wang K., Wan W., Cheng Y., Pu X., Ye X. Resveratrol provides neuroprotection by regulating the JAK2/STAT3/PI3K/AKT/mTOR pathway after stroke in rats. Genes Dis. 2018;5:245–255. doi: 10.1016/j.gendis.2018.06.001. [DOI] [PMC free article] [PubMed] [Google Scholar]
- 57.Ouyang S., Zeng Q., Tang N., Guo H., Tang R., Yin W., Wang A., Tang H., Zhou J., Xie H. Akt-1 and Akt-2 Differentially Regulate the Development of Experimental Autoimmune Encephalomyelitis by Controlling Proliferation of Thymus-Derived Regulatory T Cells. J. Immunol. 2019;202:1441–1452. doi: 10.4049/jimmunol.1701204. [DOI] [PMC free article] [PubMed] [Google Scholar]
- 58.DuBois J.C., Ray A.K., Gruber R.C., Zhang Y., Aflakpui R., Macian-Juan F., Shafit-Zagardo B. Akt3-Mediated Protection Against Inflammatory Demyelinating Disease. Front. Immunol. 2019;10:1738. doi: 10.3389/fimmu.2019.01738. [DOI] [PMC free article] [PubMed] [Google Scholar]
- 59.Ishii A., Furusho M., Dupree J.L., Bansal R. Role of ERK1/2 MAPK signaling in the maintenance of myelin and axonal integrity in the adult CNS. J. Neurosci. 2014;34:16031–16045. doi: 10.1523/JNEUROSCI.3360-14.2014. [DOI] [PMC free article] [PubMed] [Google Scholar]
- 60.Murcia-Belmonte V., Medina-Rodriguez E.M., Bribian A., de Castro F., Esteban P.F. ERK1/2 signaling is essential for the chemoattraction exerted by human FGF2 and human anosmin-1 on newborn rat and mouse OPCs via FGFR1. Glia. 2014;62:374–386. doi: 10.1002/glia.22609. [DOI] [PubMed] [Google Scholar]
- 61.Kopec B.M., Zhao L., Rosa-Molinar E., Siahaan T.J. Non-invasive Brain Delivery and Efficacy of BDNF in APP/PS1 Transgenic Mice as a Model of Alzheimer’s Disease. Med. Res. Arch. 2020;8:2043. doi: 10.18103/mra.v8i2.2043. [DOI] [PMC free article] [PubMed] [Google Scholar]
Associated Data
This section collects any data citations, data availability statements, or supplementary materials included in this article.
Data Availability Statement
The data presented in this study are available upon request to corresponding author.


