

Abstract
Long-term allogeneic hematopoietic cell transplant (allo-HCT) survivors suffer an elevated risk of coronary heart disease (CHD). We conducted a prospective, nonrandomized, cross-sectional study to screen asymptomatic survivors at a single allo-HCT center using cardiac computed tomography (CT) involving coronary CT angiography (CCTA) and the coronary artery calcium (CAC) score. Seventy-nine subjects with a median age of 39 years at allo-HCT and a median follow-up interval of 8 years were evaluated for CHD by Framingham Risk Score (FRS) and cardiac CT. CHD was detected in 33 of 79 (42%) subjects; 91% of lesions were nonobstructive, 19.5% of were noncalcified and 30% had associated valvular calcification. Overall, CAC was significantly superior to FRS in detecting early CHD in allo-HCT survivors [∆C = 0.25; P < 0.0001]. While both FRS and CAC were highly, >95% specific, FRS had a sensitivity, positive and negative predictive values of only 28% (95% CI, 14%–47%), 90% (95% CI, 55%–100%) and 60% (95% CI, 47%–73%), respectively. In contrast, the sensitivity, positive and negative predictive values of CAC were 78% (95% CI, 60%–91%), 96% (95% CI, 80%–100%) and 83% (95% CI, 69%–93%), respectively. Significantly, cardiac CT detected CHD in 23 of the 68 (34%) survivors deemed to have a low Framingham risk. Radiation exposure during cardiac CT was negligible, and there were no adverse events. In conclusion, CAC score with or without CCTA is a safe, feasible and sensitive screening technique for CHD. The FRS greatly underestimates CHD in allo-HCT survivors.
Keywords: Coronary CT angiogram, cardiovascular risk, survivorship, BMT, late effects
1. INTRODUCTION
Substantial improvements in overall outcomes after allogeneic hematopoietic stem cell transplant (allo-HCT), as well as increasing frequency of this curative procedure mandate a reappraisal of late complications in survivors [1]. Delayed transplant-related mortality now exceeds relapse-related mortality rates in long-term allo-HCT survivors [2–5]. Delayed cardiovascular (CV) disease is now recognized as a critical late complication [6]. CV-related mortality occurs with a prolonged latency at a rate of 2- to 4-fold higher than in the general population, with the incidence increasing with time from HCT [7]. CV disease (CVD), which occurs at a rate of 4-fold that of the general population, [7] greatly increases the burden of chronic morbidity in HCT survivors [5]. The increased risk of CVD has been attributed to pre-HCT therapy (e.g. anthracycline chemotherapy, chest radiation), HCT conditioning and CV risk factors (CVRF) (e.g. age, gender, smoking, hypertension, diabetes, dyslipidemia, abnormal body composition) [8,9]. For instance, the rate of dyslipidemias is substantially higher than expected from age-matched general population studies [10,11]. Interestingly, the frequency of arterial events in allo-HCT is far higher than that of autologous HCT [12]. Their occurrence in allo-HCT survivors is premature [13], with a median age at first CV event, such as myocardial infarction, as low as 53 years (range, 35–66 years), [14] far earlier than expected in the general population (67 years) [15]. This strikingly increased CVD risk in HCT survivors along with its premature nature supports an accelerated CV aging phenotype.
Since HCT survivors have an excess of conventional CVRFs as well as modifiable lifestyle characteristics, [16–18] preventive measures are likely to be successful. Current recommendations for long-term monitoring of HCT survivors range from screening by history and physical examination, the aggressive management of modifiable CVRFs to serial echocardiography through the life of a survivor, regardless of symptoms [19,20]. A reliable screening method is therefore warranted to detect subclinical coronary heart disease (CHD), so that preventive measures can be initiated in a timely fashion to diminish the risk of future events. However, CHD screening methods have not been formally validated in allo-HCT survivors, and were determined by the NIH HCT Late Effects Initiative to be a research priority [6].
Risk stratification strategies are employed in the diagnosis and management of CHD to identify patients likely to benefit from revascularization and/or medical treatment. Screening strategies include assessment of clinical risk factors (age, gender, smoking, blood pressure, cholesterol and diabetes) and functional modalities to identify provoked ischemia (stress testing), such as exercise-electrocardiogram, dobutamine stress echocardiography or nuclear myocardial perfusion imaging. Most practitioners rely upon the Framingham Risk Score (FRS)/Adult Treatment Panel III guidelines [21] derived from the general population to determine who should be offered preventive antihypertensive and lipid-lowering therapy. The FRS is based upon clinical risk factors (dyslipidemia, CHD risk equivalents, smoking, hypertension, family history, gender and age) for prediction of the 10-year risk of an individual for developing a CV event (FRS >20%-high, 10–20%-intermediate and <10%-low).
Cardiac computed tomography (CT) is a noninvasive imaging technique for visualizing coronary arteries, and provides comprehensive information regarding coronary anatomy, the presence of obstructive and nonobstructive CHD and plaque characteristics [22]. Coronary CT angiography (CCTA) has high diagnostic accuracy to detect and exclude obstructive CHD with a negative predictive value (NPV) of 98% to 99% [23–26]. In the past decade, the integration of cardiac CT into clinical practice has improved upon traditional clinical risk stratification.
Cardiac CT has two components—CCTA and coronary artery calcium score (CAC). The accuracy of CCTA for diagnosing luminal stenosis (>50%) is comparable to that of invasive coronary angiography (the gold standard for detecting luminal stenosis) [15,24,26]. CAC, a marker of atherosclerotic calcification, is directly proportional to the extent and severity of atherosclerosis [15]. There are two scoring methods: the Agatston calcium score [27], derived by multiplying the calcium area by a number related to the CT density, and the volume score which takes into consideration the density of calcification. CAC has clear, incremental predictive value over the FRS in the general population. Importantly, CAC can be performed independently of CCTA in subjects where angiographic contrast is not desirable.
In a preliminary study of 20 long-term allo-HCT survivors, we showed that cardiac CT was safe and feasible as a screening test [28]. We then extended our initial observations to 79 subjects. To measure the diagnostic accuracy of FRS in HCT survivors we analyzed a discovery cohort (50 subjects) and validated the findings in a cohort of 18 subsequent consecutive subjects, excluding 11 who did not undergo angiography.
2. PATIENTS AND METHODS
2.1. Patients and Study Design
This was a prospective, single institute, nonrandomized, cross-sectional study of a cohort of 79 asymptomatic long-term allo-HCT survivors. All subjects underwent total body irradiation (TBI)-based myeloablative allo-HCT from their HLA-identical siblings at the Hematology Branch of the NHLBI at the National Institutes of Health between September 1993 and May 2013. Subjects gave written informed consent to their long-term evaluation and follow-up on a natural history study as well as a cardiac CT protocol (NHLBI 05-H-0130; ClinicalTrials.gov Identifier NCT00106925; NHLBI 12-H-0141; ClinicalTrials.gov NCT00027170).
All 79 subjects were studied by cardiac CT and were assessed for the Agatston CAC and FRS. However, 11 subjects did not receive angiographic contrast, leaving 68 subjects informative by CCTA.
2.2. Cardiac CT
Electrocardiogram-gated CTA was performed in an axial fashion on a 320-row scanner (Aquilion ONE, Toshiba, Japan) with a gantry rotation time of 0.35s. Oral and intravenous metoprolol (or diltiazem if beta blockers were contraindicated) was administered to achieve a target resting heart rate of 60 beats/min. Nitroglycerin-vasodilated CTA images were acquired after intermittent bolus tracking of iopamidol-370 (Bracco Diagnostics, Princeton, NJ, USA) radiocontrast (1–1.5 mL/kg) in the descending aorta using a trigger threshold of 180 Hounsfield units. To minimize radiation exposure, tube voltage and current were adjusted to body size and volumetric acquisition in an axial manner with prospective electrocardiogram triggered imaging was used when possible [29,30]. Images were reconstructed with 0.5 mm slice thickness and 0.25 mm increment using kernel FC03. Readers were blinded to results of all other testing and used a dedicated workstation (VitreaFX, Vital Images, Minnetonka, MN, USA). Interpretations followed published guidelines.[31] Examinations were prospectively considered positive for obstructive CHD if there was a ≥50 % stenosis in a coronary artery diameter ≥1.5 mm to maintain sensitivity for detecting obstructive CHD due to known limitations in spatial and temporal resolution for CTA [32]. Radiation dose was estimated using a dose–length product conversion factor of 0.014 mSv/ (mGy 9 cm) [30]. The Agatston calcium score was derived as previously described [27].
2.3. CHD Definition
CHD was defined as the presence of lesions on CT angiography. For the 11 subjects without angiography, we used an Agatston CAC score of >0 as indicative of presence of CHD.
2.4. Framingham Risk Score
Framingham 10-year risk score incorporating age, gender, total cholesterol, HDL cholesterol, systolic BP, hypertension, smoking status was calculated at the time of CHD screening, using the Risk Assessment Tool Calculator from the National Cholesterol Education Program [33]. A score of intermediate or high-risk was considered as positive for risk of CHD.
2.5. Statistical Analysis
Summary statistics, such as sample proportions and medians, were used to describe patient characteristics. Fisher's exact test and Mann–Whitney test were used to compare categorical and continuous variables between patient subgroups, respectively. Receiver operating characteristic (ROC) curves were generated to evaluate the diagnostic accuracy for FRS and CAC, with the CCTA as the gold standard for CHD. The area under the ROC curve (AUC) was used to compare the relative diagnostic value of FRS versus CAC. As the FRS and CAC were measured in each study patient in a paired design, their sensitivities and specificities were compared by the McNemar's test and their relative positive predictive values (PPV) and NPV were compared using the Moskowitz and Pepe's method [34]. Statistical analyses were performed in SAS 9.3 (SAS Institute, Cary NC) and the R statistical software version 3.4.0 (R Foundation for Statistical Computing). All tests were two-sided and statistical significance was considered when P < 0.05.
3. RESULTS
3.1. Patient Characteristics
Seventy-nine subjects (32 females; 47 males) with a median age of 39 years (range, 17–69) at transplant and a median follow-up interval of 8 years (range, 3–21) were studied. Patient pretransplant characteristics are described in Table 1. Four subjects with clinically known but asymptomatic CHD were also included for the purposes of estimating cross-sectional prevalence of CHD and for comparing the diagnostic accuracy of FRS versus CAC. All patients were asymptomatic at the time of study. Eleven subjects underwent CAC measurements but did not receive the angiographic portion of the cardiac CT because of elevated creatinine (n = 8), age ≤25 years (n = 2) or poor intravenous access (n = 1). These subjects were included in the overall cross-sectional description of CHD, but were excluded from comparisons of FRS versus CAC due to their lack of the CT angiography as the reference standard for CHD.
Table 1.
Pretransplant characteristics of the subjects
|
All
|
With CHD
|
No CHD
|
||
|---|---|---|---|---|
| (n = 79) | (n = 33) | (n = 46) | p | |
| Age at transplant: median (range), years | 39 (17–69) | 44 (28–69) | 32 (17–64) | < 0.001 |
| Sex, no. (%) | 0.01 | |||
| Female | 32 (40.5) | 7 (21.2) | 25 (54.3) | |
| Male | 47 (59.5) | 26 (78.8) | 21 (45.7) | |
| Race, no. (%) | 0.15 | |||
| White | 26 (32.9) | 15 (45.5) | 11 (23.9) | |
| African American | 7 (8.9) | 1 (3.0) | 6 (13.0) | |
| Asian | 5 (6.3) | 2 (6.1) | 3 (6.5) | |
| Others or unknown | 41 (51.9) | 15 (45.5) | 26 (56.5) | |
| Disease, no. (%) | 0.45 | |||
| AML | 19 (24.1) | 5 (15.2) | 14 (30.4) | |
| MDS | 10 (12.7) | 6 (18.2) | 4 (8.7) | |
| CML | 29 (36.7) | 12 (36.4) | 17 (37.0) | |
| ALL/CLL | 15 (19.0) | 7 (21.2) | 8 (17.4) | |
| NHL/ MM | 6 (7.6) | 3 (9.1) | 3 (6.5) | |
| Smoking, no. (%) | 14 (17.7) | 8 (24.2) | 6 (15.0) | 0.24 |
ALL, acute lymphocytic leukemia; AML, acute myeloid leukemia; CML, chronic myelogenous leukemia; CLL, chronic lymphocytic leukemia; CML, chronic myeloid leukemia; MM, multiple myeloma; NHL, non-Hodgkins lymphoma.
3.2. Framingham 10-Year CV Risk Score
Four subjects were classified as high risk (≥20%), 7 intermediate (>10% but <20%) and 68 low risk (≤10%). The distribution of FRS is shown in Figure 1A.
Figure 1.
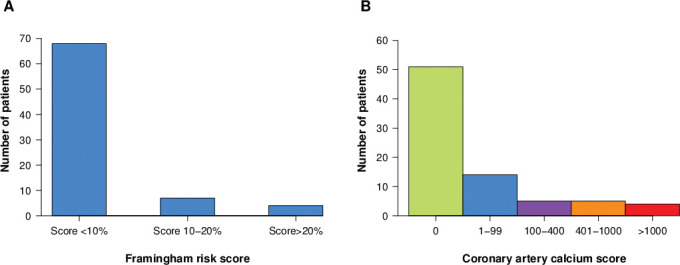
Distribution of (A) Framingham risk score and (B) coronary calcium score.
CT angiography and Coronary Calcification Scores:
CHD was detected in 31 out of 59 subjects by CTA and in 2 (CAC > 0) of the 11 subjects not administered CTA, resulting in an overall prevalence of CHD of 33 of 79 (42%) subjects.
CAC was 0 in 51 subjects, 1–99 in 14, 100 to 400 in 5, 401 to 1000 in 5 and >1000 in 4 subjects. The distribution of CAC is shown in Figure 1B. CAC detected CHD in two out of the 11 subjects who did not undergo concomitant angiography.
Coronary plaques were characterized as 30.5% calcified, 50% mixed calcified/noncalcified and 19.5% noncalcified (Figure 2A). Coronary lesions were mostly nonobstructive (91%), but obstructive lesions were seen in 9% (Figure 2B). Lesion distributions by arterial territory were left main 30.9%, left anterior descending 35.8%, left circumflex 22.2% and right coronary artery 11.1% (Figure 2C). Additionally, 70% patients with CHD had either aortic root or mitral valvular calcification (Figure 2D).
Figure 2.
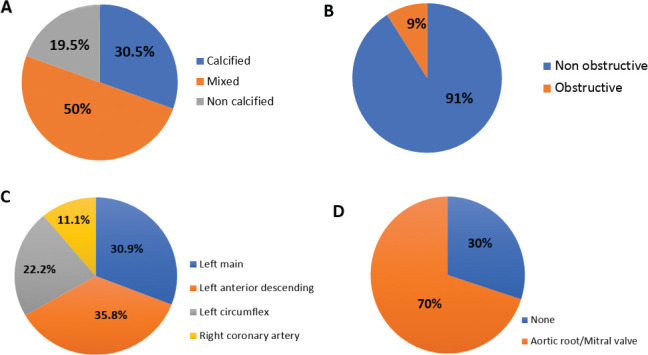
Characteristics of (A) coronary plaques, (B) coronary artery lesion, (C) lesion distribution by arterial territory and (D) valvular calcification.
3.3. Comparison of Subjects Detected with CHD versus no CHD
The pretransplant characteristics between the subjects with CHD and those without CHD were similar, except that there were older at transplant and more male subjects in the subgroup with CHD (Table 1).
The potential CVRFs at the time of cardiac CT in subjects with CHD were also compared to those without CHD (Table 2). Subjects with CHD had higher systolic blood pressure, but otherwise similar in other risk factors compared to the subjects with no CHD.
Table 2.
Potential cardiovascular risk factors in the subjects at the time of cardiac CT study
|
All
|
With CHD
|
No CHD
|
||
|---|---|---|---|---|
| (n = 79) | (n = 33) | (n = 46) | p value | |
| Median follow-up (range), years | 8 (3–21) | 7 (3–21) | 8 (3–20) | 0.52 |
| Conditioning regimen, no. (%) | 0.07 | |||
| Fully ablative | 67 (84.8) | 26 (78.8) | 41 (89.1) | |
| Nonmyeloablative | 2 (2.5) | 0 (0) | 2 (4.3) | |
| Reduced intensity | 10 (12.7) | 7 (21.2) | 3 (6.5) | |
| TBI dose, cGy | 1200 | 1200 | ||
| Chronic GvHD, no. (%) | 54 (68.4) | 22 (66.7) | 32 (69.6) | 0.81 |
| GvHD requiring IST >3 years | 32 (40.5) | 10 (30.3) | 22 (47.8) | 0.16 |
| Hypertension, no. (%) | 24 (30.4) | 14 (42.4) | 10 (21.7) | 0.08 |
| Smoking, no. (%) | 2 (2.5) | 1 (3.0) | 1 (2.2) | > 0.99 |
| Diabetes no. (%) | 12 (15.2) | 6 (18.2) | 6 (13.0) | 0.54 |
| CRP, mg/L | 3.04 (0.15–36) | 2.81 (0.15–29) | 3.18 (0.4–36) | 0.33 |
| BMI, median (range), kg/m2 | 26.0 (17.4–44.9) | 27.4 (17.4–44.9) | 25.4 (17.6–39.3) | 0.20 |
| Systolic BP, median (range), mmHg | 121 (88–165) | 127 (88–156) | 115 (90–165) | 0.008 |
| Total cholesterol, median (range), mg/dL | 196 (119–320) | 195 (134–320) | 197.5 (119–267) | 0.84 |
| HDL cholesterol, median (range), mg/dL | 44 (24–111) | 43 (27–91) | 44 (24–111) | 0.58 |
| LDL cholesterol, median (range), mg/dL | 111 (67–227) | 107 (57–227) | 115 (57–182) | 0.73 |
BMI, body mass index; BP, blood pressure; CRP, C-reactive protein; GvHD, graft versus host disease; HDL, high density lipoprotein; TBI, total body irradiation.
3.4. CV Events
Four subjects had a history of known CHD prior to cardiac CT. An additional subject identified with complete right coronary artery occlusion by CCTA, had an acute myocardial infarction in the month after the study and required percutaneous intervention. Characteristics of these subjects are shown in Supplementary Table S1.
Table S1.
Characteristics of 5 subjects with known CAD or cardiac events
| Gender | |
| Females | 0 |
| Males | 5 |
| Median age at study | 60 (49–74) |
| Race | |
| White | 2 |
| African American | 0 |
| Asian | 1 |
| Unknown/other | 2 |
| Diagnosis | |
| CML | 2 |
| MDS | 3 |
| History of smoking | |
| Yes | 1 |
| No | 4 |
| Conditioning regimen | |
| Fully myeloablative | 4 |
| Reduced intensity conditioning | 1 |
| Occurrence of any cGvHD | 4 |
| Maximum grade of cGvHD | |
| Extensive | 4 |
| Pretransplant coronary heart disease | |
| Yes | 1 |
| No | 4 |
| Lipids median at study (mg/dl) | |
| Total cholesterol | 150 (146–194) |
| Triglycerides | 154 (49–203) |
| HDL | 38 (28–62) |
| LDL | 83 (77–119) |
| BMI median at study | 27.3 (22.8–47.9) |
| Systolic BP median at study (mmHg) | 121 (117–142) |
| Fasting blood glucose median at study (mg/dl) | 99 (78–113) |
| HS- CRP median at study (mg/dl) | 1.53 (0.5–6.4) |
| Serial # | Clinical description of subjects with known CAD |
|---|---|
| 25. | MI with CABG 5 years prior to Cardiac CT |
| 41. | MI 2 weeks after finding RCA occlusion on cardiac CT and underwent PCI |
| 45. | PCI 10 years prior to Cardiac CT |
| 46. | Interim development of EKG evidence for inferior wall MI |
| 53. | PCI (LAD stent and 2nd diagonal angioplasty) 8 years prior to cardiac CT |
BMI, Body mass index; cGvHD, chronic graft versus host disease; CML, Chronic myeloid leukemia; MDS, Myelodysplastic syndrome; HDL, High density lipoprotein; LDL, Low density lipoprotein; EKG, Electro cardiogram; CAD, coronary artery disease; PCI, Percutaneous coronary intervention; CABG, Coronary artery bypass grafting; MI, Myocardial infarction; LAD, Left anterior descending artery; RCA, Right coronary artery.
3.5. Radiation Exposure
Radiation exposure during the procedure was negligible, at a median of 0.72 mSv for the coronary calcium score and 1.12 mSv for the coronary CT angiogram.
3.6. Adverse Events
There were no adverse events related to cardiac CT measurements.
3.7. Sensitivity, Specificity and Predictive Values of FRS and CAC
Confining the analysis to the 68 subjects who underwent CT angiography (as the best reference standard for CHD), the FRS had an overall sensitivity of only 28% (95% CI, 14%–47%) but with adequate specificity of 97 % (95% CI, 85%–100%). The positive and NPVs of FRS were 90% (95% CI, 55%–100%) and 60% (95% CI, 47%–73%), respectively. In contrast, the sensitivity, specificity, positive and NPVs of CAC were 78% (95% CI, 60%–91%), 97% (95% CI, 85%–100%), 96% (95% CI, 80%–100%) and 83% (95% CI, 69%–93%), respectively. The sensitivity and NPV of FRS were significantly inferior to that of CAC (both p < 0.0001). The results in comparisons of diagnostic accuracy for FRS versus CAC in the discovery and validation cohorts were similar to those for all subjects (Supplementary Table S2).
Table S2.
Sensitivity and specificity and predictive values of FRS and CAC
|
Sensitivity
|
Specificity
|
Positive predictive value
|
Negative predictive value
|
|||||
|---|---|---|---|---|---|---|---|---|
|
(95% CI)
|
(95% CI)
|
(95% CI)
|
(95% CI)
|
|||||
| FRS | CAC | FRS | CAC | FRS | CAC | FRS | CAC | |
| Discovery set (n = 50) | 0.33 | 0.71 | 0.97 | 0.97 | 0.88 | 0.94 | 0.67 | 0.82 |
| (0.15, 0.57) | (0.48, 0.89) | (0.82, 1.00) | (0.82, 1.00) | (0.47, 1.00) | (0.70, 1.00) | (0.50, 0.80) | (0.65, 0.93) | |
| p = 0.0078 | p > 0.99 | p = 0.35 | p = 0.0048 | |||||
| Validation set (n = 18) | 0.18 | 0.91 | 1.00 | 1.00 | 1.00 | 1.00 | 0.44 | 0.88 |
| (0.02, 0.52) | (0.59, 1.00) | (0.59, 1.00) | (0.59, 1.00) | (0.16, 1.00) | (0.69, 1.00) | (0.20, 0.70) | (0.47, 1.00) | |
| p = 0.0078 | p > 0.99 | p > 0.99 | p = 0.0056 | |||||
| All patients (n = 68) | 0.28 | 0.78 | 0.97 | 0.97 | 0.90 | 0.96 | 0.60 | 0.83 |
| (0.14, 0.47) | (0.60, 0.91) | (0.85, 1.00) | (0.85, 1.00) | (0.55, 1.00) | (0.80, 1.00) | (0.47, 0.73) | (0.69, 0.93) | |
| p < 0.0001 | p > 0.99 | p = 0.33 | p < 0.0001 | |||||
3.8. Comparison of Overall Accuracy of FRS to CAC
Initial comparison utilized 50 subjects in the discovery cohort with further validation in a cohort of 18 subjects, all of whom had CT angiography as the reference standard for CHD. ROC analysis confirmed that FRS was significantly inferior (∆C = 0.25; p < 0.0001) to the CAC, as shown in Figure 3. Adding FRS to the CAC score did not improve the accuracy of CAC (∆C = 0.007; p = 0.33). Out of the 68 subjects with a low-risk FRS, cardiac CT (either with angiography or by CAC > 0) identified CHD in 23 subjects (34%).
Figure 3.

Receiver operating characteristic (ROC) curve analysis.
4. DISCUSSION
Our single center cross-sectional study using cardiac CT as a screening test in asymptomatic allo-HCT survivors confirms a strikingly high rate of early CHD (42%) at a median follow-up interval of 8 years posttransplant. Our study confirms that CCTA is safe, feasible and sensitive, even for subjects with a low FRS. While high rates of underlying CHD have been inferred from retrospective studies documenting CHD events, this is the first direct demonstration of early CHD in HCT survivors. FRS is highly specific for early CHD in HCT survivors but less sensitive than cardiac CT. We show that reliance solely on the FRS underestimates the risk of CHD in this vulnerable group. CAC scoring alone is more sensitive, despite its inability to detect noncalcified lesions. The primary advantage of cardiac CT is that CTA and/or CAC greatly improve the possibility of early diagnosis and preemptive intervention. Definitive identification of premature CHD should aid ongoing studies to elucidate biologic mechanisms in this susceptible population.
Allo-HCT survivors have a unique susceptibility to premature CHD. Putative mechanisms include exposure to chest irradiation, endothelial injury, growth hormone deficiency and chronic inflammation, which may, in turn, drive traditional CVRFs (e.g. dyslipidemia, hypertension, diabetes, sarcopenic obesity, endocrinopathy) [6,8,9]. Prospective studies to elucidate these unique biologic mechanisms in this susceptible population are needed, but will require definitive identification of premature CHD. The FRS is an inadequate screening strategy in HCT survivors in whom CV risk may have additional, yet undiscovered, variables attributable to the HCT process.
Cardiac CT is now a well-established risk stratification modality in nontransplant populations [35], justifying the use of this strategy in allo-HCT survivors. CAC is a marker of coronary atherosclerosis and is correlated with atherosclerotic plaque burden and associated with the risk of future CV events [36–40]. Aortic and mitral valve calcification are independent predictors of atherosclerosis, and aortic valve calcification incrementally adds prognostic and diagnostic value to the scan for CAC [41]. Mixed plaques carry more risk than calcified /non-calcified. CAC has outperformed other serum biomarkers, such as high-sensitivity C-reactive protein (CRP) [42,43]. The Multi Ethnic Study for Atherosclerosis (MESA) has shown that even individuals with a low Agatston Calcium score (1–10), have 3 times greater risk of developing future CV events than individuals with zero CAC [44]. Current (2013 American Heart Association/American College of Cardiology) guidelines suggest a role for coronary calcium scoring for screening asymptomatic nontransplant individuals with intermediate Framingham risk [45].
Allogeneic transplant survivors develop increased risk at a younger age, long before primary care physicians would normally consider screening or intervention in the general population. Integration of cardiac CT into current management guidelines in HCT survivors is therefore required. Transplant society guidelines emphasize early screening for CVRFs and high-risk lifestyle behaviors, to provide opportunity for preemptive management of arterial disease [46–49]. While there is general consensus that screening should begin by 1 year after HCT, existing guidelines have been extrapolated from the general population and probably underestimate the risk of CHD [28,48–50]. The optimum initiation, frequency and duration of screening methodologies remain undefined. Screening for asymptomatic vascular disease using imaging studies (e.g. vascular intima-media thickness) or blood biomarkers of endothelial injury remains an active area of investigation. In this context, cardiac CT represents a noninvasive, highly-sensitive method for detecting early CHD. Radiation exposure (<1 mSv for the coronary calcium score and 1.12 mSv for the coronary CT angiogram in our study) is negligible with current technology. Such exposure is trivial compared to the cumulative exposure from therapeutic radiation and from other diagnostic procedures in cancer survivors. For comparison, the median cumulative radiation exposure from diagnostic radiological procedures at our center is 92 mSv (range 1.2–300) in the first 200 days following allo-HCT [51]. In addition to overall risk, cardiac CT directly visualizes coronary arteries, and provides comprehensive information regarding coronary anatomy, the presence of obstructive and nonobstructive CHD, and plaque characteristics [22]. Future effort will be required to optimize the utilization of cardiac CT in HCT survivors in order to address who should be screened, at what age, how soon after HCT and at what interval, including if and when to repeat negative studies.
There are several aspects to our findings that limit generalization. Our cross-sectional study was comprised of adult allogeneic transplant recipients, most of whom had received chest irradiation with a follow-up interval of a median of 8 years. Although traditional CVRFs in nontransplant population include smoking and diabetes [16–18], we did not find any difference in the population (Table 2), likely due to paucity of the details of exposures. Additional studies in other HCT populations (pediatrics, autologous HCT, non-TBI conditioning and at shorter/longer follow up) are needed. [6]. Weng et al. showed that machine-learning significantly improves accuracy of CV risk prediction compared to the established algorithms [52]. In the current era of machine-learning technology, multiple variables among age, IST, TBI exposure, gender, smoking status, prior chemotherapy, GVHD need to be weighed using deep learning to define actual risk. Practical limitations are that cardiac CT is labor-intensive, confined to specialized centers, and that renal dysfunction mandates avoidance of the angiographic component.
In conclusion, the coronary calcium score with or without CT angiogram is a safe, feasible and sensitive screening technique for CHD. It is informative even in asymptomatic, low-risk HCT survivors and is considerably more sensitive than the FRS.
ACKNOWLEDGMENTS
This research was supported by the Intramural Research Program of the National Heart, Lung and Blood Institute. The authors wish to thank Dr. Vandana Sachdev for insightful discussion.
Footnotes
Peer review under responsibility of the International Academy for Clinical Hematology
Data availability statement: The data that support the findings of this study are available from the corresponding author, upon reasonable request.
CONFLICTS OF INTEREST
The authors declare they have no conflicts of interest.
AUTHORS' CONTRIBUTION
NAJ collected, analyzed data, and wrote the manuscript. MYC performed cardiac imaging and wrote the manuscript. SS performed cardiac imaging and wrote the manuscript. PA collected and analyzed data. XT collected and analyzed data. SI collected, analyzed data, wrote the manuscript, and took care of patients. PAP collected, analyzed data, and wrote the manuscript. KD collected and analyzed data. UC collected and analyzed data. EK took care of patients. AJB collected, analyzed data, wrote the manuscript, and took care of patients. MB collected, analyzed data, wrote the manuscript, and took care of patients. All authors critically revised the manuscript.
FUNDING
The authors have no financial conflicts of interest with the subject matter or materials discussed in the manuscript.
SUPPLEMENTARY TABLES
REFERENCES
- [1].Battiwalla M, et al. National Institutes of Health Hematopoietic Cell Transplantation Late Effects Initiative: developing recommendations to improve survivorship and long-term outcomes. Biol Blood Marrow Transplant. 2017;23:6–9. doi: 10.1016/j.bbmt.2016.10.020. [DOI] [PMC free article] [PubMed] [Google Scholar]
- [2].Bhatia S, et al. Late mortality after allogeneic hematopoietic cell transplantation and functional status of long-term survivors: report from the Bone Marrow Transplant Survivor Study. Blood. 2007;110:3784–92. doi: 10.1182/blood-2007-03-082933. [DOI] [PMC free article] [PubMed] [Google Scholar]
- [3].Bhatia S, et al. Late mortality in survivors of autologous hematopoietic-cell transplantation: report from the Bone Marrow Transplant Survivor Study. Blood. 2005;105:4215–22. doi: 10.1182/blood-2005-01-0035. [DOI] [PMC free article] [PubMed] [Google Scholar]
- [4].Wingard JR, et al. Long-term survival and late deaths after allogeneic hematopoietic cell transplantation. J Clin Oncol. 2011;29:2230–9. doi: 10.1200/jco.2010.33.7212. [DOI] [PMC free article] [PubMed] [Google Scholar]
- [5].Martin PJ, et al. Life expectancy in patients surviving more than 5 years after hematopoietic cell transplantation. J Clin Oncol. 2010;28:1011–16. doi: 10.1200/jco.2009.25.6693. [DOI] [PMC free article] [PubMed] [Google Scholar]
- [6].Armenian SH, et al. National Institutes of Health Hematopoietic Cell Transplantation Late Effects Initiative: the cardiovascular disease and associated risk factors working group report. Biol Blood Marrow Transplant. 2017;23:201–10. doi: 10.1016/j.bbmt.2016.08.019. [DOI] [PMC free article] [PubMed] [Google Scholar]
- [7].Chow EJ, et al. Cardiovascular hospitalizations and mortality among recipients of hematopoietic stem cell transplantation. Ann Intern Med. 2011;155:21–32. doi: 10.7326/0003-4819-155-1-201107050-00004. [DOI] [PubMed] [Google Scholar]
- [8].Armenian SH, Chow EJ. Cardiovascular disease in survivors of hematopoietic cell transplantation. Cancer. 2014;120:469–79. doi: 10.1002/cncr.28444. [DOI] [PMC free article] [PubMed] [Google Scholar]
- [9].Rovo A, Tichelli A. Cardiovascular complications in long-term survivors after allogeneic hematopoietic stem cell transplantation. Semin Hematol. 2012;49:25–34. doi: 10.1053/j.seminhematol.2011.10.001. [DOI] [PubMed] [Google Scholar]
- [10].Goff DC, Jr, et al. Dyslipidemia prevalence, treatment, and control in the Multi-Ethnic Study of Atherosclerosis (MESA): gender, ethnicity, and coronary artery calcium. Circulation. 2006;113:647–56. doi: 10.1161/circulationaha.105.552737. [DOI] [PubMed] [Google Scholar]
- [11].Pophali PA, et al. Male survivors of allogeneic hematopoietic stem cell transplantation have a long term persisting risk of cardiovascular events. Exp Hematol. 2014;42:83–9. doi: 10.1016/j.exphem.2013.07.003. [DOI] [PMC free article] [PubMed] [Google Scholar]
- [12].Tichelli A, et al. Premature cardiovascular disease after allogeneic hematopoietic stem-cell transplantation. Blood. 2007;110:3463–71. doi: 10.1182/blood-2006-10-054080. [DOI] [PubMed] [Google Scholar]
- [13].Tichelli A, et al. Late cardiovascular events after allogeneic hematopoietic stem cell transplantation: a retrospective multicenter study of the Late Effects Working Party of the European Group for Blood and Marrow Transplantation. Haematologica. 2008;93:1203–10. doi: 10.3324/haematol.12949. [DOI] [PubMed] [Google Scholar]
- [14].Armenian SH, et al. Predictors of late cardiovascular complications in survivors of hematopoietic cell transplantation. Biol Blood Marrow Transplant. 2010;16:1138–44. doi: 10.1016/j.bbmt.2010.02.021. [DOI] [PMC free article] [PubMed] [Google Scholar]
- [15].Greenland P, et al. 2010 ACCF/AHA guideline for assessment of cardiovascular risk in asymptomatic adults: a report of the American College of Cardiology Foundation/American Heart Association Task Force on Practice Guidelines. J Am Coll Cardiol. 2010;56:e50–e103. doi: 10.1016/j.jacc.2010.09.001. [DOI] [PubMed] [Google Scholar]
- [16].Baker KS, et al. Diabetes, hypertension, and cardiovascular events in survivors of hematopoietic cell transplantation: a report from the bone marrow transplantation survivor study. Blood. 2007;109:1765–72. doi: 10.1182/blood-2006-05-022335. [DOI] [PMC free article] [PubMed] [Google Scholar]
- [17].Chow EJ, et al. Influence of conventional cardiovascular risk factors and lifestyle characteristics on cardiovascular disease after hematopoietic cell transplantation. J Clin Oncol. 2014;32:191–8. doi: 10.1200/jco.2013.52.6582. [DOI] [PMC free article] [PubMed] [Google Scholar]
- [18].Armenian SH, et al. Cardiovascular risk factors in hematopoietic cell transplantation survivors: role in development of subsequent cardiovascular disease. Blood. 2012;120:4505–12. doi: 10.1182/blood-2012-06-437178. [DOI] [PMC free article] [PubMed] [Google Scholar]
- [19].Majhail NS, et al. Recommended screening and preventive practices for long-term survivors after hematopoietic cell transplantation. Bone Marrow Transplant. 2012;47:337–41. doi: 10.1038/bmt.2012.5. [DOI] [PMC free article] [PubMed] [Google Scholar]
- [20].Bhatia S, Armenian SH, Landier W. How I monitor long-term and late effects after blood or marrow transplantation. Blood. 2017;130:1302–14. doi: 10.1182/blood-2017-03-725671. [DOI] [PubMed] [Google Scholar]
- [21].National Cholesterol Education Program Expert Panel on Detection, E. and A. Treatment of High Blood Cholesterol Third report of the National Cholesterol Education Program (NCEP) expert panel on detection, evaluation, and treatment of high blood cholesterol in adults (Adult Treatment Panel III) final report. Circulation. 2002;106:3143–421. doi: 10.1161/circ.106.25.3143. [DOI] [PubMed] [Google Scholar]
- [22].Yoon YE, Lim TH. Current roles and future applications of cardiac CT: risk stratification of coronary artery disease. Korean J Radiol. 2014;15:4–11. doi: 10.3348/kjr.2014.15.1.4. [DOI] [PMC free article] [PubMed] [Google Scholar]
- [23].Budoff MJ, et al. Diagnostic performance of 64-multidetector row coronary computed tomographic angiography for evaluation of coronary artery stenosis in individuals without known coronary artery disease: results from the prospective multicenter ACCURACY (Assessment by Coronary Computed Tomographic Angiography of Individuals Undergoing Invasive Coronary Angiography) trial. J Am Coll Cardiol. 2008;52:1724–32. doi: 10.1016/j.jacc.2008.07.031. [DOI] [PubMed] [Google Scholar]
- [24].Budoff MJ, Gul KM. Expert review on coronary calcium. Vasc Health Risk Manag. 2008;4:315–24. doi: 10.2147/VHRM.S1160. [DOI] [PMC free article] [PubMed] [Google Scholar]
- [25].Meijboom WB, et al. Diagnostic accuracy of 64-slice computed tomography coronary angiography: a prospective, multicenter, multivendor study. J Am Coll Cardiol. 2008;52:2135–44. doi: 10.1016/j.jacc.2008.08.058. [DOI] [PubMed] [Google Scholar]
- [26].Miller JM, et al. Diagnostic performance of coronary angiography by 64-row CT. N Engl J Med. 2008;359:2324–36. doi: 10.1056/NEJMoa0806576. [DOI] [PubMed] [Google Scholar]
- [27].Agatston AS, et al. Quantification of coronary artery calcium using ultrafast computed tomography. J Am Coll Cardiol. 1990;15:827–32. doi: 10.1016/0735-1097(90)90282-t. [DOI] [PubMed] [Google Scholar]
- [28].Jain NA, et al. Contrast enhanced cardiac CT reveals coronary artery disease in 45% of asymptomatic allo-SCT long-term survivors. Bone Marrow Transplant. 2014;49:451–2. doi: 10.1038/bmt.2013.182. [DOI] [PMC free article] [PubMed] [Google Scholar]
- [29].Steigner ML, et al. Narrowing the phase window width in prospectively ECG-gated single heart beat 320-detector row coronary CT angiography. Int J Cardiovasc Imaging. 2009;25:85–90. doi: 10.1007/s10554-008-9347-8. [DOI] [PubMed] [Google Scholar]
- [30].Halliburton SS, et al. SCCT guidelines on radiation dose and dose-optimization strategies in cardiovascular CT. J Cardiovasc Comput Tomogr. 2011;5:198–224. doi: 10.1016/j.jcct.2011.06.001. [DOI] [PMC free article] [PubMed] [Google Scholar]
- [31].Raff GL, et al. SCCT guidelines for the interpretation and reporting of coronary computed tomographic angiography. J Cardiovasc Comput Tomogr. 2009;3:122–36. doi: 10.1016/j.jcct.2009.01.001. [DOI] [PubMed] [Google Scholar]
- [32].Mark DB, et al. ACCF/ACR/AHA/NASCI/SAIP/SCAI/SCCT 2010 expert consensus document on coronary computed tomographic angiography: a report of the American College of Cardiology Foundation Task Force on Expert Consensus Documents. Circulation. 2010;121:2509–43. doi: 10.1161/cir.0b013e3181d4b618. [DOI] [PubMed] [Google Scholar]
- [33].NECP 10-year CVD risk calculator. 2015 http://cvdrisk.nhlbi.nih.gov.
- [34].Moskowitz CS, Pepe MS. Comparing the predictive values of diagnostic tests: sample size and analysis for paired study designs. Clin Trials. 2006;3:272–9. doi: 10.1191/1740774506cn147oa. [DOI] [PubMed] [Google Scholar]
- [35].Hou ZH, et al. Prognostic value of coronary CT angiography and calcium score for major adverse cardiac events in outpatients. JACC Cardiovasc Imaging. 2012;5:990–9. doi: 10.1016/j.jcmg.2012.06.006. [DOI] [PubMed] [Google Scholar]
- [36].Raggi P, et al. Coronary artery calcium to predict all-cause mortality in elderly men and women. J Am Coll Cardiol. 2008;52:17–23. doi: 10.1016/j.jacc.2008.04.004. [DOI] [PubMed] [Google Scholar]
- [37].Budoff MJ, et al. Long-term prognosis associated with coronary calcification: observations from a registry of 25,253 patients. J Am Coll Cardiol. 2007;49:1860–70. doi: 10.1016/j.jacc.2006.10.079. [DOI] [PubMed] [Google Scholar]
- [38].Greenland P, et al. Coronary artery calcium score combined with Framingham score for risk prediction in asymptomatic individuals. JAMA. 2004;291:210–5. doi: 10.1001/jama.291.2.210. [DOI] [PubMed] [Google Scholar]
- [39].Detrano R, et al. Coronary calcium as a predictor of coronary events in four racial or ethnic groups. N Engl J Med. 2008;358:1336–45. doi: 10.1056/nejmoa072100. [DOI] [PubMed] [Google Scholar]
- [40].Polonsky TS, et al. Coronary artery calcium score and risk classification for coronary heart disease prediction. JAMA. 2010;303:1610–6. doi: 10.1001/jama.2010.461. [DOI] [PMC free article] [PubMed] [Google Scholar]
- [41].Nasir K, et al. Relationship of aortic valve calcification with coronary artery calcium severity: the Multi-Ethnic Study of Atherosclerosis (MESA) J Cardiovasc Comput Tomogr. 2010;4:41–6. doi: 10.1016/j.jcct.2009.12.002. [DOI] [PubMed] [Google Scholar]
- [42].Park R, et al. Combined use of computed tomography coronary calcium scores and C-reactive protein levels in predicting cardiovascular events in nondiabetic individuals. Circulation. 2002;106:2073–7. doi: 10.1161/01.cir.0000033819.29662.09. [DOI] [PubMed] [Google Scholar]
- [43].Patel AA, Budoff MJ. Screening for heart disease: C-reactive protein versus coronary artery calcium. Expert Rev Cardiovasc Ther. 2010;8:125–31. doi: 10.1586/erc.09.166. [DOI] [PubMed] [Google Scholar]
- [44].Budoff MJ, et al. Cardiovascular events with absent or minimal coronary calcification: the Multi-Ethnic Study of Atherosclerosis (MESA) Am Heart J. 2009;158:554–61. doi: 10.1016/j.ahj.2009.08.007. [DOI] [PMC free article] [PubMed] [Google Scholar]
- [45].Goff DC, Jr, et al. 2013 ACC/AHA guideline on the assessment of cardiovascular risk: a report of the American College of Cardiology/American Heart Association Task Force on Practice Guidelines. Circulation. 2014;129:S49–S73. doi: 10.1161/01.cir.0000437741.48606.98. [DOI] [PubMed] [Google Scholar]
- [46].Passweg JR, et al. Hematopoietic stem cell transplantation: a review and recommendations for follow-up care for the general practitioner. Swiss Med Wkly. 2012;142:w13696. doi: 10.4414/smw.2012.13696. [DOI] [PubMed] [Google Scholar]
- [47].Griffith ML, Savani BN, Boord JB. Dyslipidemia after allogeneic hematopoietic stem cell transplantation: evaluation and management. Blood. 2011;116:1197–204. doi: 10.1182/blood-2010-03-276576. [DOI] [PubMed] [Google Scholar]
- [48].Majhail NS, et al. Recommended screening and preventive practices for long-term survivors after hematopoietic cell transplantation. Biol Blood Marrow Transplant. 2012;18:348–71. doi: 10.1016/j.bbmt.2011.12.519. [DOI] [PMC free article] [PubMed] [Google Scholar]
- [49].Savani BN, et al. How I treat late effects in adults after allogeneic stem cell transplantation. Blood. 2011;117:3002–9. doi: 10.1182/blood-2010-10-263095. [DOI] [PMC free article] [PubMed] [Google Scholar]
- [50].Nieder ML, et al. National Cancer Institute-National Heart, Lung and Blood Institute/Pediatric Blood and Marrow Transplant Consortium First International Consensus Conference on late effects after pediatric hematopoietic cell transplantation: long-term organ damage and dysfunction. Biol Blood Marrow Transplant. 2011;17:1573–84. doi: 10.1016/j.bbmt.2011.09.013. [DOI] [PMC free article] [PubMed] [Google Scholar]
- [51].Battiwalla M, et al. Radiation exposure from diagnostic procedures following allogeneic stem cell transplantation—how much is acceptable? Hematology. 2014;19:275–9. doi: 10.1179/1607845413y.0000000131. [DOI] [PMC free article] [PubMed] [Google Scholar]
- [52].Weng SF, et al. Can machine-learning improve cardiovascular risk prediction using routine clinical data? PLoS One. 2017;12:e0174944. doi: 10.1371/journal.pone.0174944. [DOI] [PMC free article] [PubMed] [Google Scholar]
Associated Data
This section collects any data citations, data availability statements, or supplementary materials included in this article.