Abstract
Lung cancer in never smokers (LCINS) is a common cause of cancer mortality, but its genomic landscape is poorly characterized. Here, high-coverage whole genome sequencing of 232 LCINS showed three subtypes defined by copy number aberrations. The dominant subtype (‘piano’), rare in lung cancer in smokers, features somatic UBA1 mutations, germline AR variants, and stem cell-like properties, including low mutational burden, high intra-tumor heterogeneity, long telomeres, frequent KRAS mutations, and slow growth, as suggested by the occurrence of cancer drivers’ progenitor cells many years prior to tumor diagnosis. The other subtypes are characterized by specific amplifications and EGFR mutations (‘mezzo-forte’), and whole genome doubling (‘forte’). No strong tobacco smoking signatures were detected, even in cases with exposure to second-hand tobacco smoke. Genes within the RTK-RAS pathway had distinct impacts on survival, and five genomic alterations independently doubled mortality. These findings create avenues for personalized treatment in LCINS.
Lung cancer is the leading cause of cancer-related deaths with ~2 million people diagnosed each year1. Lung cancers in never smokers (LCINS) account for 10–25% of all lung cancers, with most LCINS being lung adenocarcinomas (LUAD)2. Several studies have profiled the genomic landscape of LUAD3–10 and the rarer carcinoid subtype11. Previous LUAD samples were mostly from smokers, primarily subject to whole exome sequencing (WES). The largest moderate- to high-coverage whole genome sequencing (WGS)-based LUAD studies cumulatively total less than 100 LCINS subjects, mostly of Asian ancestry4,8,10,12–14. As part of the Sherlock-Lung study15, we evaluated the genomic landscape and mutational processes in 232 treatment-naïve LCINS using high-coverage WGS (tumor: 70.6–141.5×, mean: 85×; normal: 26.2–57.2×, mean: 31.6×) (Supplementary Table 1). Three subtypes based on somatic copy number alterations (SCNAs) were observed, with major genomic differences from LUAD in smokers, and distinct clonal evolutionary patterns affecting diagnosis and possibly survival. Our findings suggest developmental processes and possible novel therapeutic approaches for LCINS.
Characteristics of Sherlock-Lung Cancer Patients
Fresh frozen tumor tissue and matched germline DNA were obtained from 232 treatment-naïve never smoker lung cancer patients with unknown exposures to lung cancer risk factors, with the exception of second-hand (‘passive’) tobacco smoking in 27.6% of patients (Methods, Supplementary Table 1). Patients were diagnosed with non-small-cell lung cancer, including 189 adenocarcinomas, 36 carcinoids, and 7 other tumors of various subtypes (Methods). Patients were predominantly of European descent (n=226; 97.4%), with the remainder of Asian (n=4; 1.7%) or African (n=2; 0.9%) ancestry (Supplementary Fig. 1).
Genomic characteristics of LCINS
The median tumor mutational burden (TMB) was 1.1 Mut/Mb (single nucleotide variation (SNV)=1.0; insertions and deletions (indel)=0.06), more than 7-fold lower than in smokers4 (P = 7.0e-73) (Fig. 1). TMB was significantly associated with tumor stage, histology, and age at diagnosis, but not tumor purity (Supplementary Fig. 2).
Fig. 1. Tumor mutational burden (TMB) across lung cancer in never smokers from the Sherlock-Lung study and 33 cancer types from the TCGA study.

The Sherlock-Lung samples (blue) are shown overall and by histological type. TCGA LUAD samples (green) are shown overall and by smoking status. Each dot represents a sample; total sample numbers for each type are shown at the top. The red horizontal lines are the median numbers of mutations per megabase (log10). On the bottom, acronyms of cancer types as in TCGA (https://gdc.cancer.gov/resources-tcga-users/tcga-code-tables/tcga-study-abbreviations).
The major genomic characteristics of LCINS are summarized in Fig. 2 and in the Supplementary Note. Among genes in the RTK-RAS pathway, EGFR was the most frequently altered (30.6%), followed by KRAS (7.3%), ALK (6.0%), MET (4.3%), ERBB2 (3.9%, all indels), ROS1 (2.6%) and RET (1.3%). A strong mutually exclusive distribution was observed across these seven genes, which were altered in total in 54.3% of tumors (Extended Data Fig. 1a). The pattern of genomic alterations was strikingly different between RTK-RAS+ and RTK-RAS− groups (Extended Data Fig. 1b). The former had significantly higher burden of SNVs/indels, SCNAs, structural variants (SVs), kataegis, whole genome doubling (WGD), and BRCA2 loss of heterozygosity (LOH), but lower tumor/normal telomere length (T/N TL) ratios. The 49 (21.1%) tumors bearing both TP53 deficiency and activating RTK-RAS mutations had higher TMB, as previously observed16, and also higher kataegis, WGD, and LOH in genes associated with DNA homologous repair, than tumors with either TP53 deficiency or RTK-RAS alterations alone (Supplementary Fig. 3).
Fig. 2. Genomic characteristics of lung cancer in never smokers.
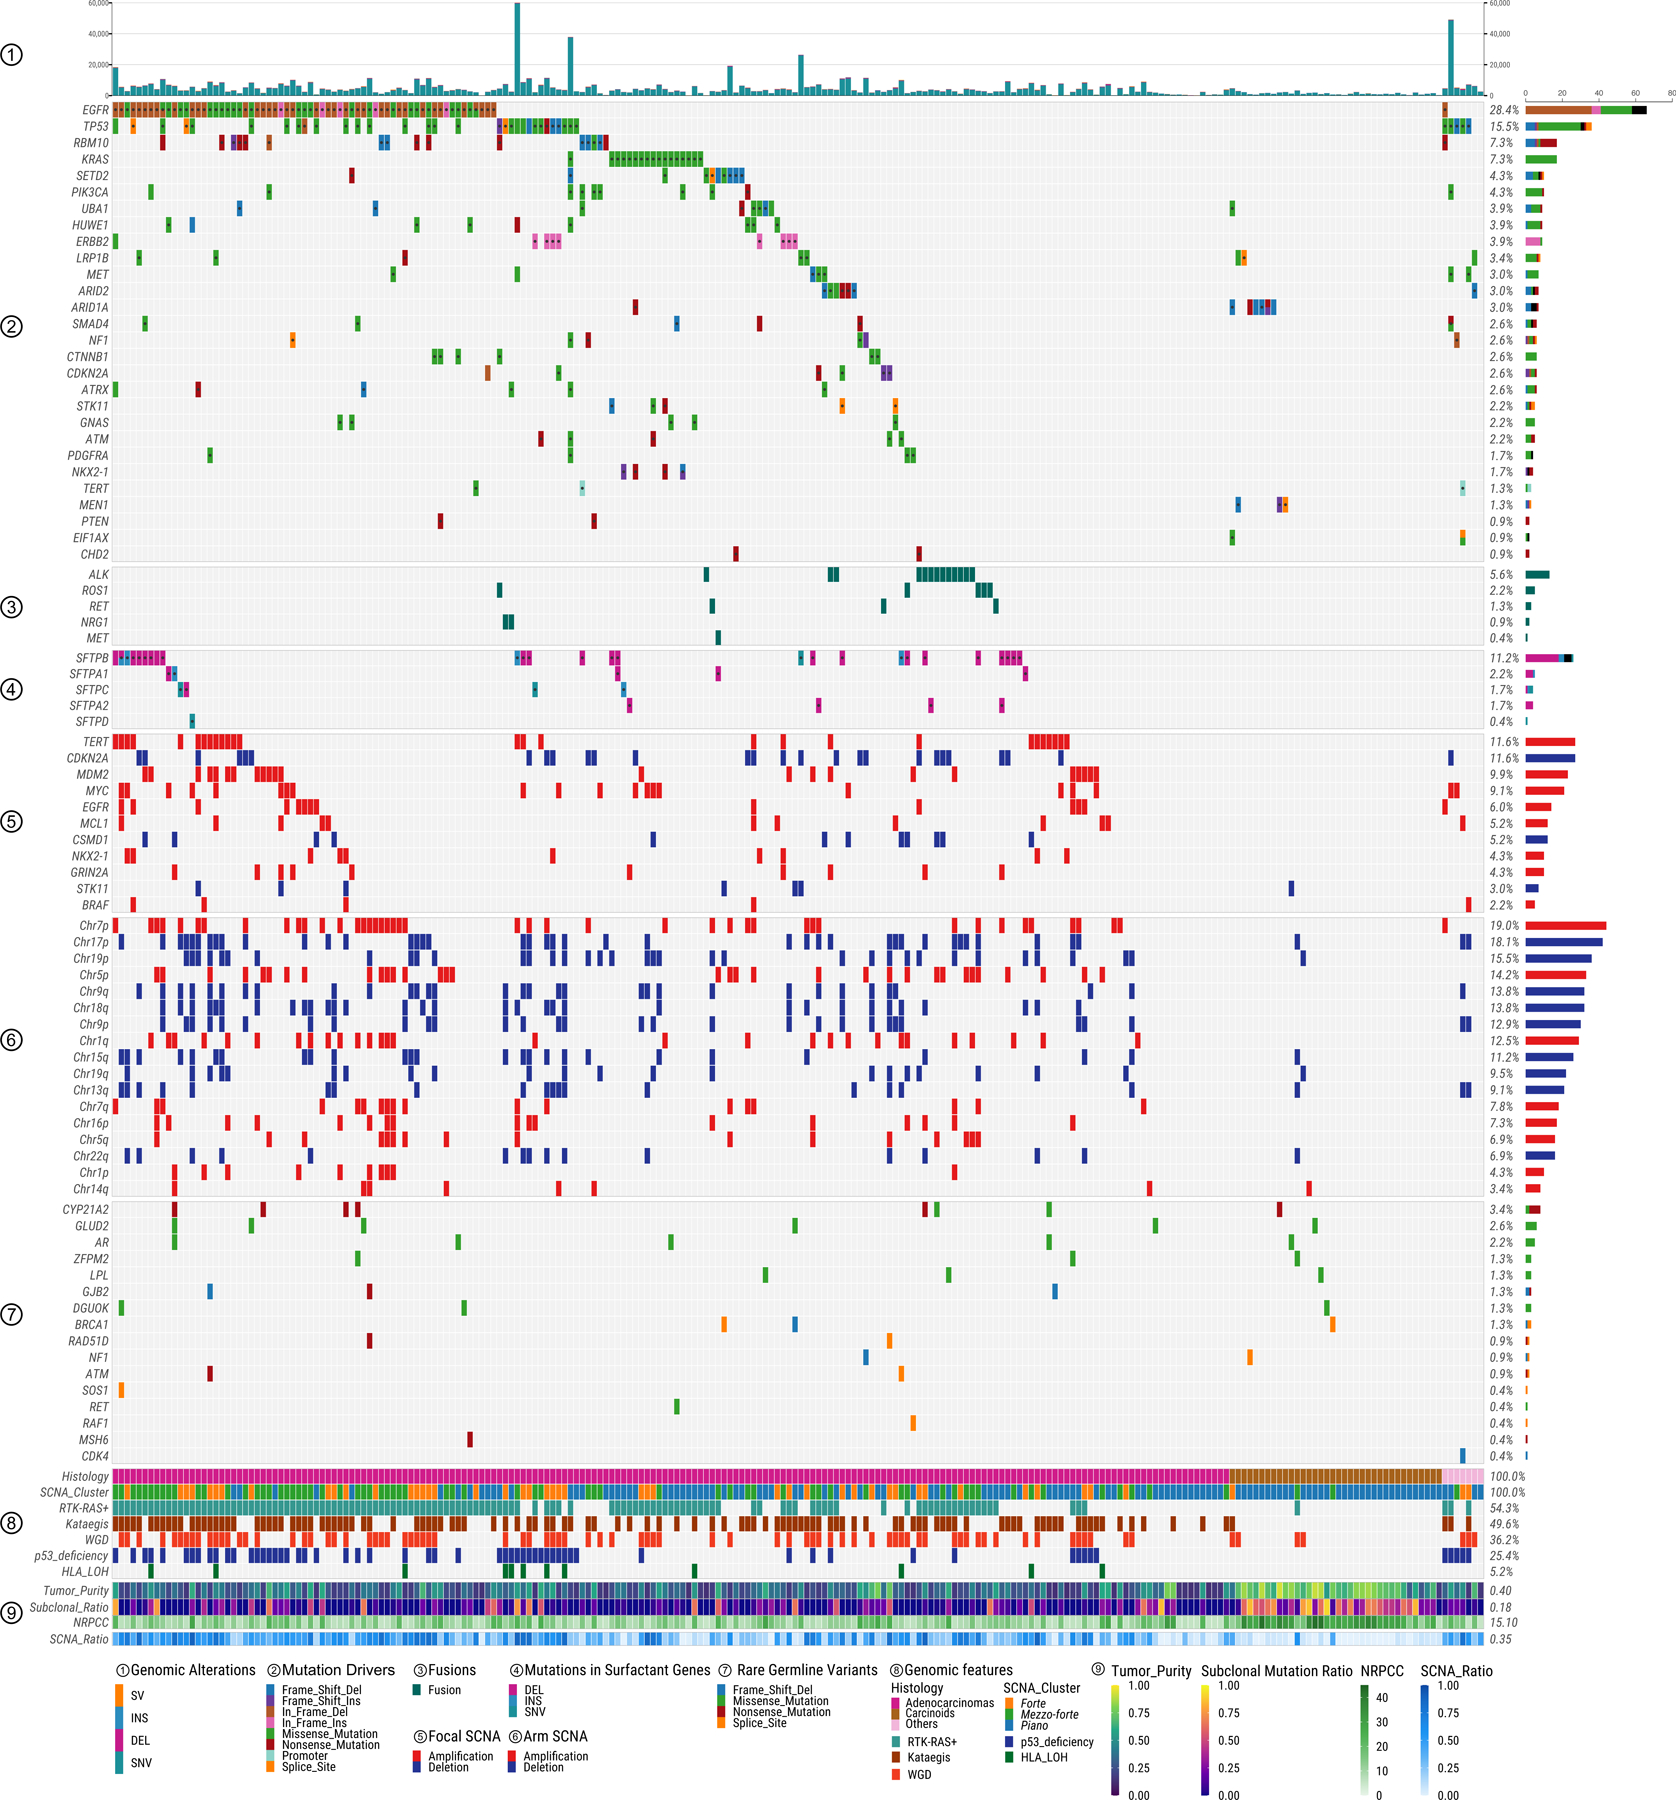
Panels from top to bottom describe: 1) distribution of genomic alteration numbers; 2) most frequently mutated or potential driver genes; 3) oncogenic fusions; 4) somatic mutations in surfactant associated genes; 5) significant focal SCNAs; 6) significant arm-level SCNAs; 7) genes with rare germline mutations; 8) and 9) different genomic features. The numbers on the right panel show the overall frequency (1–8) or median values (9). NRPCC: the number of reads per clonal copy.
As expected17, TP53 mutations were mutually exclusive with MDM2 amplifications (P=0.03; Extended Data Fig. 2a) and tumors with mutations in either gene (25.4% in total) were enriched with genomic alterations including SNVs, SCNAs, SVs, kataegis, WGD, human leukocyte antigen (HLA) LOH and LOH in BRCA1 (Extended Data Fig. 2b).
SVs were enriched in hotspot regions, including MDM2, TERT, 6p21, MYC, CDKN2A, NKX2–1, and GNAS, which together contributed 16.7% of SVs (>200 breakpoints within 5Mb window, Extended Data Fig. 3) as observed in multiple tumor types18. Known driver fusion oncogene-generating rearrangements were observed in 24 (10.3%) tumors (Supplementary Table 2) and were mutually exclusive with EGFR mutations (P=1.1e-4). Non-clustered SVs were enriched in TP53-deficient tumors and RTK-RAS+ tumors (Supplementary Fig. 4a-c).
Copy Number Alteration Subtypes
Unsupervised clustering of arm-level SCNAs identified three distinct subtypes, with increasing levels of SCNAs (Fig. 3a). Subtype 1 (49.6% of all tumors) largely lacked SCNAs despite relatively high purity, and included 33 of 36 carcinoids and 78 adenocarcinomas. Subtype 2 (30.2%) was enriched with chromosome arm-level amplifications, primarily of 1q, 5p, 7p, 7q (each with P<0.001 subtype 2 vs other subtypes, Fisher’s exact test), and 8q (exclusively in subtype 2). Subtype 3 (20.2%) was dominated by WGD. Hereafter we refer to these three subtypes respectively as “piano”, “mezzo-forte” and “forte”, borrowing the terms from musical dynamics. Combining our copy number profiles with those of LUAD from smokers (n=38)12, the majority of LUAD from smokers (20/38, 52.6%) fell into the subtype forte (P=6.6e-5) (Supplementary Fig. 5a). Focal amplifications of MDM2 and EGFR were significantly less frequent in subtype piano than in forte and mezzo-forte (P=0.001 and P=0.02 respectively, Supplementary Table 3, Supplementary Fig. 5b). Mitochondrial-DNA copy numbers were higher than previously reported in LUAD from smokers (P=0.01)19 (Supplementary Note, Supplementary Fig. 6a-c). HLA-LOH has been previously identified in nearly 40% of lung cancer cases, particularly squamous cell carcinomas20. In our cohort, only 5.2% of tumors (all LUAD, mostly in forte and mezzo-forte) harbored HLA-LOH (Methods, Supplementary Table 1).
Fig. 3. Genomic classification of lung cancer in never smokers based on somatic copy number alterations.
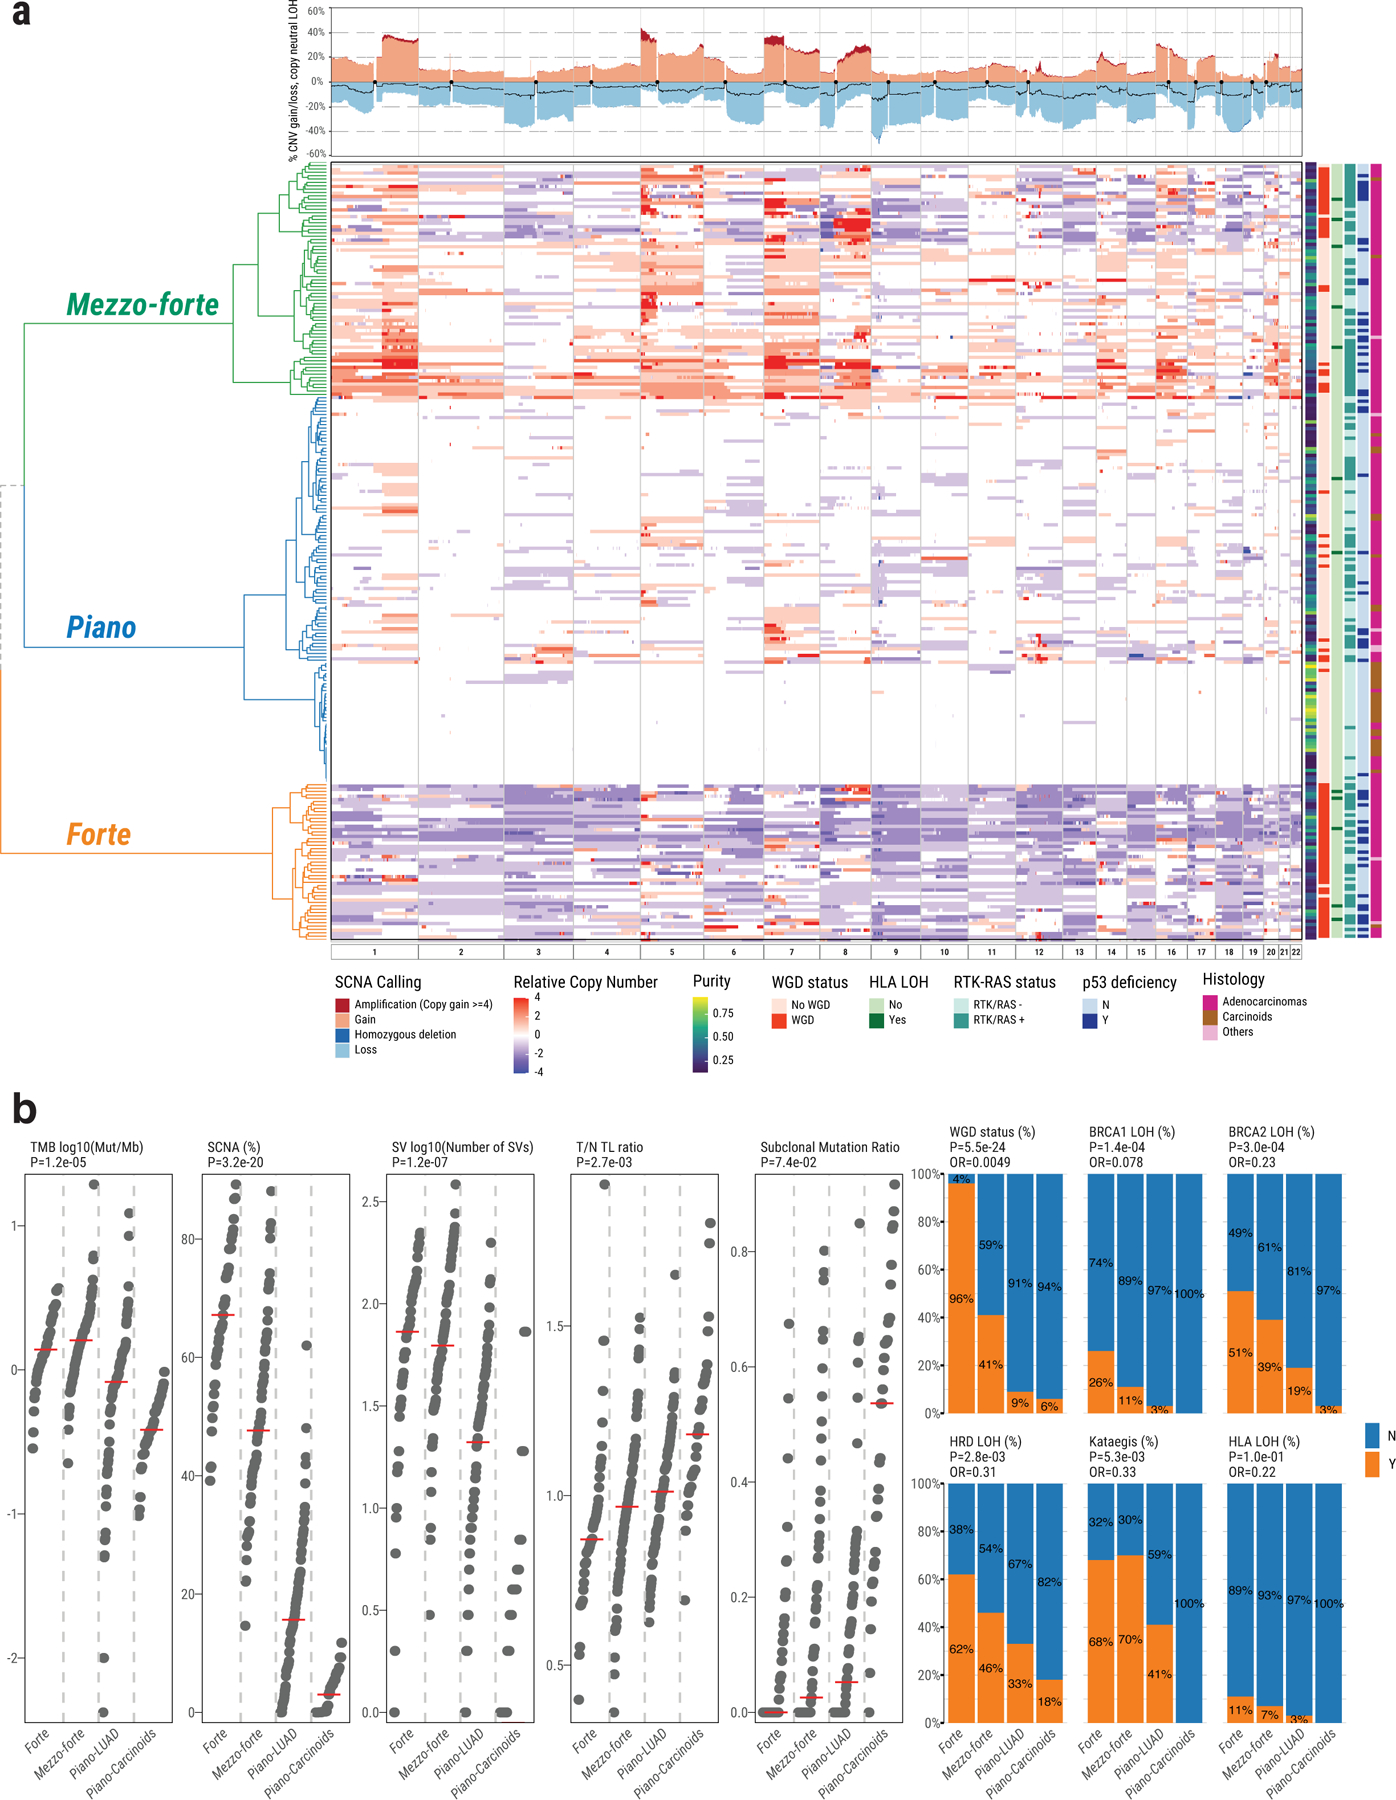
a, Left panel shows unsupervised clustering of arm-level SCNA events: piano, mezzo-forte and forte. The relative copy number is calculated as: total copy number - ploidy (non-WGD=2 and WGD=4). Samples in rows are annotated by tumor purity, WGD status, HLA LOH, RTK-RAS status, TP53 deficiency, and tumor histological type. Top panel shows SCNA frequency including amplification, deletion and copy neutral LOH (black line). b, Comparison of genomic aberrations or features (Y=“with”, N=“without”) among forte, mezzo-forte, piano-LUAD, and piano-Carcinoids tumors. Left five panels: tumor mutation burden, percentage of genome with SCNAs, SV burden, T/N TL ratio and subclonal mutation ratio. P-values are calculated using two-sided Mann-Whitney U test. Right six panels: enrichments for WGD, Kataegis, BRCA2 LOH, BRCA1 LOH, HRD LOH and HLA LOH. P-values and OR are calculated using two-sided Fisher’s exact test. All statistical analyses were performed between forte and piano-LUAD.
Genomic features across SCNA subtypes
Notably, several other genomic features of LCINS differed between SCNA-defined subtypes. TMB was much lower in the piano subtype (0.7 Mut/Mb), particularly in carcinoids (0.4 Mut/Mb), compared to forte (1.4 Mut/Mb) and mezzo-forte (1.6 Mut/Mb) (P=2.0e-7 and 3.2e-11, respectively) (Fig. 3b).
While 24/25 recurrently mutated genes (Supplementary Table 4, Supplementary Fig. 7) were previously identified as drivers in the TCGA PanCancer cohort21, many of them had substantial frequency differences from LUAD in smokers and across SCNA subtypes (Extended Data Fig. 4; Fig. 2). For example, TP53 mutations were most common in forte (31.9%, 18.6% and 7.0% for forte, mezzo-forte and piano; P=1.2e-3), while remaining lower than in LUAD from smokers (53.4%)21. Further, we identified one likely new driver gene, UBA1 (6/9 in piano), which encodes an E1 ubiquitin conjugating enzyme that acts as one of the main orchestrators of the cellular DNA damage response22. All 25 recurrently mutated genes exhibited signals of positive selection23 (Extended Data Fig. 5).
Over half of the tumors in mezzo-forte had EGFR mutations (51.4% vs. 9.0% in LUAD from smokers), while only 1.4% had KRAS mutations (vs. 34.0% in LUAD from smokers). Tumors in piano were less likely to have TP53 deficiency or aberrations in EGFR and other RTK-RAS genes (P=4.4e-6 and 4.3e-7, respectively), with the exception of KRAS (76.5% of KRAS+ tumors were in piano, P=0.02). While carcinoids in piano were enriched (P=7.5e-4) with mutations in chromatin-remodeling genes (e.g., ARID1A) as previously observed11, LUAD in this subtype rarely harbored a known recurrent driver, with the exception of mutations in NKX2–1 (n=4, only in piano), SETD2 (n=8/10 in piano) and UBA1. These piano tumors exhibited low burden of SNVs/indels, SCNAs, SVs, kataegis, and WGD, as well as a high T/N TL ratio and subclonal mutation ratio, with carcinoids being exceptionally quiet (Fig. 3b).
The median number of SVs per tumor varied widely between SCNA subtypes, with 73, 63, and 10 in forte, mezzo-forte and piano, respectively, distributed as translocations (52.4%), deletions (32.7%), and tandem duplications (14.5%) (Supplementary Fig. 8). Of note (Extended Data Fig. 4), RET fusions were present only in the piano subtype (2.6%).
Rare, predicted deleterious, germline variants were identified24 (Methods, Supplementary Table 5) recurrently in CYP21A2, which encodes the 21-Hydroxylase enzyme involved in the synthesis of cortisol and aldosterone (n=8, 6 with an identical stop-gain variant, more common in forte and mezzo-forte) and GLUD2, which encodes for Glutamate Dehydrogenase 2 in the mitochondria (n=6, identical variant). Among known cancer susceptibility genes, AR was the most frequently mutated (n=5, 4 of which in piano). Variants in both CYP21A2 and AR suggest a role for hormones in driving LCINS, warranting further investigation. A handful of tumors had germline variants in homologous recombination genes25, including BRCA1 (n=3, 2 of which in piano), ATM (n=2), and RAD51D (n=2). Single variants, one per tumor, were identified in CDK4 in forte, SOS1 in mezzo-forte, and RET and MSH6 in piano.
Mutational Signatures in LCINS
Mutational signature deconvolution of single base substitutions (SBS) using SigProfiler26,27 identified 14 previously reported signatures from COSMIC (Supplementary Table 6, Fig. 4, Supplementary Fig. 9). Notably, SBS18, related to damage by reactive oxygen species (ROS)28, was observed in 46% of samples, particularly in SCNA subtypes forte and mezzo-forte (59.6% and 67.1%, respectively, P=2.2e-9 in comparison to piano). SBS8, linked to nucleotide excision repair deficiency29 and late replication errors30, was present in 13% of samples, particularly in carcinoids (30.3%, P=2.7e-4). In the 38 LUAD from PCAWG12, SBS8 was not identified, indicating possible differences in the etiology of tumors from smokers and never smokers. Signature extraction using indel (ID-83) and double base substitution (DBS-78) profiles26 identified six ID (ID1, 2, 3, 5, 8, and 9) and four DBS (DBS2, 4, 9, and 11) signatures (Supplementary Fig. 10).
Fig. 4. Landscape of mutational processes in Sherlock-Lung.
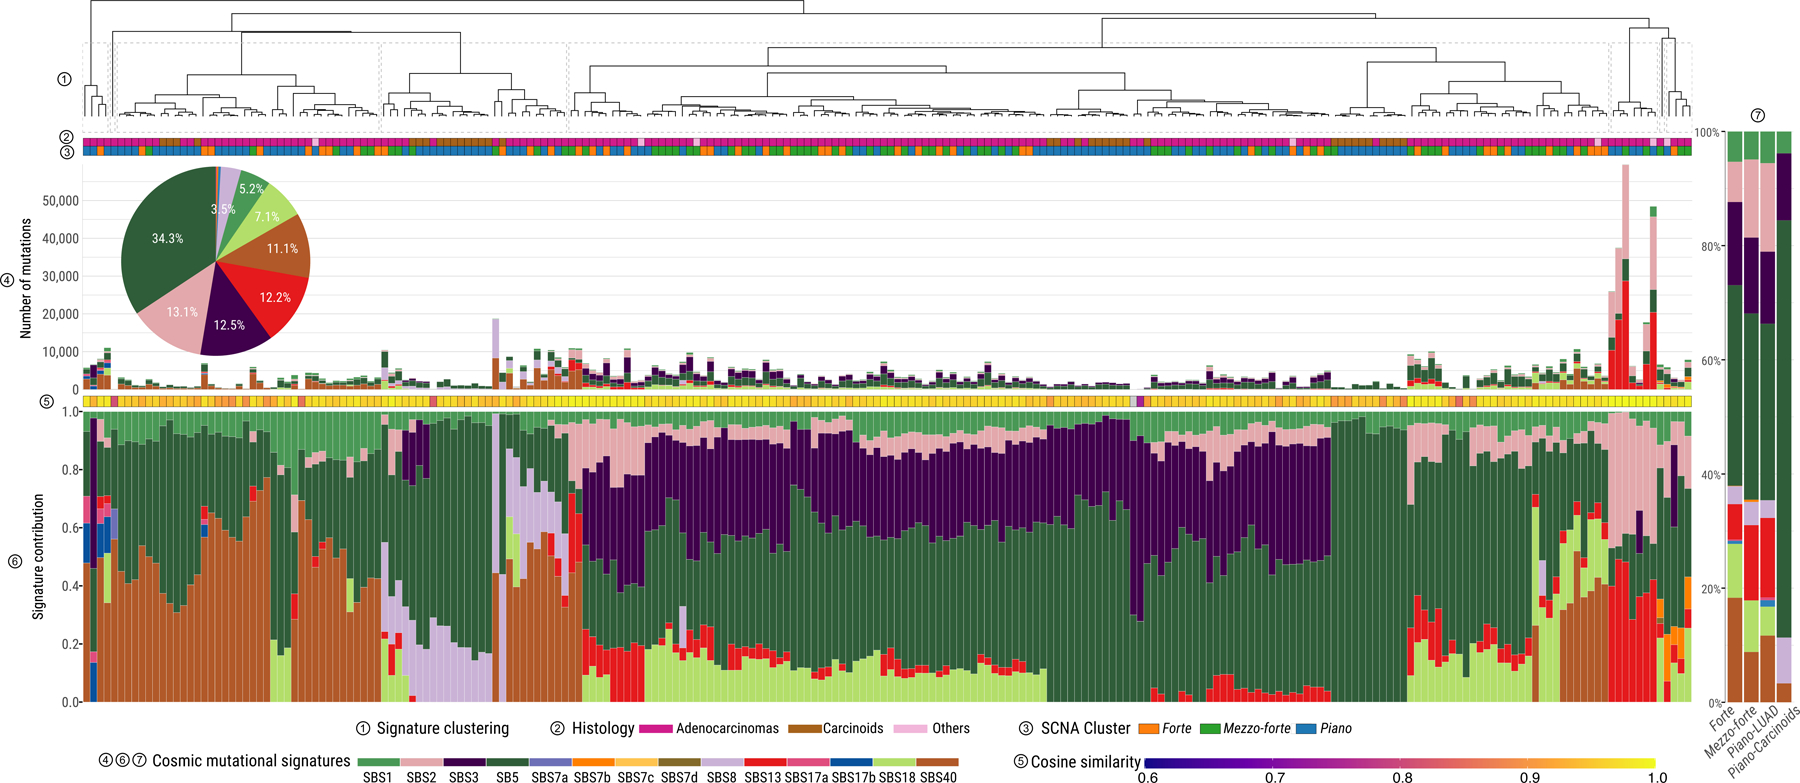
Mutational signature profile of single base substitutions (SBS) across 232 Sherlock-Lung samples. Panels from top to bottom: 1) Unsupervised clustering based on the proportion of SBS signatures; 2) Tumor histological type; 3) SCNA cluster; 4) Pie chart showing the percentage of mutations contributed to each SBS signature and the barplot presenting the total number of SNVs assigned to each SBS signature; 5) Cosine similarity between original mutational profile and signature decomposition result; 6) Proportions of SBS mutational signatures in each sample. 7) Proportions of SBS mutational signatures in each SCNA subtype.
About 58% of samples (n=135) had ≥100 SNVs, mostly subclonal (median fold-change=1.2, interquartile range=1.0–1.5), assigned to APOBEC mutational signatures SBS2 and SBS13 (Supplementary Note, Supplementary Fig. 11a,b), with substantial inter-tumor heterogeneity (Fig. 4). APOBEC mutational loads were verified using P-MACD31 (Supplementary Note, Supplementary Fig. 11c). APOBEC signatures were dominant (>80%) in 4 hypermutated tumors (TMB>8 Mut/Mb), 1 in forte and 3 in piano. Significant enrichment of the APOBEC signature was observed in TP53-deficient (P=1.9e-8) and RTK-RAS+ (P=3.5e-8) tumors.
In all tumors, endogenous processes (Supplementary Table 7) predominated over exogenous processes32 (median cosine similarities of 0.96 and 0.82, respectively, P=4.8e-53, Extended Data Fig. 6). Only a few samples showed higher cosine similarities combining exogenous and endogenous signatures in comparison with endogenous signatures alone (Supplementary Fig. 12), particularly 6 tumors (4 in piano) with a signature of nitrated polycyclic aromatic hydrocarbons (Nitro-PAH), 1,8 dinitropyrene [DNP])32, contributing 18.7% of SNVs on average in these samples. No additional dominant or recurrent genomic events were apparent in these tumors (Supplementary Fig. 13). Nitro-PAHs derive mostly from diesel exhaust and are associated with cancer risk33.
The mutational signature associated with direct exposure to tobacco smoking (SBS4) was not observed, even in 62 cases with reported exposure to second-hand tobacco smoking (“passive smoking”) (Fig. 4). Our simulations demonstrated that signature SBS4, if present, is below the detection threshold of 15% of somatic mutations (Supplementary Note, Supplementary Fig. 14). The lack of passive smoking signatures was not explained by tumor purity differences between passive and non-passive smokers (P=0.39, Fig. 5a), and was confirmed by measuring alkylation-induced mutagenesis34 (Supplementary Note, Fig. 5b). Directly comparing the mutational patterns in passive versus non-passive smokers, we found strong similarities between the two groups (Fig. 5c-e) (Q>0.05 for all SBS, DBS and ID signatures), even comparing highly and lowly exposed subjects (Methods, Supplementary Fig. 15, Supplementary Table 8) or comparing strand asymmetries for mutation types or SBS signatures (Supplementary Fig. 16-17). Of note, tumors from passive smokers had shorter telomere length (P=0.005, Supplementary Fig. 18).
Fig. 5. Comparison of mutational spectra between passive smokers and non-passive smokers in Sherlock-Lung.
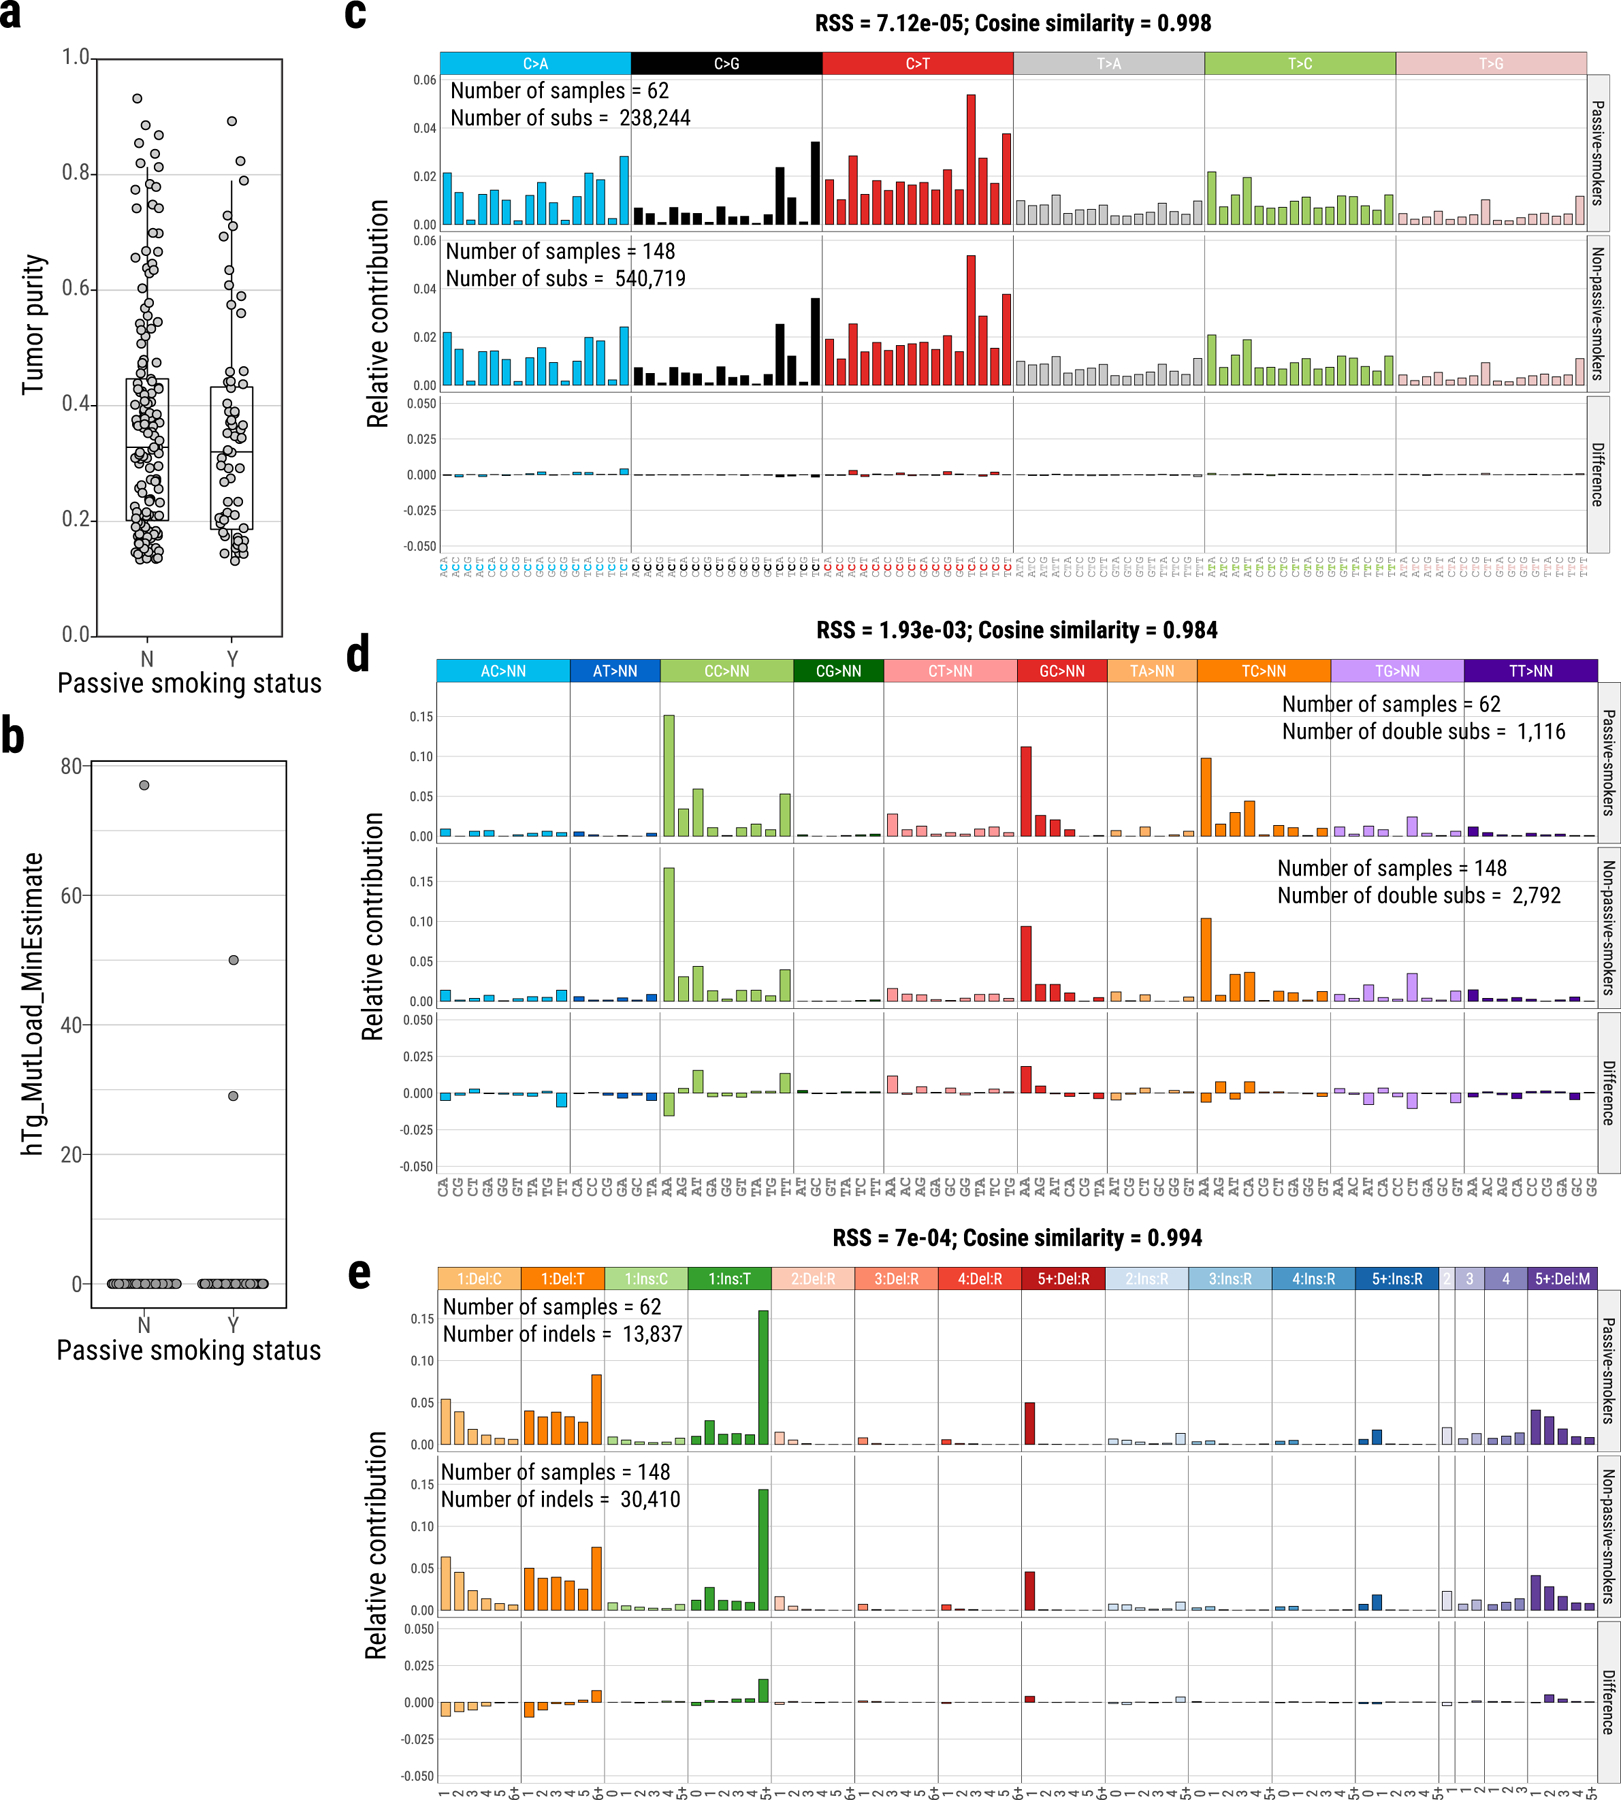
Identification of tumor purity (a) and alkylation-induced mutagenesis (hTg → hGg signature) (b) between passive smokers (Y, N=62) and non-passive smokers (N, N=148). Mutational spectra comparison of single base substitutions (c), double base substitutions (d) and indels (e) between passive-smokers and non-passive smokers.
Genomic Instability
Overall, 36.2% of tumors had WGD, with much higher prevalence in the forte subtype (95.7%, vs. 41.4% and 8.7% in mezzo-forte and piano, respectively) (Extended Data Fig. 4). Similarly, the proportion of the genome affected by SCNAs was much lower in piano than forte or mezzo-forte tumors (P=6.8e-35; Supplementary Fig. 19).
Kataegis was identified in 49.6% of tumors, with an average of 4 events per sample (range: 1–55), rarely in piano tumors (29.6%, versus 68.1% and 70%, in forte and mezzo-forte, respectively; P=1.3e-9). As expected, mutations within kataegis events had APOBEC-related signatures26 in both APOBEC3A-like and APOBEC3B-like tumors35 (Supplementary Note, Supplementary Fig. 20). Kataegis frequently occurred within the MDM2 locus (P=1.3e-15) and often co-localized with SVs (Supplementary Fig. 21).
We estimated telomere length (TL) using two previously published methods36,37, with comparable results, confirming an inverse correlation with age (r=−0.14, P=0.04), and no association with tumor purity (Supplementary Fig. 22). Notably, tumor TL in LUAD of LCINS was significantly longer than that observed in LUAD of smokers36 (6.4 Kb, 95% confidence intervals [CI]: 5.3–7.6 Kb, P=7.1e-11, Extended Data Fig. 7a, Supplementary Fig. 23). Losses of 9q, 9p, and 22q, and HLA LOH were significantly associated with TL shortening (two-sided t-test; Q < 0.05), and were most frequent in forte and mezzo-forte (Extended Data Fig. 7b,c). While tumors in forte had significantly shorter telomeres (mean T/N TL ratio 0.9, P=0.01, t-test), mezzo-forte tumors displayed no significant difference, and piano had significantly longer telomeres than their matched normal tissues (mean T/N TL ratio 1.1, P=4.7e-3).
Approximately 16.0% (n=37) of tumors had a high HRDetect score25,38,39 (>0.7), with genomic aberrations predictive of Homologous Repair Deficiency (HRD) (Extended Data Fig. 8), particularly in forte and mezzo-forte (P=1.4e-3 versus piano) (Fig. 3b). Biallelic loss of ATM in one tumor and monoallelic loss of HRD-associated genes in 42% of tumors had higher HRDetect scores (Extended Data Fig. 9).
The Evolutionary History of LCINS
We reconstructed the likely order of acquisition of recurrent genomic aberrations, including SCNAs, WGD, and common cancer driver genes within each of the SCNA subtypes in LUAD (Methods, Fig. 6). In all three subtypes, mutations in driver genes TP53, RBM10, KRAS or EGFR were generally early events, occurring prior to both WGD and most other SCNAs. Two exceptions in mezzo-forte were the earlier occurrences of LOH on 17p targeting TP53 and LOH on 3p12.2, likely targeting transcription factor ZNF717, suggesting that these events are also early drivers of mezzo-forte tumors. Whereas putative copy number drivers in mezzo-forte were balanced between gains and LOH, forte was dominated by LOH events. Compared to mezzo-forte, WGD generally occurred after other key SCNAs in forte. Early events in piano included mutations in SETD2, LOH of 8p and 17p, and focal gain at 3p12.2, and at 2p11.2 involving the immunoglobulin gene IGKV1–5.
Fig. 6. Diagram of estimated ordering of significant SCNAs (including chromosome gains/losses and mutations) relative to WGD in three lung cancer subtypes based on SCNA clusters forte, mezzo-forte and piano.
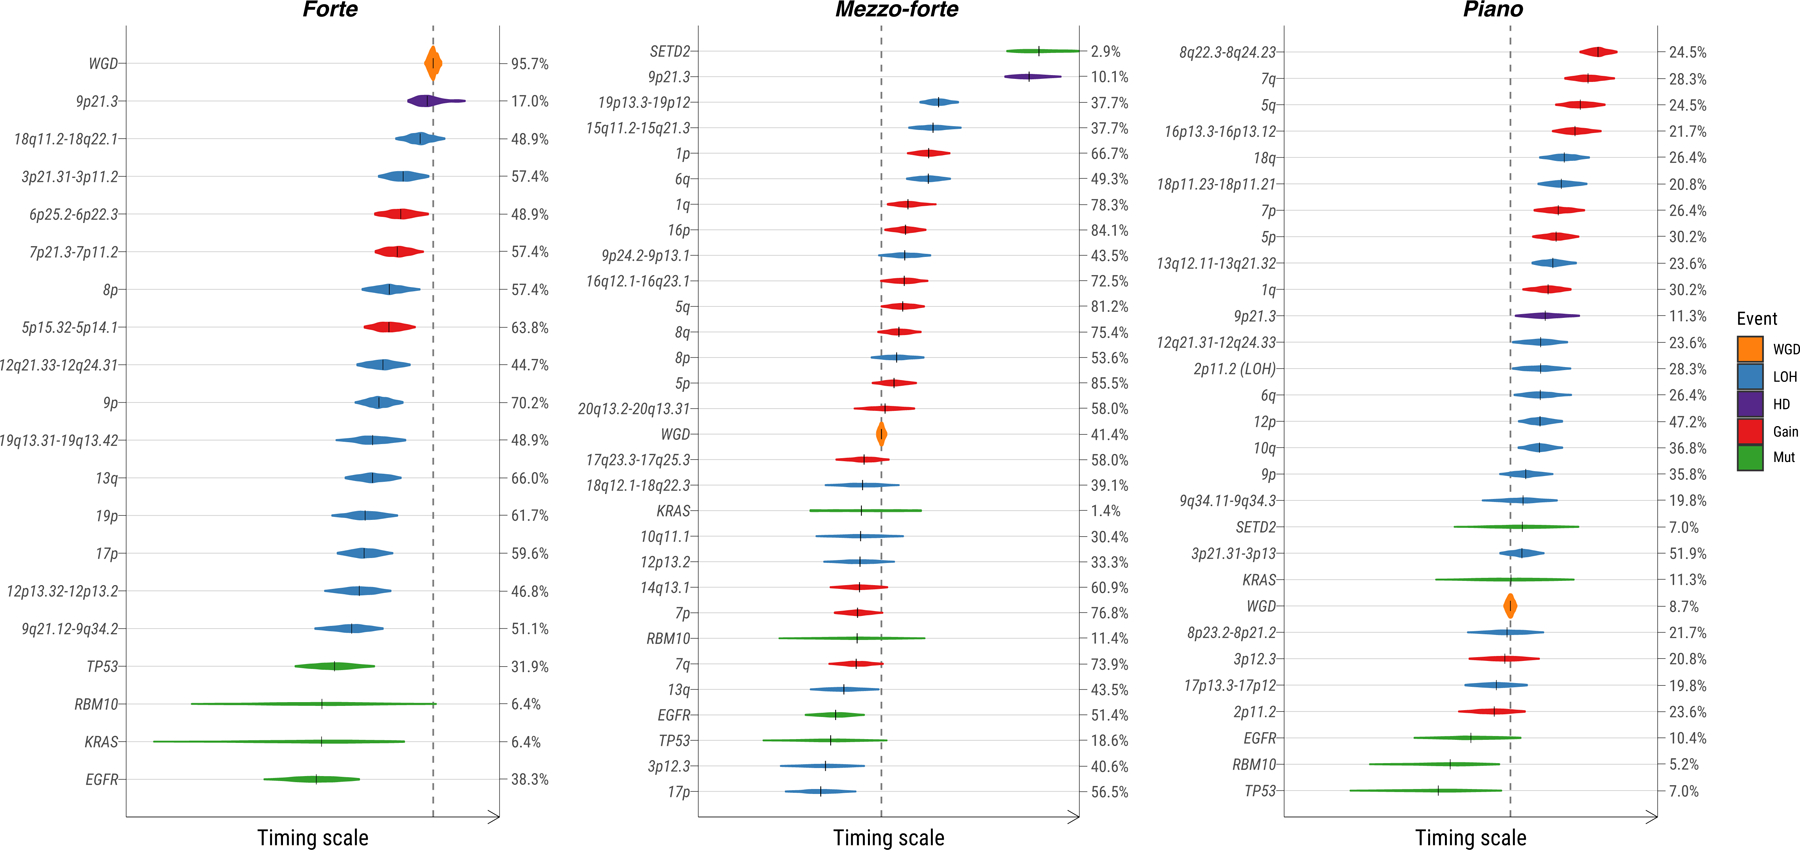
The size of violin plots denotes the uncertainty of timing for specific events across all samples and the short black solid lines represent the median time. The vertical dashed line indicates the median time for WGD events. Ordering of genomic events was based on the PlacketLuce package model with 95% CI. The frequency of each event is labeled on the right y-axis.
Using the proportion of mutations on ≥2 chromosome copies allows for the relative timing of clonal copy number gains and copy-neutral LOH (CN-LOH)40,41. Gains of 5q, 16p, 1p, and 14q occurred early during tumor development, whereas gain of 7q and CN-LOH events occurred relatively late (Supplementary Fig. 24a). Reversing this method to time driver mutations relative to clonal gains or CN-LOH identified that mutations in EGFR, MET, KRAS, ERBB2, TP53, and UBA1 generally occurred before the corresponding copy number gain (Supplementary Fig. 24b). In contrast, mutations in PIK3CA and SFTPB occurred after gain events.
We adopted a previously validated model42 using the clock-like mutations (CpG>TpG in an NpCpG context) to time the appearance of the most recent common ancestor (MRCA) of all tumor cells. We used an estimated acceleration rate of 1×, given the low mutational burden and the paucity of exogenous mutational signatures in LCINS. The MRCA, by definition, possesses all driver mutations for tumorigenesis. Grouping tumors according to common driver events (>3% frequency) (Fig. 7a) enables the estimation of the occurrence of these events in an individual’s lifetime. For example, in tumors with EGFR mutations the MRCA was estimated to appear at 61 years of age, but the tumors became clinically evident a median of 8 years later. There were substantial latency differences across tumors with different drivers. For example, in tumors harboring ERBB2, CDKN2A, or TP53 mutations, or NKX2–1, STK11, or chr22q SCNAs, the MRCA appeared more than a decade prior to clinical diagnosis. In contrast, tumors with MDM2 amplifications, or MET, RBM10, HUWEI1 or KRAS mutations, had much shorter latency. Notably, tumors in piano had significantly longer latency (median: 9.10 years) than forte (median: 0.08 years) and mezzo-forte (median: 0.28 years) (P = 8.3e-4, Fig. 7b), suggesting a large amount of time passed between the last clonal sweep and diagnosis, during which mutations continued to accumulate. This observation was robust to assumed acceleration parameter values between 1× and 20× (Supplementary Fig. 25). We also observed a lower age of appearance of the MRCA in piano (median: 60.4 years), particularly the piano with carcinoid histology (median: 55.0 years) compared to forte (median: 63 years) (all piano: P = 0.038; piano carcinoids: P = 0.062, Fig. 7c), which requires further confirmation in larger future studies.
Fig. 7. Reconstruction of the evolutionary history of lung cancer in never smokers.
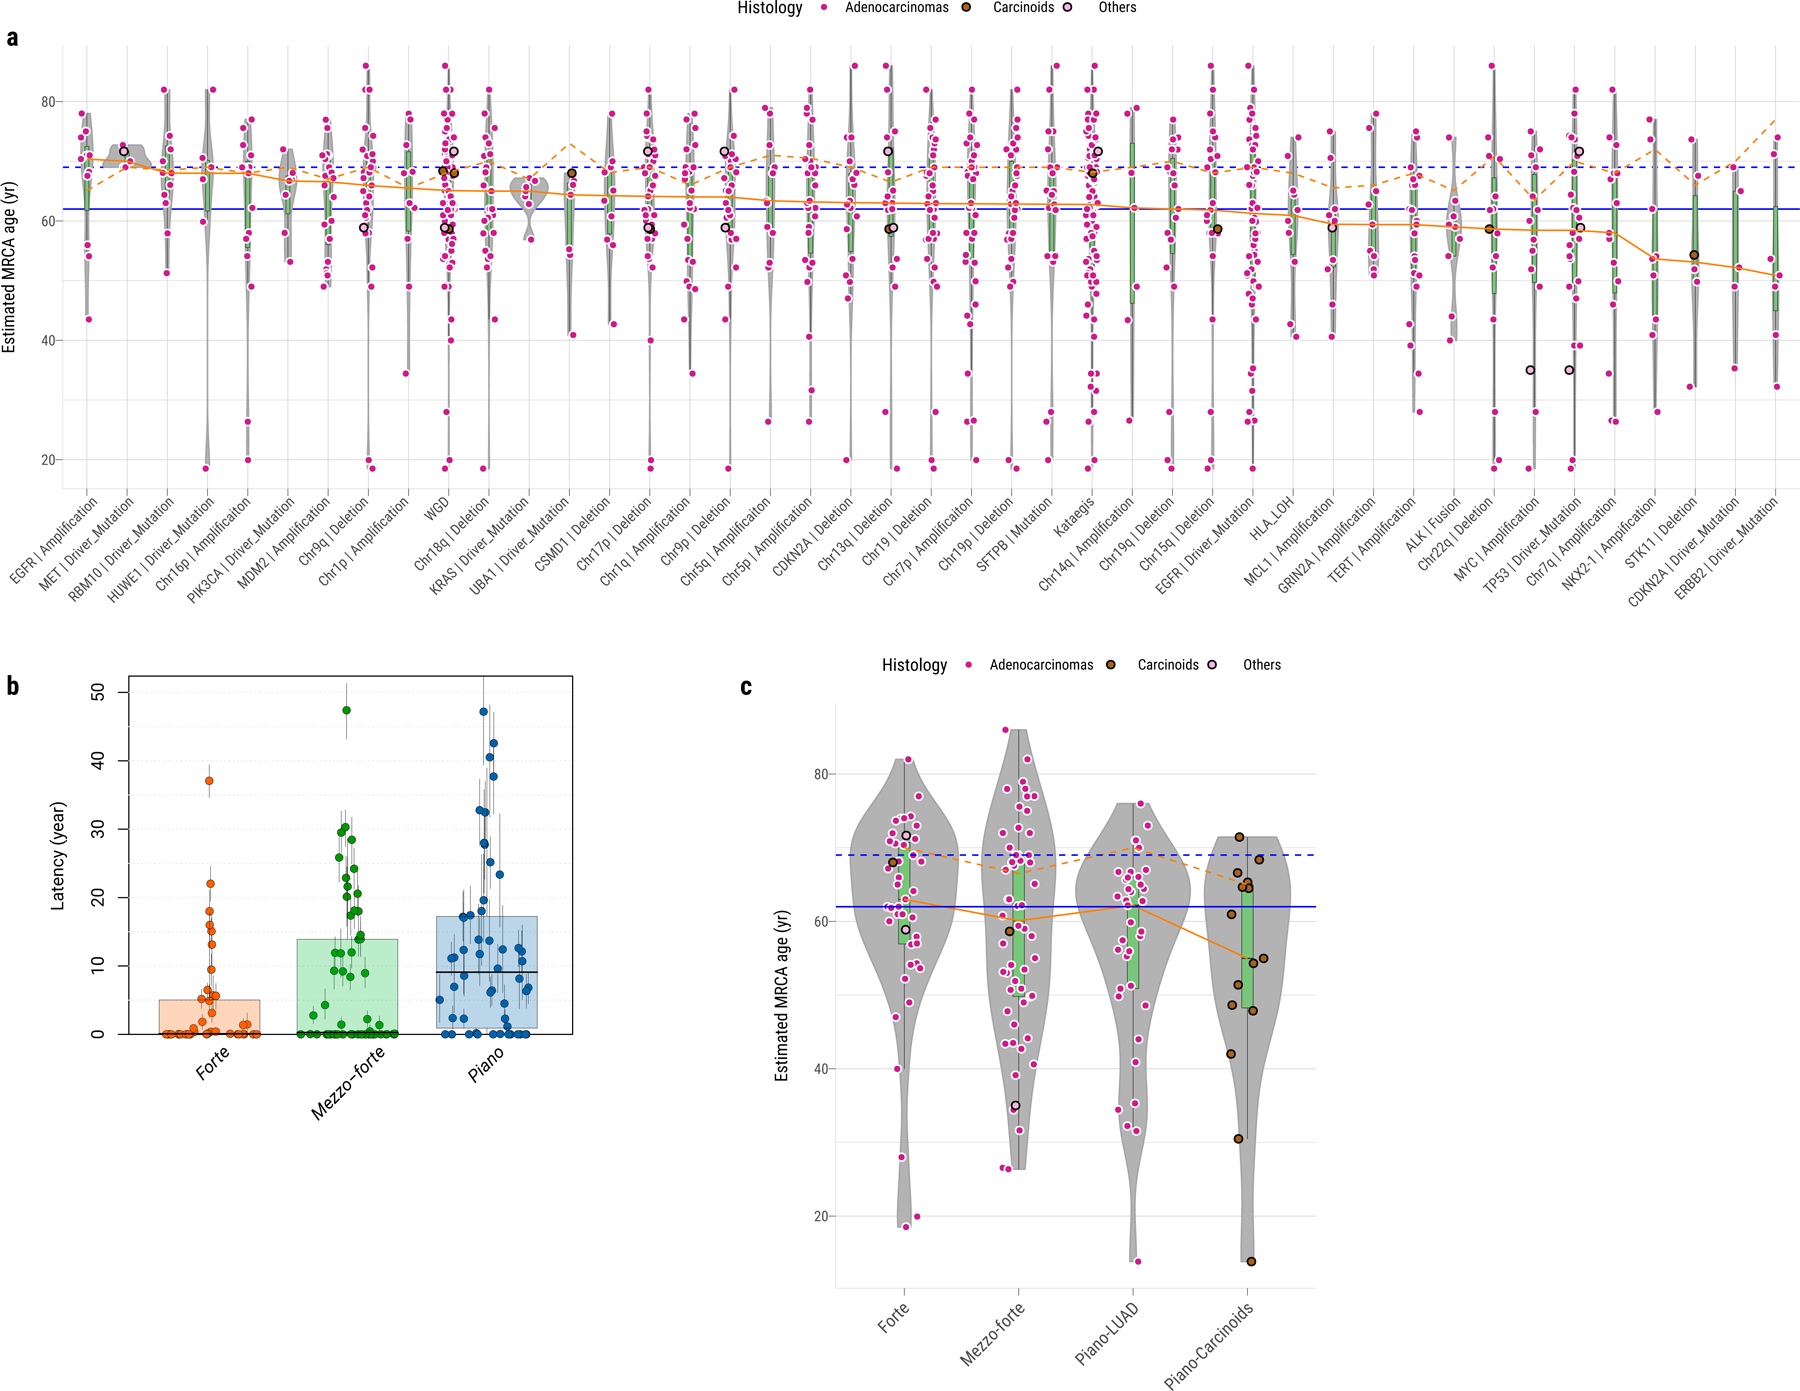
a, Estimated age at which the most recent common ancestor (MRCA) emerged in tumors (y-axis), grouped by genomic alterations or features (x-axis, frequency >3%) as shown in Figure 2. The color of each dot represents the tumor histological subtype. The orange solid and dashed lines indicate the median estimated MRCA age and the median age at diagnosis in the same group, respectively. The blue solid and dashed lines indicate the median estimated MRCA age and the median age at diagnosis in all samples, respectively. b, Boxplots show the latency between the MRCA and the age at diagnosis based on 1× acceleration rate across forte, mezzo-forte, and piano subtypes with 95% CI for each tumor. c, Similar to a, estimated MRCA age among SCNA subtypes: forte, mezzo-forte, piano-LUAD and piano-carcinoids. For box plots from a to c, center lines show the medians; box limits indicate the 25th and 75th percentiles; whiskers extend 1.5 times the interquartile range from the 25th and 75th percentiles.
Impact of molecular pathways on survival
Cases with TP53 mutation or MDM2 amplifications had poor survival (hazard ratio [HR]=2.9, 95% confidence interval CI=1.6–5.2, P=4.5e-4; Supplementary Fig. 26a,b), as previously reported in LCINS43 and NSCLC44, with a suggestive stronger impact of TP53 mutations compared to MDM2 amplifications (Fig. 8a). Similarly, EGFR mutation, CHEK2 LOH, 22q loss, and 15q loss were associated with poor survival (Fig. 8b-e). A risk score calculated as the mutational burden of these five independent genomic alterations (Fig. 8f) showed an increment of mortality risk for each genomic alteration of approximately 1.9 (CI=1.5–2.4, P=3.7e-7).
Fig. 8. Association between genomic aberrations and clinical outcomes in never smoker lung cancer patients.
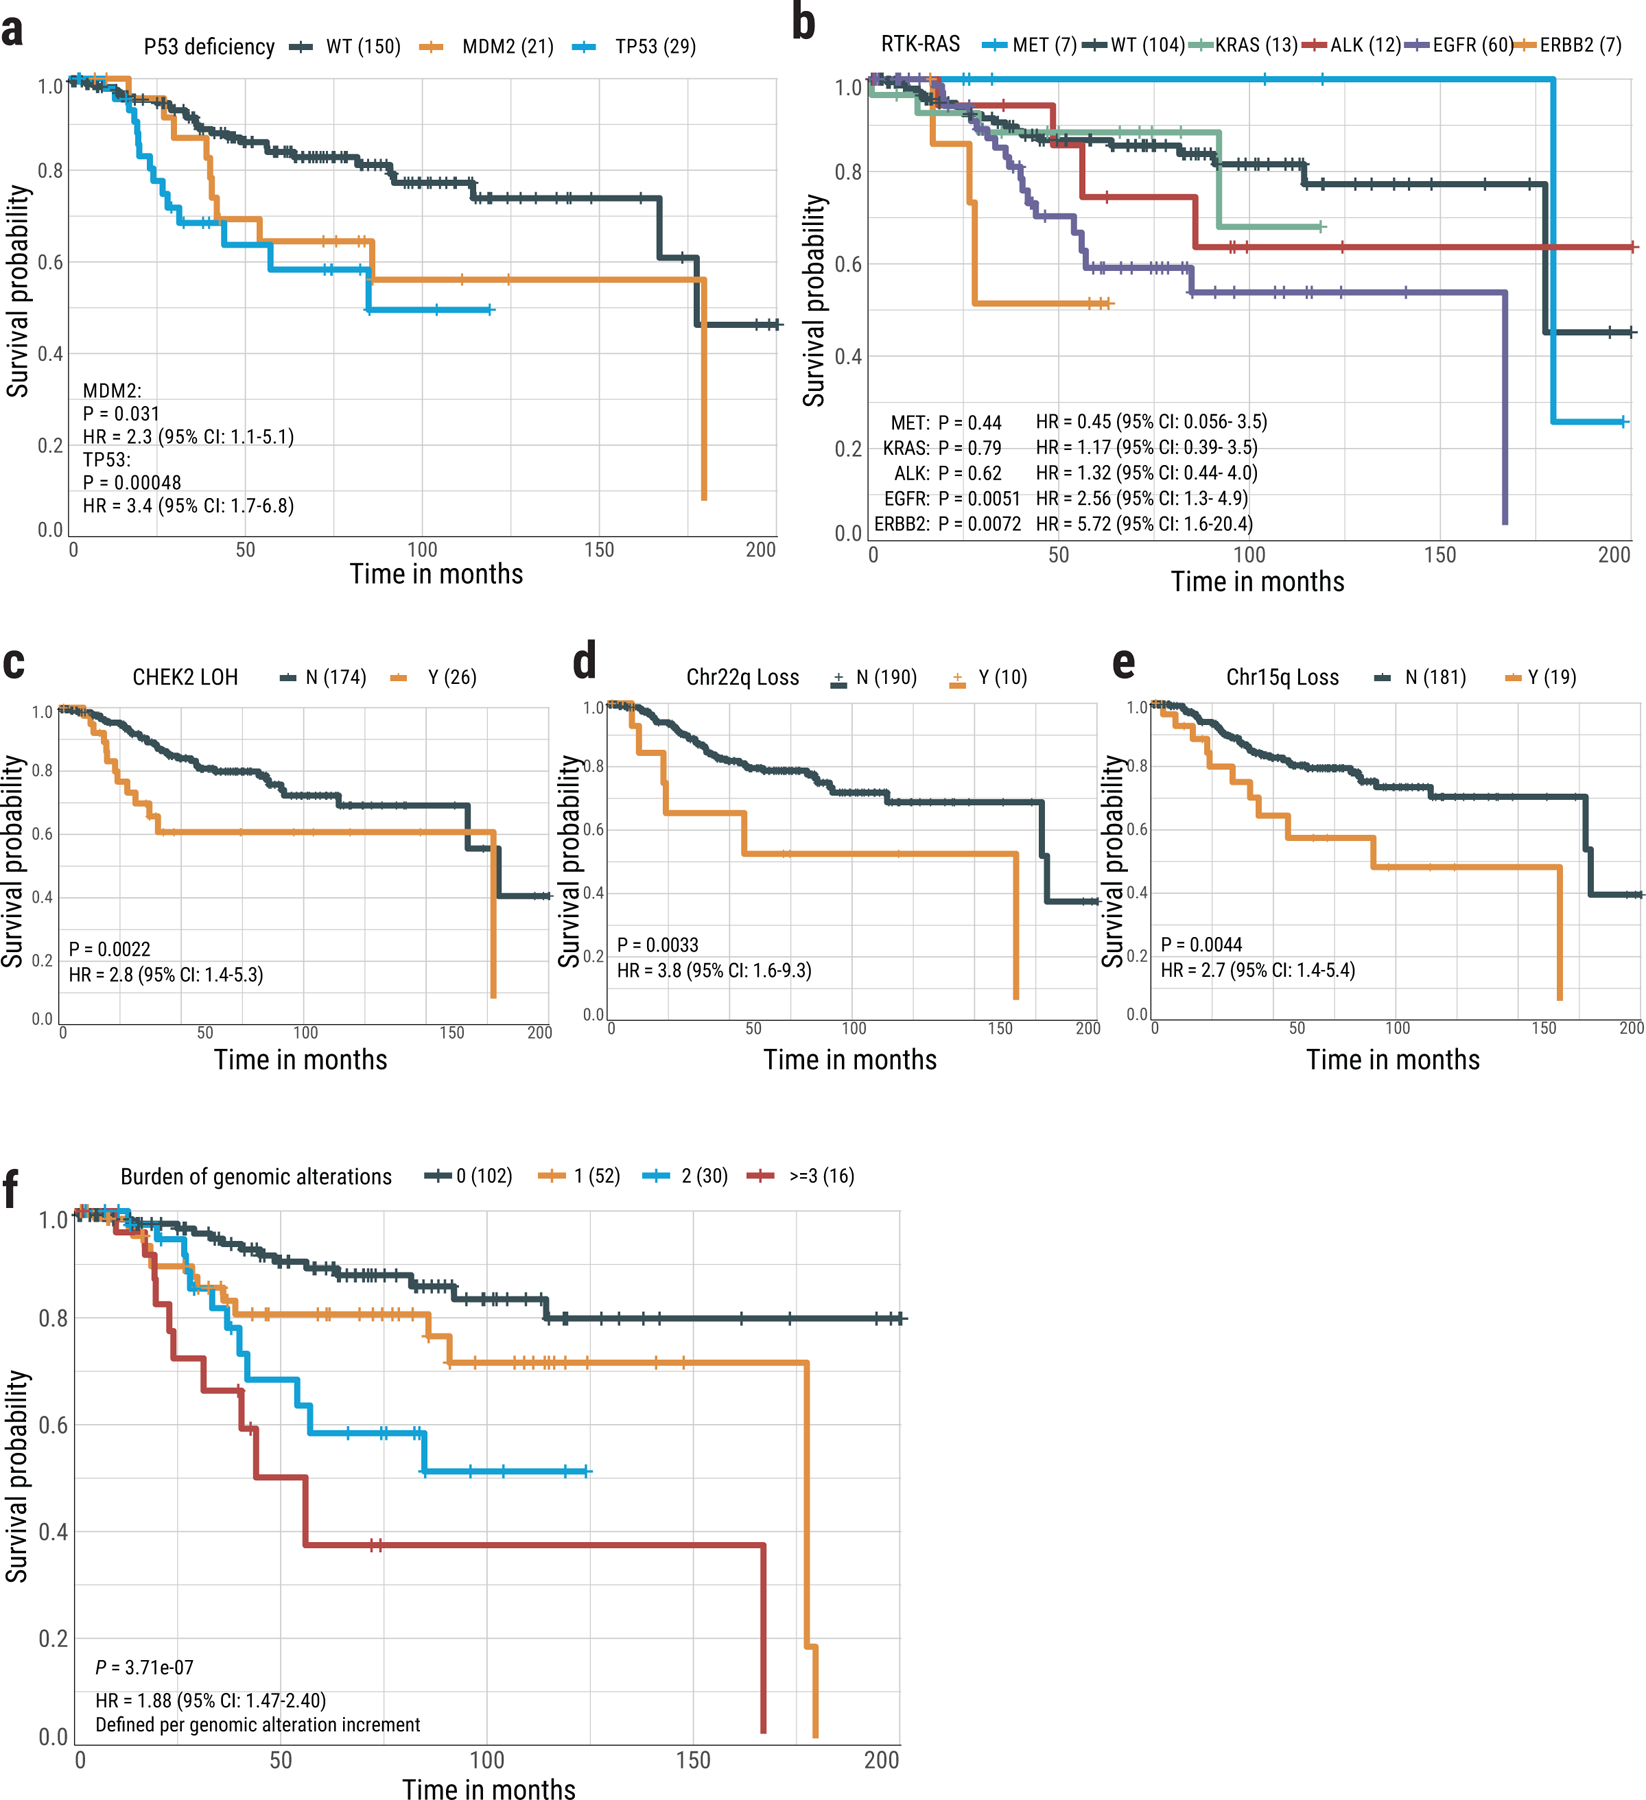
Kaplan-Meier survival curves for overall survival stratified by (a) TP53 mutations and MDM2 amplification, (b) activation of individual driver genes in the RTK-RAS pathway, (c) CHEK2 LOH, (d) Chr22q loss, (e) Chr15q loss, and (f) Risk score based on the burden of five genomic alterations. P-values for significance and hazard ratios (HR) of difference are calculated using the cox proportional hazards regression (two-sided) with adjustment for age, gender and tumor stage. No multiple-testing correction applied. For groups in each plot, Y= “with” aberration; N=“without” aberration. The numbers in brackets indicate the number of patients.
Interestingly, no significant association was found between RTK-RAS status and overall survival (Supplementary Fig. 26c). However, there were strong differences in clinical association patterns across different genes in the pathway (Fig. 8b). Patients with ERBB2 mutations had poor overall survival (HR=5.7, CI=1.6–20.4, P=7.2e-3), although >50% of ERBB2+ tumors (4/7) also harbored TP53 alterations, requiring further confirmation in ERBB2+/TP53− tumors. KRAS mutations and ALK fusions were also associated with poor survival, but not significantly. In contrast, patients with MET-altered tumors had better overall survival than the RTK-RAS− group. The small number of patients with both TP53-deficient and RTK-RAS− tumors (n=8) had poorer survival (HR=5.3, CI=1.8–15.2, P=2.0e-3; Supplementary Fig. 26d).
Patients with piano tumors had overall better survival (HR=0.52, CI=0.3–0.9, P=0.03), particularly patients with carcinoids (HR=0.24, CI=0.06–1.0, P=0.05), as did patients with SETD2 positive tumors (HR=0.13, CI=0.02–1, P=0.05) (Supplementary Fig. 26e-g).
Discussion
WGS of 232 LCINS samples revealed three subtypes based on SCNAs and profound differences from adenocarcinomas in smokers. Whereas WGD is observed in over 60% of LUAD in smokers42,45 and is considered to be a major driver of aggressive lung adenocarcinomas46,47, it occurs in 36% of LCINS overall, but in 95.7% of the forte subtype. While mezzo-forte is enriched for specific chromosomal arm-level amplifications and has frequent EGFR mutations, tumors in the quiet piano have low mutation burden, infrequent WGD, small numbers of known drivers, and a larger proportion of subclonal mutations indicative of extensive intra-tumor heterogeneity.
Forte tumors and tumors from passive smokers had shorter telomeres than their matched normal samples, while piano had longer telomeres, suggesting fewer cell divisions. TERT was amplified in only 11.6% tumors and had promoter mutations in only 0.9%, and they were rarely in piano, excluding a major role for TERT reactivation in TL elongation.
Notably, we found no major difference between passive and non-passive smokers for mutational signatures or mutation types, while we observed a few tumors with diesel exhaust signatures. Simulation studies showed that smoking-related mutations in the 62 tumors from passive smokers had to be below the detection threshold of 15%. It is possible that SBS4 is present in some passive smokers below this mutation threshold. Second-hand tobacco smoke has been causally linked to lung cancer48, but it is a weak carcinogen compared to active smoking48,49 and may also act through alternative tumorigenic processes and selective constraints50. Larger studies including highly exposed cases and in vitro or animal models are needed to definitively characterize the tumors arising from these exposures.
The long telomeres, low growth rate suggested by the occurrence of the MRCA approximately a decade prior to tumor diagnosis, scarcity and heterogeneity of driver mutations, low mutation rate, high ITH, and paucity of SBS18 indicating low ROS activity51, are all consistent with piano tumors being derived from adult stem cells that have exited their quiescent state52,53. Driver genes specifically mutated in piano also suggest stem-like features. Oncogenic mutations in KRAS, the most frequently mutated driver gene in piano, have been shown to induce proliferation of bronchioalveolar stem cells, giving rise to lung adenocarcinoma54. Similarly, KRAS55,56 and UBA157 have important regulatory roles in hematopoietic and pluripotent stem cells. The presence of fusions and germline variants in RET (as well as mutations in NKX2, a regulator of RET58) uniquely in piano suggests a role for RET in these tumors. RET expression and activity are enriched in human hematopoietic stem cells (HSCs)59 and are involved in murine HSC regulation60. Notably, ARID1A is essential for telomere cohesion61, deleting Arid1a in mice greatly enhances the ability to regenerate organ tissues62–64, and ARID1A depletion in humans promotes cells to enter the cell cycle65. Mutations in ARID1A, as well as NOTCH1, another gene whose signaling has a role in stem cell expansion and progenitor cell survival66, have been found in normal and near-normal bronchial epithelial cells from former smokers67, which are also characterized by long telomeres and polyclonal origins. Notably, alterations in KRAS, UBA1, RET and ARID1A were mutually exclusive in piano. Hypothetically, mutations in NOTCH1, ARID1A or other genes with similar function could promote exit from a quiescent cell state, resulting in high ITH, and could drive some of the tumors with no detected known cancer driver gene mutations or fusions. Carcinoids and LUAD in piano would then represent tumors diagnosed prior to acquisition of a dominant clone. Using RNA sequencing for an orthogonal assessment of stemness and cell of origin (Methods, Supplementary Note), we found that both a “development score”, incorporating expression of the SOX2, SOX9, and HMGA2 genes68–70, and a marker of basal cells suggesting lineage infidelity71 were higher in piano (Supplementary Fig. 27), consistent with piano representing a stem cell-like state. Larger studies are needed to verify the WGS-based stemness hypothesis, possibly using single-cell RNA sequencing and methylome analyses, particularly in tumors with no apparent drivers.
The founder cells of piano appear around a decade before diagnosis and provide an optimal time window for early detection. In contrast, driver gene mutations and WGD or gross SCNAs in the forte and mezzo-forte are generally clonal, with later onset followed by rapid expansion of a single ancestral cell. Their clonal nature could facilitate identification with a single biopsy and successful treatment.
Currently, treatments targeting the most recurrent genomic alterations in forte and mezzo-forte are available or are under investigation in clinical trials, namely for TP5372 or MDM2-TP53 interaction73, as well as for mutations in EGFR or ERBB274–77, genes that conveyed the poorest survival among the RTK-RAS pathway, and even for tumors with both TP53 deficiency and RTK-RAS mutations (21% of our tumors)78. Together with TP53 and EGFR alterations, tumors with loss of chromosome 22q, 15q or CHEK2 LOH were frequently identified, particularly in forte. A 2-fold higher mortality risk was estimated for each of these 5 independent genomic alterations, suggesting that compounds targeting bystander genes that are deleted together with tumor suppressor genes in chromosome arm losses (collateral lethality)79,80 should be explored in these subtypes. Moreover, >15% of tumors had LOH of an HRD associated gene. Targeting these genes could be a promising therapeutic option to explore. Moreover, mutations in HRD associated genes could act as predictors of immune checkpoint inhibitor response81, broadening the options for treatment for this subgroup. In contrast, piano has a scarcity of driver mutations, offering limited targets for therapeutic intervention. Furthermore, due to low TMB82–84 and HLA-LOH20, these patients may not benefit from immunotherapy. However, targeting KRAS85 and stem cell-associated signaling pathways51,86, or regulating the stem cell microenvironment87, are promising for this subtype.
Methods
A detailed description of the methods used in this paper and many additional results are described in the Supplementary Note. Here, we summarize the key aspects of the analysis.
Ethics declarations
Since NCI only received de-identified samples and data from collaborating centers, had no direct contact or interaction with study subjects, and did not use or generate identifiable private information, Sherlock-Lung has been determined to constitute “Not Human Subject Research (NHSR)” based on the Federal Common Rule (45 CFR 46; eCFR.gov).
Collection of Lung Cancer Samples
Fresh frozen tumor tissue and matched germline DNA from whole blood samples or fresh frozen normal lung tissue sampled ~3 cm from the tumor were obtained from 256 treatment-naïve lung cancer patients from five institutions/centers (Supplementary Note). Among the 256 samples, 20 were excluded after quality check and four were excluded based on mutational signatures analysis (Supplementary Note). The resulting 232 samples and the associated demographic and clinical data were included in the final analysis. For these 232 subjects, the mean age at lung cancer diagnosis was 64.8 years (range: 21–86); 75.4% of patients were female. To confirm the ancestry of these patients, we estimated the admixture proportions based on WGS data using the fastNGSadmix88 tool.
Of the 232 tumors, 189 were adenocarcinomas, 36 carcinoids, 5 sarcomatoid carcinomas or undifferentiated non-small cell carcinomas with sarcomatoid features, and 2 squamous cell carcinomas. Three pathologists reviewed the histological diagnoses. Histological images can be found here: https://episphere.github.io/svs. All 232 matched tumor and germline samples underwent DNA whole genome sequencing. Of these, 35 (all adenocarcinomas) also underwent RNA sequencing.
Genome-Wide Somatic Variant Calling
The analysis-ready BAM files were processed using four different algorithms, including MuTect89, MuTect2, Strelka (v2.9.0)90, and TNscope91. To improve the performance of the variant calling, we used Sentieon’s genomics package (v201808.03) to run MuTect, MuTect2 and TNscope. Only those SNVs that passed calling by a minimum of three algorithms were kept. To reduce false positive calling, we applied an in-house filtering script (https://github.com/xtmgah/Sherlock-Lung) similar to our previous publication92. To summarize, variant calling was considered only at the genome positions with 1) read depth >12 in tumor and >6 in normal samples; and 2) variant read count >5 in tumor and VAF <0.02 in normal samples. To remove possible germline variants from the called somatic variants, somatic variants were filtered against the dbSNP138, 1000 genomes (phase 3 v5), ExAC (v0.3.1), gnomAD (v2.1.1)93 database, and an in-house Italian germline variant database from EAGLE WES study (dbGAP access ID phs002496.v1.p1) for commonly occurring SNPs (somatic variant frequency<0.001). The filtered variants were annotated with Oncotator (v1.9.1.0)94 and ANNOVAR95. For the indel calling, only variants called by three algorithms were kept (MuTect2, TNscope, and Strelka). UPS-indel96 algorithm was used to compare and combine different indel call sets. Similar filtering steps as those used for SNV calling were also applied to indel calling. The final set of indels were left normalized (left aligned and trimmed) for the downstream analysis. Clustering of subclonal somatic mutations was analyzed using a Bayesian Dirichlet Process (DPClust) as previously described92,97,98. Further details are available in the Supplementary Note.
Germline Variant Calling
Final BAM files from paired normal samples were used to call germline variants using the GATK Haplotyper algorithm in Sentieon’s genomics package. Default parameters or suggested input files, such as the most recent dbSNP VCF file were applied. The final joint callings from all normal samples were generated and annotated with ANNOVAR95. Strict filtering criteria were used to identify the potential pathogenic variants: 1) Minor allele frequencies <0.05% in the GnomAD non-cancer and non-finnish European ancestry dataset (v2.1.1); 2) Estimated CharGer score >4 to include the pathogenic or likely-pathogenic variants based on the CharGer algorithm (version 0.5.2)99. The default parameters for CharGer were used and the most damaging interpretation from ClinVar100, excluding OMIM and genereview as submitters, was used for annotation; 3) Variants predicted to have ‘silent’ functional activity were removed, including variants in the UTR, upstream or intron regions. All the final germline variants have been manually inspected through IGV and the suspicious variants have been removed.
Driver Gene Discovery
The IntOGen pipeline23, which combines seven state-of-the-art computational methods, was employed to detect signals of positive selection in the mutational pattern of genes across the cohort. Default parameters were used, and in the post-processing phase, the gene CSMD3 was filtered out based on warnings provided by the pipeline. The 25 genes identified as drivers in the cohort were classified according to their mode of action in tumorigenesis (i.e., tumor suppressor genes or oncogenes) based on the relationship between the excess of observed non-synonymous and truncating mutations computed by dNdScv101 and their annotations in the Cancer Gene Census (CGC). In the case of UBA1, only the excess values were used. Genes with conflicting computed and annotated mode of action are labeled ambiguous. To identify potential driver mutations across the 24 cancer driver genes annotated in the CGC, we used boostDM gene-tumor type specific (LUAD) or more general models depending on their availability and accuracy102.
Somatic Copy Number Alterations (SCNA) Analysis
We used the updated Battenberg (v2.2.8) algorithm98 to estimate the clonality of each segmentation, tumor purity and ploidy (Supplementary Note). Unsupervised clustering of copy number profiles including both major clone and subclone segmentations were generated based on relative copy number log2 (copy number/Tumor_Ploidy) using the euclidean distance and Ward’s method. Recurrent copy number alterations from WGS at a gene level were identified using GISTIC 2.0103 based on the major clonal copy number for each segmentation (Supplementary Note).
Whole Genome Doubling Identification
Multiple methods were used to determine the genome doubling status for each tumor. First, tumors were considered to have undergone WGD if greater than 50% of their autosomal genome had a major copy number (MCN) (i.e., the more frequent allele in a given segment) >=246. Also, the number of chromosomes with 50% of the segment with MCN>=2 had to be greater than 11. Next, we applied a modified version of the published WGD algorithm104, where a p-value was obtained using 10,000 simulations with observed probabilities of copy number events. For samples with ploidy ≤3 and ploidy=4, p-value thresholds of 0.001 and 0.05 were used, respectively. All samples were classified as genome doubled if the ploidy exceeded 4. Tumors were determined to have undergone WGD if the tumors met the criteria for WGD for both methods. Finally, to improve the WGD calling, we manually checked the Battenberg CNA profile to resolve tumors with ambiguous WGD calling (e.g., MCN close to 0.5), evaluating features such as presence of multiple copy losses after WGD (total copy of 3) and/or LOH events having 2:0 copy number state. For the chronological reconstruction of genomic aberrations, we limited the WGD samples with average ploidy > 3.
Structural Variants Calling and Clustering
The Meerkat algorithm105 was used to call somatic SVs and estimate the corresponding genomic positions of breakpoints (Supplementary Note). The parameters were selected based on the sequencing depth for both tumor and normal tissue samples and the library insert size as in a previous publication92. Driver oncogenic fusions were selected from SVs based on the driver gene list21 and an oncogenic fusion list previously reported in LUAD8. We selected the fusions with the following SV features in Meerkat output: “gene-gene”, “head-tail” and “in_frame” or “out_of_frame”. All driver oncogenic fusions in our study were reported with the same partners and no other new recurrent oncogenic fusion was found.
We used the algorithm developed by Li et al.106 to cluster the SVs in each sample. The algorithm groups the structural variants into clusters based on the proximity of breakpoints, the number of events in that cluster regions and the size distribution of those events. A cluster contains structural variants that have arisen from the same event and are significantly closer than expected by chance, given the orientation and the number of SVs in that patient. In addition, to visualize the hotspots of breakpoints, we counted the number of breakpoints across the whole genome using a 5 Mb window. A similar approach was also applied to visualize the kataegis hotspots.
Telomere Length Estimation
We estimated telomere length (TL) in kb using TelSeq107. We used 7 as the threshold for the number of TTAGGG/CCCTAA repeats in a read for the read to be considered telomeric. TelSeq calculation was done individually for each read group within a sample, and the total number of reads in each read group was used as weight to calculate the average TL for each sample. To validate the estimation of telomere length by TelSeq, telomere content was quantified using TelomereHunter37 using ten telomere variant repeats including TCAGGG, TGAGGG, TTGGGG, TTCGGG, TTTGGG, ATAGGG, CATGGG, CTAGGG, GTAGGG and TAAGGG.
To compare telomere length in Sherlock-Lung with previous studies, we collected the telomere length estimation from the same algorithms across the TCGA cohort and applied the same linear mix model to predict the mean telomere length as described by Barthel et al.36.
Mutational Signature Analysis
Mutational signature analysis was analyzed by the updated computational framework SigProfiler26,108. SigProfilerExtractor with default parameters was used to perform both de-novo extraction and decomposition to known global Cosmic mutation signatures (v3). Mutation probabilities for each mutation type in each sample were generated for grouping samples based on different genomic features. Hierarchical clustering of contribution of mutational signatures was performed using “euclidean” distance and Ward’s minimum variance clustering method.
To investigate the endogenous and exogenous mutational processes in our Sherlock-lung study, we collected four mutational signature sets according to the likely etiologies, including 65 Cosmic SBS mutational signatures, 22 Cosmic SBS endogenous signatures, 53 environmental mutagens signatures32 and 75 combined endogenous and exogenous mutational signatures (See Supplementary Table 7 for the included signatures). We then performed SBS mutational signature analyses as described above. To maximally deconvolute all mutations to these global signatures in SigProfilerExtractor, we decreased the cosine similarity threshold for de novo mutational signatures until no new mutational signature was found. Among these 4 mutational signature sets, we compared the cosine similarity between the reconstructed mutational profiles to the original mutational profiles for each sample.
Analysis of Passive Smoking
To investigate tumor mutational patterns between passive smokers and non-passive smokers, we first excluded 4 hypermutated tumors (2 from passive smokers, 1 from a non-passive smoker, and 1 with unknown passive smoking exposure) driven by APOBEC mutagenesis (TMB>8 Mut/Mb). We then compared each mutation type among SBS, DBS and ID between passive and non-passive smokers using the Mann-Whitney U test followed by multiple testing correction using the Benjamini & Hochberg method. To quantify and visualize differences in the overall mutational patterns between passive and non-passive smokers, we combined all mutations in each tumor group into a single profile and estimated their cosine similarity and residual sum of squares (RSS). As a sensitivity analysis, we replicated these analyses within samples from two studies (EAGLE and Yale) with high quality passive smoking exposure data. The EAGLE study had details on exposure during childhood, during adulthood at home, and during adulthood at work. Thus, we created a score from the highest exposure (“1”: during all three periods) to the lowest (“4”: only one exposure setting during adulthood). We then extracted the mutational patterns across the groups and estimated the cosine similarity of the two extremes (1 and 4).
Homologous Recombination Deficiency by HRDetect
We applied HRDetect to assess the homologous recombination deficiency (HRD) as described in previous studies25,38,39. Mutations including SNVs and Indels, Battenberg segmentation profile, SVs, and tumor purity and ploidy were included for HRDetect. HRDetect scores were computed by aggregating six features associated with HRD including SNV signature 3, SNV signature 8, SV signature 3, SV signature 5, HRD index from copy number profile, and the fraction of deletions with microhomology. All the features were normalized and log transformed. A logistic model was used to predict the HRDetect scores using previously trained data38.
Assessment of Loss of Heterozygosity
Loss of heterozygosity in human leukocyte antigen (LOH HLA) was identified by the LOHHLA algorithm20. Patient-specific HLA genotypes were inferred by POLYSOLVER109 based on the normal samples. Then, tumor and normal BAM files, HLA calls, HLA fasta file, and tumor purity and ploidy were used as input to LOHHLA. A copy number < 0.5 is classified as subject to loss, and thereby indicative of LOH. Allelic imbalance is determined if P <0.01 using the paired t-test between the two distributions.
LOH analysis for HRD genes was based on the overlapping gene location with copy number profile by Battenberg. LOH segmentation was called if the clonal minor copy number was 0. The HRD gene list was based on a previous publication25.
Prediction of Chronological Timing
We adopted the approach from PCAWG42 to estimate the elapsed time between the appearance of the MRCA and the last observable subclone in our Sherlock-lung study. Briefly, the number of clock-like CpG>TpG mutations in an NpCpG context was counted for all tumors, accounting for tumor ploidy as well as clonal and subclonal mutations. Tumors with no age information, insufficient number of clonal and subclonal clock-like mutations (<50 mutations/sample) to estimate mutation rate, abnormal mutation rate, or high fraction of APOBEC-associated mutations (SBS2 and SBS13 fraction >70%) were excluded from the analysis as previously advocated 8,42, leaving 153 samples for this analysis. The latency of the MRCA was estimated for each tumor, adopting an estimated tumor acceleration rate of 1×. We subtracted the estimated latency from the age at diagnosis to obtain the real-time age at which MRCA likely emerged, grouping tumors by the presence of specific genomic alterations or features with >3% frequency (such as SCNA subtypes; groups with RTK-RAS alterations, TP53 deficiency, ALK fusions, and ARID1A mutations, etc.). Significant differences between subgroups were assessed using Wilcoxon rank-sum test.
Timing Model of Ordering Events
Mutational drivers and CNAs were simultaneously incorporated into the timing model based on the clonality of the events. For CNAs, Battenberg copy number calls were used to assign clonality of CNAs (whether cancer cell fraction (CCF)=1 or <1), describe the type of CNA (i.e. gain, LOH and HD) and whether WGD has occurred in the overall copy number profile. To include only recurrent regions, first, CNA events of each type were piled up across all samples along the chromosomes to get the frequency landscape of each CNA type based on all observed breakpoints. Next, a permutation test (N=1,000) followed by FDR-based multiple testing correction was undertaken to identify regions that were significantly enriched above the random background copy change rate. The enriched regions that encompassed the HLA region (6p21), or specific to telomeric ends or present as a singleton were excluded. For each mutational driver (with ≥ 5% recurrence), CCF of each variant was estimated by adjusting VAF according to the CNA status of the locus and purity of the tumor sample as previously described110. Variants were then classified as clonal (CCF=1) and subclonal (CCF <1) using DPClust. All events were combined per sample and ordered based on CCF. Where more than one tree could be inferred based on subclonal events, all possible trees were generated and randomly chosen in each iteration of ordering events. To time the events based on the entire dataset, events were ordered based on clonality (randomized clonal events followed by a sampled tree of subclonal events) in each sample. To classify events with respect to WGD, we used the estimated number of chromosomes bearing the mutation (NCBM) and major/minor copy number status to call pre-WGD and post-WGD mutations and CNA respectively. The Plackett-Luce model111,112 for ordering partial rankings was implemented (https://github.com/hturner/PlackettLuce) to infer the order of events based on the ordering matrix of the entire dataset while allowing for unobserved events. This analysis was undertaken for 1,000 iterations to obtain the 95% confidence interval of the timing estimate of each event. We repeated this analysis across the three subtypes of tumors based on SCNA clusters (forte, mezzo-forte, and piano).
Statistical and Survival Analysis
All statistical analyses were performed using the R software (https://www.r-project.org/). To investigate the functional relevance of potential driver mutations of each pair of genes, we performed mutual exclusivity analysis and co-occurrence analysis using two-sided Fisher’s exact test. P values less than 0.05 were considered as statistically significant. If multiple testing was required, we applied the false discovery rate (FDR) correction based on the Benjamini & Hochberg method. For survival analyses, a proportional hazards model was used to investigate the associations between genomic features and overall survival, adjusting for age at diagnosis, gender, and stage. The multiple testing correction for survival analysis was performed based on 33 different genomic alteration events with at least 5% frequency including mutations, focal SCNA, arm-level SCNA, and gene fusions. Genomic alterations were identified as significant if Q<0.1. A risk score was calculated as the mutational burden of these significant independent genomic alterations and we then performed association between risk score and overall survival using the same method.
Data Availability
232 normal and tumor paired raw data (BAM files) of the whole genome sequencing datasets have been deposited in dbGaP with accession number: phs001697.v1.p1. Researchers will need to obtain dbGaP authorization to download these data. RNA-seq raw data (FASTQ files) have been submitted to NCBI GEO database with access number GSE171415. Germline variant dataset from EAGLE whole exome sequencing study can be access in dbGaP with access number phs002496.v1.p1. In addition, histological images of these tumors can be found at https://episphere.github.io/svs. Public datasets were used in this study including: gnomAD (v2.1.1)/ExAC (v0.3.1) (https://gnomad.broadinstitute.org/), 1000 genomes (phase 3 v5, https://www.internationalgenome.org/) and dbSNP (v138, https://www.ncbi.nlm.nih.gov/snp/).
Code Availability
The code for whole genome sequencing subclonal copy number caller can be found at https://github.com/Wedge-lab/battenberg (v2.2.8). The code for somatic mutation filtering can be found at https://github.com/xtmgah/Sherlock-Lung. The code for Dirichlet Process based methods for subclonal reconstruction of tumors can be found at https://github.com/Wedge-lab/dpclust (v2.2.8). The code for mutational signature analysis can be found at https://pypi.org/project/sigproextractor/ (SigProfilerExtractor, v0.0.5.77). The code for inferring the order of genomic events can be found at https://github.com/hturner/PlackettLuce (v0.2–2). The code for chronological timing analysis can be found at https://gerstung-lab.github.io/PCAWG-11/. The code for P-MACD (Pattern of Mutagenesis by APOBEC Cytidine Deaminases) can be found at https://github.com/NIEHS/P-MACD.
Extended Data
Extended Data Fig. 1. Genomic alterations of RTK-RAS pathway in Sherlock-Lung.
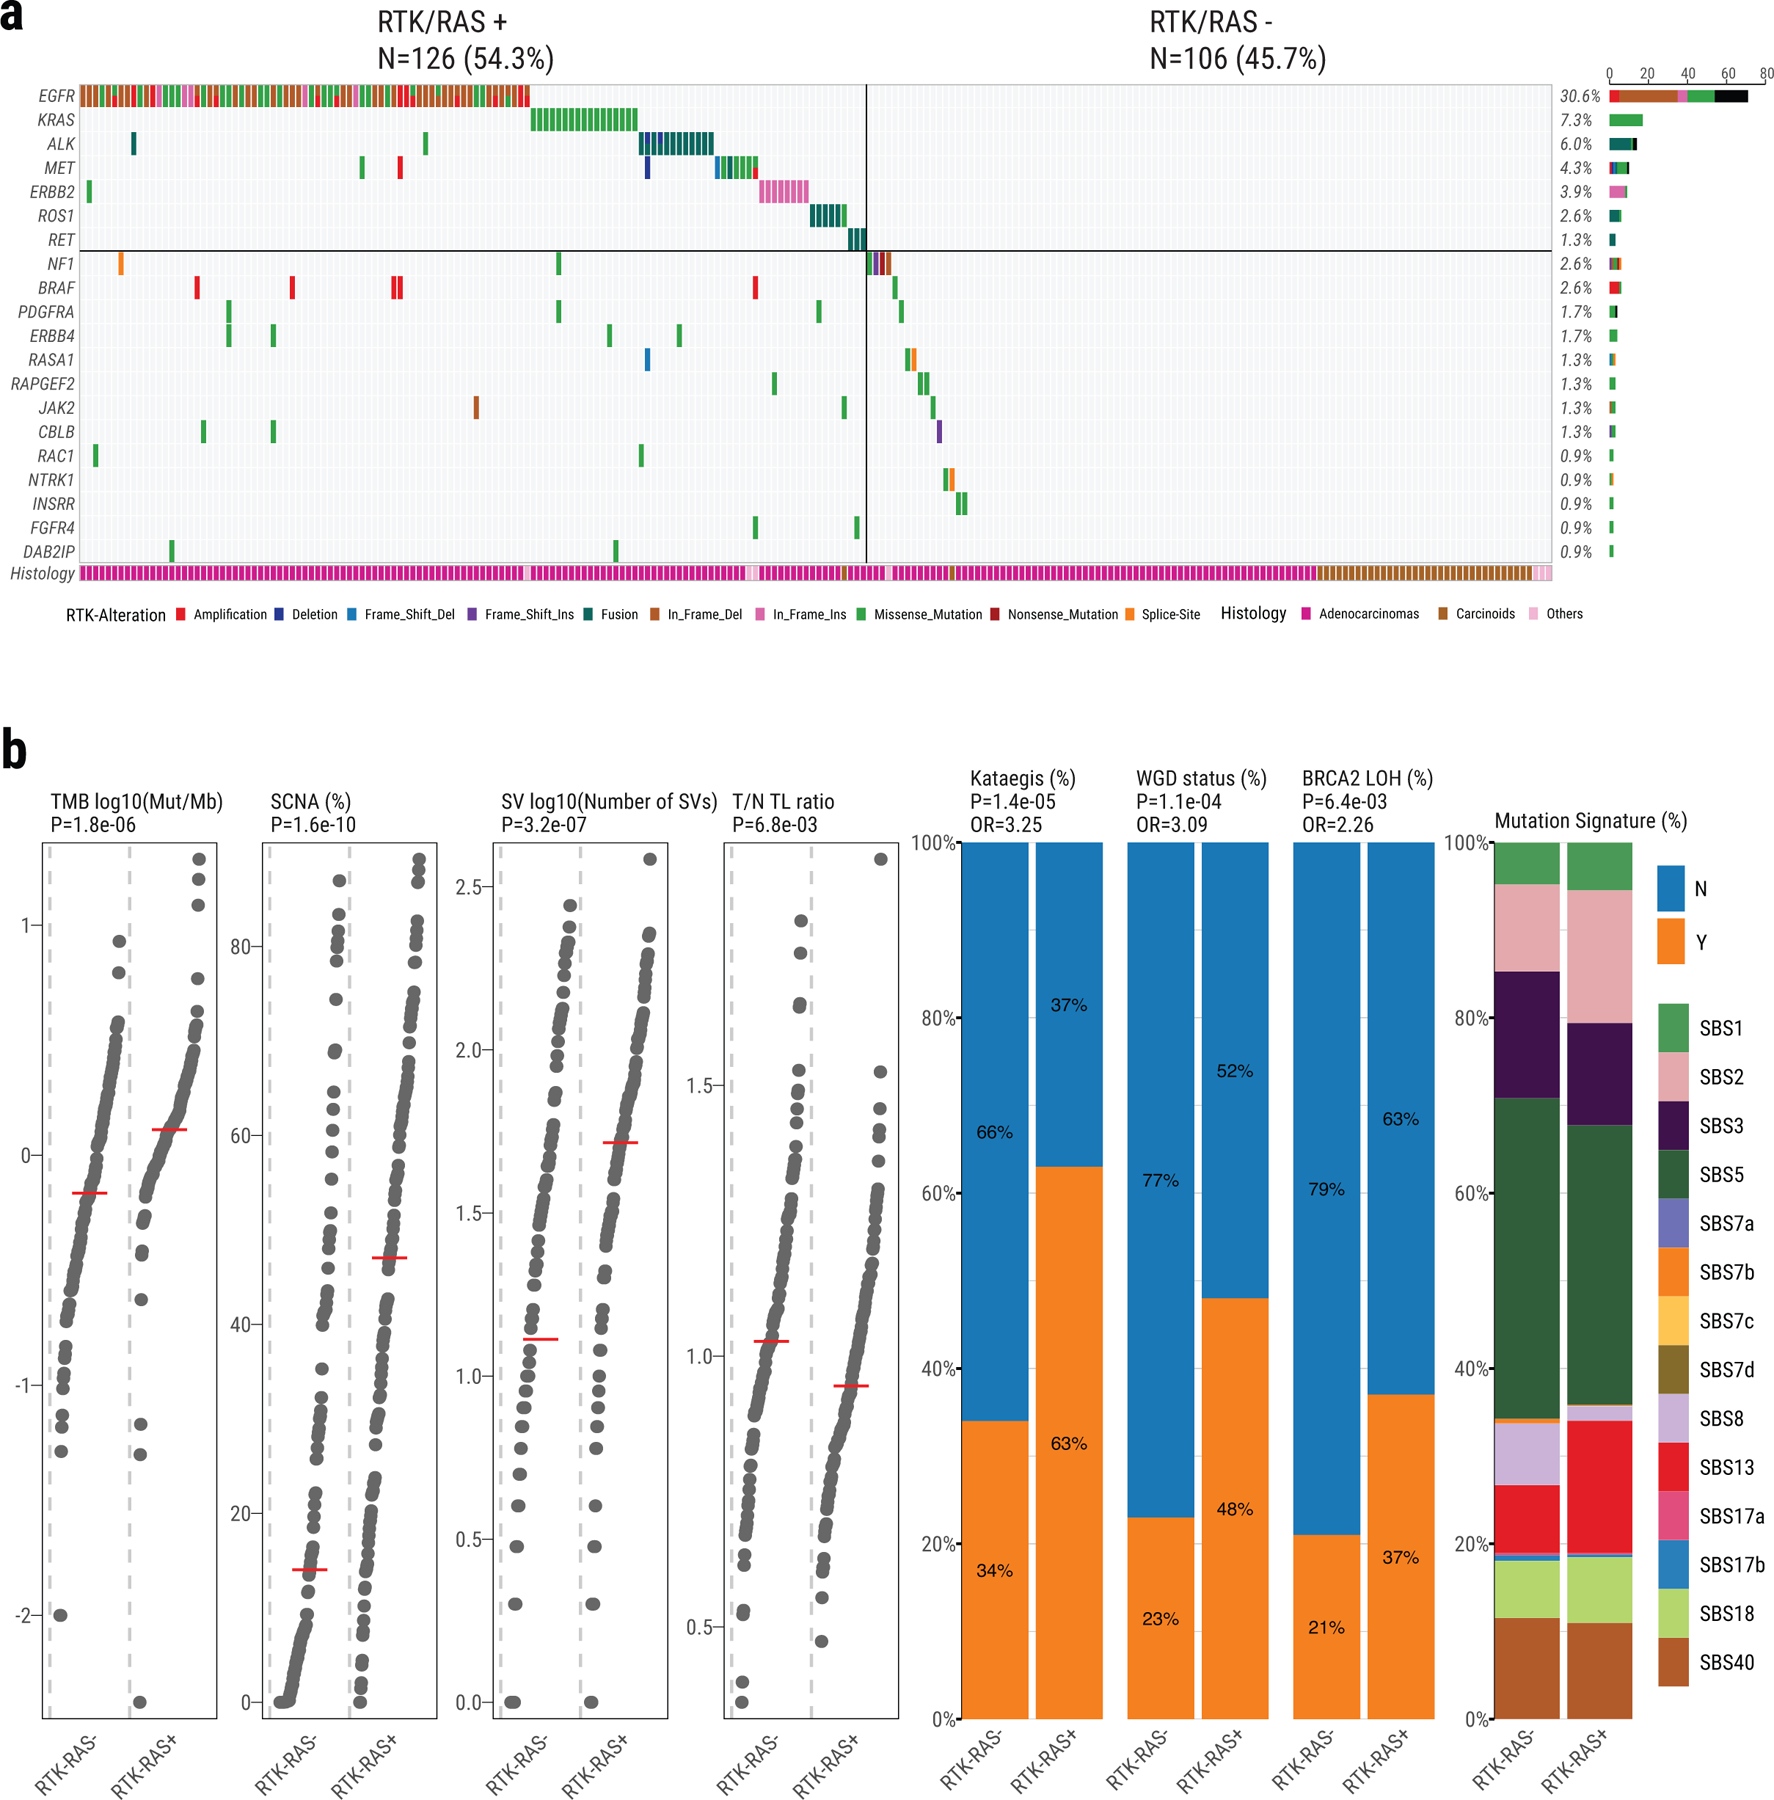
a, Oncoplot showing mutual exclusivity of genes within the RTK-RAS pathway, which were used to define the RTK-RAS status. The bottom bar shows tumor histological types. b, Comparison of genomic features between RTK-RAS negative and positive tumors. Left four panels: tumor mutational burden, percentage of genome with SCNAs, SV burden and T/N TL ratio. P-values are calculated using the two-sided Mann-Whitney U test; Middle three panels: enrichments for Kataegis events, WGD events, and BRCA2 LOH. P-values and OR are calculated using Fisher’s exact test (two-sided); Right panel: Contributions of each SBS signature.
Extended Data Fig. 2. Genomic alterations of TP53 pathway in Sherlock-Lung.
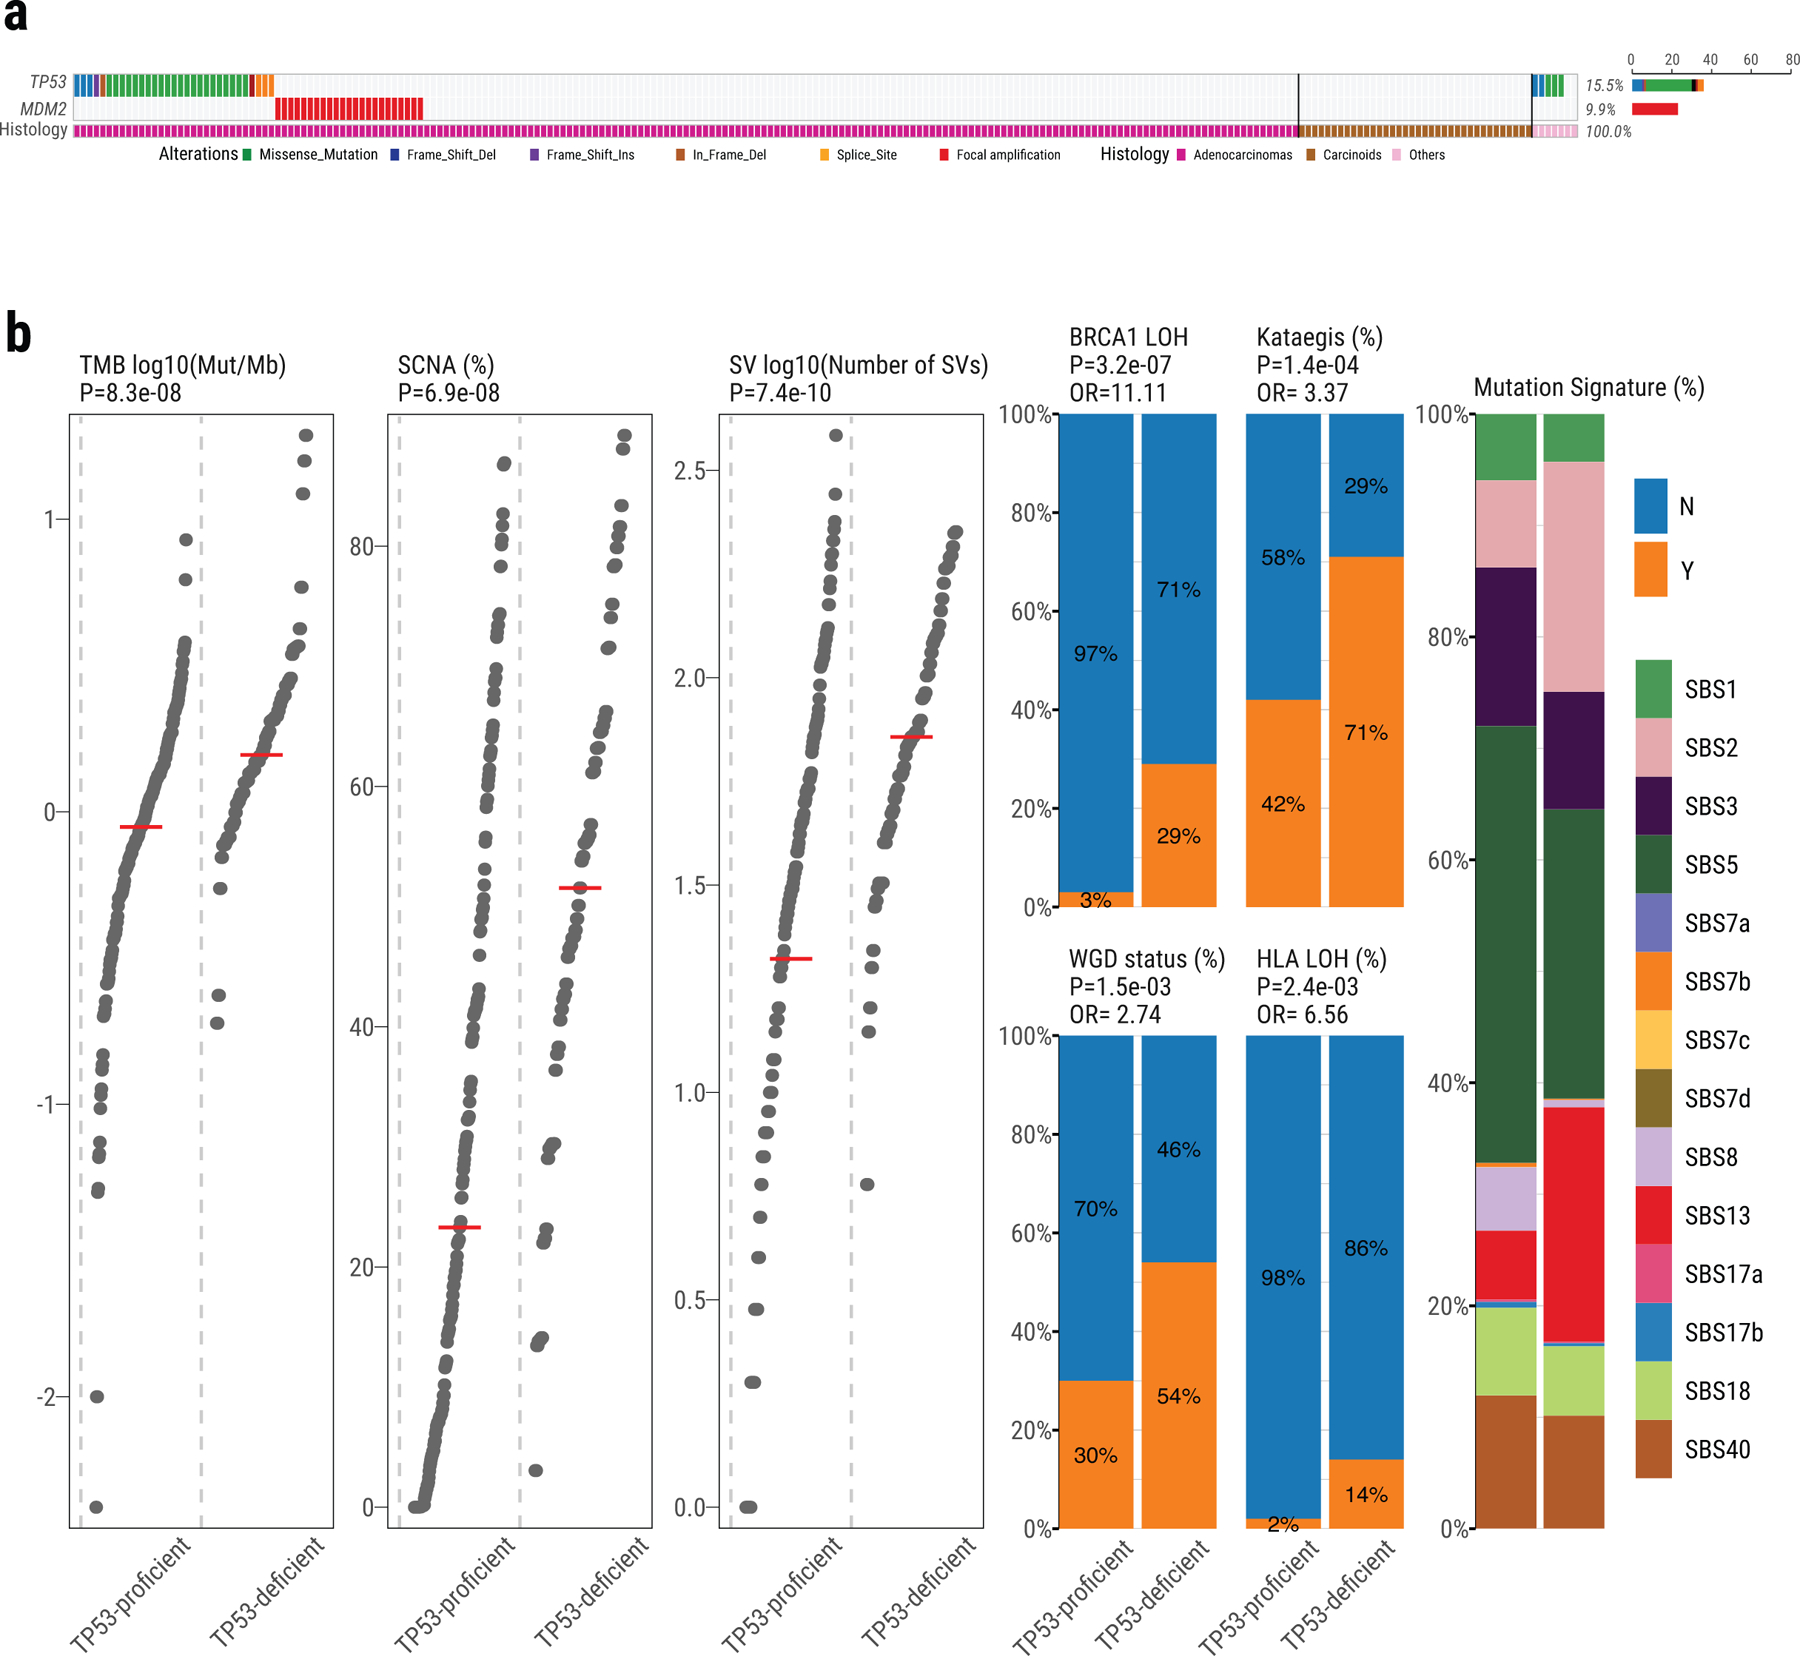
a, Oncoplot showing the mutual exclusivity between TP53 mutations and MDM2 amplification, which was used to define the TP53 proficient and deficient groups. The bottom bar shows tumor histological types. b, Comparison of genomic features between TP53-proficient and TP53-deficient tumors. Left three panels: tumor mutation burden, percentage of genome with SCNA and SV burden. P-values are calculated using the two-sided Mann-Whitney U test. Middle four panels: enrichments for BRCA1 LOH, Kataegis events, WGD events, and HLA LOH. P-values and OR are calculated using Fisher’s exact test (two-sided). Right panel: Contributions of each SBS signature.
Extended Data Fig. 3. Recurrence of SV breakpoints in Sherlock-Lung.
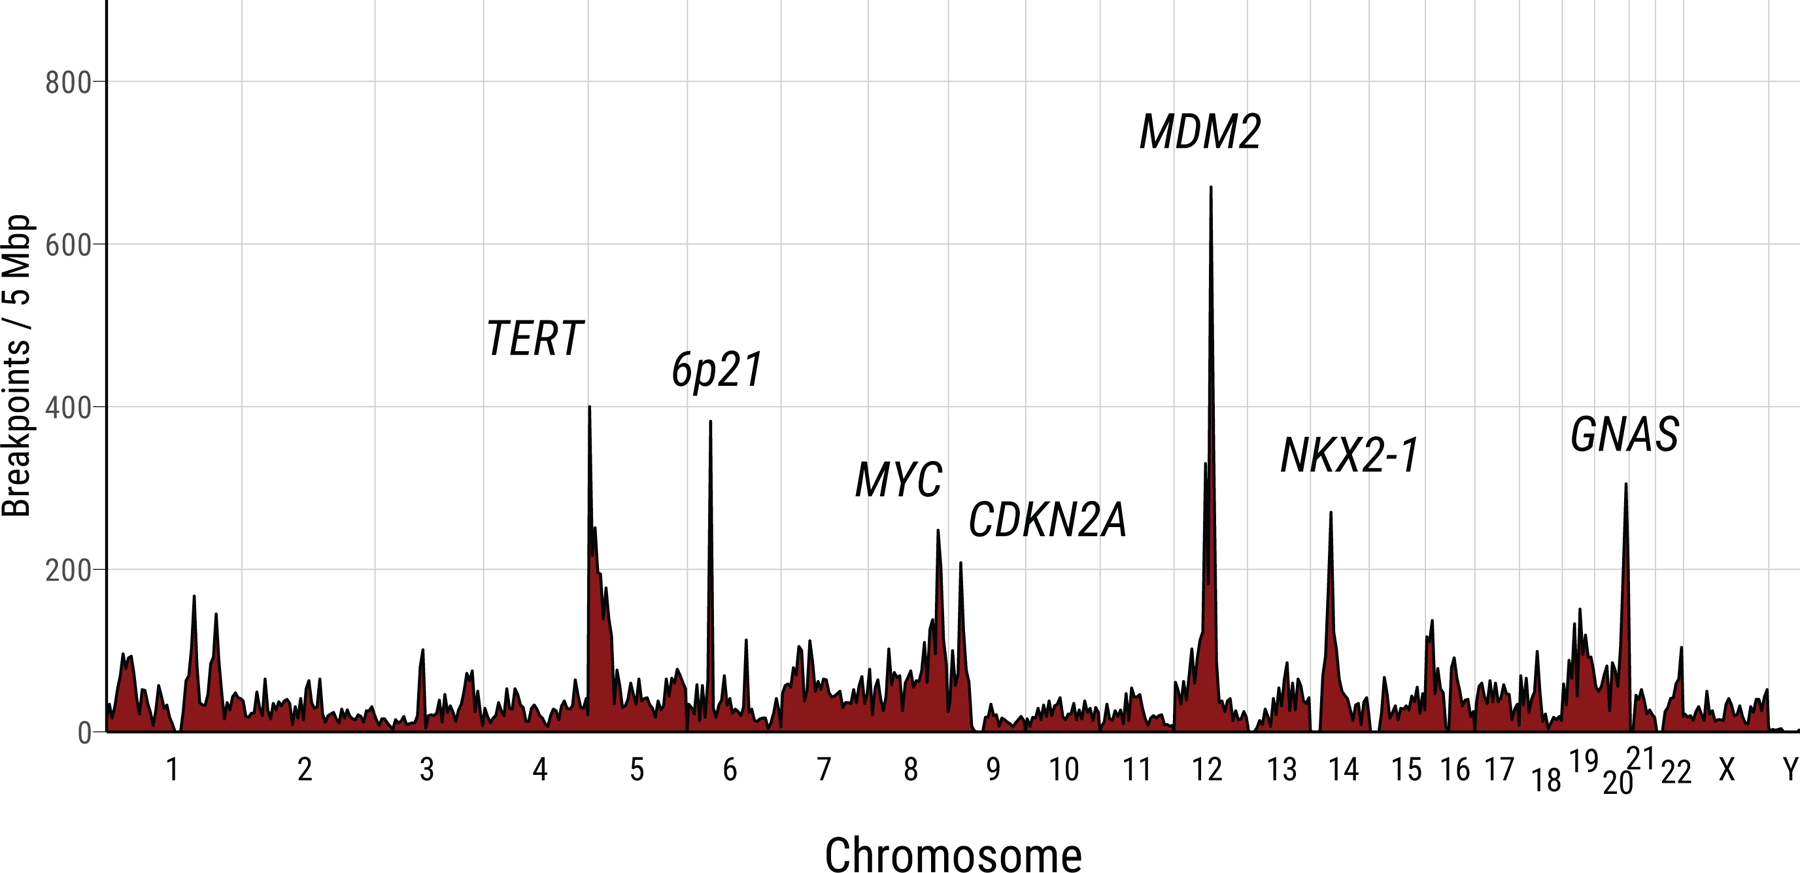
The frequencies of chromosomal breakpoints are calculated using 5 Mb as a window across the whole genome.
Extended Data Fig. 4. Summary of genomic features in LCINS based on different SCNA clusters.
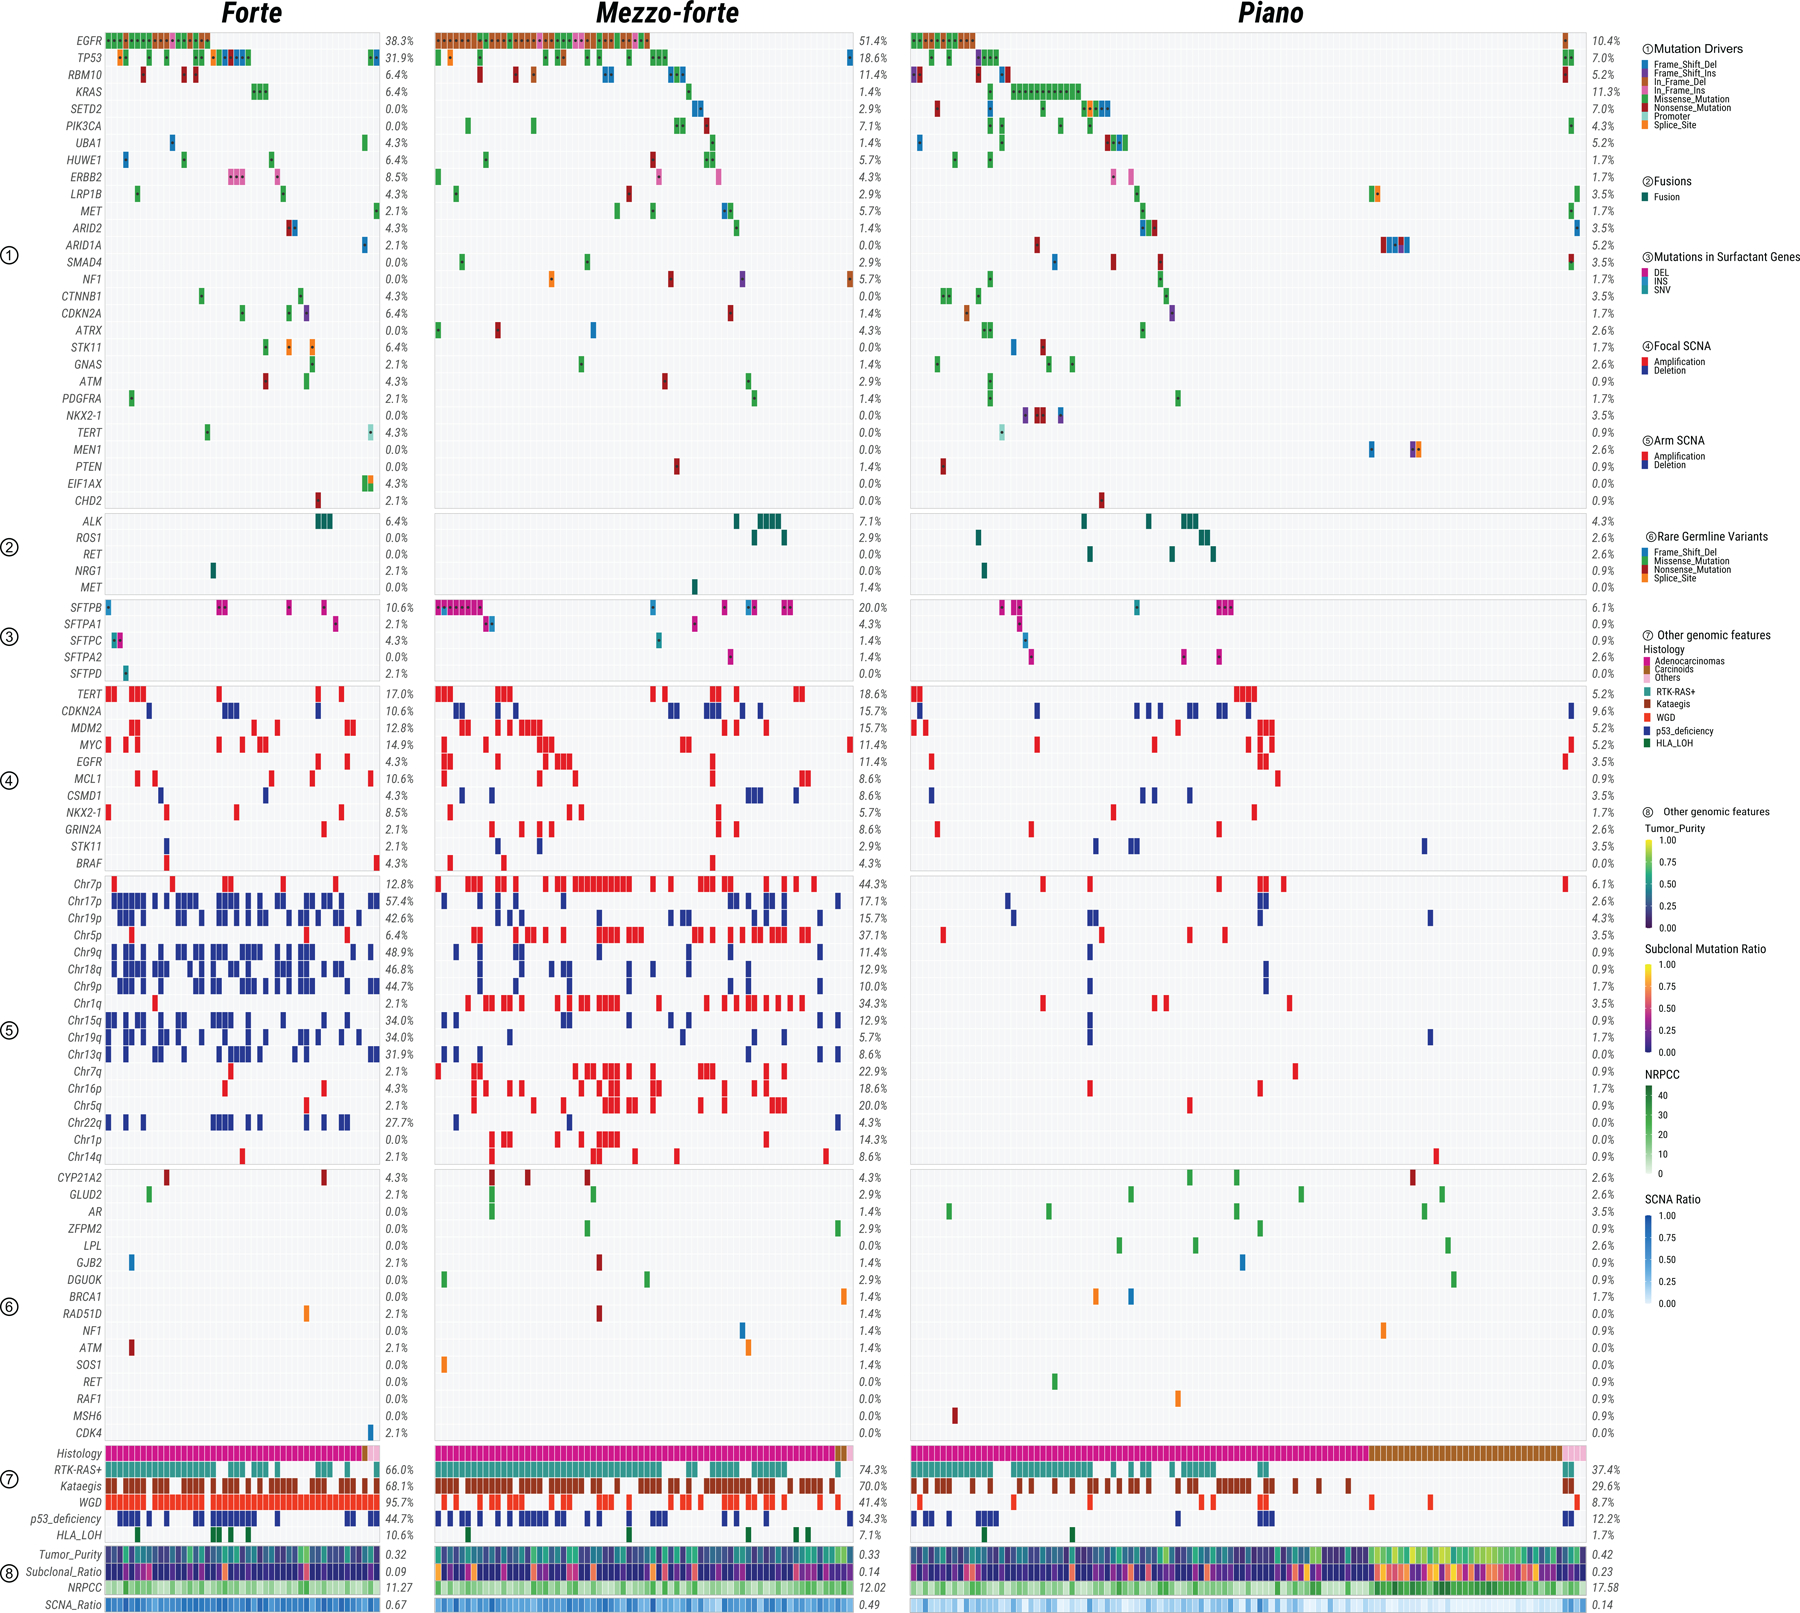
Panels from top to bottom describe: 1) most frequently mutated or potential driver genes; 2) oncogenic fusions; 3) somatic mutations in surfactant associated genes; 4) significant focal SCNAs; 5) significant arm-level SCNAs; 6) genes with rare germline mutations; 7) and 8) other genomic features. The numbers on the right panel show the overall frequency (1–7) or median values (8). NRPCC: the number of reads per clonal copy.
Extended Data Fig. 5. Genes with signals of positive selection in Sherlock-Lung.
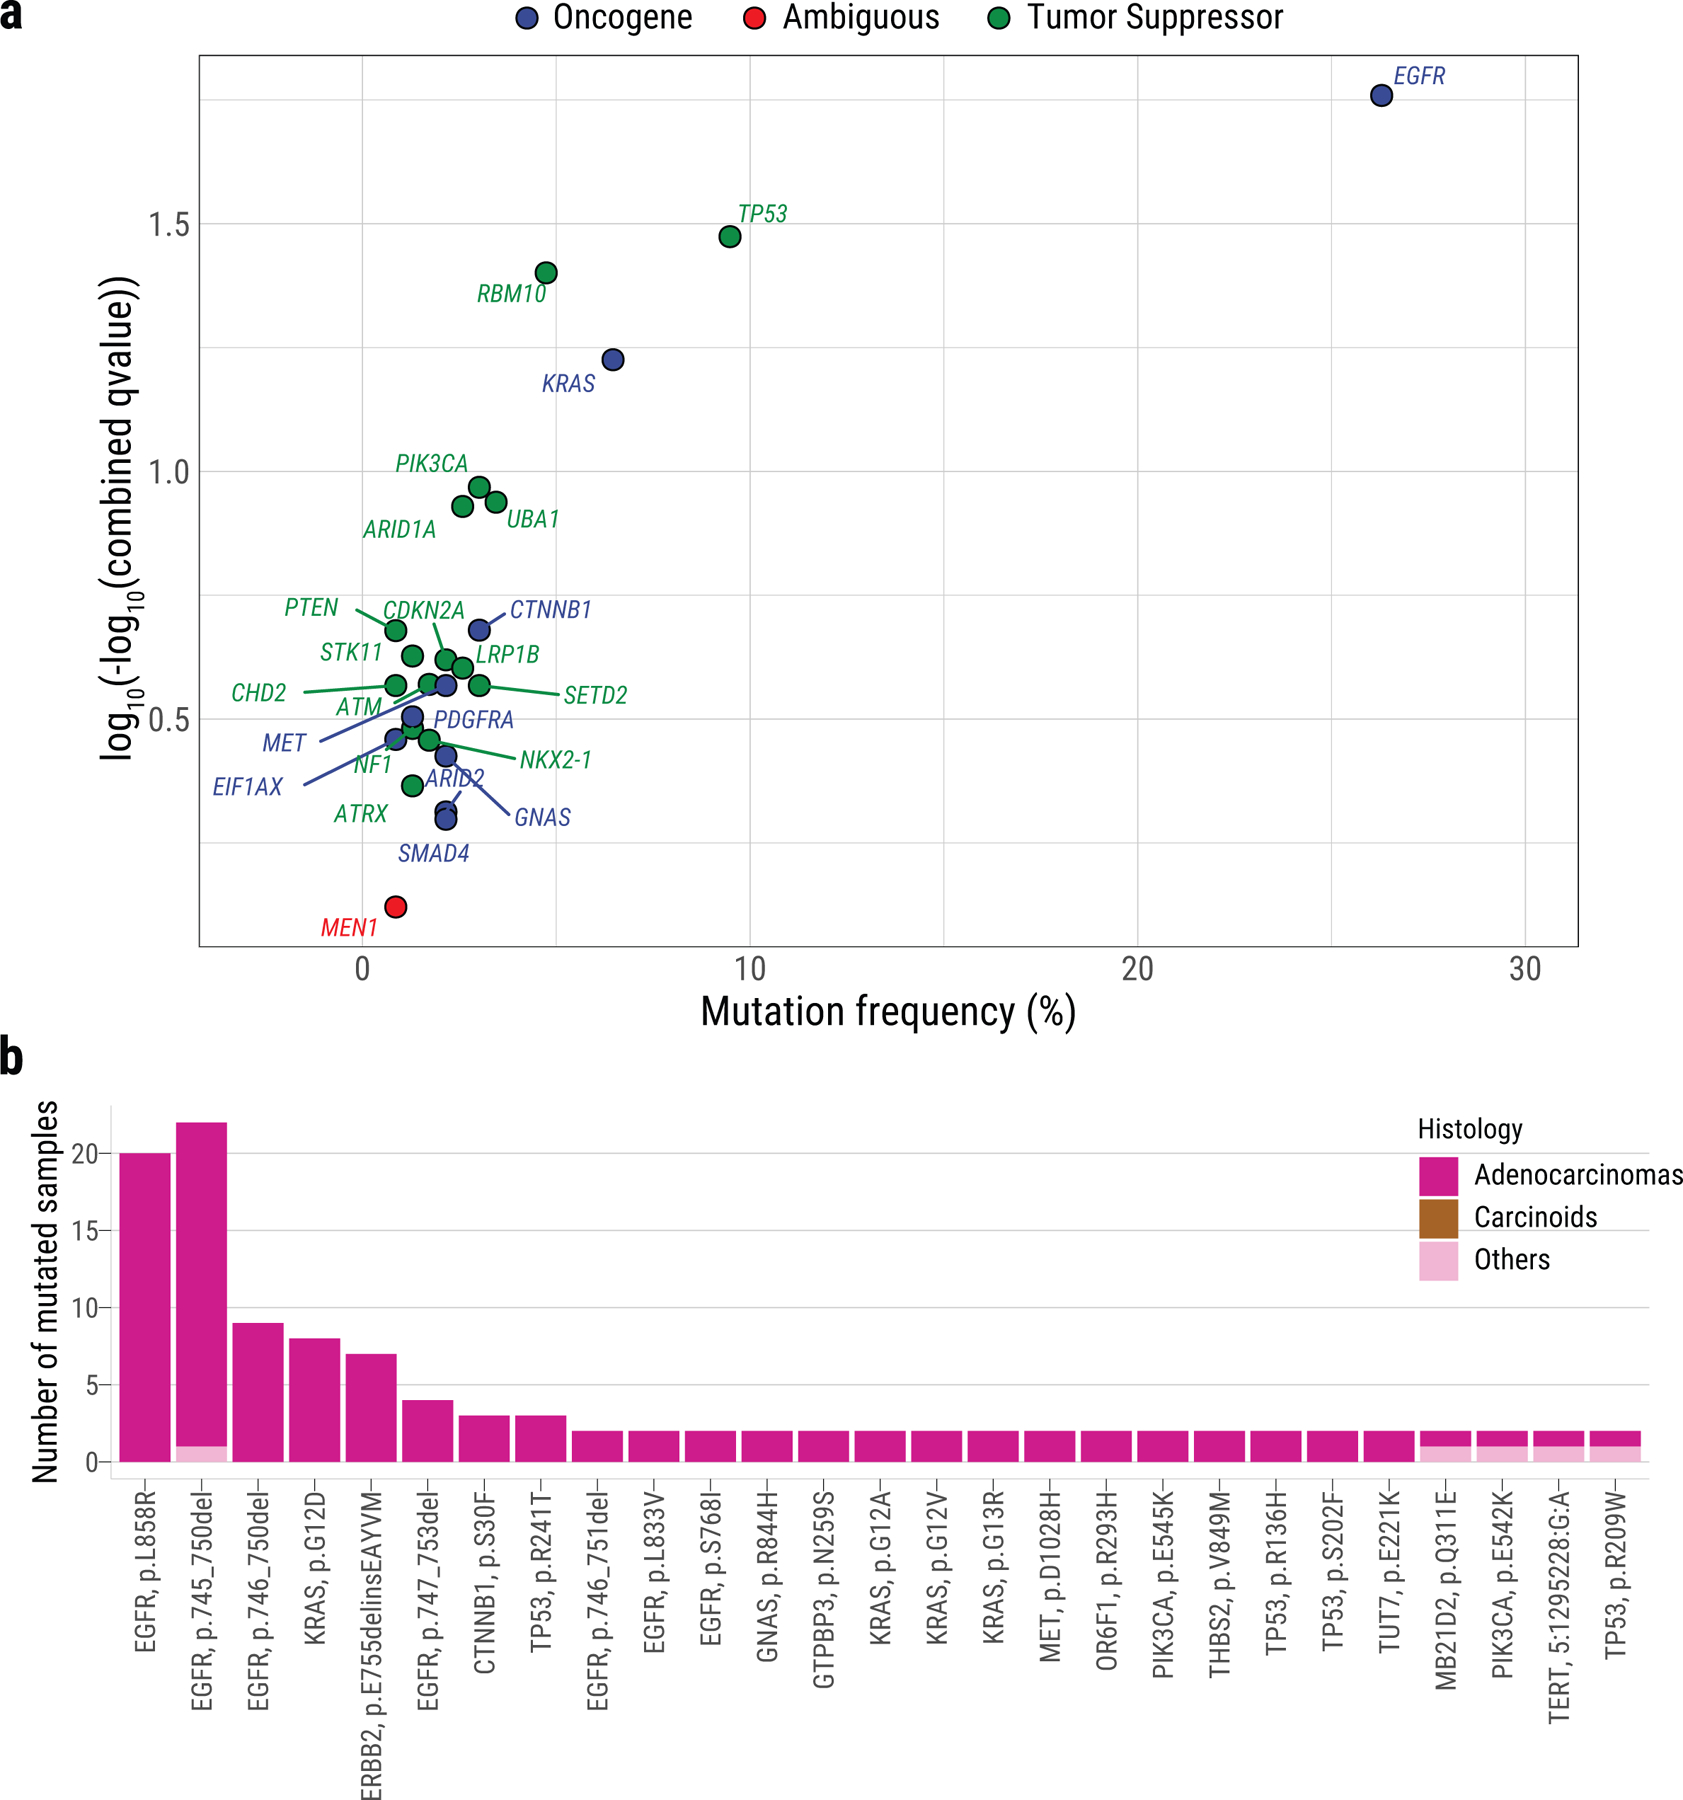
a, The scatter plot showing significantly mutated genes according to IntOGen q-value <0.05 (y-axis) and mutational frequency in the cohort (x-axis). Genes are colored according to their inferred mode of action in tumorigenesis. b, Recurrent non-synonymous driver mutations (in ≥2 patients).
Extended Data Fig. 6. Dominant endogenous processes in Sherlock-Lung.
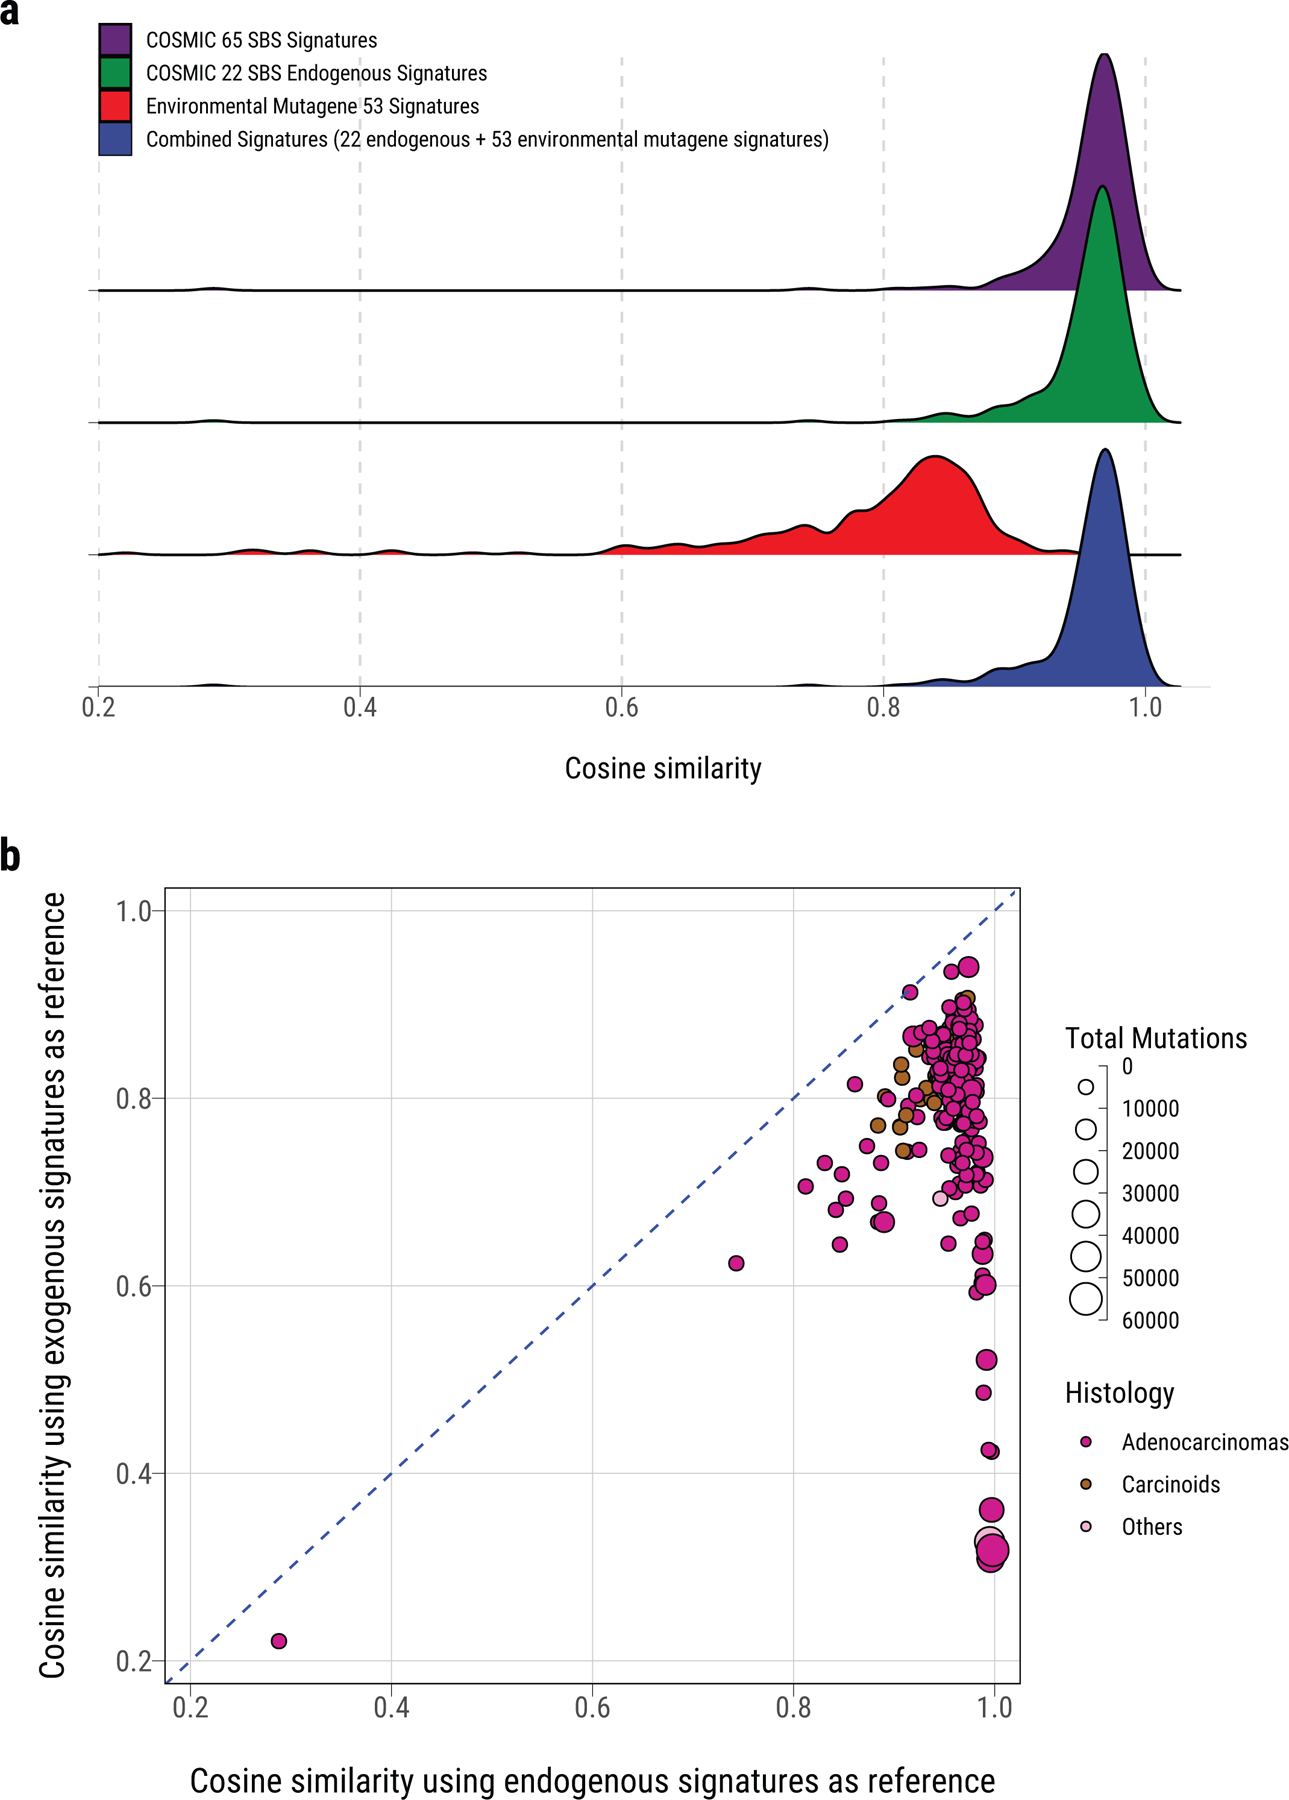
a, Density plot of cosine similarity between original mutational profile and reconstructed mutational profile using reference signatures from (top to bottom): 65 COSMIC SBS signatures, 22 COSMIC SBS signatures for endogenous processes, 53 MutaGene SBS signatures of environmental exposures, and a combined set of signatures including the 22 endogenous and 53 environmental exposure signatures. b, Comparison of the cosine similarity between the original mutational profiles and reconstructed mutational profiles using endogenous and exogenous signatures (similar to a). Each dot represents one sample. The size and color represent the total number of mutations and tumor histological type, respectively.
Extended Data Fig. 7. Association between T/N TL ratio and somatic alterations in Sherlock-Lung.
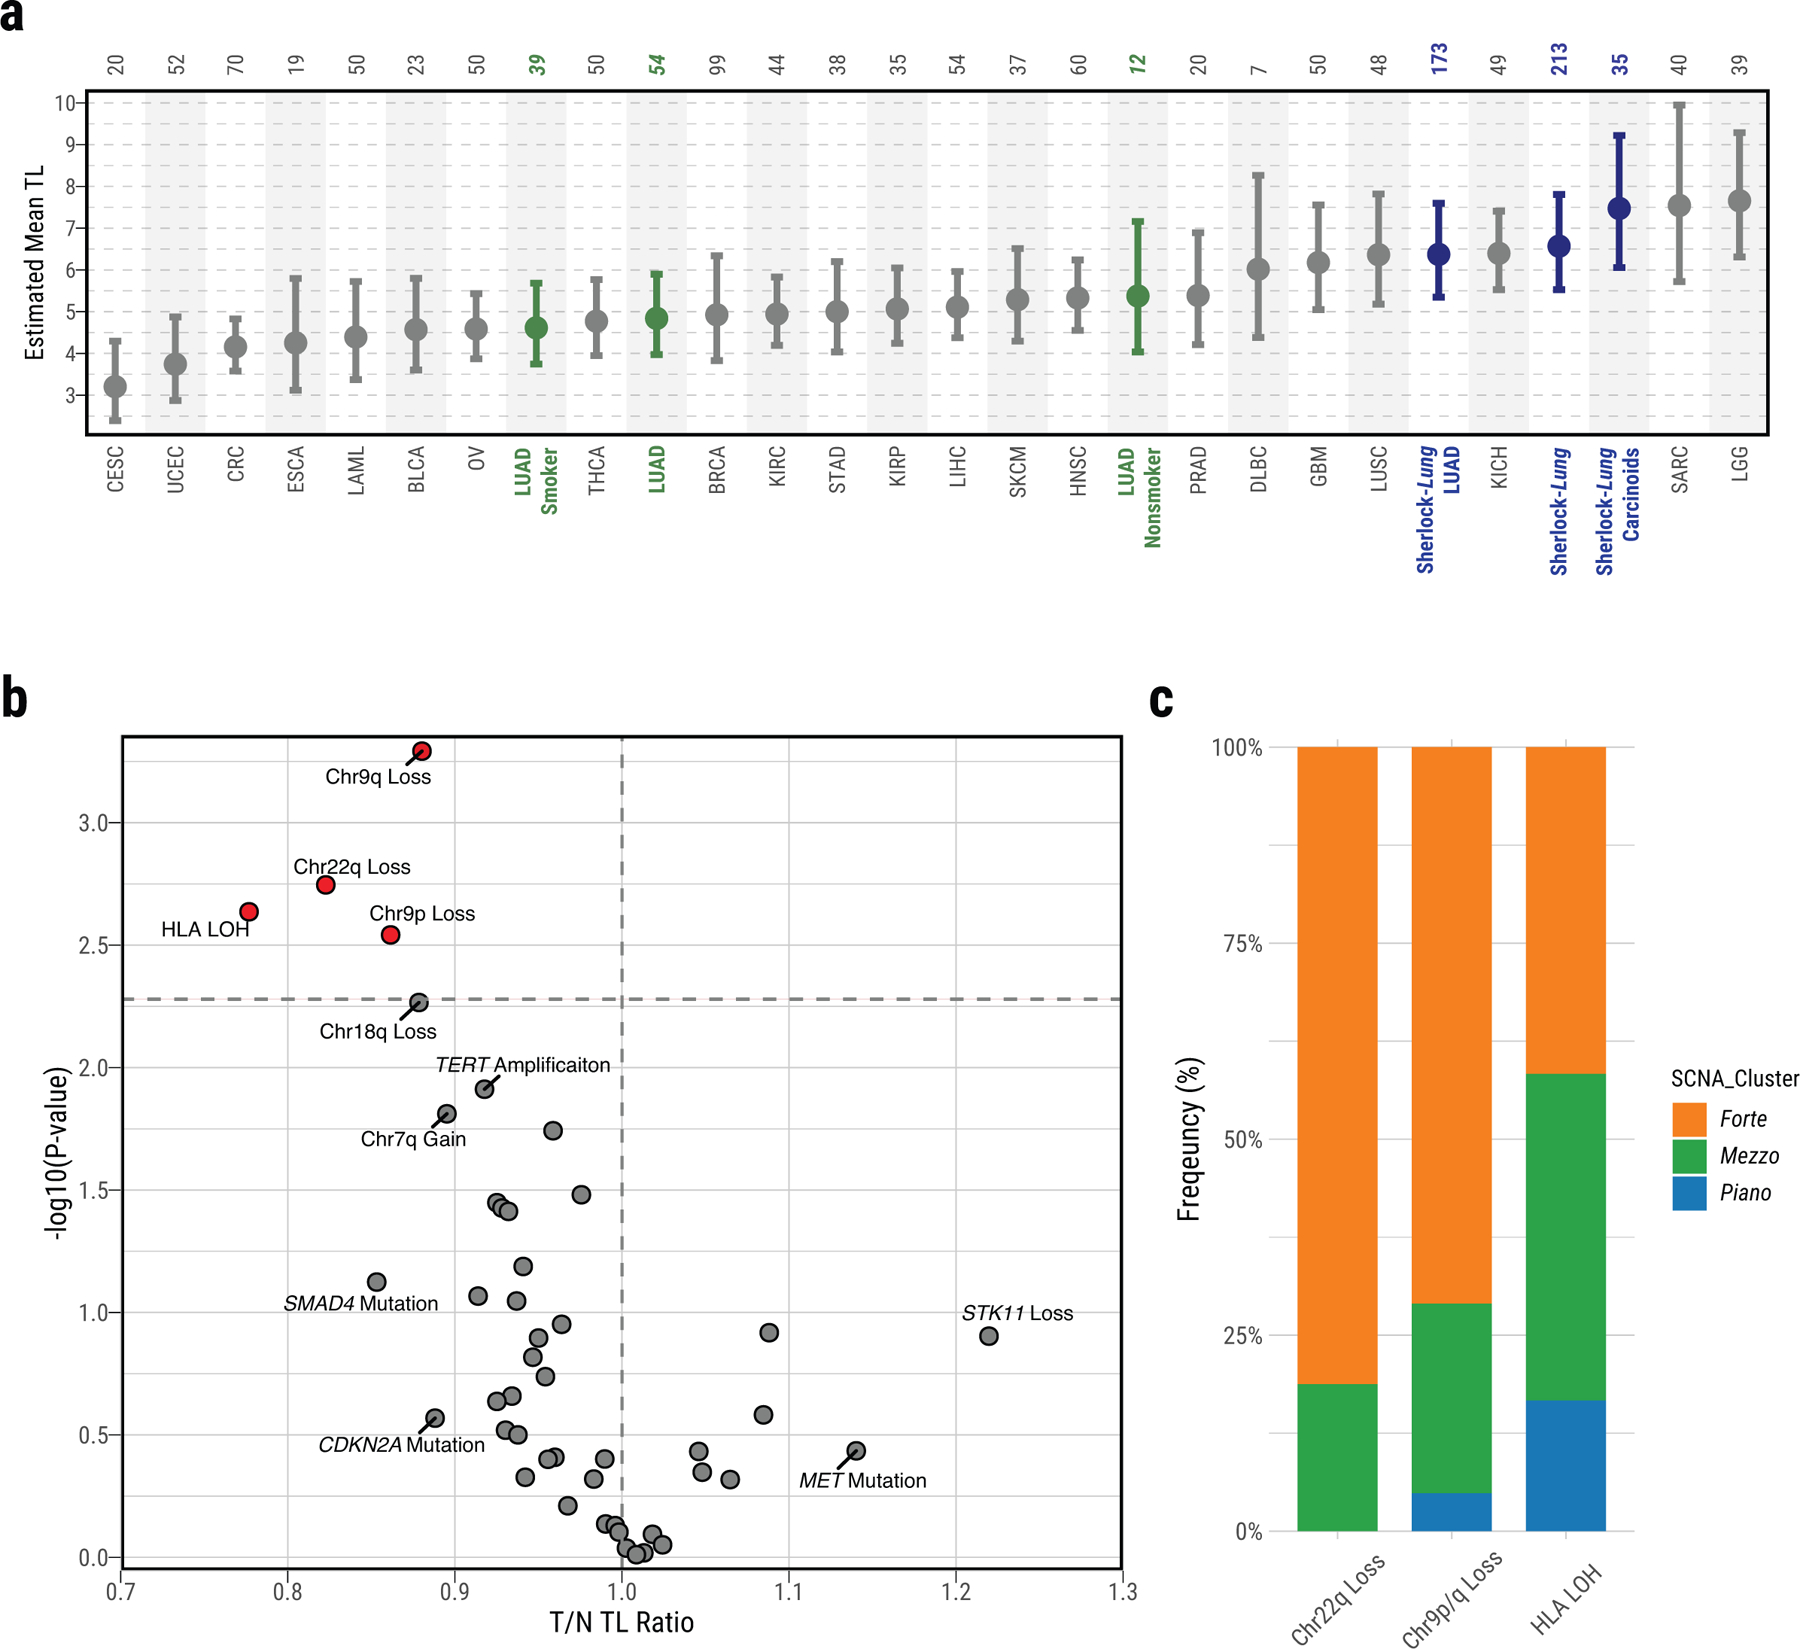
a, Distribution of mean telomere lengths (TL) in Sherlock-Lung (dark blue, overall and by histological type), TCGA LUAD (green, overall and by smoking status) and TCGA other cancer types (Grey). Total sample numbers for each type are shown at the top. Error bars, 95% CIs from linear mixed model. b, Scatterplot showing association between T/N TL ratio and somatic alterations. Association P-values (two-sided t-test; FDR adjusted using Benjamini-Hochberg method) are shown on the y-axis. Genomic alterations with FDR <=0.1 or T/N TL ratio >1.1 or <0.9 are labeled and further highlighted in red when significant (FDR=0.05; horizontal dashed line). c, The proportion of each SCNA cluster among the group of tumors with somatic alterations significantly associated with shorten T/N TL including Chr22q Loss, Chr9p/q Loss or HLA LOH.
Extended Data Fig. 8. Homologous recombination deficiency (HRD) in Sherlock-Lung.
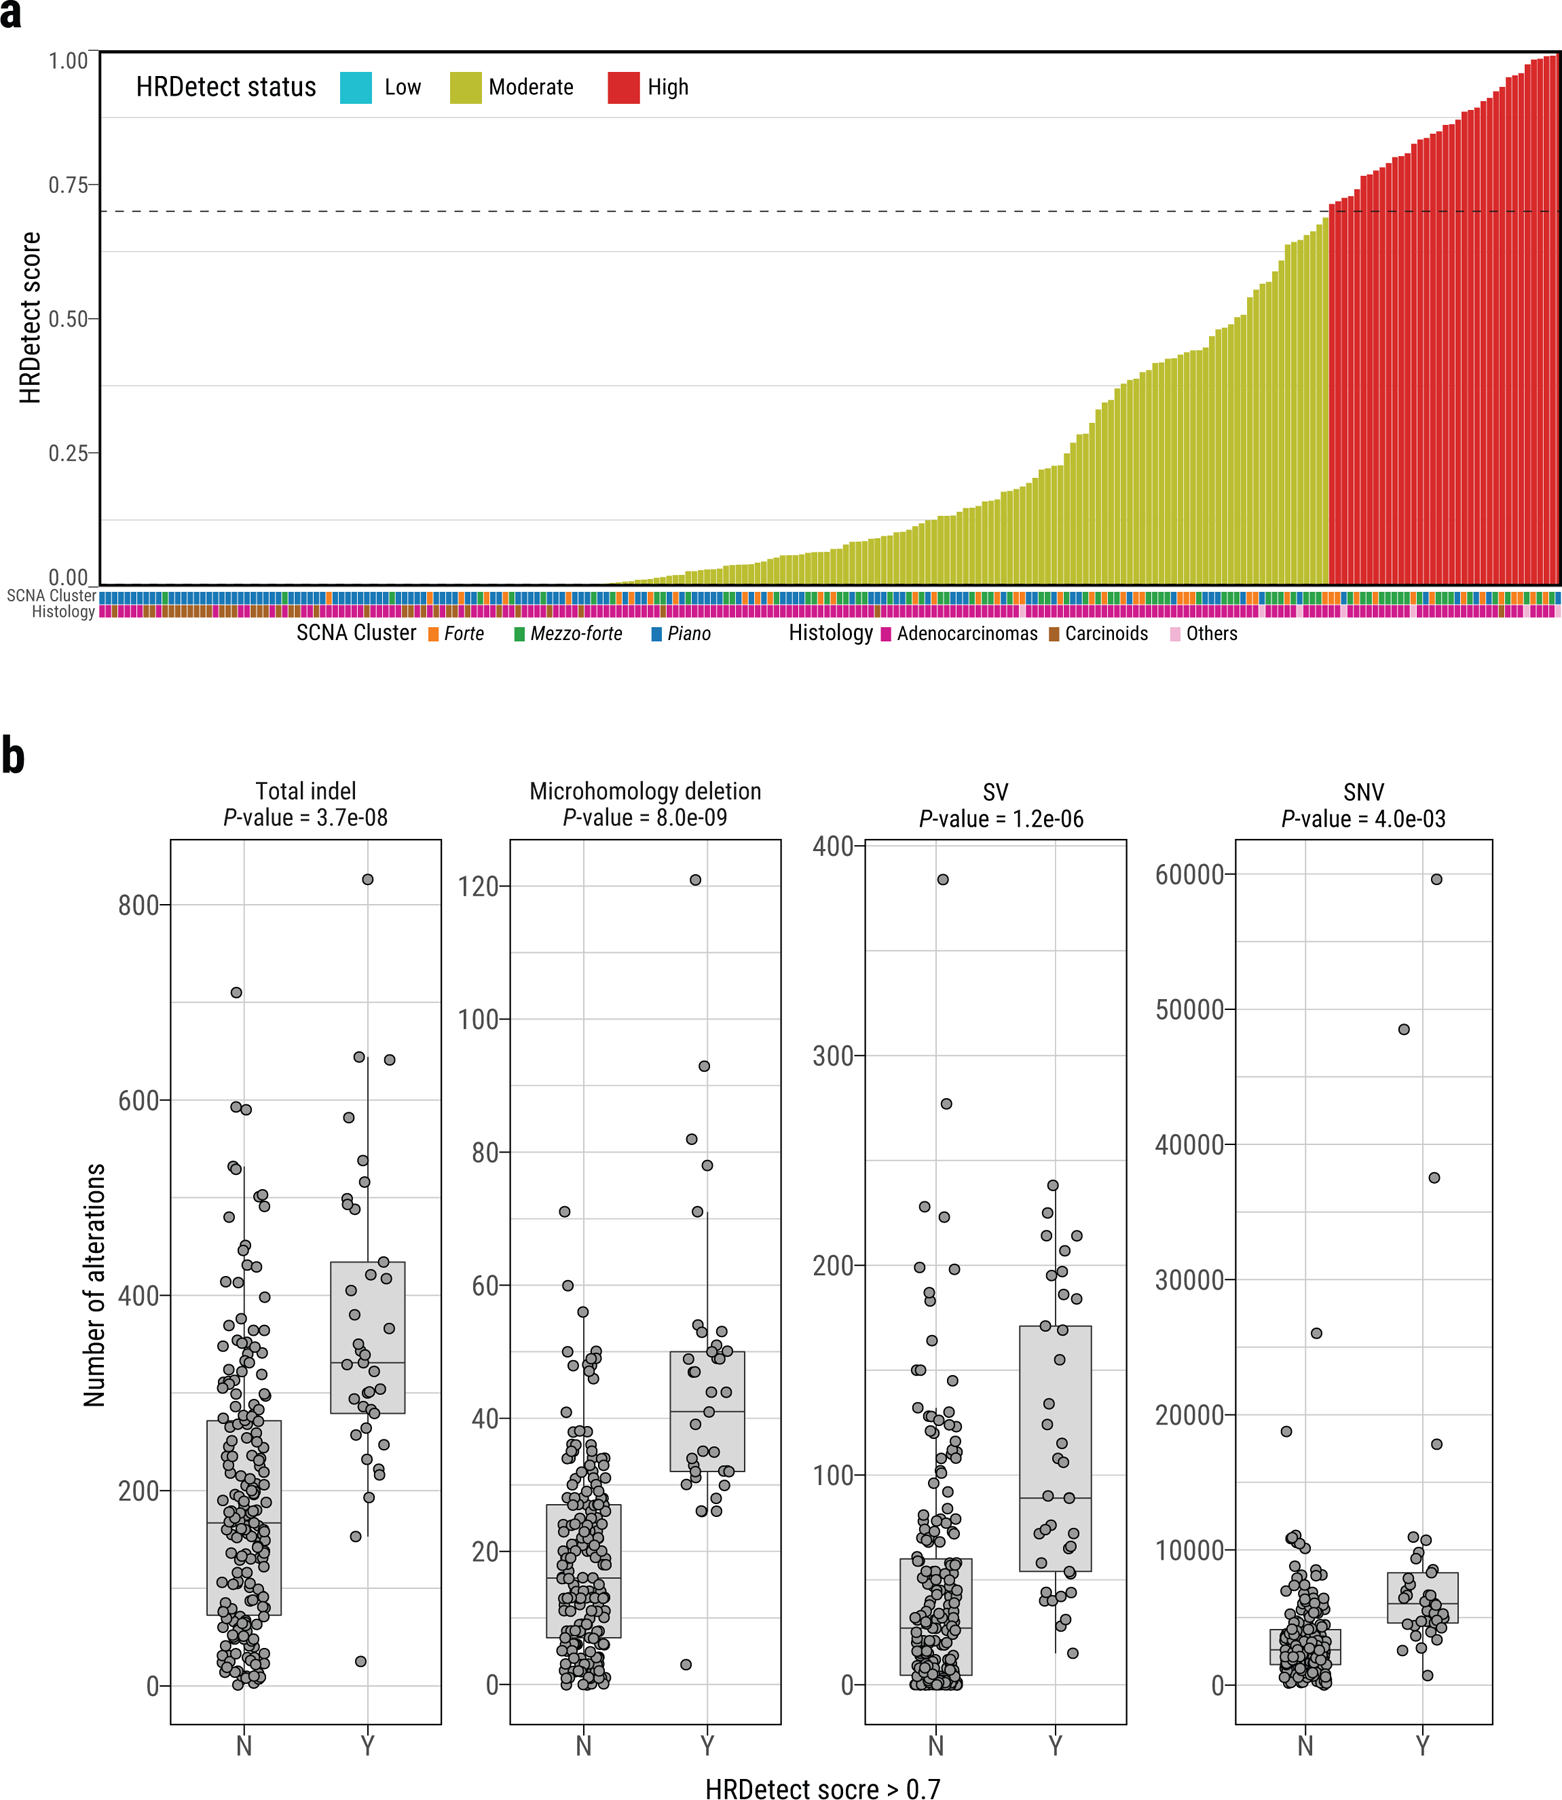
a, HRDetect scores of Sherlock-Lung samples. HRD-high: >0.7, HRD-low: < 0.005. b, Comparison of the number of total indels, microhomology deletions, SVs, and SNVs between samples with HRDetect score below 0.7 (group N) and above 0.7 (group Y). P-values are calculated using the two-sided Mann-Whitney U test. For box plots, center lines show the medians; box limits indicate the 25th and 75th percentiles; whiskers extend 1.5 times the interquartile range from the 25th and 75th percentiles.
Extended Data Fig. 9. Genomic alterations in HRD associated genes in Sherlock-Lung.
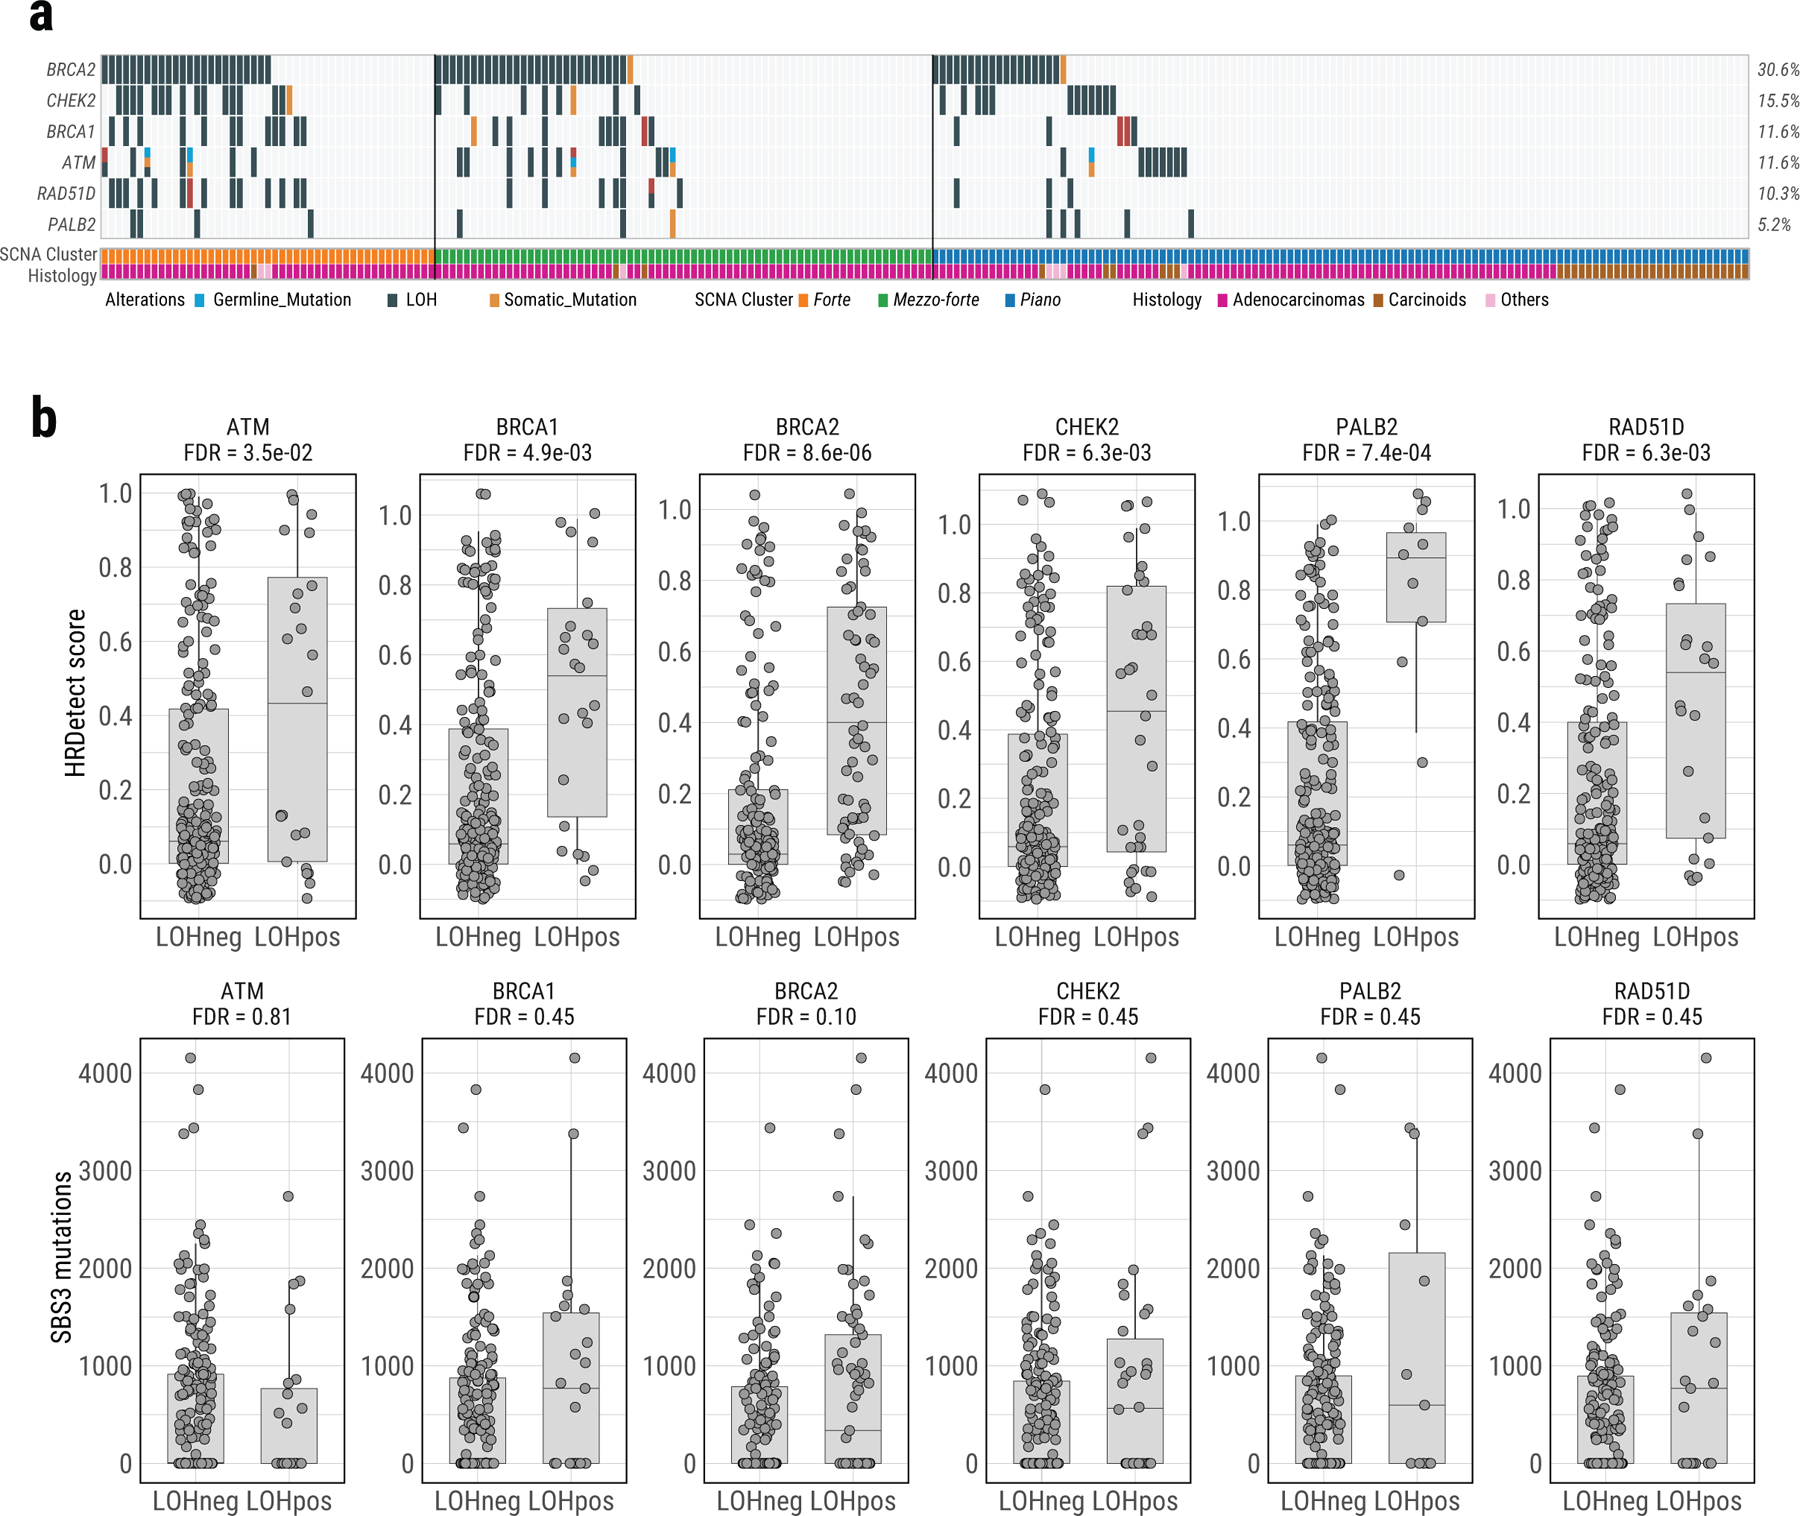
a, Oncoplot of genomic alterations in HRD associated genes, including germline mutations, somatic mutations and LOH. Samples with biallelic alterations are represented by bars with two different colors. The bottom bar shows tumor histological types. b, Boxplots of HRDetect scores (top) and SBS mutation loads (bottom) in tumors with and without LOH of six HR associated genes. FDR are calculated using the two-sided Mann-Whitney U test with multiple testing correction based on the Benjamini & Hochberg method. For box plots, center lines show the medians; box limits indicate the 25th and 75th percentiles; whiskers extend 1.5 times the interquartile range from the 25th and 75th percentiles.
Supplementary Material
Acknowledgments
This work has been supported by the Intramural Research Program (IRP) of the Division of Cancer Epidemiology and Genetics, National Cancer Institute, and the IRP of the National Institute of Environmental Health Sciences (Project number Z01 ES050159 to SHW, and Project number Z1AES103266 to DAG), US National Institutes of Health (NIH). This project was funded in whole or in part with Federal funds from the National Cancer Institute, National Institutes of Health, under Contract Nos. 75N91019D00024 and HHSN261201800001I. The content of this publication does not necessarily reflect the views or policies of the US Department of Health and Human Services, nor does mention of trade names, commercial products, or organizations imply endorsement by the US government. The research was also supported by the Wellcome Trust Core Award, Grant Number 203141/Z/16/Z with funding from the NIHR Oxford BRC. L.B.A. is an Abeloff V scholar and he is personally supported by an Alfred P. Sloan Research Fellowship and a Packard Fellowship for Science and Engineering. Research at the L.B.A. Lab was also supported by NIEHS grant R01ES032547. The views expressed are those of the author(s) and not necessarily those of the NHS, the NIHR or the Department of Health. The collection of samples from the Institut universitaire de cardiologie et de pneumologie de Québec – Université Laval (IUCPQ-UL) was supported by the IUCPQ Foundation. GR Program 2010–2316264 supported L.A.M for samples collection by IRCCS Fondazione Casa Sollievo della Sofferenza. A.L.M. is supported by a Damon Runyon Cancer Research Foundation postdoctoral fellowship (DRG:2368–19) and a Postdoctoral Enrichment Program Award from the Burroughs Wellcome Fund (1019903). C.F.K is supported in part by R35HL150876–01, the Thoracic Foundation, the Ellison Foundation, American Lung Association LCD-619492, and the Harvard Stem Cell Institute. N.L-B. acknowledges funding from the European Research Council (consolidator grant 682398). P.H. is supported in part by the “Association pour la Recherche contre le Cancer” (ARC CANC’AIR GENExposomics project). This work has been supported in part by the Tissue Core at the H. Lee Moffitt Cancer Center & Research Institute, a comprehensive cancer center designated by the National Cancer Institute and funded in part by Moffitt’s Cancer Center Support Grant (P30-CA076292). B.E.G.R is supported by NIH 1P50 CA196530–01 and NIH 1K08 CA151645–01.
We thank the Sherlock-Lung study Scientific Advisory Board (Drs. Matthew Meyerson, Jonathan Samet, Margaret Spitz, Ronald Summers, Michael Thun, and Bill Travis) for their support. We also thank Dr. Yulia Rubanova from Toronto University for her help with the TrackSig analysis. The authors also would like to thank the staff at the IUCPQ-UL Biobank, Nice Biobank CRB, Yale University and Moffitt Cancer Center & Research Institute for their valuable assistance in collecting samples and corresponding clinical data. This work utilized the computational resources of the NIH high-performance computational capabilities Biowulf cluster (http://hpc.nih.gov).
Footnotes
Competing interests
The authors declare no competing interests.
References
- 1.The Cancer Atlas: Lung Cancer. The Cancer Atlas https://canceratlas.cancer.org/the-burden/lung-cancer/.
- 2.Cho J. et al. Proportion and clinical features of never-smokers with non-small cell lung cancer. Chin. J. Cancer 36, 20 (2017). [DOI] [PMC free article] [PubMed] [Google Scholar]
- 3.Campbell JD et al. Distinct patterns of somatic genome alterations in lung adenocarcinomas and squamous cell carcinomas. Nat. Genet 48, 607–616 (2016). [DOI] [PMC free article] [PubMed] [Google Scholar]
- 4.Cancer Genome Atlas Research Network. Comprehensive molecular profiling of lung adenocarcinoma. Nature 511, 543–550 (2014). [DOI] [PMC free article] [PubMed] [Google Scholar]
- 5.Chen J. et al. Genomic landscape of lung adenocarcinoma in East Asians. Nat. Genet 52, 177–186 (2020). [DOI] [PubMed] [Google Scholar]
- 6.Govindan R. et al. Genomic landscape of non-small cell lung cancer in smokers and never-smokers. Cell 150, 1121–1134 (2012). [DOI] [PMC free article] [PubMed] [Google Scholar]
- 7.Imielinski M. et al. Mapping the hallmarks of lung adenocarcinoma with massively parallel sequencing. Cell 150, 1107–1120 (2012). [DOI] [PMC free article] [PubMed] [Google Scholar]
- 8.Lee JJ-K et al. Tracing Oncogene Rearrangements in the Mutational History of Lung Adenocarcinoma. Cell 177, 1842–1857.e21 (2019). [DOI] [PubMed] [Google Scholar]
- 9.Shi J. et al. Somatic Genomics and Clinical Features of Lung Adenocarcinoma: A Retrospective Study. PLoS Med 13, e1002162 (2016). [DOI] [PMC free article] [PubMed] [Google Scholar]
- 10.Wang C. et al. Whole-genome sequencing reveals genomic signatures associated with the inflammatory microenvironments in Chinese NSCLC patients. Nat. Commun 9, 2054 (2018). [DOI] [PMC free article] [PubMed] [Google Scholar]
- 11.Fernandez-Cuesta L. et al. Frequent mutations in chromatin-remodelling genes in pulmonary carcinoids. Nat. Commun 5, 3518 (2014). [DOI] [PMC free article] [PubMed] [Google Scholar]
- 12.PCAWG. Pan-cancer analysis of whole genomes. Nature 578, 82–93 (2020). [DOI] [PMC free article] [PubMed] [Google Scholar]
- 13.Wu K. et al. Frequent alterations in cytoskeleton remodelling genes in primary and metastatic lung adenocarcinomas. Nat. Commun 6, 10131 (2015). [DOI] [PMC free article] [PubMed] [Google Scholar]
- 14.Carrot-Zhang J. et al. Whole-genome characterization of lung adenocarcinomas lacking the RTK/RAS/RAF pathway. Cell Rep 34, 108707 (2021). [DOI] [PMC free article] [PubMed] [Google Scholar]
- 15.Landi MT et al. Tracing Lung Cancer Risk Factors through Mutational Signatures in Never Smokers: the Sherlock-Lung Study. American Journal of Epidemiology (2020). [DOI] [PMC free article] [PubMed]
- 16.Skoulidis F. et al. Co-occurring genomic alterations define major subsets of KRAS-mutant lung adenocarcinoma with distinct biology, immune profiles, and therapeutic vulnerabilities. Cancer Discov 5, 860–877 (2015). [DOI] [PMC free article] [PubMed] [Google Scholar]
- 17.Moll UM & Petrenko O The MDM2-p53 interaction. Mol. Cancer Res 1, 1001–1008 (2003). [PubMed] [Google Scholar]
- 18.Wala JA et al. Selective and mechanistic sources of recurrent rearrangements across the cancer genome. bioRxiv 187609 (2017) doi: 10.1101/187609. [DOI]
- 19.Reznik E. et al. Mitochondrial DNA copy number variation across human cancers. Elife 5, (2016). [DOI] [PMC free article] [PubMed] [Google Scholar]
- 20.McGranahan N. et al. Allele-Specific HLA Loss and Immune Escape in Lung Cancer Evolution. Cell 171, 1259–1271.e11 (2017). [DOI] [PMC free article] [PubMed] [Google Scholar]
- 21.Bailey MH et al. Comprehensive Characterization of Cancer Driver Genes and Mutations. Cell 173, 371–385.e18 (2018). [DOI] [PMC free article] [PubMed] [Google Scholar]
- 22.Moudry P. et al. Ubiquitin-activating enzyme UBA1 is required for cellular response to DNA damage. Cell Cycle 11, 1573–1582 (2012). [DOI] [PubMed] [Google Scholar]
- 23.Martínez-Jiménez F. et al. A compendium of mutational cancer driver genes. Nat. Rev. Cancer (2020) doi: 10.1038/s41568-020-0290-x. [DOI] [PubMed]
- 24.Huang K-L et al. Pathogenic Germline Variants in 10,389 Adult Cancers. Cell 173, 355–370.e14 (2018). [DOI] [PMC free article] [PubMed] [Google Scholar]
- 25.Staaf J. et al. Whole-genome sequencing of triple-negative breast cancers in a population-based clinical study. Nat. Med 25, 1526–1533 (2019). [DOI] [PMC free article] [PubMed] [Google Scholar]
- 26.Alexandrov LB et al. The repertoire of mutational signatures in human cancer. Nature 578, 94–101 (2020). [DOI] [PMC free article] [PubMed] [Google Scholar]
- 27.Bergstrom EN et al. SigProfilerMatrixGenerator: a tool for visualizing and exploring patterns of small mutational events. BMC Genomics 20, 685 (2019). [DOI] [PMC free article] [PubMed] [Google Scholar]
- 28.Petljak M. et al. Characterizing Mutational Signatures in Human Cancer Cell Lines Reveals Episodic APOBEC Mutagenesis. Cell 176, 1282–1294.e20 (2019). [DOI] [PMC free article] [PubMed] [Google Scholar]
- 29.Jager M. et al. Deficiency of nucleotide excision repair is associated with mutational signature observed in cancer. Genome Res 29, 1067–1077 (2019). [DOI] [PMC free article] [PubMed] [Google Scholar]
- 30.Singh VK, Rastogi A, Hu X, Wang Y & De S Mutational signature SBS8 predominantly arises due to late replication errors in cancer. Commun Biol 3, 421 (2020). [DOI] [PMC free article] [PubMed] [Google Scholar]
- 31.Roberts SA et al. An APOBEC cytidine deaminase mutagenesis pattern is widespread in human cancers. Nat. Genet 45, 970–976 (2013). [DOI] [PMC free article] [PubMed] [Google Scholar]
- 32.Kucab JE et al. A Compendium of Mutational Signatures of Environmental Agents. Cell 177, 821–836.e16 (2019). [DOI] [PMC free article] [PubMed] [Google Scholar]
- 33.Tokiwa H & Sera N Contribution of Nitrated Polycyclic Aromatic Hydrocarbons in Diesel Particles to Human Lung Cancer Induction. Polycycl. Aromat. Compd 21, 231–245 (2000). [Google Scholar]
- 34.Saini N. et al. Mutation signatures specific to DNA alkylating agents in yeast and cancers. Nucleic Acids Res 48, 3692–3707 (2020). [DOI] [PMC free article] [PubMed] [Google Scholar]
- 35.Chan K. et al. An APOBEC3A hypermutation signature is distinguishable from the signature of background mutagenesis by APOBEC3B in human cancers. Nat. Genet 47, 1067–1072 (2015). [DOI] [PMC free article] [PubMed] [Google Scholar]
- 36.Barthel FP et al. Systematic analysis of telomere length and somatic alterations in 31 cancer types. Nat. Genet 49, 349–357 (2017). [DOI] [PMC free article] [PubMed] [Google Scholar]
- 37.Feuerbach L. et al. TelomereHunter - in silico estimation of telomere content and composition from cancer genomes. BMC Bioinformatics 20, 272 (2019). [DOI] [PMC free article] [PubMed] [Google Scholar]
- 38.Davies H. et al. HRDetect is a predictor of BRCA1 and BRCA2 deficiency based on mutational signatures. Nat. Med 23, 517–525 (2017). [DOI] [PMC free article] [PubMed] [Google Scholar]
- 39.Zhao EY et al. Homologous Recombination Deficiency and Platinum-Based Therapy Outcomes in Advanced Breast Cancer. Clin. Cancer Res 23, 7521–7530 (2017). [DOI] [PubMed] [Google Scholar]
- 40.Letouzé E. et al. Mutational signatures reveal the dynamic interplay of risk factors and cellular processes during liver tumorigenesis. Nat. Commun 8, 1315 (2017). [DOI] [PMC free article] [PubMed] [Google Scholar]
- 41.Shinde J. et al. Palimpsest: an R package for studying mutational and structural variant signatures along clonal evolution in cancer. Bioinformatics 34, 3380–3381 (2018). [DOI] [PubMed] [Google Scholar]
- 42.Gerstung M. et al. The evolutionary history of 2,658 cancers. Nature 578, 122–128 (2020). [DOI] [PMC free article] [PubMed] [Google Scholar]
- 43.Halvorsen AR et al. TP53 Mutation Spectrum in Smokers and Never Smoking Lung Cancer Patients. Front. Genet 7, 85 (2016). [DOI] [PMC free article] [PubMed] [Google Scholar]
- 44.Gu J. et al. TP53 mutation is associated with a poor clinical outcome for non-small cell lung cancer: Evidence from a meta-analysis. Mol Clin Oncol 5, 705–713 (2016). [DOI] [PMC free article] [PubMed] [Google Scholar]
- 45.López S. et al. Interplay between whole-genome doubling and the accumulation of deleterious alterations in cancer evolution. Nat. Genet 52, 283–293 (2020). [DOI] [PMC free article] [PubMed] [Google Scholar]
- 46.Bielski CM et al. Genome doubling shapes the evolution and prognosis of advanced cancers. Nat. Genet 50, 1189–1195 (2018). [DOI] [PMC free article] [PubMed] [Google Scholar]
- 47.Jamal-Hanjani M. et al. Tracking the Evolution of Non-Small-Cell Lung Cancer. N. Engl. J. Med 376, 2109–2121 (2017). [DOI] [PubMed] [Google Scholar]
- 48.International Agency for Research on Cancer. A Review of Human Carcinogens: Personal habits and indoor combustions (International Agency for Research on Cancer, 2012).
- 49.Office on Smoking and Health (US). The Health Consequences of Involuntary Exposure to Tobacco Smoke: A Report of the Surgeon General (Centers for Disease Control and Prevention (US), 2010). [PubMed]
- 50.Lopez-Bigas N & Gonzalez-Perez A Are carcinogens direct mutagens? Nature genetics vol. 52 1137–1138 (2020). [DOI] [PubMed] [Google Scholar]
- 51.Cho IJ et al. Mechanisms, Hallmarks, and Implications of Stem Cell Quiescence. Stem Cell Reports 12, 1190–1200 (2019). [DOI] [PMC free article] [PubMed] [Google Scholar]
- 52.Fukada S-I, Ma Y & Uezumi A Adult stem cell and mesenchymal progenitor theories of aging. Front Cell Dev Biol 2, 10 (2014). [DOI] [PMC free article] [PubMed] [Google Scholar]
- 53.Li L & Clevers H Coexistence of quiescent and active adult stem cells in mammals. Science 327, 542–545 (2010). [DOI] [PMC free article] [PubMed] [Google Scholar]
- 54.Kim CFB et al. Identification of bronchioalveolar stem cells in normal lung and lung cancer. Cell 121, 823–835 (2005). [DOI] [PubMed] [Google Scholar]
- 55.Van Meter MEM et al. K-RasG12D expression induces hyperproliferation and aberrant signaling in primary hematopoietic stem/progenitor cells. Blood 109, 3945–3952 (2007). [DOI] [PMC free article] [PubMed] [Google Scholar]
- 56.Kubara K. et al. Status of KRAS in iPSCs Impacts upon Self-Renewal and Differentiation Propensity. Stem Cell Reports 11, 380–394 (2018). [DOI] [PMC free article] [PubMed] [Google Scholar]
- 57.Bax M. et al. The Ubiquitin Proteasome System Is a Key Regulator of Pluripotent Stem Cell Survival and Motor Neuron Differentiation. Cells 8, (2019). [DOI] [PMC free article] [PubMed] [Google Scholar]
- 58.Leon TYY et al. Transcriptional regulation of RET by Nkx2–1, Phox2b, Sox10, and Pax3. J. Pediatr. Surg 44, 1904–1912 (2009). [DOI] [PubMed] [Google Scholar]
- 59.Grey W. et al. Activation of the receptor tyrosine kinase, RET, improves long-term hematopoietic stem cell outgrowth and potency. Blood (2020) doi: 10.1182/blood.2020006302. [DOI] [PMC free article] [PubMed]
- 60.Fonseca-Pereira D. et al. The neurotrophic factor receptor RET drives haematopoietic stem cell survival and function. Nature 514, 98–101 (2014). [DOI] [PubMed] [Google Scholar]
- 61.Zhao B. et al. ARID1A promotes genomic stability through protecting telomere cohesion. Nat. Commun 10, 4067 (2019). [DOI] [PMC free article] [PubMed] [Google Scholar]
- 62.Sun X. et al. Suppression of the SWI/SNF Component Arid1a Promotes Mammalian Regeneration. Cell Stem Cell 18, 456–466 (2016). [DOI] [PMC free article] [PubMed] [Google Scholar]
- 63.van der Vaart A & van den Heuvel S Switching on regeneration. Stem cell investigation vol. 3 41 (2016). [DOI] [PMC free article] [PubMed] [Google Scholar]
- 64.Wu S, Zhang R & Bitler BG Arid1a controls tissue regeneration. Stem cell investigation vol. 3 35 (2016). [DOI] [PMC free article] [PubMed] [Google Scholar]
- 65.Nagl NG Jr, Wang X, Patsialou A, Van Scoy M & Moran E Distinct mammalian SWI/SNF chromatin remodeling complexes with opposing roles in cell-cycle control. EMBO J 26, 752–763 (2007). [DOI] [PMC free article] [PubMed] [Google Scholar]
- 66.Chiba S Notch signaling in stem cell systems. Stem Cells 24, 2437–2447 (2006). [DOI] [PubMed] [Google Scholar]
- 67.Yoshida K. et al. Tobacco smoking and somatic mutations in human bronchial epithelium. Nature (2020) doi: 10.1038/s41586-020-1961-1. [DOI] [PMC free article] [PubMed]
- 68.Maeda Y, Davé V & Whitsett JA Transcriptional control of lung morphogenesis. Physiol. Rev 87, 219–244 (2007). [DOI] [PubMed] [Google Scholar]
- 69.Alanis DM, Chang DR, Akiyama H, Krasnow MA & Chen J Two nested developmental waves demarcate a compartment boundary in the mouse lung. Nat. Commun 5, 3923 (2014). [DOI] [PMC free article] [PubMed] [Google Scholar]
- 70.Singh I. et al. Hmga2 is required for canonical WNT signaling during lung development. BMC Biol 12, 21 (2014). [DOI] [PMC free article] [PubMed] [Google Scholar]
- 71.Laughney AM et al. Regenerative lineages and immune-mediated pruning in lung cancer metastasis. Nat. Med 26, 259–269 (2020). [DOI] [PMC free article] [PubMed] [Google Scholar]
- 72.Duffy MJ et al. p53 as a target for the treatment of cancer. Cancer Treat. Rev 40, 1153–1160 (2014). [DOI] [PubMed] [Google Scholar]
- 73.Shaikh MF et al. Emerging Role of MDM2 as Target for Anti-Cancer Therapy: A Review. Ann. Clin. Lab. Sci 46, 627–634 (2016). [PubMed] [Google Scholar]
- 74.Chuang JC et al. ERBB2-Mutated Metastatic Non-Small Cell Lung Cancer: Response and Resistance to Targeted Therapies. J. Thorac. Oncol 12, 833–842 (2017). [DOI] [PMC free article] [PubMed] [Google Scholar]
- 75.Harvey RD, Adams VR, Beardslee T & Medina P Afatinib for the treatment of EGFR mutation-positive NSCLC: A review of clinical findings. J. Oncol. Pharm. Pract 1078155220931926 (2020). [DOI] [PMC free article] [PubMed]
- 76.Park K. et al. Afatinib versus gefitinib as first-line treatment of patients with EGFR mutation-positive non-small-cell lung cancer (LUX-Lung 7): a phase 2B, open-label, randomised controlled trial. Lancet Oncol 17, 577–589 (2016). [DOI] [PubMed] [Google Scholar]
- 77.Shen X. et al. A systematic analysis of the resistance and sensitivity of HER2YVMA receptor tyrosine kinase mutant to tyrosine kinase inhibitors in HER2-positive lung cancer. J. Recept. Signal Transduct. Res 36, 89–97 (2016). [DOI] [PubMed] [Google Scholar]
- 78.Miyazaki M. et al. The p53 activator overcomes resistance to ALK inhibitors by regulating p53-target selectivity in ALK-driven neuroblastomas. Cell Death Discov 4, 56 (2018). [DOI] [PMC free article] [PubMed] [Google Scholar]
- 79.Dey P. et al. Genomic deletion of malic enzyme 2 confers collateral lethality in pancreatic cancer. Nature 542, 119–123 (2017). [DOI] [PMC free article] [PubMed] [Google Scholar]
- 80.Muller FL, Aquilanti EA & DePinho RA Collateral Lethality: A new therapeutic strategy in oncology. Trends Cancer Res 1, 161–173 (2015). [DOI] [PMC free article] [PubMed] [Google Scholar]
- 81.Hsiehchen D. et al. DNA Repair Gene Mutations as Predictors of Immune Checkpoint Inhibitor Response beyond Tumor Mutation Burden. Cell Rep Med 1, (2020). [DOI] [PMC free article] [PubMed] [Google Scholar]
- 82.Rizvi NA et al. Cancer immunology. Mutational landscape determines sensitivity to PD-1 blockade in non-small cell lung cancer. Science 348, 124–128 (2015). [DOI] [PMC free article] [PubMed] [Google Scholar]
- 83.Hellmann MD et al. Nivolumab plus Ipilimumab in Lung Cancer with a High Tumor Mutational Burden. N. Engl. J. Med 378, 2093–2104 (2018). [DOI] [PMC free article] [PubMed] [Google Scholar]
- 84.Ready N. et al. First-Line Nivolumab Plus Ipilimumab in Advanced Non-Small-Cell Lung Cancer (CheckMate 568): Outcomes by Programmed Death Ligand 1 and Tumor Mutational Burden as Biomarkers. J. Clin. Oncol 37, 992–1000 (2019). [DOI] [PMC free article] [PubMed] [Google Scholar]
- 85.Canon J. et al. The clinical KRAS(G12C) inhibitor AMG 510 drives anti-tumour immunity. Nature 575, 217–223 (2019). [DOI] [PubMed] [Google Scholar]
- 86.Yang L. et al. Targeting cancer stem cell pathways for cancer therapy. Signal Transduct Target Ther 5, 8 (2020). [DOI] [PMC free article] [PubMed] [Google Scholar]
- 87.Medema JP & Vermeulen L Microenvironmental regulation of stem cells in intestinal homeostasis and cancer. Nature 474, 318–326 (2011). [DOI] [PubMed] [Google Scholar]
Method References
- 88.Jørsboe E, Hanghøj K & Albrechtsen A fastNGSadmix: admixture proportions and principal component analysis of a single NGS sample. Bioinformatics 33, 3148–3150 (2017). [DOI] [PubMed] [Google Scholar]
- 89.Cibulskis K. et al. Sensitive detection of somatic point mutations in impure and heterogeneous cancer samples. Nat. Biotechnol. 31, 213–219 (2013). [DOI] [PMC free article] [PubMed] [Google Scholar]
- 90.Kim S. et al. Strelka2: fast and accurate calling of germline and somatic variants. Nat. Methods 15, 591–594 (2018). [DOI] [PubMed] [Google Scholar]
- 91.Freed D, Pan R & Aldana R TNscope: Accurate Detection of Somatic Mutations with Haplotype-based Variant Candidate Detection and Machine Learning Filtering. bioRxiv 250647 (2018) doi: 10.1101/250647. [DOI]
- 92.Zhu B. et al. The genomic and epigenomic evolutionary history of papillary renal cell carcinomas. Nat. Commun 11, 3096 (2020). [DOI] [PMC free article] [PubMed] [Google Scholar]
- 93.Karczewski KJ et al. Variation across 141,456 human exomes and genomes reveals the spectrum of loss-of-function intolerance across human protein-coding genes. bioRxiv 531210 (2019) doi: 10.1101/531210. [DOI]
- 94.Ramos AH et al. Oncotator: cancer variant annotation tool. Hum. Mutat 36, E2423–9 (2015). [DOI] [PMC free article] [PubMed] [Google Scholar]
- 95.Wang K, Li M & Hakonarson H ANNOVAR: functional annotation of genetic variants from high-throughput sequencing data. Nucleic Acids Res 38, e164 (2010). [DOI] [PMC free article] [PubMed] [Google Scholar]
- 96.Hasan MS, Wu X, Watson LT & Zhang L UPS-indel: a Universal Positioning System for Indels. Sci. Rep 7, 14106 (2017). [DOI] [PMC free article] [PubMed] [Google Scholar]
- 97.Dentro SC, Wedge DC & Van Loo P Principles of Reconstructing the Subclonal Architecture of Cancers. Cold Spring Harb. Perspect. Med 7, (2017). [DOI] [PMC free article] [PubMed] [Google Scholar]
- 98.Nik-Zainal S. et al. The life history of 21 breast cancers. Cell 149, 994–1007 (2012). [DOI] [PMC free article] [PubMed] [Google Scholar]
- 99.Scott AD et al. CharGer: clinical Characterization of Germline variants. Bioinformatics 35, 865–867 (2019). [DOI] [PMC free article] [PubMed] [Google Scholar]
- 100.Landrum MJ et al. ClinVar: public archive of interpretations of clinically relevant variants. Nucleic Acids Res 44, D862–8 (2016). [DOI] [PMC free article] [PubMed] [Google Scholar]
- 101.Martincorena I. et al. Universal Patterns of Selection in Cancer and Somatic Tissues. Cell 171, 1029–1041.e21 (2017). [DOI] [PMC free article] [PubMed] [Google Scholar]
- 102.Muiños F, Martinez-Jimenez F, Pich O, Gonzalez-Perez A & Lopez-Bigas N In silico saturation mutagenesis of cancer genes. bioRxiv 2020.06.03.130211 (2020) doi: 10.1101/2020.06.03.130211. [DOI] [PubMed]
- 103.Mermel CH et al. GISTIC2.0 facilitates sensitive and confident localization of the targets of focal somatic copy-number alteration in human cancers. Genome Biol 12, R41 (2011). [DOI] [PMC free article] [PubMed] [Google Scholar]
- 104.Dewhurst SM et al. Tolerance of whole-genome doubling propagates chromosomal instability and accelerates cancer genome evolution. Cancer Discov 4, 175–185 (2014). [DOI] [PMC free article] [PubMed] [Google Scholar]
- 105.Yang L. et al. Diverse mechanisms of somatic structural variations in human cancer genomes. Cell 153, 919–929 (2013). [DOI] [PMC free article] [PubMed] [Google Scholar]
- 106.Li Y. et al. Patterns of somatic structural variation in human cancer genomes. Nature 578, 112–121 (2020). [DOI] [PMC free article] [PubMed] [Google Scholar]
- 107.Ding Z. et al. Estimating telomere length from whole genome sequence data. Nucleic Acids Res 42, e75 (2014). [DOI] [PMC free article] [PubMed] [Google Scholar]
- 108.Alexandrov LB et al. Signatures of mutational processes in human cancer. Nature 500, 415–421 (2013). [DOI] [PMC free article] [PubMed] [Google Scholar]
- 109.Shukla SA et al. Comprehensive analysis of cancer-associated somatic mutations in class I HLA genes. Nat. Biotechnol 33, 1152–1158 (2015). [DOI] [PMC free article] [PubMed] [Google Scholar]
- 110.Bolli N. et al. Heterogeneity of genomic evolution and mutational profiles in multiple myeloma. Nat. Commun 5, 2997 (2014). [DOI] [PMC free article] [PubMed] [Google Scholar]
- 111.Luce RD Individual choice behavior; a theoretical analysis. (Wiley, 1959). [Google Scholar]
- 112.Plackett RL The Analysis of Permutations. Journal of the Royal Statistical Society. Series C (Applied Statistics) 24, 193 (1975). [Google Scholar]
Associated Data
This section collects any data citations, data availability statements, or supplementary materials included in this article.
Supplementary Materials
Data Availability Statement
232 normal and tumor paired raw data (BAM files) of the whole genome sequencing datasets have been deposited in dbGaP with accession number: phs001697.v1.p1. Researchers will need to obtain dbGaP authorization to download these data. RNA-seq raw data (FASTQ files) have been submitted to NCBI GEO database with access number GSE171415. Germline variant dataset from EAGLE whole exome sequencing study can be access in dbGaP with access number phs002496.v1.p1. In addition, histological images of these tumors can be found at https://episphere.github.io/svs. Public datasets were used in this study including: gnomAD (v2.1.1)/ExAC (v0.3.1) (https://gnomad.broadinstitute.org/), 1000 genomes (phase 3 v5, https://www.internationalgenome.org/) and dbSNP (v138, https://www.ncbi.nlm.nih.gov/snp/).


