

Summary
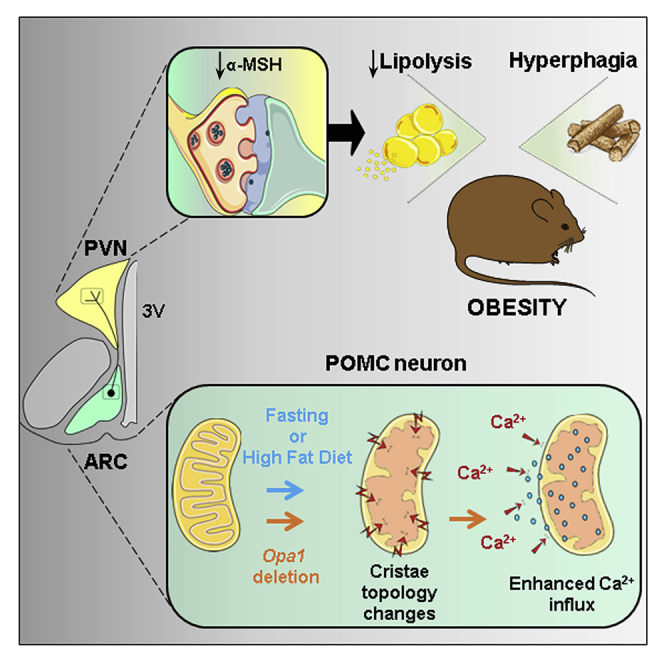
Appropriate cristae remodeling is a determinant of mitochondrial function and bioenergetics and thus represents a crucial process for cellular metabolic adaptations. Here, we show that mitochondrial cristae architecture and expression of the master cristae-remodeling protein OPA1 in proopiomelanocortin (POMC) neurons, which are key metabolic sensors implicated in energy balance control, is affected by fluctuations in nutrient availability. Genetic inactivation of OPA1 in POMC neurons causes dramatic alterations in cristae topology, mitochondrial Ca2+ handling, reduction in alpha-melanocyte stimulating hormone (α-MSH) in target areas, hyperphagia, and attenuated white adipose tissue (WAT) lipolysis resulting in obesity. Pharmacological blockade of mitochondrial Ca2+ influx restores α-MSH and the lipolytic program, while improving the metabolic defects of mutant mice. Chemogenetic manipulation of POMC neurons confirms a role in lipolysis control. Our results unveil a novel axis that connects OPA1 in POMC neurons with mitochondrial cristae, Ca2+ homeostasis, and WAT lipolysis in the regulation of energy balance.
Keywords: hypothalamus, POMC neurons, mitochondria, cristae, OPA-1, lipolysis, obesity
Graphical abstract
Highlights
-
•
Nutritional state shapes mitochondrial cristae and OPA1 expression in POMC neurons
-
•
OPA1 deletion in POMC neurons alters mitochondrial Ca2+ handling and α-MSH release
-
•
POMC OPA1-deficient mice show impaired fat lipolysis and metabolic health
-
•
Pharmacological restoration of Ca2+ recovered molecular and metabolic alterations
Gómez-Valadés et al. report that mitochondrial cristae dynamically reshape in POMC neurons in response to nutritional state. With genetic targeting, they reveal that the cristae-remodeling protein OPA1 is essential to sustain cristae structure and mitochondrial Ca2+ homeostasis in POMC neurons, ensuring appropriate modulation of α-MSH release, the lipolytic program in adipose tissue and metabolic health.
Introduction
Homeostatic regulation of energy balance is achieved by the orchestration of adaptive behavioral, autonomic, and endocrine responses via multiple and distributed neuronal networks. A crucial feature to properly modulate such effector mechanisms is the ability of these neural circuits to sense and integrate diverse signals reflecting nutritional status (Timper and Brüning, 2017). In this scenario, proopiomelanocortin (POMC)-expressing neurons in the arcuate nucleus of the hypothalamus (ARC) have emerged as key nutrient sensors implicated in the regulation of metabolism (Timper and Brüning, 2017; Toda et al., 2017). However, the precise molecular mechanisms of POMC neuron nutrient sensing remain incompletely understood.
Mitochondria play a fundamental role in cellular energy management, being able to monitor nutrient fluctuations and arrange coordinated responses to bioenergetically adjust to metabolic demands (Gao et al., 2014; Liesa and Shirihai, 2013). These responses are complex and involve a combination of diverse molecular pathways that modulate mitochondrial biogenesis, metabolism, and dynamics.
Mitochondrial dynamics is a key process to ensure cell survival during a variety of stress conditions. For example, the interplay between metabolic challenges and variations in mitochondrial architecture has been reported in several tissues (Liesa and Shirihai, 2013; Mishra and Chan, 2016; Schrepfer and Scorrano, 2016; Wai and Langer, 2016). Mitochondrial morphology is mainly controlled by fusion processes, via mitofusins (MFN1 and MFN2) and optic atrophy 1 (OPA1), and fission events by dynamin-related protein 1 (DRP1), fission 1 (FIS1), and mitochondrial fission factor (MFF) (Tilokani et al., 2018). Notably, recent evidence has shown that adequate mitochondrial fusion and fission in hypothalamic neurons, including POMC neurons, are necessary for systemic metabolic control (Dietrich et al., 2013; Ramírez et al., 2017; Santoro et al., 2017; Schneeberger et al., 2013; Toda et al., 2016).
Mitochondria also undergo remodeling of internal structures such as cristae, which are dynamic infolds of the inner membrane. Cristae are critical for efficient oxidative phosphorylation (OXPHOS) and contribute to the diffusion of proteins, metabolites, and ions including Ca2+. Therefore, it is not surprising that changes in cristae structure influence mitochondrial bioenergetics and that cristae reshaping is observed according to the cellular energetic state (Cogliati et al., 2013; Gomes et al., 2011; Mishra et al., 2014; Patten et al., 2014). While the in vivo link between metabolism and mitochondrial dynamics is recognized, its connection with cristae morphology remains poorly understood.
OPA1, in addition to its involvement in mitochondrial dynamics, is a master regulator of cristae remodeling by participating in cristae junction formation and maintenance. This process protects cells from apoptosis (Cipolat et al., 2006; Frezza et al., 2006) and improves OXPHOS through stabilization of respiratory chain supercomplexes (Civiletto et al., 2015; Cogliati et al., 2013; Del Dotto et al., 2017). Importantly, OPA1-dependent cristae modulation is required for cellular adaptations to metabolic demands (Patten et al., 2014). Therefore, cristae remodeling can be postulated as a new therapeutic approach to counteract mitochondrial and metabolic dysfunctions (Cogliati et al., 2016).
The connection between OPA1, cristae structure, and OXPHOS activity independent of mitochondrial fusion (Patten et al., 2014) suggests that cristae topology readjustments participate in energy balance control. Thus, we reasoned that such a convoluted process could represent a core mechanism in POMC neurons to sense and adapt to metabolic needs. Here, we unveil an unexpected link between OPA1 and mitochondrial Ca2+ dynamics in POMC neurons, influencing adipose tissue triglyceride mobilization and metabolic health.
Results
Nutritional challenges reshape mitochondrial cristae architecture in POMC neurons
To initially explore whether changes in nutrient availability influence mitochondrial cristae structure in POMC neurons, control C57Bl/6J mice were submitted to diverse energy states and cristae were examined by electron microscopy (Figure S1A). Food deprivation decreased the number of cristae per mitochondria (Figure 1A) with a concomitant increase in cristae length (Figures 1B and 1C). Nutrient overload with high-fat diet (HFD) also resulted in a reduced number of cristae per mitochondria (Figure 1D), but without altering their length (Figures 1C and 1E). These results suggest that mitochondrial cristae topology in POMC neurons is modulated by physiological and pathophysiological nutritional conditions.
Figure 1.

Mitochondrial cristae remodeling in POMC neurons is influenced by nutritional status
(A and B) Quantification of cristae per mitochondria (A) and cumulative probability distribution of cristae length (B) in POMC neurons of C57Bl/6J mice upon random fed (n = 1,009 cristae, 152 mitochondria, 15 neurons, 4 mice) or fasted (n = 906 cristae, 151 mitochondria, 20 neurons, 4 mice) conditions.
(C) Representative electron micrographs of mitochondria cristae profiles in POMC neurons from fed, fasted, and high-fat diet (HFD) C57Bl/6J mice. Scale bar, 100 nm.
(D and E) Quantification of cristae per mitochondria (D) and cumulative probability distribution of cristae length (E) in POMC neurons of C57Bl/6J mice fed normal chow diet (NCD; n = 893 cristae, 164 mitochondria, 16 neurons, 4 mice) or HFD for 16 weeks (n = 881 cristae, 186 mitochondria, 19 neurons, 4 mice).
(F) Schematic of the protocol used for POMC neuron translatome enrichment.
(G) Expression of mitochondrial fusion genes in POMC neurons from random fed or fasted POMCRiboTag mice (n = 6–8/ group).
(H) Expression of mitochondrial fusion genes in POMC neurons from POMCRiboTag mice fed with NCD or HFD (n = 5–7/ group).
All studies were conducted in 12- to 14-week-old male mice. Data are expressed as mean ± SEM. ∗p < 0.05; ∗∗p < 0.01; ∗∗∗p < 0.001. ns, not significant. See also Figure S1.
Since OPA1 participates in cristae structure maintenance and adaptations to metabolic status (Cogliati et al., 2016), we examined the associations between hypothalamic Opa1 expression and metabolic phenotypes using the BXD mouse reference panel. These inbred strains permit the investigation of genetic variation with a complexity that resembles the human population (Wang et al., 2016). We observed a negative correlation between the expression of Opa1 in the hypothalamus and body weight, food intake, adiposity, and glycemia across the BXD strains under HFD conditions (Figure S1B).
To investigate the implication of OPA1 in POMC neuron adaptation to metabolic status, we measured its gene expression under similar nutritional conditions. To this aim we opted for a translating ribosome affinity purification strategy. We interbred POMCCre/+ with Rpl22lsl-HA floxed mice (hereafter POMCRiboTag), which allows Cre-mediated hemagglutinin (HA) tagging of polyribosomes and subsequent isolation of actively translated mRNAs (Figure 1F) (Sanz et al., 2009). The reliability of the model to purify POMC-enriched transcripts and the assessment of possible off-target recombination was tested. Colocalization of POMC and HA showed ~11% off-target recombination, with random distribution throughout the ARC (Figures S1C and S1D, red column). Only ~6% of POMC neurons did not recombine (Figures S1C and S1D, green column). Expression analysis revealed that, relative to total Pomc gene enrichment, Agrp and Npy only represented 9.2% and 9.1%, respectively (Figure S1E). This is compatible with a subpopulation of POMC neurons coexpressing Agrp and Npy (Campbell et al., 2017; Lam et al., 2017). No enrichment of negative control markers for dopaminergic neurons (tyrosine hydroxylase; Th) or astrocytes (aldehyde dehydrogenase 1 family member L1; Aldh1l1) was observed (Figure S1E). Interestingly, Opa1 expression was reduced in POMC neurons under both fasting and HFD conditions (Figures 1G and 1H). In agreement with a shift toward fission in POMC neurons under nutrient deprivation or excess (Dietrich et al., 2013; Ramírez et al., 2017; Santoro et al., 2017; Schneeberger et al., 2013), we also found a reduction of either Mfn1 upon fasting or Mfn2 upon HFD (Figures 1G and 1H). A coordinated decrease in fusion and fission genes is common through diverse physiologic and pathophysiologic conditions (Favaro et al., 2019). Accordingly, fission determinants Dnm1 and Fis1 were also reduced upon fasting, suggestive of halted mitochondrial dynamics, but remained unchanged upon HFD indicating that these genes did not contribute to the phenotype (Figures S1F and S1G).
These results indicate that the POMCRiboTag mouse is an appropriate tool to investigate cell-specific translatome changes and that fluctuations in nutrient availability impact on mitochondrial cristae status and Opa1 expression in POMC neurons.
Generation of mice lacking OPA1 in POMC neurons
To explore the in vivo role of OPA1 in POMC neurons we generated POMC-neuron-specific Opa1 knockout mice (hereafter POMCOpa1KO) as previously described (Ramírez et al., 2017). Downregulation of Opa1 gene expression was detected in ARC-enriched microdissections (Figure S2A). Additionally, densitometric protein quantification showed a 22% downregulation of OPA1 short and long forms (Figures S2B and S2C). To further confirm Opa1 deletion in POMC neurons, we conducted fluorescence in situ hybridization and immunofluorescence techniques. Opa1 transcript expression was depleted to 25% (Figures S2D and S2E), while OPA1 protein dropped to 12% in POMCOpa1KO compared with control mice (Figures S2F and S2G).
As the POMC promoter also drives Cre recombinase expression in corticotrophs and melanotrophs, we examined OPA1 expression in the pituitary gland. No changes were observed at transcriptional (Figure S3A) or protein expression levels (Figure S3B; control 100 ± 2 versus POMCOpa1KO 93 ± 5 a.u.; n = 6–5). The anatomy of the pituitary and adrenal gland was preserved (Figures S3C and S3D). The number of positive cells for growth hormone (Gh), prolactin (Prl), follicle-stimulating hormone (Fsh), luteinizing hormone (Lh), adrenocorticotropic hormone (Acth), and thyroid-stimulating hormone (Tsh) was comparable between control and mutant mice (Figure S3E). Furthermore, basal and stress-induced corticosterone (Figure S3F), epinephrine, and norepinephrine concentrations were also normal (Figure S3G). This demonstrates that Cre-mediated recombination in the pituitary did not impair the pituitary-adrenal axis.
Deletion of Opa1 in POMC neurons results in obesity and hyperphagia
Male POMCOpa1KO mice developed obesity from 7 weeks of age onward (Figure 2A), concomitant with increased total fat mass (Figure 2B). Perigonadal (pgWAT) and subcutaneous (scWAT) white adipose tissue depots were larger whereas no change was observed in brown adipose tissue (BAT) mass (Figure 2C). In line with enhanced adiposity, POMCOpa1KO mice displayed hyperleptinemia (Figure 2D) and leptin resistance (Figures 2E and 2F).
Figure 2.

Deletion of Opa1 in POMC neurons causes obesity
(A) Body weight of control (n = 6) and POMCOpa1KO (n = 7) mice on chow diet.
(B) Total lean and fat mass in control (n = 8) and POMCOpa1KO (n = 9) mice.
(C) Adiposity in control (n = 5) and POMCOpa1KO (n = 11) mice. Perigonadal (pgWAT), subcutaneous (scWAT), and brown (BAT) adipose tissues are represented.
(D) Fasting plasma leptin levels in control (n = 5) and POMCOpa1KO (n = 11) mice.
(E and F) Cumulative food intake (E) and body weight gain (F) after vehicle (Veh) or leptin (Lep) treatment in control (n = 6) and POMCOpa1KO (n = 7) mice.
(G) Daily food intake in control (n = 6) and POMCOpa1KO (n = 7) mice.
(H and I) Relative neuropeptide expression in the hypothalamus of control (n = 6) and POMCOpa1KO (n = 7) mice under fed or fasting conditions.
(J and K) Representative immunofluorescence images (J) and integrated density quantification (K) of α-MSH staining in the PVN from control (n = 3) and POMCOpa1KO (n = 3) mice. 3V, third ventricle. Scale bar, 100 μm.
(L and M) Representative TOMATO fluorescence images (L) and quantification (M) of POMC neuron projection density in the PVH from control (n = 5) and POMCOpa1KO (n = 7) mice. 3V, third ventricle. Scale bar, 100 μm.
(N) Total hypothalamic α-MSH content in control (n = 7) and POMCOpa1KO (n = 7) mice.
(O) Gene expression of POMC-processing enzymes in the hypothalamus from control (n = 7) and POMCOpa1KO (n = 7) mice.
(P) Fed and fasting blood glucose levels in control (n = 5) and POMCOpa1KO (n = 11) mice.
(Q) Fasting plasma insulin levels in control (n = 6) and POMCOpa1KO (n = 7) mice.
All studies were conducted in 12- to 14-week-old male control and POMCOpa1KO mice. Data are expressed as mean ± SEM. ∗p < 0.05; ∗∗p < 0.01; ∗∗∗p < 0.001. ns, not significant. See also Figures S2 and S3.
To discriminate the causes leading to obesity in mutant mice, we analyzed energy expenditure and food intake. No alterations in energy expenditure were detected (Figures S3H and S3I). Nevertheless, POMCOpa1KO mice displayed hyperphagia (Figure 2G). Enhanced orexigenic neuropeptide tone and blunted transition between fast and fed states was observed in mutant mice (Figures 2H and 2I). Consistently, α-MSH staining in the paraventricular (PVH), lateral (LH), dorsomedial (DMH), and ventromedial (VMH) nucleus of the hypothalamus was decreased in mutant mice (Figures 2J and 2K; data not shown). This was not due to impaired POMC neuron projection development, as total fiber density in the PVH was not affected by Opa1 deficiency (Figures 2L and 2M). Total hypothalamic α-MSH content (Figure 2N) and the expression of POMC prohormone convertases Pc1/3, Pc2, or α-amidating monooxygenase (Pam) (Figure 2O) were unaltered. These results suggest defective neuropeptide transport to axonal target sites as the likely cause of reduced α-MSH fibers.
Obesity is closely associated with alterations in glucose metabolism. As expected, mutant mice exhibited high blood glucose levels under fed conditions (Figure 2P), hyperinsulinemia (Figure 2Q), glucose intolerance (Figure S3J), and insulin resistance (Figure S3K). As female mutant mice displayed a similar obesogenic and metabolic phenotype (Figures S3L–S3O), subsequent studies were executed in male mice.
Together, loss of OPA1 in POMC neurons led to hyperphagic obesity and altered glucose metabolism due to defective transport and release of α-MSH.
Impaired fasting-induced lipolysis in POMCOpa1KO mice precedes the onset of obesity
We noticed that fasting-induced body weight loss in adult POMCOpa1KO mice was significantly attenuated when compared with control mice (Figure S4A), suggestive of impaired adipose tissue mobilization in situations of energy demand. To minimize confounding factors associated with obesity, we studied young weight-matched mice (5–6 weeks of age) before the onset of obesity. At this time point, no difference in body weight was detectable at basal fed conditions (Figure 3A), in spite of an incipient adiposity in POMCOpa1KO mice (Figure 3B). Concomitantly, mutant mice exhibited hyperleptinemia (Figure S4B), despite normal leptin sensitivity (Figure S4C), and exacerbated response to the α-MSH analog melanotan II (MT-II) (Figure S4D) indicative of a developing melanocortigenic defect preceding obesity. At this age, POMCOpa1KO mice did not show hyperglycemia (control 67 ± 5 versus POMCOpa1KO 74 ± 3 mg/dL, n = 4–7), hyperinsulinemia (control 0.50 ± 0.08 versus POMCOpa1KO 0.71 ± 0.11 ng/dL, n = 4–7) or altered food intake (control 3.2 ± 0.2 versus POMCOpa1KO 3.3 ± 0.1 g/day, n = 10).
Figure 3.

Impaired lipolysis upon fasting in POMCOpa1KO mice precedes the onset of obesity
(A) Body weight (n = 9–11/genotype/nutritional status; pooled from two independent experiments).
(B) pgWAT, scWAT, and BAT mass (n = 9–11/genotype/nutritional status; pooled from two independent experiments).
(C) Plasma FFA levels (n = 9–10/genotype/nutritional status).
(D) Gene expression of lipolytic enzymes in pgWAT (n = 7–8/genotype/nutritional status).
(E and F) Representative immunoblot images (E) and densitometric quantification (F) of pHSL (normalized by total HSL protein) and perilipin A (normalized by tubulin) levels in pgWAT (n = 4/genotype/nutritional status).
(G) Epinephrine and norepinephrine content in pgWAT (n = 4/genotype/nutritional status).
All studies were conducted in 5- to 6-week-old male control and POMCOpa1KO mice under fed or overnight (16 h) fasting conditions. Data are expressed as mean ± SEM. ∗p < 0.05; ∗∗p < 0.01; ∗∗∗p < 0.001. ns, not significant. See also Figure S4.
Interestingly, mutant mice did not lose body weight, pgWAT, or scWAT mass upon overnight fasting as opposed to control counterparts (Figures 3A and 3B), suggesting impaired lipolysis. This effect was specific for WAT, as BAT mass (Figure 3B), liver weight, and hepatic triglyceride content (Figures S4E and S4F) were unaltered.
During fasting, WAT triglycerides are hydrolyzed into glycerol and free fatty acids (FFAs), which are released into the bloodstream to provide lipidic substrates to other tissues. Thus, we asked whether defective lipolysis was underlying the reduced adiposity loss upon fasting in POMCOpa1KO mice. Fasting-induced lipolysis caused a 2-fold increase in plasma FFA levels in control animals. However, this was significantly attenuated in mutant mice (Figure 3C). The lipolytic pathway is mainly controlled by adipose triglyceride lipase (ATGL), hormone-sensitive lipase (HSL), and perilipin A (Wang et al., 2008). ATGL (encoded by Pnpla2), but not HSL (encoded by Lipe), gene expression was reduced under fasting conditions in pgWAT from POMCOpa1KO mice (Figure 3D). HSL is activated by phosphorylation at S660 and S563 (Anthonsen et al., 1998; Greenberg et al., 2001). Notably, mutant mice showed an impaired phosphorylation pattern during the fed to fast transition (Figures 3E and 3F). In addition, perilipin A protein levels were significantly reduced (Figures 3E and 3F). Collectively, these results are consistent with impaired lipolysis in POMCOpa1KO mice.
Catecholamines are major signals triggering lipolysis through local sympathetic WAT innervation (Bartness et al., 2014). Local pgWAT content of epinephrine and norepinephrine in fed conditions were equivalent between control and POMCOpa1KO mice (Figure 3G). However, pgWAT catecholamine content was reduced in mutant mice under fasting conditions (Figure 3G) indicating impaired sympathetic tone.
As the sympathetic nervous system (SNS) is also involved in proliferation and differentiation of adipose tissue, gene expression for established markers (Cebpa, Pparg, and AdipoQ) was assessed. No significant differences were found (Figure S4G), ruling out potential alterations in adipogenesis. Furthermore, equivalent gene expression of key enzymes involved in lipid uptake (Lpl and Cd36) and de novo FFA synthesis (Acca, Fasn, and Scd1) during both fed and fast states was observed in pgWAT from control and POMCOpa1KO mice (Figure S4H). These findings rule out a putative contribution of lipogenesis or FFA uptake in the phenotype observed in mutant mice.
Together, these results indicate that deletion of OPA1 in POMC neurons impairs sympathetic outflow-mediated lipolysis in adipose tissue upon fasting before the onset of obesity.
POMC neurons regulate lipolysis
Pharmacological and genetic studies have shown that the central melanocortin system modulates WAT metabolism (Brito et al., 2007; Nogueiras et al., 2007). However, direct involvement of POMC neurons in adipose tissue lipolysis control has not been established. To this aim, we injected Cre-dependent stimulatory (AAV-hM3Dq) or inhibitory (AAV-hM4Di) designer receptors exclusively activated by designer drugs (DREADDs) into the ARC of POMCCre/+ mice or POMC+/+ counterparts (Figures 4A and 4E). Efficient recombination of DREADDs in POMC neurons was confirmed by the expression of mCherry reporter (Figures S5A and S5B).
Figure 4.

Modulation of POMC neuron activity influences lipolysis
(A) Schematic of viral activatory DREADD injection.
(B) Fasting-induced FFA increase after CNO-mediated stimulation of POMC neuronal activity (n = 9–13/group).
(C) Fasting-induced pgWAT mass after CNO-mediated stimulation of POMC neuronal activity (n = 12–13/group).
(D) Fasting-induced body weight change after CNO-mediated stimulation of POMC neuronal activity (n = 13/group).
(E) Schematic of viral inhibitory DREADD injection.
(F) Fasting-induced FFA increase after CNO-mediated inhibition of POMC neuronal activity (n = 8–13/group).
(G) Fasting-induced pgWAT mass after CNO-mediated inhibition of POMC neuronal activity (n = 8–13/group).
(H) Fasting-induced body weight change after CNO-mediated inhibition of POMC neuronal activity (n = 8–13/group).
(I) Immunoblot images and quantification of fasting-induced changes of lipolytic enzymes in pgWAT after CNO-mediated inhibition of POMC neuronal activity (n = 8/group). Phosphorylated HSL was normalized by total HSL and perilipin A was normalized by actin.
All studies were conducted in 14- to 16-week-old male POMCCre/+ mice or POMC+/+. Data are expressed as mean ± SEM. ∗p < 0.05. See also Figure S5.
Clozapine-N-oxide (CNO)-mediated activation of stimulatory DREADDs increased the number of FOS-positive cells (Figure S5C) and reduced appetite belatedly (Figure S5E). This delayed physiological effect is in line with previous observations (Koch et al., 2015). Conversely, CNO-driven induction of inhibitory DREADDs reduced FOS immunoreactivity within the ARC (Figure S5D) and increased food intake (Figure S5F). These results demonstrate the fidelity of specific POMC neuron activity manipulations using DREADD technology.
DREADD-mediated activation of POMC neurons did not impact FFA release, adiposity, or body weight after prolonged fasting when compared with controls (Figures 4B–4D). However, inhibition of POMC neurons reduced fasting-induced FFA levels with a concomitant increase in adiposity and attenuation of body weight loss (Figures 4F–4H). Consistently, HSL phosphorylation at S660 and S563, as well as perilipin A protein levels, were also reduced in pgWAT (Figure 4I). These results indicate that direct inhibition of POMC neuronal activity modulates lipolysis.
Opa1 deletion in POMC neurons leads to alterations in mitochondrial morphology and cristae ultrastructure
OPA1 plays key roles in mitochondrial fusion, respiration, and cristae maintenance (Cogliati et al., 2016; Frezza et al., 2006; Mishra et al., 2014; Patten et al., 2014). Therefore, we examined these parameters in POMCOpa1KO mice. POMC neuron-specific electron microscopy analysis showed a reduction in the density of mitochondria (Figure 5A), associated with decreased mitochondrial cellular coverage (Figure 5B) and enlarged area (Figure 5C). Mitochondria from mutant mice also displayed reduced aspect ratio, consistent with loss of a pro-fusion mitochondrial protein (Figures 5D and 5E). Interestingly, in 50% of POMC neurons almost half of the mitochondria had profoundly disrupted inner morphology and cristae shape as a consequence of OPA1 deletion (Figure 5E). These results confirm that OPA1 is essential for the maintenance of mitochondrial architecture and cristae morphology.
Figure 5.

Deletion of Opa1 in POMC neurons alters mitochondrial morphology, cristae ultrastructure, and mitochondrial function before the onset of obesity
(A–D) Mitochondrial density (A), coverage (B), area (C), and aspect ratio (AR) (D) in POMC neurons from control (n = 1,216 mitochondria, 19 neurons, 4 mice) and POMCOpa1KO (n = 367 mitochondria, 15 neurons, 4 mice) mice.
(E) Representative electron microscopy images of POMC neuron mitochondria (scale bar, 100 nm) and cumulative frequency distribution of mitochondria with disrupted inner morphology in POMC neurons from control (n = 1,216 mitochondria, 19 neurons, 4 mice) and POMCOpa1KO (n = 367 mitochondria, 15 neurons, 4 mice) mice.
(F) Mitochondrial respirometry of ARC-enriched microdissections from control (n = 5) and POMCOpa1KO mice (n = 4). x axis shows the substrates utilized (P, pyruvate; M, malate; G, glutamate; S, succinate), respiratory states, and pathways.
(G) Representative immunoblot images and densitometric quantification of archetypical proteins for complex I (Ndufb8), complex II (Sdhb), complex III (Uqcrc2), complex IV (Mtco1), and complex V (Atp5a) in ARC microdissections from control and POMCOpa1KO mice (n = 6/phenotype). Actin was used as loading control.
All studies were conducted in 5- to 6-week-old male control and POMCOpa1KO overnight fasted (16 h) mice. Data are expressed as mean ± SEM. ∗p < 0.05; ∗∗∗p < 0.001.
High-resolution respirometry in ARC-enriched samples from mutant mice showed a moderate decline in the respiratory capacity of NADH- and succinate-linked pathways (Figure 5F). Protein levels of representative subunits for each OXPHOS complex were not affected (Figure 5G), consistent with no major impairment in respiratory capacity. These results denote slightly reduced mitochondrial function despite defective mitochondrial ultrastructure in mutant mice.
OPA1 in POMC neurons connects mitochondrial Ca2+ influx with adipose tissue lipolysis
Genetic deletion of Opa1 alters mitochondrial Ca2+ management in vitro, though with divergent outputs (Fülöp et al., 2011, 2015; Kushnareva et al., 2013). Mitochondrial Ca2+ transport mainly occurs via the mitochondrial calcium uniporter (MCU) (Baughman et al., 2011; De Stefani et al., 2011). An increase in the pore subunit Mcu, but not in the regulatory subunits Micu1 and Micu2, was seen in POMCOpa1KO ARC-enriched microdissections (Figure 6A), suggesting augmented mitochondrial Ca2+ transport. To directly measure POMC neuron Ca2+ dynamics in freely moving mice, we implemented a strategy based on virogenetics and fiber photometry (Figure S6A). We generated an adeno-associated virus (AAV) containing a Cre-dependent variant of the Ca2+ sensor GCaMP6s that was targeted to the mitochondria (hereafter AAV-mtGCaMP6s). Selective expression of mtGCaMP6s in POMC neurons was achieved via AAV injection into the ARC of POMCCre/+ or POMCOpa1KO mice (Figure S6A). The expression of mtGCaMP6s was restricted to POMC neurons and exhibited a coincident mitochondrial pattern (Figures S6B–S6D), confirming specific cellular and sub-cellular targeting.
Figure 6.

Mitochondrial Ca2+ dyshomeostasis in POMC neurons from POMCOpa1KO mice underlies defective lipolysis
(A) Gene expression of MCU complex subunits in ARC microdissections from control (n = 5) and POMCOpa1KO mice (n = 11).
(B and C) Recordings of mitochondrial (B) and cytosolic (C) Ca2+ normalized fluorescence signal from POMC neurons in fasted mice. Food presentation response is marked with a dotted frame. Inset represents the area under the curve (AUC) quantification of the fluorescence increase over baseline during the acquisition period. Mitochondrial Ca2+ measurements: control (n = 6) and POMCOpa1KO (n = 8) mice. Cytosolic Ca2+ measurements: control (n = 5) and POMCOpa1KO (n = 3) mice.
(D and E) Representative mitochondrial Ca2+ fluorescence trace of POMC neurons from control and POMCOpa1KO fasted mice after i.c.v. injection of either vehicle (Veh) or Ru265.
(E) AUC quantification of the fluorescence increase over baseline during the acquisition period. n = 3/genotype.
(F) Schematic of acute i.c.v. injection setup.
(G) Fasting-induced increase of plasma FFA after vehicle (Veh) or Ru360 i.c.v. injection in control and POMCOpa1KO mice. n = 7–12 genotype/treatment.
(H and I) Representative immunoblot images (H) and densitometric quantification (I) of lipolytic markers (HSL-pS660/HSL, HSL-pS563/HSL, and perilipin/tubulin) in pgWAT from control and POMCOpa1KO mice after i.c.v. treatment with vehicle (Veh) or Ru360 (n = 4/genotype/treatment).
(J) Epinephrine and norepinephrine content in pgWAT from control and POMCOpa1KO mice after i.c.v. treatment with vehicle (Veh) or Ru360. n = 9–11/genotype/treatment.
(K) Fasting-induced increase of plasma FFA levels in control and POMCOpa1KO mice after vehicle (Veh) or Ru360 i.c.v. injection together with i.p. administration of saline (Sal) or β3-adrenergic blocker SR59230A (SR). n = 10–12/genotype/treatment.
All studies were conducted in 12- to 16-week-old male control and POMCOpa1KO mice under fed or overnight (16 h) fasting conditions. Data are expressed as mean ± SEM. ∗p < 0.05; ∗∗p < 0.01; ∗∗∗p < 0.001. ns, not significant. See also Figure S6.
Food presentation rapidly increases cytosolic Ca2+ in POMC neurons (Chen et al., 2015). Therefore, to stimulate mitochondrial Ca2+ upload, a food pellet was offered to fasted mice (Figure S6A). While control animals increased the mitochondrial Ca2+ signal in response to food presentation, mutant counterparts remained unresponsive (Figure 6B). Nevertheless, POMCOpa1KO mice preserved the ability to dynamically increase cytosolic Ca2+ (detected via AAV-GCamP7s) upon food presentation confirming a mitochondria-specific Ca2+ handling defect (Figure 6C). MCU inhibition with the selective and cell-permeable Ru265 compound (Woods and Wilson, 2020; Woods et al., 2019, 2020) blocked mitochondrial Ca2+ uptake in control mice (Figures 6D and 6E), confirming the specificity and accurate performance of the mtGCaMP6s reporter. Remarkably, MCU inhibition restored the mitochondrial Ca2+ dynamics in mutant mice (Figures 6D and 6E).
The blunted mitochondrial Ca2+ signal observed in POMCOpa1KO mice could be due to either loss of Ca2+ uptake capacity or Ca2+ overload. To disentangle this, we conducted acute intracerebroventricular (i.c.v.) injections of various structurally different MCU-specific inhibitors (Ru265, Ru360, mitoxantrone) and activators (kaempferol, SB 202190) (Figure 6F) (Arduino et al., 2017; Bermont et al., 2020; Chang et al., 2011; Kannurpatti and Biswal, 2008; Vaccaro et al., 2017; Woods et al., 2019). Strikingly, the three MCU inhibitors tested rescued fasting-induced FFA release (Figures 6G and S6E), whereas MCU activators had no effect on this parameter (Figure S6F). Collectively, these results suggest that deletion of Opa1 in POMC neurons causes a surplus of mitochondrial Ca2+ in basal conditions, thus impeding further stimulated mitochondrial Ca2+ influx.
Based on these findings, we reasoned that MCU inhibition could prevent the phenotypical alterations of POMCOpa1KO mice. Accordingly, acute Ru360 treatment restored the pgWAT lipolytic program in POMCOpa1KO mice (Figures 6H and 6I). We next investigated the involvement of the SNS in the Ru360-mediated lipolysis rescue. An acute treatment induced a partial but significant increase in catecholamine content in pgWAT from mutant mice (Figure 6J). Other factors involved in lipolysis activation, such as glucagon or corticosterone, were not affected by Ru360 treatment (data not shown). Additionally, Ru360 co-injection with the β3-adrenergic antagonist SR59230A prevented the FFA rise in POMCOpa1KO mice (Figure 6K). These results indicate that mitochondrial Ca2+ overload in POMC neurons underlies the impaired lipolysis of adipose tissue via sympathetic inputs.
Mitigation of central mitochondrial Ca2+ influx restores α-MSH transport and reverses the obesogenic phenotype of POMCOpa1KO mice
POMCOpa1KO mice exhibited reduced α-MSH staining in the PVH despite unaltered hypothalamic content and equivalent fiber density, indicating defective neuropeptide transport to target sites (Figures 2J–2N). Remarkably, i.c.v. injection of α-MSH improved fasting-induced FFA release (Figure 7A), suggesting that α-MSH mediates normalized lipolysis after Ru360 treatment. Indeed, ex vivo studies showed that Ru360 stimulated α-MSH release in both control and POMCOpa1KO hypothalamic explants (Figure 7B). We next assessed whether defective α-MSH transport in mutant mice was due to mitochondrial Ca2+ overload. A subchronic Ru360 treatment (Figure 7C) recovered α-MSH immunoreactivity in the PVH (as well as other POMC neuron target sites) of POMCOpa1KO mice (Figures 7D and 7E; data not shown). These data denote that compromised mitochondrial Ca2+ homeostasis underlies defective α-MSH transport in mutant mice, resulting in impaired lipolysis via sympathetic inputs.
Figure 7.

Central blockade of mitochondrial Ca2+ transport reverts obesity in POMCOpa1KO mice by restoring α-MSH in target areas
(A) Fasting-induced increase of plasma FFA levels after vehicle (Veh) or α-MSH i.c.v. injection in control and POMCOpa1KO mice. n = 7–8 genotype/treatment.
(B) Ex vivo measurements of α-MSH secretion in hypothalamic explants from control and POMCOpa1KO mice. The average from 12 mice per genotype pooled from 3 independent experiments is shown.
(C) Scheme depicting subchronic i.c.v. Ru360 injection setup.
(D and E) Representative immunofluorescence images (D) and integrated density quantification (E) of α-MSH staining in the PVN from control and POMCOpa1KO mice after subchronic i.c.v. injection of vehicle (Veh) or Ru360. n = 4/genotype/treatment. 3V, third ventricle. Scale bar, 100 μm.
(F–H) Body weight change (F), final body weight (G), and average daily food intake (H) after subchronic treatment with vehicle (Veh) or Ru360 in control (vehicle, n = 12; Ru360, n = 11) and POMCOpa1KO (vehicle, n = 10; Ru360, n = 10) mice.
(I) Adiposity after subchronic protocol (n = 6/genotype/treatment).
(J) Representative hematoxylin and eosin staining images of pgWAT. Scale bar, 100 μm.
(K) Adipocyte area quantification (n = 2–3/genotype/treatment).
(L) Cumulative frequency of adipocyte area distribution.
(M) Gene expression of representative markers of obesity-associated adipose tissue inflammation (Tnfa, tumor necrosis factor alpha; Lbp, lipopolysaccharide binding protein; Ccl2, chemokine [C–C motif] ligand 2; Itgax, integrin alpha X) in mice after 13 days of subchronic treatment with vehicle (Veh) or Ru360 (n = 6/genotype/treatment).
All studies were conducted in 12- to 16-week-old male control and POMCOpa1KO mice. Data are expressed as mean ± SEM. ∗p < 0.05; ∗∗p < 0.01; ∗∗∗p < 0.001.
Next, we tested whether the subchronic central Ru360 regime was able to reverse the obesogenic phenotype of POMCOpa1KO mice. While Ru360 had no effect in control mice, mutant animals gradually reduced body weight until reaching an ~20% loss at the end of the treatment (Figures 7F and 7G). Ru360 also reduced food intake (Figure 7H), adiposity (Figure 7I), and adipocyte size (Figures 7J–7L) in POMCOpa1KO mice. The obesity-related low-grade inflammation of WAT was also relieved (Figure 7M). These results show that subchronic inhibition of mitochondrial Ca2+ influx in the hypothalamus reverts the obesity traits of POMCOpa1KO mice.
Discussion
Cristae remodeling in response to energetic states has been documented for decades but considered an artifact (Hackenbrock, 1966). The discovery of cristae rearrangements during apoptosis confirmed the dynamic nature of these structures (Cogliati et al., 2016). Thus, the concept that morphological changes in cristae are relevant for cellular adaptations to metabolic demands has recently reemerged (Cogliati et al., 2013, 2016; Patten et al., 2014), yet the in vivo importance of cristae plasticity remains uncertain. We reasoned that the connection between cristae dynamics and energy status may be particularly important in cellular nutrient sensors such as POMC neurons. Our studies show that energy availability impact on cristae-remodeling responses in these neurons. The parallel reduction of Opa1 expression in POMC neurons, under similar nutritional challenges, points to OPA1 as a candidate to mediate bioenergetic adaptations to nutrient availability. The consequences of such cristae dynamism are currently unknown, but likely contribute to bioenergetic adjustments by modulating the kinetics of chemical reactions and respiratory supercomplex assembly (Cogliati et al., 2013).
Consistent with a crucial role in cristae and mitochondrial remodeling, OPA1 ablation in POMC neurons caused variations in mitochondrial dynamics toward fission and severe disruption of inner morphology and cristae architecture. These remarkable organelle impairments did not compromise cell survival (Ramírez et al., 2017). Furthermore, the mitochondrial respiratory capacity was only moderately affected and the expression of representative OXPHOS subunits was equivalent. This implies the existence of compensatory mechanisms or the ability of the remaining pool of structurally intact mitochondria to counterbalance.
Phenotypically, deletion of Opa1 in POMC neurons caused obesity due to hyperphagia and attenuated fasting-induced lipolysis. Mutant mice exhibited reduced α-MSH in neuronal projections, albeit its total hypothalamic content and expression of POMC-processing enzymes was unaltered. These results suggest defective α-MSH transport to axonal terminals. Synaptic vesicle release is an energy-demanding process that relies on adequate cellular location of mitochondria (Hollenbeck and Saxton, 2005). Anterograde mitochondrial transport to axonal terminals is modulated by matrix Ca2+ influx through the cristae-resident MCU (Vais et al., 2016). Interestingly, OPA1 likely participates in mitochondrial Ca2+ signaling since its genetic deletion in vitro impairs Ca2+ dynamics, although with divergent results (Fülöp et al., 2011, 2015; Kushnareva et al., 2013). Our in vivo fiber photometry recordings in POMC neurons and pharmacological studies indicated that loss of OPA1 increased mitochondrial Ca2+ content, thus rendering the mitochondria unresponsive to subsequent challenges. These results are coherent with in vitro and hypothalamic slices data (data not shown; Fülöp et al. 2011, 2015; Gottschalk et al., 2019; Paillard et al., 2018). In line with this, prevention of mitochondrial Ca2+ uptake via central delivery of the selective MCU inhibitor Ru360 restored α-MSH staining in relevant hypothalamic target areas. This indicates that excessive mitochondrial Ca2+ transport is the primary defect underlying altered α-MSH distribution. It is therefore likely that Ca2+ overload into the mitochondria arrests their movement along the axon, jeopardizing α-MSH synaptic vesicle release and neuronal function (Chang and Reynolds, 2006; Chang et al., 2006, 2011; Niescier et al., 2018). Consistent with a role for OPA1 in the modulation of mitochondrial Ca2+ import and mitochondrial axon motility, downregulation of OPA1 in cultured neurons reduces the abundance of mitochondria along the dendrites and causes synaptic dysfunction (Bertholet et al., 2013). These observations suggest a potential link between MCU and OPA1. Indeed, a recent proteomic analysis revealed an MCU-dependent OPA1-MICU interaction (Tomar et al., 2019).
The restoration of mitochondrial Ca2+ signaling in mutant mice, via acute central treatment with diverse MCU inhibitors, recovered the lipolytic program. The effects of Ru360 on lipolysis were paralleled, and potentially mediated, by the reestablishment of α-MSH distribution to relevant areas. This notion was further supported by the partial recovery of fasting-induced FFA release in mutant mice after i.c.v. administration of α-MSH.
Remarkably, subchronic central Ru360 administration had a robust beneficial effect on POMCOpa1KO mice. After 13 days of treatment, mutant mice reduced body weight and adiposity, with a concomitant normalization of food intake and obesity-associated inflammatory parameters in WAT. Interestingly, a recent study has reported a link between impaired mitochondrial Ca2+ handling in POMC neurons, neuronal hyperpolarization, and diet-induced obesity (Paeger et al., 2017). Together, these observations argue in favor of a crucial role of mitochondrial Ca2+ homeostasis upon POMC neuronal activity and control of energy balance.
The effects of central Ru360 are mediated by the SNS, as a β3-adrenergic blocker negates its effects on fasting-induced FFA release. WAT is innervated by sympathetic endings and fasting-associated increase in local adrenergic outflow activates lipolysis (Bartness et al., 2014; Brito et al., 2008). Interestingly, central administration of leptin reduces fat weight independently of changes in food intake (Buettner et al., 2008) and reports demonstrate direct neuro-anatomical innervation of the adipocytes that mediate the lipolytic effect of leptin (Zeng et al., 2015). Mapping of the sympathetic innervation has unveiled that the ARC, DMH, LH, and PVH are polysynaptically connected to adipose depots (Caron et al., 2018). In particular, leptin signaling in ARC neurons regulates the plasticity of sympathetic architecture in adipose tissue (Wang et al., 2020). Nevertheless, the specific neuronal populations implicated in the leptin-dependent neuro-adipose tissue axis responsible for fat mobilization have not been described to date.
Specific components of the melanocortin system are plausible candidates to mediate this communication. Our results support the notion that POMC neurons, which are targets of leptin action, may participate in the neuro-adipocyte response to starvation through lipolysis. Direct inhibition of POMC neurons via DREADD curtails the molecular lipolytic program and decreases fasting-induced lipid mobilization. Consistently, reduction of the central melanocortin tone by pharmacologic or genetic means inhibits lipolysis while promoting WAT triglyceride uptake, synthesis, and deposition (Brito et al., 2007; Nogueiras et al., 2007). Furthermore, chemogenetic activation of AgRP neurons decreases WAT pHSL levels and lipolysis (Cavalcanti-de-Albuquerque et al., 2019). Although the contribution of POMC neurons to fasting-induced lipolysis is partial, as other factors regulate this process, our results provide further understanding of the central mechanisms fine-tuning lipid metabolism.
In summary, we demonstrate that POMC neuron cristae morphology, and the expression of the principal cristae-shaping player Opa1, is influenced by energy availability. We propose a model whereby disruption of mitochondrial and/or cristae dynamics in POMC neurons leads to excessive mitochondrial Ca2+ influx, resulting in defective α-MSH transport and release. This reduced melanocortinergic tone causes hyperphagia and attenuates sympathetic fasting-induced lipolysis eventually causing obesity. Our results indicate that OPA1 in POMC neurons is a crucial mediator of bioenergetic adaptations to nutrient availability and is involved in systemic energy balance control.
Limitations of study
While this study shows that mitochondrial cristae architecture in POMC neurons remodels under different nutritional situations, we did not define the specific nutrients/hormones underlying these changes. Experiments aimed at answering this question would provide a deeper understanding of this biological process.
We report a new methodology for in vivo cell-targeted mitochondrial Ca2+ measurements. This strategy is optimum to detect mitochondrial Ca2+ fluctuations but not to quantify absolute Ca2+ content. The interpretation of our results, indicating that absence of mitochondrial Ca2+ dynamism upon stimuli was due to Ca2+ overload, was based on the combination of Ca2+ measurements and pharmacological treatments targeting the MCU. The development of genetically engineered ratiometric tools would provide direct evidence to support our conclusions.
Our findings are exclusively based on mouse data. Therefore, for a full translational significance, it would be pertinent to assess Opa1 expression in human post-mortem hypothalami under diverse pathophysiological and obesity-related conditions.
STAR★Methods
Key resources table
| REAGENT or RESOURCE | SOURCE | IDENTIFIER |
|---|---|---|
| Antibodies | ||
| Alpha-MSH | Millipore | Cat# AB5087; RRID: AB_91683 |
| Alpha-Tubulin | Sigma-Aldrich | Cat# T6199; RRID: AB_477583 |
| Alexa Fluor 594 chicken anti-mouse | ThermoFisher | Cat# A-21201; RRID: AB_2535787 |
| Alexa Fluor 488 chicken anti-rabbit | ThermoFisher | Cat# A-21441; RRID: AB_2535859 |
| Alexa Fluor 488 donkey anti-sheep | ThermoFisher | Cat# A-11015; RRID: AB_2534082 |
| Alexa Fluor 594 donkey anti-rabbit | ThermoFisher | Cat# A-21207; RRID: AB_141637 |
| Alexa Fluor 647 donkey anti-rabbit | ThermoFisher | Cat# A32795; RRID: AB_2762835 |
| Anti-mouse HRP | GE Healthcare UK Limited | Cat# NA931; RRID: AB_772210 |
| Anti-Rabbit HRP | GE Healthcare UK Limited | Cat# NA934; RRID: AB_2722659 |
| β-Actin | Sigma-Aldrich | Cat# A2066; RRID: AB_476693 |
| GFP | Aves Labs | Cat# GFP-1010; RRID: AB_2307313 |
| HA.11 | Covance | Cat# MMS-101R; RRID: AB_291262 |
| HSL-PSer563 | Cell Signaling | Cat# 4139; RRID: AB_2135495 |
| HSL-PSer660 | Cell Signaling | Cat# 4126; RRID: AB_490997 |
| HSL | Cell Signaling | Cat# 4107; RRID: AB_2296900 |
| OPA1 | BDBiosciences | Cat# 612606; RRID: AB_399888 |
| OPA1 | Novus Biologicals | Cat# NB110-55290C; RRID: AB_1851209 |
| OXPHOS Rodent Antibody Cocktail | Abcam | Cat# ab110413; RRID: AB_2629281 |
| Perilipin | Cell Signaling | Cat# 3467; RRID: AB_2167270 |
| POMC | Phoenix Pharmaceuticals | Cat# H-029-30; RRID: AB_2307442 |
| TOM20 | Santa Cruz | Cat# sc-11415; RRID: AB_2207533 |
| Bacterial and virus strains | ||
| AAV8-hSYN-DIO-hM3D(Gq)-mCherry | Addgene | Cat# 44361 |
| AAV8-hSYN-DIO-hM4D(Gi)-mCherry | Addgene | Cat# 44362 |
| pGP-Syn-FLEX-jGCaMP7s-WPRE | Addgene | Cat# 10449-AAV9 |
| pAAV-FLEX-EF1A-mtGCaMP6s-WPRE | Vector builder | This paper |
| pAAV-FLEX-tdTomato | Addgene | Cat# 28306-AAV9 |
| Chemicals, peptides, and recombinant proteins | ||
| 3-3’-Diaminobenzidine | Sigma-Aldrich | Cat# D5637 |
| Adenosine diphosphate (ADP) | Calbiochem | Cat# 117105 |
| Alpha-MSH | Sigma-Aldrich | Cat# M4135 |
| Angiotensin II | Sigma-Aldrich | Cat# A9525 |
| Antimycin A | Sigma-Aldrich | Cat# A8674 |
| Artificial cerebrospinal fluid (aCSF) | Tocris Bioscience | Cat# 3525 |
| Buffer RLT | Qiagen | Cat# 79216 |
| Carbonyl cyanide 4-(trifluoromethoxy)phenylhydrazone (FCCP) | Sigma-Aldrich | Cat# C2920 |
| Clozapine-N-oxide | Tocris | Cat# C4936 |
| Dental acrylic TAB2000™, liquid | Kerr | Cat#61775 |
| Dental acrylic TAB2000™, powder | Kerr | Cat#61771 |
| Digitonin | Sigma-Aldrich | Cat# D5628 |
| Durcupan | Electron Microscopy Sciences | Cat# 14040 |
| Dynabeads Protein G | ThermoFisher | Cat# 10004D |
| Enhanced chemiluminescence reagent | Pierce | Cat# 32105 |
| Glucose solution 40% | Fresenius Kabi | Cat# C.N 620724 |
| Glutamate | Sigma-Aldrich | Cat# G1626 |
| Glutaraldehyde solution 50 % | Panreac AppliChem | Cat# A3166 |
| Insulin | Lilly | Cat# C.N 710008.9 |
| Kaempferol | Sigma-Aldrich | Cat# 1354900 |
| Leptin | R&D | Cat# 498-OB |
| Malate | Sigma-Aldrich | Cat# M1000 |
| Melanotan II | Bachem | Cat# 4039778 |
| Mitoxantrone Hydrochloride | Sigma-Aldrich | Cat# M2305000 |
| Osmium tetroxide | Electron Microscopy Sciences | Cat# 19190 |
| Paraformaldehyde 16% | Electron Microscopy Sciences | Cat# 15710-S |
| Picric acid solution | Sigma-Aldrich | Cat# P6744 |
| Protease and Phosphatase Inhibitor Cocktail | Sigma-Aldrich | Cat# PPC1010 |
| RIPA Buffer | Sigma-Aldrich | Cat# R0278 |
| Rotenone | Sigma-Aldrich | Cat# R8875 |
| Ru265 | Dr. Justin J Wilson | N/A |
| Ru360 | MerkMillipore | Cat# 557440 |
| SB202190 | Tocris | Cat# 1264 |
| Sodium pyruvate | Sigma-Aldrich | Cat# P2256 |
| SR59230A | Tocris | Cat# 1511 |
| Succinate | Sigma-Aldrich | Cat# S2378 |
| Sucrose | Sigma-Aldrich | Cat# S0389 |
| Trizol Reagent | ThermoFisher | Cat# 15596026 |
| Uranyl acetate | Electron Microscopy Sciences | Cat# 22400 |
| Critical commercial assays | ||
| Corticosterone EIA | Immunodiagnosticsystems | Cat# AC-14F1 |
| ECL Western Blotting Substrate | Pierce | Cat# 32106 |
| Epinephrine/Norepinephrine ELISA | LDN | Cat# BA E-5400 |
| Glucocard X-meter | Arkray | Cat# GT-1910 |
| High Capacity cDNA Reverse Transcription Kit | Applied Biosystems | Cat#4368814 |
| HR Series NEFA-HR(2)-R1 | WAKO | Cat# 434-91795 |
| HR Series NEFA-HR(2)-R2 | WAKO | Cat# 436-91995 |
| Insulin ELISA | CrystalChem | Cat# 90080 |
| Leptin ELISA | CrystalChem | Cat# 90030 |
| MSH, alpha EIA | Phoenix Pharmaceuticals | Cat# EK-043-01 |
| MSH, alpha FIA | Phoenix Pharmaceuticals | Cat# FEK-043-01 |
| PreMix Ex taq | Takara | C#RR39WR |
| Quant-iT RiboGreen RNA assay kit | ThermoFisher | Cat# R1149 |
| RNeasy-plus Mini kit | Qiagen | Cat# 74134 |
| RNAscope Probe Diluent | ACD; Advanced Cell Diagnostics | Cat# 3000041 |
| RNAscope Fluorescent Multiplex Detection Reagents | ACD; Advanced Cell Diagnostics | Cat# 320851 |
| RNAscope Enhancer Fluorescent Kit v2 | ACD; Advanced Cell Diagnostics | Cat# 323100 |
| RNAscope HybEz hybridization system | Advanced Cell Diagnostics | Cat# 311720 |
| SDS-PAGE pre-cast 4%-12% gels | Bio-Rad | Cat# 345-0124 |
| Triglyceride determination kit | Sigma-Aldrich | Cat# TR0100-1KT |
| Experimental models: Organisms/strains | ||
| POMC-Cre mice | (Xu et al., 2005) | N/A |
| B6N.129-Rpl22tm1.1Psam/J mice | The Jackson Laboratory | Cat# 011029 |
| Opa1fl/fl mice | (Ramírez et al., 2017) | N/A |
| Oligonucleotides | ||
| TaqMan Acca | ThermoFisher | Mm01304277_m1 |
| TaqMan AdipoQ | ThermoFisher | Mm00456425_m1 |
| TaqMan Agrp | ThermoFisher | Mm00475829_g1 |
| TaqMan Aldh1 | ThermoFisher | Mm03048957_m1 |
| TaqMan Ccl2 | ThermoFisher | Mm00441242_m1 |
| TaqMan Cd36 | ThermoFisher | Mm00432403_m1 |
| TaqMan Cebpa | ThermoFisher | Mm00514283_s1 |
| TaqMan Dnm1 | Thermo Fisher | Mm01342903_m1 |
| TaqMan Fasn | ThermoFisher | Mm00662319_m1 |
| TaqMan Fis1 | Thermo Fisher | Mm00481580_m1 |
| TaqMan Hprt | ThermoFisher | Mm00446968_m1 |
| TaqMan Itgax | ThermoFisher | Mm00498698_m1 |
| TaqMan Lbp | ThermoFisher | Mm00493139_m1 |
| TaqMan Lipe | ThermoFisher | Mm00495359_m1 |
| TaqMan Lpl | ThermoFisher | Mm00434764_m1 |
| TaqMan Mfn1 | ThermoFisher | Mm00612599_m1 |
| TaqMan Mfn2 | ThermoFisher | Mm00500120_m1 |
| TaqMan Mcu | ThermoFisher | Mm01168773_m1 |
| TaqMan Micu1 | ThermoFisher | Mm00522783_m1 |
| TaqMan Micu2 | ThermoFisher | Mm00551312_m1 |
| TaqMan Npy | ThermoFisher | Mm00445771_m1 |
| TaqMan Opa1 | ThermoFisher | Mm00453879_m1 |
| TaqMan Pam | ThermoFisher | Mm01293044_m1 |
| TaqMan Pc1/3 | ThermoFisher | Mm00479023_m1 |
| TaqMan Pc2 | ThermoFisher | Mm00500981_m1 |
| TaqMan Pnpla2 | ThermoFisher | Mm00503040_m1 |
| TaqMan Pomc | ThermoFisher | Mm00435874_m1 |
| TaqMan Pparg | ThermoFisher | Mm00440945_m1 |
| TaqMan Scd1 | ThermoFisher | Mm01197142_m1 |
| TaqMan Th | ThermoFisher | Mm00447557_m1 |
| TaqMan Tnfa | ThermoFisher | Mm00443258_m1 |
| RNAscope probe Mm-Pomc | ACD; Advanced Cell Diagnostics | Cat# 314081 |
| RNAscope probe Mm-Opa1-O1-C3 | ACD; Advanced Cell Diagnostics | Cat# 836341-C3 |
| Software and algorithms | ||
| Doric Neuroscience Studio | Doric Lenses | https://neuro.doriclenses.com/products/doric-neuroscience-studio |
| ImageJ software | NIH, Open source | https://imagej-nih-gov.sire.ub.edu/ij/ |
| MATLAB | MATLAB | https://es.mathworks.com/products/matlab-online.html |
| Prism | Graphpad Software | https://www.graphpad.com/scientific-software/prism/ |
| Other | ||
| Fiber photometry console | Doric Lenses | Cat# FPC |
| Glucometer | Arkray | Cat# GT-1910 |
| Guide cannula | Bilaney Consultants GmbH | Cat# C315G/Spc |
| Standard diet | Envigo Laboratories | Cat# #2014 |
| High fat diet 45% Kcal from fat | Research Diets | Cat# D12451 |
| ImmEdge hydrophobic barrier pen | Vector laboratories | Cat# 1047002 |
| Internal Cannula | Bilaney Consultants GmbH | Cat# C315I/Spc |
| Microvette CB-300 | Sarstedt | Cat# NC9141704 |
| Hamilton 5 μL, Neuros Model 75 RN, point style 3, SYR | Hamilton | Cat#65460-02 |
| Optic fiber | Newdoon Technology | N/A |
| ProLong Gold Antifade Mountant | Thermo Fisher | Cat# 10417002 |
| SuperFrost Plus microscope slides | Thermo Fisher | Cat# 322000 |
| Vetbond | 3M | Cat# 1469SB |
Resource availability
Lead contact
Further information and requests for resources and reagents should be directed to and will be fulfilled by the Lead Contact, M.C. (mclaret@clinic.cat).
Materials availability
Plasmids generated in this study are available on reasonable request.
Data and code availability
-
•
The data generated in this study will be shared by the lead contact upon reasonable request.
-
•
This study did not generate new code.
-
•
Any additional information required to reanalyze the data reported in this paper is available from the lead contact upon request.
Experimental model and subject details
Mice and diets
The generation of POMCOpa1KO and POMCRiboTag mice has been previously reported (Haddad-Tóvolli et al., 2020; Ramírez et al., 2017). Briefly, POMCCre/+ mice (Xu et al., 2005) were intercrossed with either Opa1 (Ramírez et al., 2017) or with Rpl22lsl-HA floxed mice (Sanz et al., 2009) on a C57BL/6J background. Colonies were maintained in-house by breeding POMCCre/+; loxp/loxp mice with loxp/loxp mice, and littermate controls were used for the experiments. Mice were maintained at 20-24°C on a 12:12 h light-dark cycle with free access to water and standard chow diet (Envigo Laboratories #2014) or HFD (45% kcal fat; Research Diets #D12451). Health status of the mice were checked regularly. The age and number of mice analyzed for each experiment is detailed in the figure legends. All in vivo studies were performed with approval of the University of Barcelona Ethics Committee, complying with current Spanish and European legislation.
Method details
BXD data analysis
Data used for correlation studies were obtained and analyzed using the GeneNetwork web service (http://www.genenetwork.org/). The selected sets of phenotypical traits corresponded to determinations of body weight gain (between 4 and 20 weeks of age), gonadal fat, glycaemia and food intake from female and male samples fed with high-fat diet. Opa1 expression data was selected from the INIA Hypothalamus Exon Affy MoGene 1.0 ST (GSE36674) dataset via GeneNetwork website. The strength of the linear association between the mentioned phenotypes and the top-ranked Opa1 exon expression data across available BXD strains was measured using the Pearson correlation. The results obtained were visualized using the "ggplot2", "RColorBrewer", "ggrepel", “gridExtra”, and “ggpubr” packages (https://www.bioconductor.org/).
Physiological tests
Blood glucose was measured using a Glucometer (Arkray). Glucose tolerance tests were performed in overnight (16 h) fasted mice by intraperitoneal (i.p.) injection of a D-glucose bolus (2 g/kg). Insulin sensitivity tests were performed on 6h food deprived mice by i.p. injection of insulin (0.4 IU/kg). Blood glucose was determined at 0, 15, 30, 60 and 120 min post-injection. Blood samples were collected via tail vein or trunk bleeds using a capillary collection system with EDTA (Sarstedt) and subsequently centrifuged (3,600 rpm, 20 min at 4°C) to obtain plasma. Hormones were measured by commercially available ELISA kits: insulin (Crystalchem), leptin (Crystalchem), corticosterone (Immuno Diagnostic Systems) and epinephrine/norepinephrine (Labor Diagnostika Nord). For the extraction of catecholamines, tissues were digested in 0.01 N HCl-0.3 mg/ml ascorbic acid buffer using a homogenizer. Samples were centrifuged at 6,000 rpm for 20 min at 4°C and supernatants taken for analysis. Plasma FFA were measured using the quantitative enzymatic determination FFA kit (WAKO). Hepatic triglycerides were quantified using a TAG kit (Sigma), in 3 mol/l KOH, 65% ethanol extracts, based on the method of Salmon and Flatt for liver saponification.
Body composition and indirect calorimetry
Whole-body composition was measured using NMR imaging (EchoMRI). Indirect calorimetry was assessed using a TSE LabMaster modular research platform (TSE Systems) as previously described (Schneeberger et al., 2013). Briefly, mice were acclimated to the test chambers for 48 h and then were monitored for the same period of time. Data collected from the last 48 h was used to calculate all parameters for which results are reported.
MTII and leptin sensitivity tests
Mice were singly housed 1 week prior to studies and were acclimatized to handling and sham injections for 3 days. Tests were conducted in a cross-over fashion. Twelve-week-old control and POMCOpa1KO mice were i.p. injected with either 1.5 mg/g of mouse leptin (R&D Systems) or vehicle twice a day (1 h before lights out at 7 p.m. and at 8.00 a.m.) for 3 consecutive days. Six-week-old control and POMCOpa1KO mice were submitted to an acute leptin test to ensure similar body weights during the protocol. I.p. administration of either 5 mg/g of leptin (R&D Systems) or vehicle 1 h before lights-out was performed. Food intake and body weights were recorded daily. For the MTII test, overnight (16 h) fasted mice were i.p. injected with either 50 μg MTII (Bachem) or vehicle 2 h after lights on. Food was provided and remaining food measured at the indicated time points.
I.c.v. cannulation and treatments
Third ventricle i.c.v. surgery was carried out in 10-week-old male POMCOpa1KO mice and littermate controls. Mice were anaesthetized with a Ketamine/Xylazine cocktail, received Buprenorphine (i.p. 0.3 mg/Kg) and were positioned in a stereotaxic frame (Kopf Instruments). The skull was exposed and a 26-gauge stainless steel guide cannula (Bilaney Consultants GmbH) was implanted into the third ventricle (midline 0 mm, 0.82 mm posterior from Bregma, depth 4.8mm from skull surface). The cannula was secured to the skull with screws and VetBond tissue adhesive (3M™). After surgery, the mice were singly-housed and given at least 1 week to recover. Prior to the study, cannula placement was verified by a positive dipsogenic response to angiotensin II (1 nmol in 1 μl; Sigma-Aldrich). On experimental days, body weight and blood sample under random fed conditions were taken immediately before the i.c.v. procedure. Mice were infused with 2 μl of vehicle (artificial cerebrospinal fluid; Tocris Bioscience or Ethanol; MerckMillipore), α-MSH (1 nmol/μl; Sigma-Aldrich), Ru360 (0.25 nmol/μl; MerckMillipore), Ru265 (0.25 nmol/μl; kindly provided by Dr. Justin J Wilson, Cornell University, New York), Mitoxantrone Hydrochloride (2 μg/μl, Sigma-Aldrich), SB202190 (1 nmol/μl; Tocris), or Kaempferol (1 nmol/μl; Sigma-Aldrich) two hours before lights off, and immediately subjected to 16 h fasting. I.c.v. injections were performed using a 30-gauge internal cannula that extended 0.5 mm below the guide cannula (Bilaney Consultants GmbH), connected to a 5 ml Hamilton syringe and infused over 1 min. Next morning, body weight and blood sample was taken 2 h after lights-on. On tissue harvesting days, i.c.v. injection was repeated (2 h after lights-on) and tissues were harvested 2 h later. For sub-chronic treatments, i.c.v. procedure, body weight and food intake were monitored daily 2 h after lights on. To analyze sympathetic outflow, SR59230A (2 mg/Kg; Tocris) was administered i.p. just before i.c.v. treatment.
In experiments where fiber photometry was complemented with pharmacological treatments, a cannula into the lateral ventricle was implanted in the same surgical procedure as viral infection and fiber optic cannula implantation (see below). Briefly, the skull was exposed and a 26-gauge stainless steel guide cannula (Bilaney Consultants GmbH) was implanted into the lateral ventricle (Bregma: AP:-0.5mm, L:-1.5mm, DV:-2.2mm from skull surface). Animals were individualized and given at least 1 week to recover. Cannula placement was confirmed as described above. On experimental days, 4μL of Ru265 (0.25 nmol/μl) was injected as described above. Thirty min after lateral ventricle injection, mice were connected to the fiber photometry apparatus and recordings started.
Viral constructs and injections
Eight to twelve-week-old male mice were anesthetized with a Ketamine/Xylazine cocktail (i.p., 100 mg/Kg and 10 mg/Kg), received Buprenorphine (i.p., 0.3 mg/Kg) and were placed in a stereotaxic frame (Kopf Instruments) for subsequent adeno-associated virus (AAV) injection into the ARC. Virus (250 to 500 nL/injection site) were administered using a 33-gauge needle connected to a 5 μl syringe (Neuro-Syringe, Hamilton) at 50 nL/min according to the following coordinates: 1.5 mm posterior to the Bregma, ± 0.3 mm lateral to midline, and 5.8 mm below the surface of the skull. Before needle retraction, an 8-min time lapse was allowed. After the procedure, the incision was sutured by VetBond tissue adhesive (3M) and mice were placed in a heated cage until they recovered from anesthesia. Experiments were conducted at least 3 weeks after injections to ensure AAV expression.
For chemogenetic experiments, Designer Receptors Exclusively Activated by Designer Drugs (DREADDs) viruses were injected bilaterally (300-400 nl/side). Constructs for hSYN-DIO-hM3D(Gq)-mCherry and hSYN-DIO-hM4D(Gi)-mCherry (Addgene) were packaged into AAV serotype 8 and produced at UPV-CBATEG (Barcelona). Viral concentrations were 7.53x10¹² gc/mL for AAV8-hSYN-DIO-hM3D(Gq)-mCherry and 1.10x10¹³ gc/mL for AAV8-hSYN-DIO-hM4D(Gi)-mCherry.
For fiber photometry experiments, genetically encoded calcium indicators were unilaterally injected into the ARC. For cytosolic calcium detection, the pGP-Syn-FLEX-jGCaMP7s-WPRE construct (Addgene; 2.1x10¹³ gc/mL) was packaged into AAV serotype 9 and produced at UPV-CBATEG (Barcelona). For mitochondrial calcium detection, the expression of the calcium sensor GCaMP6s was targeted to the mitochondria by adding the mitochondrial targeting sequence cytochrome oxidase subunit 8A (COX8A) at the N-terminus (pAAV-FLEX-EF1A-mtGCaMP6s-WPRE; VectorBuilder; 2.06x10¹³ gc/mL). This construct was custom designed and packaged into AAV serotype 9 and produced at the VectorBuilder platform.
To visualize POMC neuron fibers in the PVH, the pAAV-FLEX-tdTomato construct was packed into AAV serotype 9 (Addgene; 2.1x10¹³ gc/mL) and injected bilaterally into the ARC.
Chemogenetic studies
For food intake measurements, each animal was singly housed and injected i.p. with saline for 5 consecutive days, twice a day (9.00 a.m. and 6.00 p.m.), to obtain basal values. Next, mice were injected with CNO (1.5 mg/Kg; Tocris) using the same time schedule. Food pellets were weighed at injection time points. To investigate the satiating effect of the DREADD-mediated activation of POMC neurons, food intake was calculated during the dark phase. Stimulation of food intake by DREADD-induced inhibition of POMC neurons was measured during the light phase.
For FFA measurements, saline or CNO (3 mg/Kg/day) was administered i.p. for 3 consecutive days at 9.00 a.m. On the fourth day, CNO (1.5 mg/Kg) was injected twice (at 9.00 a.m. and at 6.00 p.m.). A blood sample (basal) was obtained from the tip of the tail just before the second injection. Mice were fasted overnight and a blood sample (fasted) was taken at 9.00 a.m. of the fifth day. FFA’s were measured in both samples using a kit from WAKO. Afterwards, mice were injected with CNO (1.5 mg/Kg) and tissues harvested at 6.00 p.m.
In vivo fiber photometry and analysis
Optic fiber implantation was performed immediately after viral infection, during the same surgical procedure. Optical fibers (fiber core = 400 μm; 0.5 NA; 1.25 mmØ metal ferrule; Newdoon Technology) were implanted unilaterally over the ARC (Bregma: AP: -1.5 mm, L:+0.3 mm, DV:5.7 mm from skull surface). Optical fibers were fixed to the skull with dental acrylic (Kerr). Experiments were performed at least 3 weeks after surgery to allow for recovery and viral expression.
Animals were acclimated for 3 days before the experimental day by tethering them to the fiber patch cord and allowing them to explore the experimental home cage during 15 min. Photometry measurements were performed in overnight (16 h) fasted mice around ZT4. Recordings consisted of 10 min baseline measurements followed by food presentation and 10 min post-stimulus recordings.
Excitation blue (470 nm) and purple (405 nm) LED lights were modulated at different frequencies (211 Hz and 511 Hz, respectively) from a 2-channel LED Driver (LEDD_2; Doric Lenses) and sent to a Fluorescence Mini Cube (FMC4_AE(405)_E(460-490)_F(500-550)_S; Doric Lenses) before connecting to low autofluorescence optical fibers patchcords (MFP_400/430/LWMJ-0.48_1m_FCM-FCM_T0.05; Doric Lenses) through a pigtailed rotary joint (FRJ_1x1_PT_400/430/LWMJ-0.57_1m_FCM_0.06m_FCM; Doric Lenses), to allow for free movement of the mice. 470 nm (Ca2+-dependent) and 405nm (isosbestic reference fluorescence) signals were collected through the same optic fiber cable back to the MiniCube, where a dichroic mirror separates the excitation light from the fluorescence emission and direct to a photoreceiver module. Digital signal was amplified and demodulated using a lock-in detection algorithm. Data was collected via the Doric Neuroscience Studio Software (Doric Lenses), exported and analyzed using a custom-built MatLab script. Briefly: the 470 and 405 nm signals were processed and normalized to baseline signals independently to define ΔF/F (F-Fbaseline)/Fbaseline). Fbaseline was the mean of the fluorescence detected during the pre-stimulus period. Isosbestic ΔF/F was subtracted from the 470 nm ΔF/F. Data were down-sampled to 1 Hz in MATLAB.
Pituitary and adrenal gland immunohistochemistry
Pituitaries and adrenals were obtained from 4% paraformaldehyde (PFA)-perfused mice, fixed overnight and maintained in 70% ethanol until paraffin inclusion. Three μm sections of each tissue from control and POMCOpa1KO mice were mounted in parallel on the same slide and stained with Haematoxylin-Eosin following conventional protocols. Organs were fully sectioned and the largest central sections used for area measurements. For immunohistochemistry, antigen retrieval was performed with PT-link (DAKO) in high (TE) or low (BC) pH solution and Envision kit (DAKO) for blocking. Sections were incubated with: monoclonal anti-ACTH antibody (1:3,000, DAKO), anti-GH (1:3,000), anti-PRL (1:500), anti-TSH (1:200), anti-LH (1:10,000) and anti-FSH (1:3,000) antibodies from the National Institute of Diabetes and Digestive and Kidney diseases. Afterwards, slides were counterstained with Mayer Hematoxylin diluted 1:2. Sections were mounted and photographed with a BX43F microscope (Olympus) equipped with an XC50 camera. Areas were measured with ImageJ2 v1.52e.
Adipose tissue immunohistochemistry
pgWAT from control and mutant mice were fixed in formalin 10% overnight at 4°C, embedded in paraffin and cut into 4 μm-thick sections. Hematoxylin-Eosin staining was performed using conventional protocols. Images were taken using an Olympus BX41 microscope and analyzed by ImageJ.
Brain immunohistochemistry and quantification
Overnight (16 h) fasted mice were transcardially perfused with 4% PFA, overnight fixed, cryoprotected in 30% sucrose, and frozen. Brains were cut into 30-μm-thick slices using a cryostat.
For α-MSH immunodetection, hypothalamic slices containing PVH, LH, DMH and VMH (one every four sections) were extensively washed in KPBS buffer and blocked in 2% donkey serum in KPBS plus 0.4% Triton X-100. Sections were incubated with sheep anti-α-MSH antibody (1:10,000; Millipore) in blocking buffer for 48 h at 4°C. After washing with KPBS, slices were incubated with donkey anti sheep Alexa 488 antibody (1:300; Life Technologies) for 1 h at room temperature. Images were taken using a Leica DMI 4000B confocal microscope equipped with a 20x objective (numerical aperture 0.70). For each section, ten image stacks with 1μm distance interval were taken. α-MSH integrated density after image skeletonization of the max Z-stack exposure was calculated using ImageJ FIJI (NIH) software.
For double HA and POMC immunodetection, hypothalamic slices containing ARC were extensively washed in KPBS buffer and blocked in 2% chicken serum in KPBS plus 0.4% Triton X-100. Sections were incubated with mouse anti-HA antibody (1:2,000; Covance) in blocking buffer for 48 h at 4°C. After washing with KPBS, slices were incubated with chicken anti-mouse Alexa 594 antibody (1:400; Life Technologies) 1 h at room temperature. After washing with KPBS, slices were further blocked with 2% chicken serum in KPBS plus 0.4% Triton X-100 and incubated with rabbit anti-POMC Precursor (27-52) (1:1,000; Phoenix Pharmaceuticals) in blocking solution for 48 h at 4°C. After washing with KPBS, slices were incubated with chicken anti rabbit Alexa 488 antibody (1:400; Life Technologies) for 1 h at room temperature. Images were taken using a Leica DMI 6000B microscope equipped with a 20x objective and analyzed using ImageJ.
For double OPA1 and POMC immunodetection, hypothalamic slices containing ARC were extensively washed in KPBS buffer and blocked in 10% donkey serum in KPBS plus 1% Triton X-100. Sections were incubated with rabbit anti-OPA1 antibody (1:100; Novus Biologicals) in blocking buffer for 1 h at room temperature plus 48 h at 4°C. After washing with KPBS, slices were incubated with donkey anti-rabbit Alexa 594 antibody (1:300; Life Technologies) for 2 h at room temperature. After washing with KPBS, slices were further blocked with 2% chicken serum in KPBS plus 0.4% Triton X-100 and incubated with rabbit anti-POMC Precursor (27-52) (1:1,000; Phoenix Pharmaceuticals) in blocking solution for 1 h at room temperature plus 24 h at 4°C. After washing with KPBS, slices were incubated with chicken anti-rabbit Alexa 488 antibody (1:400; Life Technologies) for 1 h at room temperature. Images were taken using a Leica DMI 4000B confocal microscope equipped with a 63x objective with an optical aperture of 1 airy unit. For each section, image stacks with 2μm distance interval were taken. The same settings (objective, zoom, laser power, gain) were used to acquire images along the experiment. Quantification of OPA1 in POMC neurons was performed bilaterally in stacks from equivalent sections of the ARC. OPA1 staining particles in POMC positive area around nuclei was quantified using ImageJ FIJI (NIH) software. The threshold to consider OPA1 staining as positive was set at +3x SD of the staining in negative antibody controls. Representative images shown are single stacks equally adjusted for brightness and contrast.
To validate specific mitochondrial expression of the mtGCaMP6s Ca2+ sensor in POMC neurons, GFP immunodetection was performed followed by either TOM20 or POMC double immunodetection, respectively, as follows: hypothalamic slices containing ARC were extensively washed in KPBS buffer and blocked in 2% chicken serum in KPBS plus 0.4% Triton X-100. Sections were incubated with rabbit anti-GFP antibody (1:200; Aves Labs) in blocking buffer for 1 h at room temperature followed by 24 h at 4°C. After washing with KPBS, slices were incubated with chicken anti-rabbit Alexa 488 antibody (1:200; Life Technologies) for 1 h at room temperature. After washing with KPBS, slices were further blocked with 2% donkey serum in KPBS plus 0.4% Triton X-100 and incubated with rabbit anti-POMC Precursor (27-52) (1:1,000; Phoenix Pharmaceuticals) or rabbit anti-Tom20 (1:200; Santa Cruz) in blocking solution for 1 h at room temperature plus 48h at 4°C. Slices were washed with KPBS and incubated for 2 h at room temperature with either donkey anti rabbit Alexa 647 antibody (1:200; Life Technologies) to visualize POMC, or donkey anti rabbit Alexa 594 antibody (1:200; Life Technologies) to visualize TOM20. Images were taken using a Leica DMI 4000B confocal microscope equipped with a 63x objective plus 1.5x zoom and optical aperture of 1 airy unit. For each section, image stacks with 2μm distance interval were taken. The representative images shown are maximum intensity projections made in FIJI (NIH) equally adjusted for brightness and contrast.
Fluorescent in situ hybridization and quantification
Animals were transcardially perfused with saline followed by ice-cold 4% phosphate-buffered PFA (pH 7.4). Brains were dissected and post-fixed in 4% PFA at 4°C for 24 h, and cryoprotected in 30% sucrose in 1x phosphate buffered saline (PBS, pH 7.4). Brains were cut into 30-μm-thick slices using a cryostat, mounted in SuperFrost Plus (Thermo Scientific) microscope slides in four equal series, and subsequently stored at -80°C to preserve RNA until further processing.
Fluorescent in situ hybridization for the simultaneous detection of the Opa1 and Pomc transcripts was performed using RNAscope Multiplex Detection Reagents (ACD; Advanced Cell Diagnostics, Hayward, CA). The Opa1 probe was custom made and contained 10 oligo pairs targeting exons 5-10 (GenBank: NM_133752). The Pomc probe contained 10 oligo pairs and targeted region 19-995 (GenBank: NM_008895.3) of the Pomc transcript. The in situ hybridization protocol was performed following the online protocol for RNAscope (ACD) with minimal modifications. Briefly: slides were washed in PBS, baked at 60°C for 30 min and post-fixed with 4% PFA for 15 min. Sections were then dehydrated, baked for 30 min at 60°C and subsequently submerged into boiling (98.5 - 100°C) Target Retrieval reagent for 5 min, followed by two brief rinses in RNAse free water. The slices were quickly dehydrated in 100% ethanol and allowed to air-dry before outlining a barrier around brain slices with an ImmEdge hydrophobic pen (Vector laboratories). When dry, Protease III (ACD) treatment was performed for 30 min at 40°C. The subsequent steps, i.e., hybridization of the probes and the amplification and detection, were performed according to the manufacturer’s protocol for RNAscope: Opa1 probe (channel 3) and Pomc probe (channel 1) were mixed 500:1 and hybridized to the sections for 2 h at 40°C, followed by 2x2 min washes in washing buffer (ACD), incubation with Amp1-FL for 30 min at 40°C, two washes, Amp2-FL for 15 min at 40°C, two washes, Amp3-FL for 30 min at 40°C and finally Amp4-FL for 15 min at 40°C followed by two washes. Sections were then counterstained with DAPI for 30 seconds and immediately coverslipped with ProLong Gold Antifade Mountant (ThermoFisher) and stored in the dark at 4°C until imaging.
Images were taken using a Leica DMI 4000B confocal microscope equipped with a 63x objective with an optical aperture of 1 airy unit. For each section, 10 image stacks with 1μm distance interval were taken. The same settings (objective, zoom, laser power, gain) were used to acquire images along the experiment. Quantification of Opa1 in POMC neurons was performed bilaterally from equivalent sections of the ARC. Opa1 staining particles in Pomc positive area around nuclei was quantified in maximum intensity projections using ImageJ FIJI (NIH) software. The threshold to consider Opa1 staining as positive was set at +3x SD of the staining in negative controls of equivalent sections from control and mutant mice. The representative images shown are single stacks equally adjusted for brightness and contrast.
POMC neuron projection visualization and quantification
Three weeks after AAV-FLEX-tdTomato infection, overnight (16 h) fasted mice were transcardially perfused with 4% PFA. Brains were isolated, overnight fixed, cryoprotected in 30% sucrose, and frozen. Brains were cut into 30-μm-thick slices using a cryostat. TOMATO fluorescence in PVH was analyzed using an Olympus BX41 microscope and analyzed by ImageJ.
Hypothalamic α-MSH content
Hypothalami from overnight fasted (16 h) mice were harvested and immediately frozen in liquid nitrogen. On the day of the analysis, hypothalami were sonicated in 500 μl of 0.1N HCl solution. Lysates were centrifuged and supernatants used for α-MSH quantification by ELISA (Phoenix Pharmaceuticals). Protein concentration was determined by Bradford.
Electron microscopy and mitochondrial analysis
Mice were transcardially perfused with 0.9% saline with heparine followed by fixative solution (PFA 4%, glutaraldehyde 0.1%, picric acid 15% in phosphate buffer (PB) 0.1 M, pH=7.4). Brains were removed and fixed overnight at 4°C with the same fixative without glutaraldehyde. Brains were washed vigorously with ice-cold PB 0.1 M, and sliced at 50 μm in a vibratome. Sections containing the ARC were stained for POMC (1:4,000; 48 h at 4°C with gentle shaking; Phoenix Pharmaceuticals). After extensive washes, slices were incubated with secondary antibody, then with ABC and finally developed using 3,3’-Diaminobenzidine. After developing, slices were placed in osmium tetroxide (1%, 15 min) and then dehydrated in an ethanol gradient. Uranyl acetate (1%) was added to 70% ethanol to enhance ultrastructural contrast. Slices were then embedded in Durcupan, cut in an ultra-microtome and collected in grids for posterior analyzes. A Tecnai 12 Biotwin electron microscope was used to visualize the ultrastructure of the samples, and POMC neurons were imaged at 2,900X magnification for posterior offline analyzes.
For mitochondria architecture analyzes, random sections of POMC neurons cut throughout the middle of the cell body were analyzed. Most of these sections contained the nucleus. ImageJ software was used to manually outline each individual mitochondrion in the digital images. All samples were checked twice for consistency of mitochondria labeling. We used mitochondria cross-sectional area as a measurement of mitochondria size, and mitochondria aspect ratio (AR = major axis/minor axis) as an index of mitochondria shape. Mitochondria density was estimated by dividing the number of mitochondria profiles by the cell area. Mitochondria coverage was estimated by dividing the total area of mitochondria (sum of all mitochondria profiles in a given cell) by the cytosol area.
For mitochondria ultrastructure analysis, mitochondria with visible inner structure and with similar size and morphology across experimental groups were analyzed (Figure S1A; step 1). For visualization purposes image enhancement was carried out (Figure S1A; step 2). For each mitochondrion, cristae length was manually outlined (Figure S1A; step 3) and quantified using ImageJ. All samples were checked twice for consistency of mitochondria labeling.
High-resolution respirometry
Mitochondrial function was estimated as oxygen consumption by high-resolution respirometry (Oxygraph-2k, Oroboros Instruments). Briefly, fresh hypothalamic ARC-enriched microdissections were obtained and mechanically homogenized and permeabilized (with digitonin) in cold respiration media (0.5 mM EGTA, 3 mM MgCl2, 60 mM K-lactobionate, 20 mM taurine, 10 mM KH2PO4, 20 mM HEPES, 110 mM sucrose and 0.1% [w/v] bovine serum albumin [pH 7.1]). The tissue homogenate was added to a 2 ml chamber to assess oxygen flux. Leak respiration was measured by adding malate (2 mM) and pyruvate (10 mM), in the absence of ADP. The contribution of the NADH-derived pathway to oxidative phosphorylation was measured by the addition of ADP (5 mM, Oxphos I). Subsequently, glutamate (20 mM) and succinate (10 mM) were added to assess ADP-stimulated respiration when NADH and succinate-linked pathways are simultaneously transferring electrons to the Q junction (Oxphos I+II). Next, Trifluoromethoxy carbonylcyanide phenylhydrazone (FCCP; 1 μM) was titrated to achieve maximum flux through the electron transfer system (ETS I+II) under this experimental condition. Finally, respiration was inhibited by the sequential addition of rotenone (0.1 μM) and antimycin A (2.5 μM). The remaining O2 flux after inhibition with antimycin A (O2 flux independent of the electron transfer system) was subtracted to calculate the different respiratory states. Oxygen flux values are expressed relative to protein content determined by the Bradford method.
POMC neuron-enriched ribosome-associated mRNA isolation
ARC-enriched microdissections were ice-cold homogenized in 0.25 ml homogenization buffer (50 mM Tris, 100 mM KCl, 12 mM MgCl2, 1% Nonidet P-40, 1 mM DTT, 200 U/mL Promega RNasin, 1 mg/mL heparin, 100 μg/mL cycloheximide, Sigma protease inhibitor mixture at pH 7.5). After clearing, 20 μL was separated as input and stored at -80°C until further processing. 2 μl of mouse monoclonal anti-HA antibody (HA.11, ascites fluid; Covance) was added to the remaining homogenate and allowed to rotate for 2 h at 4°C. After incubation, 200 μl of Dynabeads protein G magnetic beads (Invitrogen) was added and incubated for 2h at 4°C with rotation. Immunoprecipitates (IPs) were washed 3 times for 10 min with gentle rotation at 4°C in high-salt buffer (50 mM Tris, 300 mM KCl, 12 mM MgCl2, 1% Nonidet P-40, 1 mM DTT, 100 μg/mL cycloheximide at pH 7.5). After final wash, samples were placed in a magnet on ice and Qiagen RLT buffer was added to the remaining pellets and input samples. Total RNA was prepared according to manufacturer’s instructions using the RNeasy-plus Mini kit (Qiagen) and quantified with the Quant-iT RiboGreen RNA assay kit (Invitrogen). RNA integrity was assessed on a 2100 Bioanalyzer device (Agilent Technologies) using the RNA 6000 Pico kit (Agilent Technologies).
Ex vivo α-MSH secretion
Male 12 to 14 week-old mice were sacrificed by cervical dislocation and the brain immediately isolated and submerged in fresh cold cutting solution (126 mM NaCl, 10 mM HEPES, 6 mM KCl, 1.4 mM CaCl2, 0.09 mM MgSO4, 5 mM glucose, 0.18 mg/mL ascorbic acid). A 2 mm coronal slice of the brain containing ARC and PVH was obtained with a brain matrix. Immediately, a 2 mm-thick block of the mediobasal hypothalamus (including the ARC and PVH) was cut from the rest of the brain using a vibrotome. After 1 h equilibration at 37°C in a cutting solution bath, hypothalami were incubated for 45 min in 200 μL Basal Solution (126 mM NaCl, 10 mM HEPES, 6 mM KCl, 1.4 mM CaCl2, 0.09 mM MgSO4, 5 mM glucose, 0.18 mg/mL ascorbic acid, 100 μg/mL leupeptin), followed by 45 min in 200 μL Basal Solution + Ru360 (10 μM). Finally, tissue viability was verified by exposure to 56 mM KCl for 45 min (KCl was increased from 6 mM to 56 mM, and NaCl was reduced from 126 mM to 76 mM to maintain tonicity). At the end of each incubation period, supernatants were collected and frozen immediately. α-MSH peptide concentration in the media was assessed using an α-MSH fluorescent immunoassay kit (Phoenix Pharmaceuticals) according to the manufacture’s protocol.
qRT-PCR
Tissues were harvested and immediately frozen in liquid nitrogen. Total RNA was isolated using Trizol and retrotranscription performed with reagents from Applied Biosystems following conventional protocols. Transcript levels were measured by qPCR using the ABI Prism 7900 HT system (Applied Biosystems). The proprietary TaqMan Gene Expression assay FAM/TAMRA primers used (Applied Biosystems) are listed in the Key Resources Table. Hprt was used to adjust for total RNA content.
Western blot analysis
Protein lysates were prepared from pulverized pgWAT samples, ARC-enriched microdissections or pituitaries in RIPA buffer (Sigma-Aldrich) supplemented with protease and phosphatase inhibitors. Cleared supernatants were resolved on pre-cast gradient 4%-12% SDS-PAGE gels (Bio-Rad), transferred onto PVDF membranes (Millipore), and probed with the following primary antibodies: Actin (1:1,000, Sigma-Aldrich), HSL, HSL-PSer660 and HSL-PSer563 (1:1,000, Cell Signaling Technology); MitoProfile Total OXPHOS Rodent WB Antibody Cocktail (1:1,000, AbCam); OPA1 (1:1,000, BD Bioscience); Perilipin A (1:1,000, Cell Signaling Technology); alpha-tubulin (1:1,000; Sigma-Aldrich). Detection was performed by enhanced chemiluminescence (Pierce). Analysis of different phosphorylation sites was conducted by immunoblotting two replicate set of samples in parallel and confirming matched loading controls. Band intensities were quantified using the ImageJ software. Expression of phosphorylated proteins were normalized against the total protein homologue content, while non-phosphorylated proteins were normalized against loading control (Tubulin or Actin).
Quantification and statistical analysis
Data are expressed as mean ± SEM. P values were calculated using two-tailed unpaired Student’s t-test when two independent groups were compared. For multiple groups comparisons, two-way ANOVA or one-way ANOVA were applied (correcting for multiple comparisons by controlling the False Discovery Rate using the method of Benjamini, Krieger and Yekutieli). Graphpad software (Prism) was used for statistical analysis. P < 0.05 was considered statistically significant. Statistical parameters can be found in the Figures & Figure legends. No statistical methods were used to determine whether the data met assumptions of the statistical approach.
Acknowledgments
We thank Servier Medical Art for illustrations. We are grateful to Justin J. Wilson and Nick Bigham (Cornell University) for providing Ru265 and Elisenda Sanz (Universitat Autonònoma de Barcelona) for assistance with RiboTag protocols. This work was supported by Agencia Estatal de Investigación y Fondo Social Europeo, Proyecto BFU2016-76973-R FEDER (C.V.A.); AG052005, AG052986, AG051459, DK111178 from NIH and NKFI-KKP-126998 from Hungarian National Research, Development and Innovation Office (T.L.H.); MR/P009824/2 from Medical Research Council UK (G.D.); and Ayudas Fundación BBVA a Investigadores y Creadores Culturales (2015), European Research Council (ERC) under the European Union’s Horizon 2020 Research And Innovation Program (grant agreement 725004) and CERCA Programme/Generalitat de Catalunya (M.C.). A.O. is supported by a Miguel Servet contract (CP19/00083) from Instituto de Salud Carlos III and co-financed by FEDER. This work was carried out in part at the Esther Koplowitz Centre.
Author contributions
Conceptualization, A.G.G.-V. and M.C.; methodology, A.G.G.-V. and M.C.; formal analysis, A.G.G.-V., M.P., L.V., M.B.B., E.E., J.A., J.R.-R., and M.C.; investigation, A.G.G.-V., M.P., L.V., S.R., I.C., R.H.-T., A.O., M.M.-G., M.S., M.I., A.R.G.-R., P.G.-P., P.M.G.-R., J.R.-R., and B.R.; resources, M.T.A., C.V.A., A.Z., R.N., R.G., G.D., T.L.H., and M.C.; writing – original draft, A.G.G.-V. and M.C.; writing – review & editing, all authors; supervision, A.G.G.-V., G.D., C.V.A., R.N., P.M.G.-R., T.L.H., and M.C.; project administration, A.G.G.-V. and M.C.; funding acquisition, C.V.A., G.D., T.L.H., and M.C.
Declaration of interests
The authors declare no competing interests.
Published: August 2, 2021
Footnotes
Supplemental information can be found online at https://doi.org/10.1016/j.cmet.2021.07.008.
Contributor Information
Alicia G. Gómez-Valadés, Email: agarciag@clinic.cat.
Marc Claret, Email: mclaret@clinic.cat.
Supplemental information
References
- Anthonsen M.W., Rönnstrand L., Wernstedt C., Degerman E., Holm C. Identification of novel phosphorylation sites in hormone-sensitive lipase that are phosphorylated in response to isoproterenol and govern activation properties in vitro. J. Biol. Chem. 1998;273:215–221. doi: 10.1074/jbc.273.1.215. [DOI] [PubMed] [Google Scholar]
- Arduino D.M., Wettmarshausen J., Vais H., Navas-Navarro P., Cheng Y., Leimpek A., Ma Z., Delrio-Lorenzo A., Giordano A., Garcia-Perez C. Systematic identification of MCU modulators by orthogonal interspecies chemical screening. Mol. Cell. 2017;67:711–723.e7. doi: 10.1016/j.molcel.2017.07.019. [DOI] [PMC free article] [PubMed] [Google Scholar]
- Bartness T.J., Liu Y., Shrestha Y.B., Ryu V. Neural innervation of white adipose tissue and the control of lipolysis. Front. Neuroendocrinol. 2014;35:473–493. doi: 10.1016/j.yfrne.2014.04.001. [DOI] [PMC free article] [PubMed] [Google Scholar]
- Baughman J.M., Perocchi F., Girgis H.S., Plovanich M., Belcher-Timme C.A., Sancak Y., Bao X.R., Strittmatter L., Goldberger O., Bogorad R.L. Integrative genomics identifies MCU as an essential component of the mitochondrial calcium uniporter. Nature. 2011;476:341–345. doi: 10.1038/nature10234. [DOI] [PMC free article] [PubMed] [Google Scholar]
- Bermont F., Hermant A., Benninga R., Chabert C., Jacot G., Santo-Domingo J., Kraus M.R.-C., Feige J.N., De Marchi U. Targeting mitochondrial calcium uptake with the natural flavonol kaempferol, to promote metabolism/secretion coupling in pancreatic β-cells. Nutrients. 2020;12:538. doi: 10.3390/nu12020538. [DOI] [PMC free article] [PubMed] [Google Scholar]
- Bertholet A.M., Millet A.M.E., Guillermin O., Daloyau M., Davezac N., Miquel M.C., Belenguer P. OPA1 loss of function affects in vitro neuronal maturation. Brain. 2013;136:1518–1533. doi: 10.1093/brain/awt060. [DOI] [PubMed] [Google Scholar]
- Brito M.N., Brito N.A., Baro D.J., Song C.K., Bartness T.J. Differential activation of the sympathetic innervation of adipose tissues by melanocortin receptor stimulation. Endocrinology. 2007;148:5339–5347. doi: 10.1210/en.2007-0621. [DOI] [PubMed] [Google Scholar]
- Brito N.A., Brito M.N., Bartness T.J. Differential sympathetic drive to adipose tissues after food deprivation, cold exposure or glucoprivation. Am. J. Physiol. Regul. Integr. Comp. Physiol. 2008;294:R1445–R1452. doi: 10.1152/ajpregu.00068.2008. [DOI] [PubMed] [Google Scholar]
- Buettner C., Muse E.D., Cheng A., Chen L., Scherer T., Pocai A., Su K., Cheng B., Li X., Harvey-White J. Leptin controls adipose tissue lipogenesis via central, STAT3-independent mechanisms. Nat. Med. 2008;14:667–675. doi: 10.1038/nm1775. [DOI] [PMC free article] [PubMed] [Google Scholar]
- Campbell J.N., Macosko E.Z., Fenselau H., Pers T.H., Lyubetskaya A., Tenen D., Goldman M., Verstegen A.M.J., Resch J.M., McCarroll S.A. A molecular census of arcuate hypothalamus and median eminence cell types. Nat. Neurosci. 2017;20:484–496. doi: 10.1038/nn.4495. [DOI] [PMC free article] [PubMed] [Google Scholar]
- Caron A., Lee S., Elmquist J.K., Gautron L. Leptin and brain-adipose crosstalks. Nat. Rev. Neurosci. 2018;19:153–165. doi: 10.1038/nrn.2018.7. [DOI] [PMC free article] [PubMed] [Google Scholar]
- Cavalcanti-de-Albuquerque J.P., Bober J., Zimmer M.R., Dietrich M.O. Regulation of substrate utilization and adiposity by Agrp neurons. Nat. Commun. 2019;10:311. doi: 10.1038/s41467-018-08239-x. [DOI] [PMC free article] [PubMed] [Google Scholar]
- Chang D.T.W., Reynolds I.J. Differences in mitochondrial movement and morphology in young and mature primary cortical neurons in culture. Neuroscience. 2006;141:727–736. doi: 10.1016/j.neuroscience.2006.01.034. [DOI] [PubMed] [Google Scholar]
- Chang D.T.W., Honick A.S., Reynolds I.J. Mitochondrial trafficking to synapses in cultured primary cortical neurons. J. Neurosci. 2006;26:7035–7045. doi: 10.1523/JNEUROSCI.1012-06.2006. [DOI] [PMC free article] [PubMed] [Google Scholar]
- Chang K.T., Niescier R.F., Min K.T. Mitochondrial matrix Ca2+ as an intrinsic signal regulating mitochondrial motility in axons. Proc. Natl. Acad. Sci. USA. 2011;108:15456–15461. doi: 10.1073/pnas.1106862108. [DOI] [PMC free article] [PubMed] [Google Scholar]
- Chen Y., Lin Y.C., Kuo T.W., Knight Z.A. Sensory detection of food rapidly modulates arcuate feeding circuits. Cell. 2015;160:829–841. doi: 10.1016/j.cell.2015.01.033. [DOI] [PMC free article] [PubMed] [Google Scholar]
- Cipolat S., Rudka T., Hartmann D., Costa V., Serneels L., Craessaerts K., Metzger K., Frezza C., Annaert W., D’Adamio L. Mitochondrial rhomboid PARL regulates cytochrome c release during apoptosis via OPA1-dependent cristae remodeling. Cell. 2006;126:163–175. doi: 10.1016/j.cell.2006.06.021. [DOI] [PubMed] [Google Scholar]
- Civiletto G., Varanita T., Cerutti R., Gorletta T., Barbaro S., Marchet S., Lamperti C., Viscomi C., Scorrano L., Zeviani M. Opa1 overexpression ameliorates the phenotype of two mitochondrial disease mouse models. Cell Metab. 2015;21:845–854. doi: 10.1016/j.cmet.2015.04.016. [DOI] [PMC free article] [PubMed] [Google Scholar]
- Cogliati S., Frezza C., Soriano M.E., Varanita T., Quintana-Cabrera R., Corrado M., Cipolat S., Costa V., Casarin A., Gomes L.C. Mitochondrial cristae shape determines respiratory chain supercomplexes assembly and respiratory efficiency. Cell. 2013;155:160–171. doi: 10.1016/j.cell.2013.08.032. [DOI] [PMC free article] [PubMed] [Google Scholar]
- Cogliati S., Enriquez J.A., Scorrano L. Mitochondrial cristae: where beauty meets functionality. Trends Biochem. Sci. 2016;41:261–273. doi: 10.1016/j.tibs.2016.01.001. [DOI] [PubMed] [Google Scholar]
- De Stefani D., Raffaello A., Teardo E., Szabò I., Rizzuto R. A forty-kilodalton protein of the inner membrane is the mitochondrial calcium uniporter. Nature. 2011;476:336–340. doi: 10.1038/nature10230. [DOI] [PMC free article] [PubMed] [Google Scholar]
- Del Dotto V., Mishra P., Vidoni S., Fogazza M., Maresca A., Caporali L., McCaffery J.M., Cappelletti M., Baruffini E., Lenaers G. OPA1 isoforms in the hierarchical organization of mitochondrial functions. Cell Rep. 2017;19:2557–2571. doi: 10.1016/j.celrep.2017.05.073. [DOI] [PubMed] [Google Scholar]
- Dietrich M.O., Liu Z.W., Horvath T.L. Mitochondrial dynamics controlled by mitofusins regulate Agrp neuronal activity and diet-induced obesity. Cell. 2013;155:188–199. doi: 10.1016/j.cell.2013.09.004. [DOI] [PMC free article] [PubMed] [Google Scholar]
- Favaro G., Romanello V., Varanita T., Andrea Desbats M., Morbidoni V., Tezze C., Albiero M., Canato M., Gherardi G., De Stefani D. DRP1-mediated mitochondrial shape controls calcium homeostasis and muscle mass. Nat. Commun. 2019;10:2576. doi: 10.1038/s41467-019-10226-9. [DOI] [PMC free article] [PubMed] [Google Scholar]
- Frezza C., Cipolat S., Martins de Brito O., Micaroni M., Beznoussenko G.V., Rudka T., Bartoli D., Polishuck R.S., Danial N.N., De Strooper B., Scorrano L. OPA1 controls apoptotic cristae remodeling independently from mitochondrial fusion. Cell. 2006;126:177–189. doi: 10.1016/j.cell.2006.06.025. [DOI] [PubMed] [Google Scholar]
- Fülöp L., Szanda G., Enyedi B., Várnai P., Spät A. The effect of OPA1 on mitochondrial Ca2+ signaling. PLoS One. 2011;6:e25199. doi: 10.1371/journal.pone.0025199. [DOI] [PMC free article] [PubMed] [Google Scholar]
- Fülöp L., Rajki A., Maka E., Molnár M.J., Spät A. Mitochondrial Ca2+ uptake correlates with the severity of the symptoms in autosomal dominant optic atrophy. Cell Calcium. 2015;57:49–55. doi: 10.1016/j.ceca.2014.11.008. [DOI] [PubMed] [Google Scholar]
- Gao A.W., Cantó C., Houtkooper R.H. Mitochondrial response to nutrient availability and its role in metabolic disease. EMBO Mol. Med. 2014;6:580–589. doi: 10.1002/emmm.201303782. [DOI] [PMC free article] [PubMed] [Google Scholar]
- Gomes L.C., Di Benedetto G., Scorrano L. During autophagy mitochondria elongate, are spared from degradation and sustain cell viability. Nat. Cell Biol. 2011;13:589–598. doi: 10.1038/ncb2220. [DOI] [PMC free article] [PubMed] [Google Scholar]
- Gottschalk B., Klec C., Leitinger G., Bernhart E., Rost R., Bischof H., Madreiter-Sokolowski C.T., Radulović S., Eroglu E., Sattler W. MICU1 controls cristae junction and spatially anchors mitochondrial Ca2+ uniporter complex. Nat. Commun. 2019;10:3732. doi: 10.1038/s41467-019-11692-x. [DOI] [PMC free article] [PubMed] [Google Scholar]
- Greenberg A.S., Shen W.J., Muliro K., Patel S., Souza S.C., Roth R.A., Kraemer F.B. Stimulation of lipolysis and hormone-sensitive lipase via the extracellular signal-regulated kinase pathway. J. Biol. Chem. 2001;276:45456–45461. doi: 10.1074/jbc.M104436200. [DOI] [PubMed] [Google Scholar]
- Hackenbrock C.R. Ultrastructural bases for metabolically linked mechanical activity in mitochondria. I. Reversible ultrastructural changes with change in metabolic steady state in isolated liver mitochondria. J. Cell Biol. 1966;30:269–297. doi: 10.1083/jcb.30.2.269. [DOI] [PMC free article] [PubMed] [Google Scholar]
- Haddad-Tóvolli R., Altirriba J., Obri A., Sánchez E.E., Chivite I., Milà-Guasch M., Ramírez S., Gómez-Valadés A.G., Pozo M., Burguet J. Pro-opiomelanocortin (POMC) neuron translatome signatures underlying obesogenic gestational malprogramming in mice. Mol. Metab. 2020;36:100963. doi: 10.1016/j.molmet.2020.02.006. [DOI] [PMC free article] [PubMed] [Google Scholar]
- Hollenbeck P.J., Saxton W.M. The axonal transport of mitochondria. J. Cell Sci. 2005;118:5411–5419. doi: 10.1242/jcs.02745. [DOI] [PMC free article] [PubMed] [Google Scholar]
- Kannurpatti S.S., Biswal B.B. Mitochondrial Ca2+ uniporter blockers influence activation-induced CBF response in the rat somatosensory cortex. J. Cereb. Blood Flow Metab. 2008;28:772–785. doi: 10.1038/sj.jcbfm.9600574. [DOI] [PubMed] [Google Scholar]
- Koch M., Varela L., Kim J.G., Kim J.D., Hernández-Nuño F., Simonds S.E., Castorena C.M., Vianna C.R., Elmquist J.K., Morozov Y.M. Hypothalamic POMC neurons promote cannabinoid-induced feeding. Nature. 2015;519:45–50. doi: 10.1038/nature14260. [DOI] [PMC free article] [PubMed] [Google Scholar]
- Kushnareva Y.E., Gerencser A.A., Bossy B., Ju W.K., White A.D., Waggoner J., Ellisman M.H., Perkins G., Bossy-Wetzel E. Loss of OPA1 disturbs cellular calcium homeostasis and sensitizes for excitotoxicity. Cell Death Differ. 2013;20:353–365. doi: 10.1038/cdd.2012.128. [DOI] [PMC free article] [PubMed] [Google Scholar]
- Lam B.Y.H., Cimino I., Polex-Wolf J., Nicole Kohnke S., Rimmington D., Iyemere V., Heeley N., Cossetti C., Schulte R., Saraiva L.R. Heterogeneity of hypothalamic pro-opiomelanocortin-expressing neurons revealed by single-cell RNA sequencing. Mol. Metab. 2017;6:383–392. doi: 10.1016/j.molmet.2017.02.007. [DOI] [PMC free article] [PubMed] [Google Scholar]
- Liesa M., Shirihai O.S. Mitochondrial dynamics in the regulation of nutrient utilization and energy expenditure. Cell Metab. 2013;17:491–506. doi: 10.1016/j.cmet.2013.03.002. [DOI] [PMC free article] [PubMed] [Google Scholar]
- Mishra P., Chan D.C. Metabolic regulation of mitochondrial dynamics. J. Cell Biol. 2016;212:379–387. doi: 10.1083/jcb.201511036. [DOI] [PMC free article] [PubMed] [Google Scholar]
- Mishra P., Carelli V., Manfredi G., Chan D.C. Proteolytic cleavage of Opa1 stimulates mitochondrial inner membrane fusion and couples fusion to oxidative phosphorylation. Cell Metab. 2014;19:630–641. doi: 10.1016/j.cmet.2014.03.011. [DOI] [PMC free article] [PubMed] [Google Scholar]
- Niescier R.F., Hong K., Park D., Min K.T. MCU interacts with Miro1 to modulate mitochondrial functions in neurons. J. Neurosci. 2018;38:4666–4677. doi: 10.1523/JNEUROSCI.0504-18.2018. [DOI] [PMC free article] [PubMed] [Google Scholar]
- Nogueiras R., Wiedmer P., Perez-Tilve D., Veyrat-Durebex C., Keogh J.M., Sutton G.M., Pfluger P.T., Castaneda T.R., Neschen S., Hofmann S.M. The central melanocortin system directly controls peripheral lipid metabolism. J. Clin. Invest. 2007;117:3475–3488. doi: 10.1172/JCI31743. [DOI] [PMC free article] [PubMed] [Google Scholar]
- Paeger L., Pippow A., Hess S., Paehler M., Klein A.C., Husch A., Pouzat C., Brüning J.C., Kloppenburg P. Energy imbalance alters Ca2+ handling and excitability of POMC neurons. eLife. 2017;6:e25641. doi: 10.7554/eLife.25641. [DOI] [PMC free article] [PubMed] [Google Scholar]
- Paillard M., Csordás G., Huang K.T., Várnai P., Joseph S.K., Hajnóczky G. MICU1 interacts with the D-ring of the MCU pore to control its Ca2+ flux and sensitivity to Ru360. Mol. Cell. 2018;72:778–785.e3. doi: 10.1016/j.molcel.2018.09.008. [DOI] [PMC free article] [PubMed] [Google Scholar]
- Patten D.A., Wong J., Khacho M., Soubannier V., Mailloux R.J., Pilon-Larose K., MacLaurin J.G., Park D.S., McBride H.M., Trinkle-Mulcahy L. OPA1-dependent cristae modulation is essential for cellular adaptation to metabolic demand. EMBO J. 2014;33:2676–2691. doi: 10.15252/embj.201488349. [DOI] [PMC free article] [PubMed] [Google Scholar]
- Ramírez S., Gómez-Valadés A.G., Schneeberger M., Varela L., Haddad-Tóvolli R., Altirriba J., Noguera E., Drougard A., Flores-Martínez Á., Imbernón M. Mitochondrial dynamics mediated by mitofusin 1 is required for POMC neuron glucose-sensing and insulin release control. Cell Metab. 2017;25:1390–1399.e6. doi: 10.1016/j.cmet.2017.05.010. [DOI] [PubMed] [Google Scholar]
- Santoro A., Campolo M., Liu C., Sesaki H., Meli R., Liu Z.W., Kim J.D., Diano S. DRP1 suppresses leptin and glucose sensing of POMC neurons. Cell Metab. 2017;25:647–660. doi: 10.1016/j.cmet.2017.01.003. [DOI] [PMC free article] [PubMed] [Google Scholar]
- Sanz E., Yang L., Su T., Morris D.R., McKnight G.S., Amieux P.S. Cell-type-specific isolation of ribosome-associated mRNA from complex tissues. Proc. Natl. Acad. Sci. USA. 2009;106:13939–13944. doi: 10.1073/pnas.0907143106. [DOI] [PMC free article] [PubMed] [Google Scholar]
- Schneeberger M., Dietrich M.O., Sebastián D., Imbernón M., Castaño C., Garcia A., Esteban Y., Gonzalez-Franquesa A., Rodríguez I.C., Bortolozzi A. Mitofusin 2 in POMC neurons connects ER stress with leptin resistance and energy imbalance. Cell. 2013;155:172–187. doi: 10.1016/j.cell.2013.09.003. [DOI] [PMC free article] [PubMed] [Google Scholar]
- Schrepfer E., Scorrano L. Mitofusins, from mitochondria to metabolism. Mol. Cell. 2016;61:683–694. doi: 10.1016/j.molcel.2016.02.022. [DOI] [PubMed] [Google Scholar]
- Tilokani L., Nagashima S., Paupe V., Prudent J. Mitochondrial dynamics: overview of molecular mechanisms. Essays Biochem. 2018;62:341–360. doi: 10.1042/EBC20170104. [DOI] [PMC free article] [PubMed] [Google Scholar]
- Timper K., Brüning J.C. Hypothalamic circuits regulating appetite and energy homeostasis: pathways to obesity. Dis. Model. Mech. 2017;10:679–689. doi: 10.1242/dmm.026609. [DOI] [PMC free article] [PubMed] [Google Scholar]
- Toda C., Kim J.D., Impellizzeri D., Cuzzocrea S., Liu Z.W., Diano S. UCP2 regulates mitochondrial fission and ventromedial nucleus control of glucose responsiveness. Cell. 2016;164:872–883. doi: 10.1016/j.cell.2016.02.010. [DOI] [PMC free article] [PubMed] [Google Scholar]
- Toda C., Santoro A., Kim J.D., Diano S. POMC neurons: from birth to death. Annu. Rev. Physiol. 2017;79:209–236. doi: 10.1146/annurev-physiol-022516-034110. [DOI] [PMC free article] [PubMed] [Google Scholar]
- Tomar D., Thomas M., Garbincius J.F., Kolmetzky D.W., Salik O., Jadiya P., Carpenter A.C., Elrod J.W. MICU1 regulates mitochondrial cristae structure and function independent of the mitochondrial calcium uniporter channel. bioRxiv. 2019 doi: 10.1101/803213. [DOI] [PMC free article] [PubMed] [Google Scholar]
- Vaccaro V., Devine M.J., Higgs N.F., Kittler J.T. Miro1-dependent mitochondrial positioning drives the rescaling of presynaptic Ca2+ signals during homeostatic plasticity. EMBO Rep. 2017;18:231–240. doi: 10.15252/embr.201642710. [DOI] [PMC free article] [PubMed] [Google Scholar]
- Vais H., Mallilankaraman K., Mak D.-O.D., Hoff H., Payne R., Tanis J.E., Foskett J.K. EMRE is a matrix Ca(2+) sensor that governs gatekeeping of the mitochondrial Ca(2+) uniporter. Cell Rep. 2016;14:403–410. doi: 10.1016/j.celrep.2015.12.054. [DOI] [PMC free article] [PubMed] [Google Scholar]
- Wai T., Langer T. Mitochondrial dynamics and metabolic regulation. Trends Endocrinol. Metab. 2016;27:105–117. doi: 10.1016/j.tem.2015.12.001. [DOI] [PubMed] [Google Scholar]
- Wang S., Soni K.G., Semache M., Casavant S., Fortier M., Pan L., Mitchell G.A. Lipolysis and the integrated physiology of lipid energy metabolism. Mol. Genet. Metab. 2008;95:117–126. doi: 10.1016/j.ymgme.2008.06.012. [DOI] [PubMed] [Google Scholar]
- Wang X., Pandey A.K., Mulligan M.K., Williams E.G., Mozhui K., Li Z., Jovaisaite V., Quarles L.D., Xiao Z., Huang J. Joint mouse-human phenome-wide association to test gene function and disease risk. Nat. Commun. 2016;7:10464. doi: 10.1038/ncomms10464. [DOI] [PMC free article] [PubMed] [Google Scholar]
- Wang P., Loh K.H., Wu M., Morgan D.A., Schneeberger M., Yu X., Chi J., Kosse C., Kim D., Rahmouni K. A leptin-BDNF pathway regulating sympathetic innervation of adipose tissue. Nature. 2020;583:839–844. doi: 10.1038/s41586-020-2527-y. [DOI] [PubMed] [Google Scholar]
- Woods J.J., Wilson J.J. Inhibitors of the mitochondrial calcium uniporter for the treatment of disease. Curr. Opin. Chem. Biol. 2020;55:9–18. doi: 10.1016/j.cbpa.2019.11.006. [DOI] [PubMed] [Google Scholar]
- Woods J.J., Nemani N., Shanmughapriya S., Kumar A., Zhang M., Nathan S.R., Thomas M., Carvalho E., Ramachandran K., Srikantan S. A selective and cell-permeable mitochondrial calcium uniporter (MCU) inhibitor preserves mitochondrial bioenergetics after hypoxia/reoxygenation injury. ACS Cent. Sci. 2019;5:153–166. doi: 10.1021/acscentsci.8b00773. [DOI] [PMC free article] [PubMed] [Google Scholar]
- Woods J.J., Lovett J., Lai B., Harris H.H., Wilson J.J. Redox stability controls the cellular uptake and activity of ruthenium-based inhibitors of the mitochondrial calcium uniporter (MCU) Angew. Chem. Int. Ed. Engl. 2020;59:6482–6491. doi: 10.1002/anie.202000247. [DOI] [PubMed] [Google Scholar]
- Xu A.W., Kaelin C.B., Takeda K., Akira S., Schwartz M.W., Barsh G.S. PI3K integrates the action of insulin and leptin on hypothalamic neurons. J. Clin. Invest. 2005;115:951–958. doi: 10.1172/JCI24301. [DOI] [PMC free article] [PubMed] [Google Scholar]
- Zeng W., Pirzgalska R.M., Pereira M.M.A., Kubasova N., Barateiro A., Seixas E., Lu Y.H., Kozlova A., Voss H., Martins G.G. Sympathetic neuro-adipose connections mediate leptin-driven lipolysis. Cell. 2015;163:84–94. doi: 10.1016/j.cell.2015.08.055. [DOI] [PMC free article] [PubMed] [Google Scholar]
Associated Data
This section collects any data citations, data availability statements, or supplementary materials included in this article.
Supplementary Materials
Data Availability Statement
-
•
The data generated in this study will be shared by the lead contact upon reasonable request.
-
•
This study did not generate new code.
-
•
Any additional information required to reanalyze the data reported in this paper is available from the lead contact upon request.