Abstract
The gene most commonly activated by chromosomal rearrangements in patients with T-cell acute lymphoblastic leukemia (T-ALL) is SCL/tal. In collaboration with LMO1 or LMO2, the thymic expression of SCL/tal leads to T-ALL at a young age with a high degree of penetrance in transgenic mice. We now show that SCL LMO1 double-transgenic mice display thymocyte developmental abnormalities in terms of proliferation, apoptosis, clonality, and immunophenotype prior to the onset of a frank malignancy. At 4 weeks of age, thymocytes from SCL LMO1 mice show 70% fewer total thymocytes, with increased rates of both proliferation and apoptosis, than control thymocytes. At this age, a clonal population of thymocytes begins to populate the thymus, as evidenced by oligoclonal T-cell-receptor gene rearrangements. Also, there is a dramatic increase in immature CD44+ CD25− cells, a decrease in the more mature CD4+ CD8+ cells, and development of an abnormal CD44+ CD8+ population. An identical pattern of premalignant changes is seen with either a full-length SCL protein or an amino-terminal truncated protein which lacks the SCL transactivation domain, demonstrating that the amino-terminal portion of SCL is not important for leukemogenesis. Lastly, we show that the T-ALL which develop in the SCL LMO1 mice are strikingly similar to those which develop in E2A null mice, supporting the hypothesis that SCL exerts its oncogenic action through a functional inactivation of E proteins.
The SCL (TCL5, tal-1) gene was initially identified at the site of a t(1;14)(p32;q11) translocation breakpoint present in the multipotential DU528 cell line (8, 12, 18). The SCL gene product contains the basic domain, helix-loop-helix (bHLH) motif present in many eukaryotic transcription factors (31). Mice with a null mutation for the SCL gene are nonviable due to a lack of hematopoiesis, demonstrating that the SCL gene product is required for normal hematopoietic development (17, 36, 41). More recently, it has been shown that the SCL gene product is important for blood vessel formation (20, 44).
In addition to its role during normal hematopoiesis and vasculogenesis, several lines of evidence indicate that SCL gene dysregulation can lead to leukemic transformation. While not normally expressed in T lymphocytes (9), abundant amounts of SCL mRNA or protein are often detected in patients with T-cell acute lymphoblastic leukemia (T-ALL); the largest series to date suggests that SCL mRNA is expressed in the malignant lymphoblasts of greater than 60% of pediatric patients with T-ALL (7). In some cases of T-ALL, aberrant SCL expression is caused by chromosomal translocations which juxtapose T-cell receptor (TCR) δ or β regulatory elements to the body of the SCL gene (8, 12, 18, 19). However, the more common event which deregulates SCL expression in T-ALL patients is a site-specific interstitial deletion which replaces SCL regulatory elements with those of an upstream gene named SIL (3, 10), leading to SCL mRNA expression under the control of SIL regulatory elements (4).
Like other bHLH proteins, SCL has been shown to form heterodimers with E proteins, including the E2A gene products E12 and E47 (24) and HEB (49). A preferred DNA binding sequence (CAGATG) has been defined for SCL-E2A heterodimers (25), and a transcription activation domain has been mapped for SCL (39). Several alternately spliced forms of SCL mRNA can be detected, and two different-sized forms of the SCL protein can commonly be detected by Western blotting: a full-length form of 42 to 44 kDa and an amino-terminal truncated form of 22 to 26 kDa (1, 13, 21) which lacks the transactivation domain. Additionally, it has recently been shown that SCL can bind both LMO1 and LMO2 in vivo (46) and that a pentameric transactivating complex consisting of SCL, E2A, LMO2, GATA1, and LDB1 can be detected in vivo (47); this pentameric complex recognizes an E-box (CAGGTG) sequence in association with a GATA binding site.
Several laboratories have recently reported results indicating that unscheduled SCL expression either alone or in concert with CKII, LMO1, or LMO2 leads to the development of aggressive T-cell malignancies in transgenic mice (2, 15, 26, 27). In general, unscheduled SCL expression alone either does not cause T-cell malignancies (2, 37) or causes T-cell malignancies relatively late in life, with incomplete penetrance (15, 26). The reason for different results among investigators is not clear; it may be due to differences in the promoters used, the mouse strains, the integration sites, or some combination of these factors. However, in collaboration with either LMO2 (27) or LMO1 (2), SCL dysregulation leads to leukemia/lymphoma with a high degree of penetrance (95 to 100%) early in life (mean age of onset, 4 to 7 months), indicating that the combination of SCL with LMO1 or LMO2 inexorably leads to T-cell malignancies. The concept of collaboration between SCL and LMO proteins is reinforced by observations that some tumors derived from LMO2 mice have activated SCL (23) and that MSH2-deficient mice which develop T-cell malignancies often activate SCL and LMO2 (29).
The observation that an amino-terminal truncated form of SCL, which lacks the transactivation domain, was leukemogenic (2) suggests that SCL may be exerting its oncogenic effect through a dominant negative mechanism, perhaps by binding and sequestering E proteins needed for normal T-cell development. This hypothesis is supported by recent observations that E2A-deficient mice develop fulminant T-cell malignancies at an early age (5, 48). In this report, we describe premalignant changes in mice transgenic for both SCL and LMO1 in terms of thymocyte number, proliferative index, immunophenotype, tumorigenicity, and clonality that are strikingly similar to those seen in E2A-deficient mice.
MATERIALS AND METHODS
Generation of transgenic mice.
The generation of transgenic mice by using the pSIL/SCL (full-length SCL) and the pSIL/TSCL (amino-terminal truncated SCL) vectors has been described (2). The LMO1 transgenic mice (lck-LMO1; line 11) were obtained from Stanley Korsmeyer (30). Unless noted otherwise, the A(5)3 SCL line (2), which expresses the amino-terminal truncated form of SCL, was used for all the experiments described. Animals were maintained under standard conditions according to institutional animal care and use guidelines.
Sample collection and immunophenotype.
Thymus, spleen, or tumor masses were removed from mice and placed on ice in RPMI 1640 containing 10% fetal bovine serum, 5 μg of penicillin per ml, and 5 μg of streptomycin per ml. Single-cell suspensions were made by using a loose-fitting ground-glass homogenizer. Debris was removed by gravity sedimentation, and the single cell suspension was used for subsequent studies. Cells were immunophenotyped by using conjugated monoclonal antibodies and standard techniques. Briefly, cells were washed in cold phosphate-buffered saline (PBS) and separated into aliquots in 12-by-75-mm tubes (Falcon) at a concentration of 106 cells per ml. Cells were blocked for 15 min with 10 μg of rat and/or hamster immunoglobulin G (Caltag) and stained with the appropriate antibody conjugate for 45 min. The conjugates used were CD4 fluorescein isothiocyanate (FITC), CD8 red phycoerythrin (R-PE), CD25 R-PE, TCRβ Tricolor, and CD44 FITC (Caltag). Cells were washed twice with PBS and fixed with 1% paraformaldehyde, and 5,000 events were analyzed on a FACScan (Becton Dickinson). Statistical analysis was performed by using a two-sided Student’s t test.
Cell cycle analysis.
Cells were washed as described above, fixed with 70% ethanol, and stained with 1 ml of a 50-μg/ml mixture of propidium iodide in 0.1% sodium citrate containing 0.37% Nonidet P-40 (NP-40) and 20 μg of RNase A per ml for at least 30 min. Cells were kept at 4°C and washed with propidium stain immediately before FACScan analysis. Double staining of CD4 and propidium iodide were done by staining for CD4 as described above, followed by ethanol fixation and propidium staining. Results based on at least 15,000 events were analyzed by using the Modfit software package. Statistical analysis was done by using a two-sided Student’s t test.
Cell viability and apoptosis assays.
One million thymocytes were resuspended in RPMI 1640 supplemented with 10% fetal bovine serum, antibiotics, and 50 μM 2-mercaptoethanol and were then incubated at 37°C in an atmosphere of 5% CO2. Aliquots were removed on a daily basis, and cell counts were made by using a 0.08% trypan blue dye exclusion assay (Life Technologies). Cells were stained with the nuclear dye Hoechst 33258 in vitro and assayed for apoptotic events as previously described (42). For in situ detection of apoptosis, terminal deoxynucleotidyl transferase (Tdt) was used to label apoptotic cells in tissue sections by using Apotag (Oncor) reagents and protocols, as previously described (11).
Nucleic acid manipulations.
Genomic DNA was isolated from tail and thymocytes as previously described (2). Total RNA was isolated by using Trizol (Life Technologies) according to the manufacturer’s recommended protocol. Southern and Northern blotting was performed as previously described (14). Probes used in this study included a 1.2-kb HindIII-XbaI human SCL cDNA fragment (67HX [2]), a PCR-amplified human LMO1 cDNA fragment (nucleotides 544 to 957; GenBank accession number M26682), and a PCR-amplified murine CD4 cDNA probe (nucleotides 2916 to 3081; GenBank accession number X04836). Murine c-myc and human TCR Cβ2 probes were gifts of Ilan Kirsch (National Cancer Institute).
Transient-transfection assays.
The E-box–luciferase reporter constructs were a kind gift of Thomas Kadesch (University of Pennsylvania). The E(5,2)6-luc construct contains a minimal E1b promoter followed by six concatamerized μE5 and μE2 E-boxes controlling luciferase expression; the E(5,2,3)4-luc construct contains four concatamerized μE5, μE2, and μE3 E-boxes controlling luciferase expression (33). The E1b-luc has a minimal E1b promoter and no E-box sequences controlling luciferase expression and was generated by deleting the E-box sequences from E(5,2)6-luc. An E2A expression vector (named pCE2-5) was generated by cloning an E2-5 cDNA (22) into pcDNA3.1 (Invitrogen), an SCL expression vector (named pCSCL) was generated by cloning an SCL cDNA (67HX [2]) into pRC-CMV, and an LMO1 expression vector (named pCLMO1) was generated by cloning a PCR-amplified fragment (sense primer 5′-TTTAAGCTTGCTAGCTGCCCGAGGACCGG-3′; antisense primer 5′-TTTAAGCTTACTGAACTTGGGATTCAAAGG-3′) encoding the full-length LMO1 protein into pRC-CMV. All PCR products and cloning junctions were sequenced to confirm the correct sequence and orientation. A vector employing simian virus 40 promoter-enhancer sequences (pCAT Control; Promega) driving chloramphenicol acetyltransferase (CAT) expression was used to control for transfection efficiency. NIH 3T3 fibroblasts were transfected when ca. 50% confluent by using Lipofectamine reagent (Life Technologies) and the manufacturer’s recommended protocol. All transfections used 2 μg of both luciferase and CAT reporter vectors and 5 μg of each expression vector except where noted; in the transfections where the SCL, LMO1, and E2-5 expression vectors totaled less than 15 μg, the parent pRC-CMV vector was added to a total of 15 μg. At 48 h after transfection, the cells were lysed by using Promega Reporter Buffer. Supernatants (20 μl) were assayed for luciferase activity by using the Luciferase Assay System (Promega) and a Monolight 2010 luminometer (Analytical Luminescence Laboratory). Supernatants (110 μl) were heated to 60°C for 10 min and analyzed for CAT activity by adding 0.25 μCi of 14C-labeled chloramphenicol and 25 μg of n-butyryl-coenzyme A and incubating the mixture at 37°C for 2 h. The reaction products were extracted with xylene and counted in a scintillation counter.
Tumorigenicity assays in nude mice.
Thymocytes collected at 4, 8, and 12 weeks or tumor cells collected at the onset of clinical disease were washed, pelleted, and resuspended in PBS prior to injection into nu/nu homozygous mice (Harlan Sprague-Dawley, Indianapolis, Ind.) either intraperitoneally or subcutaneously in a total volume of 0.5 ml. The mice were evaluated for clinical symptoms of malignancy (weight loss, tachypnea, or palpable lymphadenopathy) on a weekly basis and sacrificed when an obvious tumor burden was detected. Tumor cells were harvested as described above.
RESULTS
The thymus from immature SCL LMO1 double-transgenic mice is small and contains fewer thymocytes than controls.
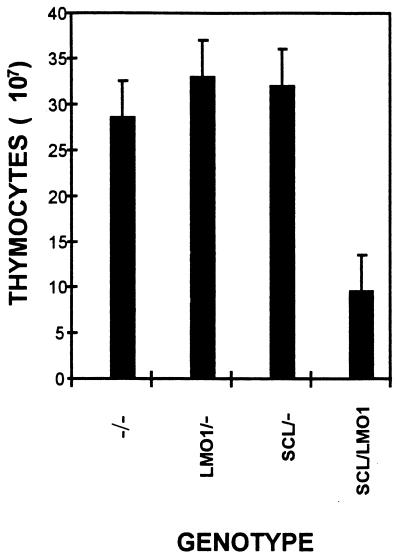
In order to determine whether a clonal expansion of thymocytes could be detected prior to the onset of a frank malignancy, we sacrificed mice at 4 to 5 weeks of age and determined the total thymocyte number, the proliferative index, and the in vitro survival. Surprisingly, the thymi from animals transgenic for both SCL and LMO1 (hereafter SCL LMO1) were visibly smaller than those from any of the control genotypes (negative for both transgenes, positive only for the SCL transgene, or positive for only the LMO1 transgene, hereafter referred to as −/−, SCL/−, or LMO1/−, respectively). The total number of thymocytes was significantly reduced in the SCL LMO1 mice (P < 0.001) compared to any of the other three genotypes (Fig. 1). In order to determine why there were fewer total thymocytes in the SCL LMO1 mice, we assayed the thymocytes for cell cycle progression by using propidium iodide staining. The results of these experiments (Table 1) showed that thymocytes from the SCL LMO1 mice had a significantly higher fraction of cells in the S and G2 phases, suggesting that they were proliferating more rapidly than the control thymocytes.
FIG. 1.
Decreased number of thymocytes in SCL LMO1 transgenic mice. Littermates were sacrificed at 4 to 5 weeks of age, and the total number of thymocytes was counted. The numbers reflect the mean ± the standard deviation of 12 to 18 mice for each genotype.
TABLE 1.
Cell cycle analysis of thymocytes from 4-week-old micea
| Genotype | Total thymocytes
|
CD4+ thymocytes
|
CD4− thymocytes
|
|||
|---|---|---|---|---|---|---|
| G0/G1 | S+G2 | G0/G1 | S+G2 | G0/G1 | S+G2 | |
| −/− | 94.1 ± 1.1 | 5.9 ± 1.1 | 94.4 ± 0.4 | 5.6 ± 0.4 | 94.0 ± 2.4 | 6.0 ± 2.4 |
| LMO1/− | 94.6 ± 1.7 | 5.4 ± 1.7 | 94.6 ± 2.0 | 5.4 ± 2.0 | 93.4 ± 1.2 | 6.6 ± 1.2 |
| SCL/− | 94.6 ± 1.1 | 5.5 ± 1.1 | 94.4 ± 1.2 | 5.6 ± 1.2 | 94.7 ± 2.8 | 5.3 ± 2.8 |
| LMO1/SCL | 87.5 ± 2.8* | 12.5 ± 2.8* | 91.7 ± 5.0 | 8.3 ± 5.0 | 85.9 ± 0.8* | 14.1 ± 0.8* |
Asterisks indicate a P value of <0.005 compared to −/− control thymocytes. CD4+ and CD4− refer to thymocytes that are positive or negative for CD4 expression. Values shown are the mean percentages ± the standard deviation for at least four mice.
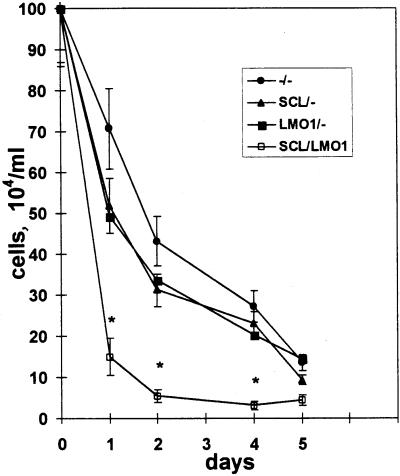
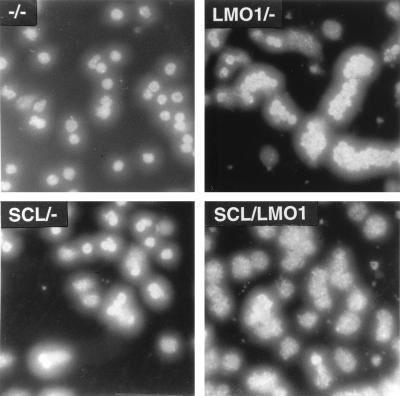
To determine whether thymocytes from the SCL LMO1 mice were dying more rapidly, we cultured thymocytes in vitro as described above. Figure 2 (top) demonstrates that thymocytes from the double-transgenic mice died more rapidly in vitro than did thymocytes from any of the control genotypes. The thymocytes died by an apoptotic process, as evidenced by chromatin fragmentation detected by Hoechst 33258 staining (Fig. 2, bottom).
FIG. 2.
SCL LMO1 thymocytes show decreased viability. (Top) Thymocyte survival in vitro. Thymocytes from 4-week-old mice (n = 4 for −/−, SCL/−, and LMO1/−; n = 8 for SCL LMO1) were placed in culture, and viable cells were counted daily. Genotypes are as indicated. The values shown reflect the mean ± the standard deviation; the asterisks indicate a significant difference (P < 0.005) between SCL LMO1 and the other genotypes. (Bottom) Increased apoptosis in thymocytes from SCL LMO1 transgenic mice. Thymocytes cultured in vitro for 24 h were stained with Hoechst 33258; apoptosis is indicated by increased nuclear fragmentation in the SCL LMO1 transgenic mice.
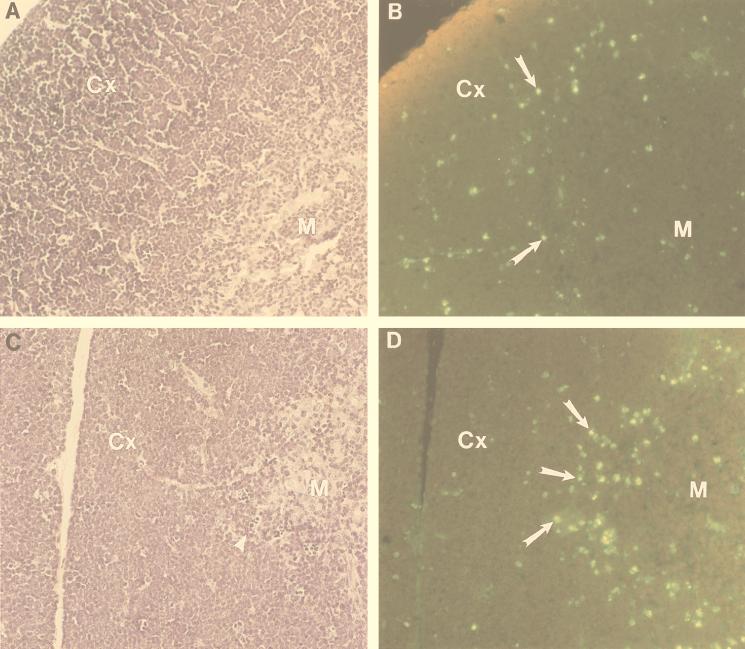
To determine whether these in vitro results correlated with in vivo observations, we assayed histologic sections of the thymus for evidence of apoptosis by using Tdt labeling. As shown in Fig. 3, the thymus from the double-transgenic animals shows increased numbers of apoptotic cells at the corticomedullary junction (Fig. 3D), which typically consists of CD4+ CD8+ cells, outlining the medulla of the double-transgenic thymus. Additionally, the hematoxylin-eosin-stained sections seem to show an increased density of cells in the subcapsular region (i.e., the outermost region of the cortex) of the double-transgenic thymus (compare the cortical and subcapsular regions in Fig. 3A and C). Since the subcapsular region is made up largely of CD4− CD8− cells, one might predict that the double-transgenic mice may have increased numbers of immature CD4− CD8− cells (see below).
FIG. 3.
Increased apoptosis at the corticomedullary junction in thymi from SCL LMO1 transgenic mice. Hematoxylin-eosin-stained sections from nontransgenic (A) and double-transgenic (C) mouse thymus are shown. Serial sections from nontransgenic (B) and double-transgenic (D) mice were stained for apoptotic cells. M, medulla; Cx, cortex. Apoptotic cells are indicated with arrows in panels B and D, and an arrowhead in panel C demonstrates several small, pyknotic cells at the corticomedullary junction. An increased number of apoptotic cells outlining the medulla is seen in panel D.
Thymocytes from immature SCL LMO1 double-transgenic mice display clonal TCR gene rearrangements prior to the onset of frank malignancy.
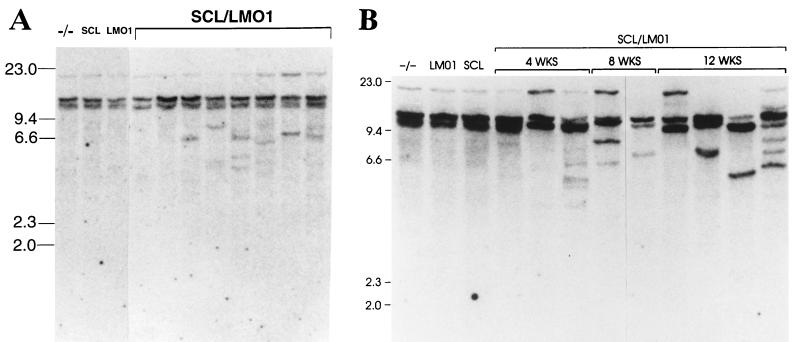
We looked for evidence of clonal or oligoclonal predominance in total thymocytes from SCL LMO1 mice by assaying for clonal TCRβ gene rearrangements. Genomic DNA from total thymocytes was digested with SstI, Southern blotted, and hybridized to a TCR Cβ2 probe. As shown in Fig. 4A, while no discrete restriction fragments representing clonal TCRβ gene rearrangements are present in any of the three control genotypes, distinct rearranged fragments can be detected in genomic DNA from most, but not all, of the SCL LMO1 mice, suggesting the emergence of a clonal population of thymocytes. Furthermore, the degree of clonality seemed to increase with age. Figure 4B shows that, as opposed to the relatively subtle clonal rearrangements seen at 4 weeks, more-obvious clonal rearrangements can generally be detected at 8 and 12 weeks of age, suggesting the emergence of a more homogeneous clonal population with age. Lastly, one of the 12-week-old SCL LMO1 thymocyte samples shown in Fig. 4B (lane 12) shows evidence of an oligoclonal population, with the presence of at least six clonal restriction fragments (representing three to six independent clones) in the sample.
FIG. 4.
Emergence of clonal populations in SCL LMO1 transgenic mice. (A) Total thymocytes from 4-week-old mice analyzed by Southern blot hybridization to a TCR Cβ2 probe. Genotypes are as indicated, and size standards are in kilobases. Some but not all of the SCL LMO1 mice in this experiment show discrete rearranged fragments, reflecting marked clonal expansion. (B) The clonal populations become more pronounced with age. Total thymocytes from mice at 4, 8, or 12 weeks of age were analyzed by Southern blot hybridization to a TCR Cβ2 probe. Increasing prominence of one or several clonal rearranged fragments is seen at 8 and 12 weeks compared to 4 weeks.
Abnormal T-cell development in SCL LMO1 double-transgenic mice prior to the onset of malignancy.
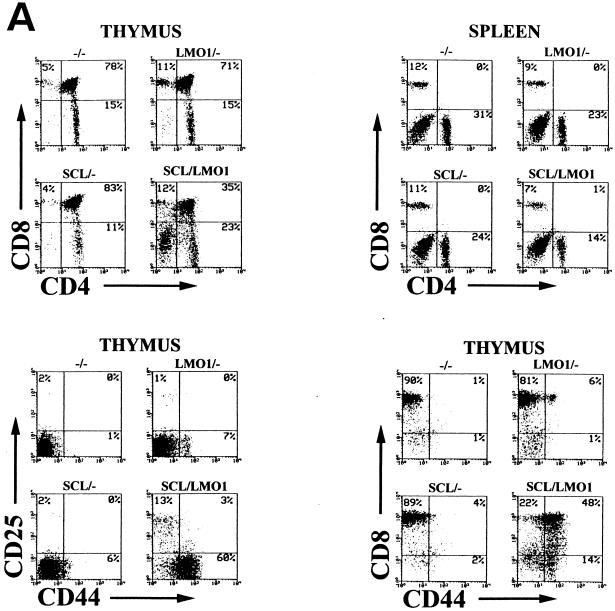
We performed T-cell subset analysis on total thymocytes and splenocytes from mice at 4, 8, 10, and 12 weeks of age. As shown in Fig. 5A, while the three control genotypes showed a normal pattern of thymocyte differentiation at 4 weeks of age, with 75 to 90% CD4+ CD8+ cells, thymocytes from SCL LMO1 mice showed a marked decrease in the CD4+ CD8+ population and an increase in the CD4− CD8− population. These results were quite reproducible (Table 2) at this age, and newborn mice showed similar findings (data not shown). The increase in CD4− CD8− cells is in good agreement with the increased cellular density of the subcapsular region seen in thymi from the double-transgenic mice (Fig. 3). Furthermore, there was a dramatic expansion of the number of primitive (CD44+ CD25−) T cells in the thymus from 4-week-old SCL LMO1 mice (Fig. 5A). Interestingly, although normal thymus never shows a substantial number of CD44+ CD8+ cells, thymocytes from SCL LMO1 mice show a large number of cells with this unusual immunophenotype at 4 to 5 weeks of age, suggesting a disordered pattern of T-cell maturation in the SCL LMO1 mice. These CD44+ CD8+ cells were largely (90% ± 3%; n = 5 mice) TCRβ−, suggesting that they represented immature thymocytes aberrantly expressing CD8, as opposed to mature thymocytes that had acquired CD44. There were fewer mature CD4+ CD8− and CD4− CD8+ T cells in the spleens from SCL LMO1 mice compared to the control genotypes; this difference was significant (P < 0.01) for the CD4− CD8+ population but not significant for the CD4+ CD8− population (P > 0.05).
FIG. 5.
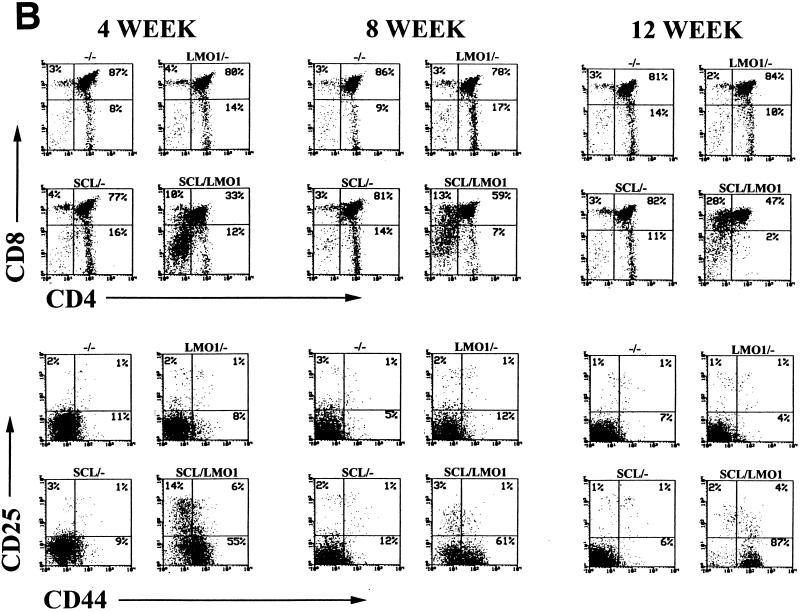
Aberrant T-cell development reflected by immunophenotype. (A) Total thymocytes or splenocytes from 4-week-old mice stained with the indicated antibodies. The percent positivity and genotype are as indicated. Distinct, abnormal populations are seen in the SCL LMO1 transgenic mice (see the text). (B) Evolution of abnormal thymocyte populations with time. Total thymocytes from mice at 4, 8, or 12 weeks of age were stained with the indicated antibodies and analyzed as described in the text.
TABLE 2.
Thymocyte subset analysis of 4- to 5-week-old micea
| Genotype | No. of mice | % Positive for:
|
|||
|---|---|---|---|---|---|
| CD4+ CD8+ | CD4+ CD8− | CD4− CD8+ | CD4− CD8− | ||
| −/− | 11 | 78 ± 10 | 17 ± 9 | 4 ± 2 | 2 ± 1 |
| LMO1/− | 10 | 82 ± 5 | 13 ± 5 | 3 ± 1 | 2 ± 1 |
| SCL/− | 13 | 79 ± 11 | 16 ± 10 | 3 ± 2 | 2 ± 1 |
| SCL/LMO1 | 17 | 49 ± 12* | 12 ± 6 | 12 ± 5* | 26 ± 11* |
Asterisks indicate a P value of <0.001 compared to −/− control thymocytes. Values shown are the mean percent positive ± the standard deviation of the indicated number of mice.
These immunophenotypic abnormalities in T-cell subsets progressed with time. As shown in Fig. 5B, a substantial fraction of thymocytes from the SCL LMO1 mice begin to acquire CD8 but not CD4. These CD8+ CD4− thymocytes resemble immature thymocytes in that less than half are TCRβ+ (49% ± 17%), as opposed to the CD8+ CD4− thymocytes from nontransgenic control mice, which are mostly TCRβ+ (86% ± 5%), a finding typical of normal mature CD8+ CD4− T cells. Simultaneously, the fraction of CD44+ CD25− cells begins to increase in the thymocytes from SCL LMO1 mice. Concomitant with these changes, a clonal or oligoclonal T-cell population begins to emerge (Fig. 4B), and the total number of thymocytes begins to increase in SCL LMO1 mice; by 12 weeks the total number of thymocytes is similar to the thymocyte number in the control samples. We interpret this increase in T-cell number at 12 weeks not to be the result of some homeostatic process but rather to be due to the expansion of a malignant clone on a background of abnormal T-cell differentiation.
It has previously been reported that transgenic mice that ectopically express LMO2 under control of a CD2 promoter show an increase in the number of CD4− CD8− thymocytes between 3 and 6 months of age (27). Consistent with that observation, we noted that one of seven 8- to 12-week-old mice that were positive for LMO1 showed an increase (18% of total thymocytes) only in the CD4− CD8− population, while in the other six mice 1 to 5% of the total thymocytes were CD4− CD8−.
Both leukemic thymocytes and thymocytes from asymptomatic mice generate T-cell malignancies in nude mice.
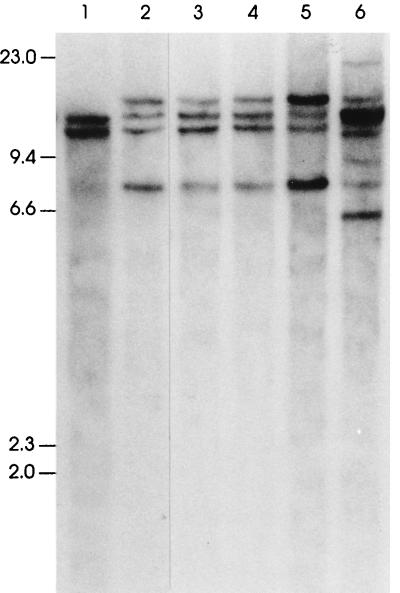
We previously demonstrated that SCL LMO1 mice developed an aggressive, highly penetrant, form of T-cell leukemia/lymphoma at a mean age of 18 weeks (2). Mice with these T-cell malignancies displayed profound lymphadenopathy, massive hepatosplenomegaly, and widespread organ infiltration, as found with the human disease. To determine whether the T-cell malignancies which developed in the SCL LMO1 mice could be transplanted, we injected T lymphoblasts harvested from SCL LMO1 mice with frankly invasive disease (i.e., profound lymphadenopathy, massive hepatosplenomegaly, and widespread organ infiltration) into athymic nude mice. As anticipated, these T lymphoblasts rapidly caused fatal T-cell malignancies in the recipient mice when injected by either the intraperitoneal or subcutaneous route (Table 3). The injection of thymocytes harvested from asymptomatic 12-week-old SCL LMO1 mice also led to T-cell leukemia in the recipient mice when injected intraperitoneally. Of note, the thymocytes injected intraperitoneally seemed to “home” in on the thymic rudiment and lymph nodes; when sacrificed, the nude mice had large tumor masses in the mediastinum and smaller tumor masses in the axillary and inguinal regions, but they did not have significant ascitic fluid. Additionally, as shown in Fig. 6, although an oligoclonal population of T cells was injected into the nude mice, either a single clone with a biallelic TCRβ rearrangement or two clones with monoalleleic TCRβ rearrangements emerged in the frank malignancy. Interestingly, thymocytes from four different 4-week-old SCL LMO1 mice did not generate T-cell malignancies despite an observation period of >32 weeks, and only one of four independent SCL LMO1 thymocyte samples from 8-week-old mice generated T-cell malignancies in recipient nude mice.
TABLE 3.
Tumorigenicity of SCL LMO1 thymocytes in nude micea
| Cells injected (age [wks]) | Route | n | Tumors | Time inter-val (wks) |
|---|---|---|---|---|
| SCL LMO1 leukemic cells | s.c. | 1 | 1 | 3 |
| SCL LMO1 leukemic cells | i.p. | 2 | 2 | 3 |
| Normal thymocytes (12) | s.c. | 1 | 0 | >32 |
| Normal thymocytes (12) | i.p. | 1 | 0 | >32 |
| SCL LMO1 thymocytes (12) | s.c. | 2 | 0 | >32 |
| SCL LMO1 thymocytes (12) | i.p. | 2 | 2 | 3–7 |
| Normal thymocytes (8) | i.p. | 3 | 0 | >32 |
| SCL LMO1 thymocytes (8) | i.p. | 4 | 1 | 19 |
| Normal thymocytes (4) | i.p. | 2 | 0 | >32 |
| SCL LMO1 thymocytes (4) | i.p. | 4 | 0 | >32 |
Cells were injected by either the subcutaneous (s.c.) or the intraperitoneal (i.p.) route. Data under the heading n are numbers of mice that were injected; data under the heading Tumors are numbers of mice that developed T-cell tumors. Time intervals of 3 to 19 weeks refer to the time between the injection and tumor development; a period of “>32” weeks refers to mice observed for at least 32 weeks that did not develop disease.
FIG. 6.
A single clone emerges from an abnormal, oligoclonal population. Total thymocytes from a 12-week-old SCL LMO1 transgenic mouse were injected into a nude mouse. SstI-digested genomic DNA from nude mouse tail (lane 1) and resultant tumor masses (lanes 2 to 5 reflecting four discrete axillary, inguinal, and mediastinal lymph nodes) as well as the original thymocytes injected (lane 6) were analyzed for clonal TCRβ gene rearrangements as described in the legend to Fig. 4. Six rearranged fragments representing three to six independent clones are seen in the original thymocyte sample; only two rearranged fragments (of 7.5 and 15.0 kb), likely representing a single clone, are seen in the four discrete tumor masses.
Mice transgenic for a full-length SCL and LMO1 also develop T-cell leukemia.
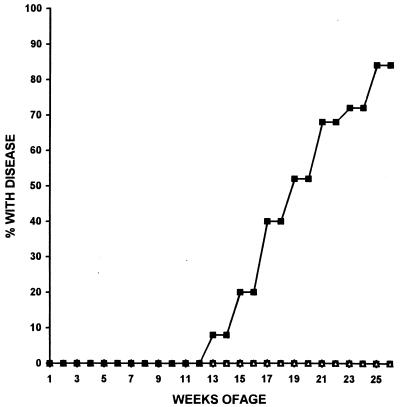
All of the experiments described above used a truncated form of the SCL protein which lacked the amino-terminal activation domain. To determine whether mice transgenic for a full-length SCL protein and LMO1 would also develop T-cell leukemia preceded by abnormal T-cell differentiation, we crossed mice transgenic for a full-length SCL protein (line A4 of reference 2) with mice transgenic for LMO1. Mice were sacrificed when they displayed obvious morbidity (tachypnea, massive lymphadenopathy, and lethargy). As shown in Fig. 7, mice transgenic for both a full-length SCL protein and LMO1 developed aggressive T-cell leukemia/lymphoma with a high degree of penetrance, generally within 6 months. These T-cell malignancies were indistinguishable from those seen in animals transgenic for the truncated form of SCL in terms of frequency, age of onset, immunophenotype, pattern of spread, or clonality (as assessed by clonal TCRβ gene rearrangements) (data not shown). Of the four SCL LMO1 double-positive mice who did not develop T-cell malignancies during the 6-month study period, three developed tumors at between 6 and 8 months. Similar to thymocytes from 4- to 5-week-old mice transgenic for the truncated SCL and LMO1, thymocytes from mice transgenic for the full-length SCL and LMO1 were fewer in number than in controls, with an increased fraction of CD4− CD8− cells and oligoclonal TCRβ gene rearrangements (data not shown).
FIG. 7.
Cumulative incidence of leukemia/lymphoma in mice transgenic for LMO1 and a full-length SCL. Genotypes are represented as follows: ▵, −/−; ○, SCL/−; □, LMO1/−; and ■, SCL LMO1. The cumulative percentage of SCL LMO1 mice (n = 25) with T-cell leukemia/lymphoma is plotted versus time. None of the nontransgenic controls (n = 23) or littermates positive for only SCL (n = 14) or only LMO1 (n = 17) developed disease during the 6-month study period.
SCL LMO1 transgenic mice show parallels with E2A null mice.
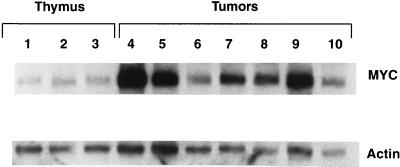
It has recently been demonstrated that mice deficient for E2A develop aggressive T-cell leukemia/lymphoma early in life, preceded by abnormal T-cell differentiation (5, 48). The age of onset, the degree of disease penetrance, and the pattern of spread, as well as the decreased number of total thymocytes and increased numbers of CD4− CD8− cells during a premalignant, asymptomatic phase seen in these E2A-deficient mice are quite similar to our findings with SCL LMO1 mice. Since SCL and LMO1 are known to form a complex with E2A (46), it seems plausible that SCL and LMO1 might exert their oncogenic action by sequestration of E2A, leading to a functional E2A deficiency. If this model is correct, both the premalignant and malignant thymocytes from SCL LMO1 mice might show additional similarities with thymocytes from E2A-deficient mice. The T-cell malignancies which developed in E2A-deficient mice showed increased levels of c-myc mRNA; this was potentially due to an increased c-myc copy number (5). Figure 8 shows that most of the T-cell malignancies which developed in SCL LMO1 mice overexpressed c-myc; however, Southern blot analysis showed no evidence of obvious c-myc gene amplification in the tumors from SCL LMO1 mice (data not shown).
FIG. 8.
c-myc overexpression in SCL LMO1 tumors. Total RNA from three control thymus samples obtained from 4-month-old nontransgenic animals, along with seven tumor samples, was analyzed by Northern blot hybridization to a c-myc probe. An actin hybridization signal was used as a loading control. Various degrees of c-myc overexpression can be detected in all of the samples compared to controls.
SCL inhibition of E2A is potentiated by LMO1.
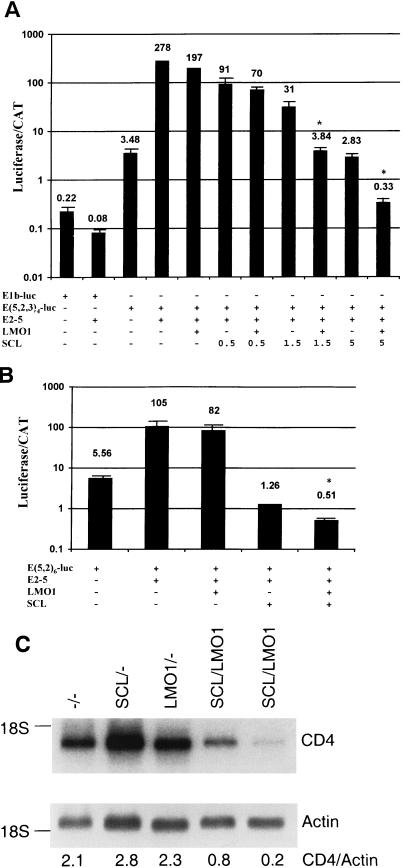
In vitro studies have shown that the expression of SCL can interfere with the expression of reporter genes driven by E-box elements (34, 45). To determine whether LMO1 could increase the ability of SCL to inhibit E2A function, we transfected NIH 3T3 fibroblasts with the E(5,2,3)4-luc reporter vector, the pCE2-5 expression vector, and the pCLMO1 expression vector in conjunction with increasing amounts of the pCSCL expression vector. Figure 9A shows that while LMO1 has a minimal effect on E-box-regulated luciferase transcription (a 30% decrease), SCL dramatically inhibits (ca. 100-fold) the ability of E2A to drive the transcription of luciferase from E-box elements. Furthermore, although not apparent when smaller amounts of SCL (0.5 μg of vector) were used, LMO1 clearly (>8-fold) augmented the ability of SCL to inhibit E-box-regulated transcription when larger amounts (1.5 and 5 μg) of the SCL expression vector were transfected. We obtained similar results with the E (5,2)6-luc construct (Fig. 9B). In addition, since E proteins have been shown to regulate CD4 expression (40), we evaluated CD4 expression in thymocytes from 4-week-old SCL LMO1 mice and controls. As shown in Fig. 9C, CD4 expression was reduced between 2.5- and 10-fold in the SCL LMO1 thymocytes compared to controls.
FIG. 9.
Cooperative effect of SCL and LMO1 on E-box-mediated transcription. (A) NIH 3T3 cells were transfected with the indicated constructs in triplicate, along with an internal transfection control (pCAT Control; Promega); 5 μg of all expression vectors was used unless otherwise indicated. The values presented are the means ± the standard deviation of relative luciferase units, divided by the counts per minute (CAT activity) to control for transfection efficiency; in some cases, the standard deviation bars are too small to be seen. The data are plotted on a logarithmic scale, and the values for each triplicate are shown above the data bars. An asterisk indicates a significant difference (P < 0.001) between the transfections with SCL alone and those with LMO1 and SCL. The entire experiment was repeated once with similar results. (B) The experiment was performed and the data are presented as described for panel A, except that E(5,2)-luc was used as the reporter vector. (C) Expression of CD4 is decreased in thymocytes from SCL LMO1 mice. Ten micrograms of total RNA were assayed for CD4 expression by Northern blotting; actin was used as a loading control. The genotypes are as indicated, and the ratios of CD4 to actin signals are shown below each lane.
DISCUSSION
We have previously shown that an amino-terminal truncated form of SCL, which lacks the SCL transactivation domain, can cooperate with LMO1 to induce T-cell leukemia/lymphoma at a young age and with a high degree of penetrance (2). Given that SCL is the gene most frequently activated by chromosomal rearrangements in T-ALL patients (6, 35), it seems likely that the T-cell leukemia/lymphoma which develops in these mice provides a useful model of the human disease. In this report, we identify abnormalities of T-cell development in terms of total thymocyte number, T-cell subsets, proliferation indices, apoptosis, and thymic architecture prior to the onset of a frank malignancy in SCL LMO1 double-transgenic mice. In addition, we show that mice transgenic for LMO1 and a full-length SCL protein display a similar pattern of abnormal T-cell development prior to the development of a full-fledged T-cell leukemia/lymphoma and that the T-cell malignancies which develop in these mice are indistinguishable from those that develop in mice that overexpress the truncated form of SCL in terms of disease penetrance, age of onset, and clinical presentation. These observations reinforce the notion that the SCL transactivation domain is not involved in leukemogenesis.
Prior to the onset of leukemia/lymphoma, we noted a number of differences, both anticipated and unanticipated, between thymocytes isolated from SCL LMO1 mice and thymocytes isolated from control mice. As expected, we noted evolution of a clonal population in SCL LMO1 mice at 4 weeks of age, as evidenced by oligoclonal TCRβ gene rearrangements. With time, the oligoclonal TCRβ rearrangements became more prominent, suggesting the selection of one or a few distinct thymocyte clones. Unexpectedly, we noted that thymi from 4- to 5-week-old SCL LMO1 mice were consistently smaller and contained fewer total thymocytes than thymi from control mice. Despite a decreased number of total thymocytes, there was an increase in the number of thymocytes in the S and G2 phases of the cell cycle, suggesting an increased proliferative rate. The most likely explanation for this apparent paradox (decreased total number of thymocytes despite an increase in proliferative index) is the observation that thymocytes from SCL LMO1 mice died more quickly (Fig. 2, top). These findings are reminiscent of those seen with thymocytes from E2A-PBX1 transgenic mice, which also show increased rates of both proliferation and apoptosis prior to the onset of a frank malignancy (16).
Malignant T cells from the leukemia/lymphoma that developed in these transgenic mice were easily transferred to immune-deficient nude mice, by either the subcutaneous or intraperitoneal route, and led to rapid development of a widespread leukemia/lymphoma within 3 weeks. However, our data indicate that although there is clonal predominance detected in the thymocyte population of SCL LMO1 mice as early as 4 weeks of age, these thymocytes were unable to generate malignancies in nude mice. Thymocytes isolated from asymptomatic 12-week-old SCL LMO1 mice formed tumors in nude mice, and one of four thymocyte populations isolated from 8-week-old SCL LMO1 mice led to T-cell malignancies in nude mice. Therefore, it seems that the development of sufficient numbers of transplantable, fully malignant thymocytes occurs gradually between 4 and 12 weeks of age.
In addition to the changes in thymocyte number, proliferative index, tumorigenicity, and clonality, we noted distinct disturbances of thymocyte development, as evidenced by T-cell subset analysis. Normally, the most immature thymocytes are CD44+ CD25−; these thymocytes then acquire CD25, begin to rearrange their TCRβ genes, and subsequently lose expression of CD44 and CD25 to become CD44− CD25− cells. These cells (which are also negative for CD4 and CD8, so-called “double-negative” or DN thymocytes) then begin to express higher levels of TCRβ and acquire CD4 and CD8 (“double-positive” or DP thymocytes). The CD4+ CD8+ cells, which are typically 75 to 85% of the total thymocytes in a young mouse, proceed to lose either CD4 or CD8 and leave the thymus as mature CD4+ CD8− or CD4− CD8+ T cells.
Previously, investigators have noted an increase in CD4− CD8− thymocytes at 3 to 6 months of age in a subset of transgenic animals which overexpressed LMO2 (28, 32), although neither of those reports noted a decrease in total thymocyte number. This increase in CD4− CD8− thymocytes was accentuated in mice which overexpressed both LMO2 and SCL (27). In our studies, we did not see any consistent differences in terms of thymocyte numbers, subsets, proliferative index, or clonality in LMO1 transgenic mice of up to 12 weeks of age, although one of seven LMO1-only transgenic mice showed a modestly increased fraction (18%) of CD4− CD8− thymocytes. We noted a significant decrease in the relative and absolute numbers of CD4+ CD8+ thymocytes from 4-week-old mice positive for both LMO1 and SCL, with an increase in the numbers of CD4− CD8− thymocytes. In addition, we noted a dramatic increase in the numbers of immature CD44+ CD25− cells at this age. Lastly, we noted the consistent presence of an abundant population of unusual CD44+ CD8+ TCRβ− cells in the thymus from SCL LMO1 mice. Since normal thymocytes typically lose CD44 expression prior to acquiring CD8 expression, the presence of an abundant number of CD44+ CD8+ TCRβ− cells is an additional marker for this type of disordered thymocyte development.
The SCL LMO1 thymocyte population underwent a number of immunophenotypic changes with time, with a decrease in the number of more mature CD44− CD25+ and CD44− CD25− cells and an increase in the percentage of immature CD44+ CD25− cells, such that almost 90% of the thymocytes at 12 weeks of age were CD44+ CD25− (Fig. 3), a finding consistent with the observation that the T-cell malignancies which developed in the SCL LMO1 mice were CD44+ (data not shown). We noted a consistent, gradual increase in the percentage of cells positive for CD8 in the thymi of SCL LMO1 mice. This increase was due to the emergence of an unusual CD8+ CD4− population that remained in the thymus, in contrast to the typical mature CD8+ CD4− cell which leaves the thymus. Additionally, the evolution of this CD8+ CD4− population corresponded with the emergence of a prominent clonal population of thymocytes, as evidenced by clonal TCRβ gene rearrangements. From a T-cell developmental point of view, these data are most consistent with a population of thymocytes unable to easily mature from the CD4− CD8− stage to the CD8+ CD4+ stage, even though they rearrange and express TCRβ, leading to marked decreases in both total thymocyte number as well as the number of CD4+ CD8+ thymocytes. With time, superimposed on these developmental abnormalities is the evolution of a fully malignant T lymphocyte, with a resultant increase in total thymocyte number due to the predominance of one or a few clones.
In vitro studies have shown that expression of SCL can interfere with the expression of reporter genes driven by E-box elements (34, 45). We have shown that simultaneous SCL and LMO1 expression leads to a greater degree of E2A inhibition than SCL alone (Fig. 9). In addition, the expression of CD4, a gene which is regulated, at least in part, by E2A (40), is decreased in thymocytes from SCL LMO1 mice compared to thymocytes from control mice. Similarly, a number of similarities exist between these results with SCL LMO1 mice and those reported for E2A-deficient mice (5, 48), supporting the notion that SCL, in collaboration with LMO1, can interfere with E2A function in vivo. Although most E2A-deficient mice die shortly after birth, two groups have recently shown that E2A-deficient mice which survive longer than 3 months have a high incidence of T-cell leukemia/lymphoma (5, 48). Like the SCL LMO1 mice, E2A-deficient mice have a significant decrease in total thymocyte number at 4 to 8 weeks of age and an increased proportion of the immature CD44+ 25− subset. Additionally, tumors from the SCL LMO1 mice overexpressed c-myc, similar to tumors from E2A-deficient mice. Taken together, these observations support the hypothesis that SCL exerts its leukemogenic action through a partial, functional inactivation of E2A and/or the related E protein HEB.
Four of the genes most commonly activated by chromosomal translocation in patients with T-ALL are SCL, LMO1 (or the closely related LMO2), HOX11, and TAN (a human homologue of notch) (35, 43). In addition, TAL2 and LYL1, bHLH proteins with bHLH regions highly similar to that of SCL are also activated by chromosomal translocations in T-ALL patients (43). It seems reasonable to suggest that SCL and LMO1 exert their oncogenic effect, at least in part, through a functional inactivation of E2A and/or HEB and that the closely related TAL2 and LYL1 proteins are leukemogenic through a similar mechanism. In this context, it is intriguing that TAN1 may also act through inactivation of E2A. A recent report has demonstrated that activated notch proteins can inhibit E2A function (33) and that overexpression of an activated notch protein in the thymus leads to disordered T-cell development, with an increase in CD8+ CD4− cells and a corresponding decrease in CD4+ CD8− cells (38).
We have demonstrated premalignant developmental abnormalities in terms of thymocyte number, immunophenotype, proliferative index, tumorigenicity, clonality, and thymic architecture, abnormalities which inexorably progress to an aggressive T-cell leukemia/lymphoma in mice transgenic for both SCL and LMO1. These developmental abnormalities are reminiscent of those seen in mice deficient for E2A. In light of in vitro data which demonstrate binding between SCL and the E proteins E2A or HEB, it seems possible that SCL might exert its leukemogenic effect through a functional inactivation of E2A or HEB. Therefore, it is possible that a majority of human T-ALL develops through inactivation of E2A and/or HEB, two genes which have not been reported to be disrupted in T-ALL patients.
ACKNOWLEDGMENTS
We thank Anne Croy and Ilan Kirsch for helpful discussions, Elana Greco for artwork, and Betsy Repasky for assistance with the histologic techniques.
This study was supported in part by grants from the National Institutes of Health (CA16056, CA73773, and CA63333), the Association for Research of Childhood Cancer, and the Lady Tata Memorial Trust. P.D.A. is a scholar of the Leukemia Society of America.
REFERENCES
- 1.Aplan P D, Begley C G, Bertness V, Nussmeier M, Ezquerra A, Coligan J, Kirsch I R. The SCL gene is formed from a transcriptionally complex locus. Mol Cell Biol. 1990;10:6426–6435. doi: 10.1128/mcb.10.12.6426. [DOI] [PMC free article] [PubMed] [Google Scholar]
- 2.Aplan P D, Jones C A, Chervinsky D S, Zhao X, Ellsworth M, Wu C, McGuire E A, Gross K W. An scl gene product lacking the transactivation domain induces bony abnormalities and cooperates with LMO1 to generate T-cell malignancies in transgenic mice. EMBO J. 1997;16:2408–2419. doi: 10.1093/emboj/16.9.2408. [DOI] [PMC free article] [PubMed] [Google Scholar]
- 3.Aplan P D, Lombardi D P, Ginsberg A M, Cossman J, Bertness V I, Kirsch I R. Disruption of the human SCL locus by “illegitimate” V-(D)-J recombinase activity. Science. 1990;250:1426–1429. doi: 10.1126/science.2255914. [DOI] [PubMed] [Google Scholar]
- 4.Aplan P D, Lombardi D P, Kirsch I R. Structural characterization of SIL, a gene frequently disrupted in T-cell acute lymphoblastic leukemia. Mol Cell Biol. 1991;11:5462–5469. doi: 10.1128/mcb.11.11.5462. [DOI] [PMC free article] [PubMed] [Google Scholar]
- 5.Bain G, Engel I, Robanus-Maandag E C, te Riele H P, Voland J R, Sharp L I, Chun J, Huey B, Pinkel D, Murre C. E2A deficiency leads to abnormalities in α/β T-cell development and to rapid development of T-cell lymphomas. Mol Cell Biol. 1997;17:4782–4791. doi: 10.1128/mcb.17.8.4782. [DOI] [PMC free article] [PubMed] [Google Scholar]
- 6.Bash R O, Crist W M, Shuster J J, Link M P, Amylon M, Pullen J, Carroll A J, Buchanan G R, Smith R G, Baer R. Clinical features and outcome of T-cell acute lymphoblastic leukemia in childhood with respect to alterations at the TAL1 locus: a Pediatric Oncology Group study. Blood. 1993;81:2110–2117. [PubMed] [Google Scholar]
- 7.Bash R O, Hall S, Timmons C F, Crist W M, Amylon M, Smith R G, Baer R. Does activation of the TAL1 gene occur in a majority of patients with T-cell acute lymphoblastic leukemia? A Pediatric Oncology Group study. Blood. 1995;86:666–676. [PubMed] [Google Scholar]
- 8.Begley C G, Aplan P D, Davey M P, Nakahara K, Tchorz K, Kurtzberg J, Hershfield M S, Haynes B F, Cohen D I, Waldmann T A, Kirsch I R. Chromosomal translocation in a human leukemic stem-cell line disrupts the T-cell antigen receptor delta-chain diversity region and results in a previously unreported fusion transcript. Proc Natl Acad Sci USA. 1989;86:2031–2035. doi: 10.1073/pnas.86.6.2031. [DOI] [PMC free article] [PubMed] [Google Scholar]
- 9.Begley C G, Aplan P D, Denning S M, Haynes B F, Waldmann T A, Kirsch I R. The gene SCL is expressed during early hematopoiesis and encodes a differentiation-related DNA-binding motif. Proc Natl Acad Sci USA. 1989;86:10128–10132. doi: 10.1073/pnas.86.24.10128. [DOI] [PMC free article] [PubMed] [Google Scholar]
- 10.Brown L, Cheng J T, Chen Q, Siciliano M J, Crist W, Buchanan G, Baer R. Site-specific recombination of the tal-1 gene is a common occurrence in human T cell leukemia. EMBO J. 1990;9:3343–3351. doi: 10.1002/j.1460-2075.1990.tb07535.x. [DOI] [PMC free article] [PubMed] [Google Scholar]
- 11.Burd R, Dziedzic T S, Xu Y, Caligiuri M A, Subjeck J R, Repasky E A. Tumor cell apoptosis, lymphocyte recruitment and tumor vascular changes are induced by low temperature, long duration (fever-like) whole body hyperthermia. J Cell Physiol. 1998;177:137–147. doi: 10.1002/(SICI)1097-4652(199810)177:1<137::AID-JCP15>3.0.CO;2-A. [DOI] [PubMed] [Google Scholar]
- 12.Chen Q, Cheng J T, Tasi L H, Schneider N, Buchanan G, Carroll A, Crist W, Ozanne B, Siciliano M J, Baer R. The tal gene undergoes chromosome translocation in T cell leukemia and potentially encodes a helix-loop-helix protein. EMBO J. 1990;9:415–424. doi: 10.1002/j.1460-2075.1990.tb08126.x. [DOI] [PMC free article] [PubMed] [Google Scholar]
- 13.Cheng J T, Hsu H L, Hwang L Y, Baer R. Products of the TAL1 oncogene: basic helix-loop-helix proteins phosphorylated at serine residues. Oncogene. 1993;8:677–683. [PubMed] [Google Scholar]
- 14.Collazo-Garcia N, Scherer P, Aplan P D. Cloning and characterization of a murine SIL gene. Genomics. 1995;30:506–513. doi: 10.1006/geno.1995.1271. [DOI] [PubMed] [Google Scholar]
- 15.Condorelli G L, Facchiano F, Valtieri M, Proietti E, Vitelli L, Lulli V, Huebner K, Peschle C, Croce C M. T-cell-directed TAL-1 expression induces T-cell malignancies in transgenic mice. Cancer Res. 1996;56:5113–5119. [PubMed] [Google Scholar]
- 16.Dedera D A, Waller E K, LeBrun D P, Sen-Majumdar A, Stevens M E, Barsh G S, Cleary M L. Chimeric homeobox gene E2A-PBX1 induces proliferation, apoptosis, and malignant lymphomas in transgenic mice. Cell. 1993;74:833–843. doi: 10.1016/0092-8674(93)90463-z. [DOI] [PubMed] [Google Scholar]
- 17.Elefanty A G, Begley C G, Metcalf D, Barnett L, Kontgen F, Robb L. Characterization of hematopoietic progenitor cells that express the transcription factor scl, using a lacZ knock-in strategy. Proc Natl Acad Sci USA. 1997;95:11897–11902. doi: 10.1073/pnas.95.20.11897. [DOI] [PMC free article] [PubMed] [Google Scholar]
- 18.Finger L R, Kagan J, Christopher G, Kurtzberg J, Hershfield M S, Nowell P C, Croce C M. Involvement of the TCL5 gene on human chromosome 1 in T-cell leukemia and melanoma. Proc Natl Acad Sci USA. 1989;86:5039–5043. doi: 10.1073/pnas.86.13.5039. [DOI] [PMC free article] [PubMed] [Google Scholar]
- 19.Fitzgerald T J, Neale G A, Raimondi S C, Goorha R M. c-tal, a helix-loop-helix protein, is juxtaposed to the T-cell receptor-beta chain gene by a reciprocal chromosomal translocation: t(1;7)(p32;q35) Blood. 1991;78:2686–2695. [PubMed] [Google Scholar]
- 20.Gering M, Rodaway A R F, Gottgens B, Patient R K, Green A R. The scl gene specifies haemangioblast development from early mesoderm. EMBO J. 1998;17:4029–4045. doi: 10.1093/emboj/17.14.4029. [DOI] [PMC free article] [PubMed] [Google Scholar]
- 21.Goldfarb A N, Goueli S, Mickelson D, Greenberg J M. T-cell acute lymphoblastic leukemia—the associated gene SCL/tal codes for a 42-Kd nuclear phosphoprotein. Blood. 1992;80:2858–2866. [PubMed] [Google Scholar]
- 22.Goldfarb A N, Lewandowska K, Shoham M. Determinants of helix-loop-helix dimerization affinity. Random mutational analysis of SCL/tal. J Biol Chem. 1996;271:2683–2688. doi: 10.1074/jbc.271.5.2683. [DOI] [PubMed] [Google Scholar]
- 23.Grutz G G, Bucher K, Lavenir I, Larson T, Larson R, Rabbitts T. The oncogenic T cell LIM-protein LMO2 forms part of a DNA-binding complex specifically in immature T cells. EMBO J. 1998;17:4594–4605. doi: 10.1093/emboj/17.16.4594. [DOI] [PMC free article] [PubMed] [Google Scholar]
- 24.Hsu H L, Cheng J T, Chen Q, Baer R. Enhancer-binding activity of the tal-1 oncoprotein in association with the E47/E12 helix-loop-helix proteins. Mol Cell Biol. 1991;11:3037–3042. doi: 10.1128/mcb.11.6.3037. [DOI] [PMC free article] [PubMed] [Google Scholar]
- 25.Hsu H L, Huang L, Tsan J T, Funk W, Wright W E, Hu J S, Kingston R E, Baer R. Preferred sequences for DNA recognition by the TAL1 helix-loop-helix proteins. Mol Cell Biol. 1994;14:1256–1265. doi: 10.1128/mcb.14.2.1256. [DOI] [PMC free article] [PubMed] [Google Scholar]
- 26.Kelliher M A, Seldin D C, Leder P. Tal-1 induces T cell acute lymphoblastic leukemia accelerated by casein kinase IIalpha. EMBO J. 1996;15:5160–5166. [PMC free article] [PubMed] [Google Scholar]
- 27.Larson R C, Lavenir I, Larson T A, Baer R, Warren A J, Wadman I, Nottage K, Rabbitts T H. Protein dimerization between Lmo2 (Rbtn2) and Tal1 alters thymocyte development and potentiates T cell tumorigenesis in transgenic mice. EMBO J. 1996;15:1021–1027. [PMC free article] [PubMed] [Google Scholar]
- 28.Larson R C, Osada H, Larson T A, Lavenir I, Rabbitts T H. The oncogenic LIM protein Rbtn2 causes thymic developmental aberrations that precede malignancy in transgenic mice. Oncogene. 1995;11:853–862. [PubMed] [Google Scholar]
- 29.Lowsky R, Decoteau J F, Reitmair A H, Ichinohasama R, Dong W F, Xu Y, Mak T W, Kadin M E, Minden M D. Defects of the mismatch repair gene Msh2 are implicated in the development of murine and human lymphoblastic lymphomas and are associated with the aberrant expression of rhombotin-2 (Lmo-2) and Tal-1 (Scl) Blood. 1997;89:2276–2282. [PubMed] [Google Scholar]
- 30.McGuire E A, Rintoul C E, Sclar G M, Korsmeyer S J. Thymic overexpression of Ttg-1 in transgenic mice results in T-cell acute lymphoblastic leukemia/lymphoma. Mol Cell Biol. 1992;12:4186–4196. doi: 10.1128/mcb.12.9.4186. [DOI] [PMC free article] [PubMed] [Google Scholar]
- 31.Murre C, McCaw P S, Baltimore D. A new DNA binding and dimerization motif in immunoglobulin enhancer binding, daughterless, MyoD, and myc proteins. Cell. 1989;56:777–783. doi: 10.1016/0092-8674(89)90682-x. [DOI] [PubMed] [Google Scholar]
- 32.Neale G A, Rehg J E, Goorha R M. Ectopic expression of rhombotin-2 causes selective expansion of CD4− CD8− lymphocytes in the thymus and T-cell tumors in transgenic mice. Blood. 1995;86:3060–3071. [PubMed] [Google Scholar]
- 33.Ordentlich P, Lin A, Shen C P, Blaumueller C, Matsuno K, Artavanis-Tsakonas S, Kadesch T. Notch inhibition of E47 supports the existence of a novel signaling pathway. Mol Cell Biol. 1998;18:2230–2239. doi: 10.1128/mcb.18.4.2230. [DOI] [PMC free article] [PubMed] [Google Scholar]
- 34.Park S T, Sun X H. The Tal1 oncoprotein inhibits E47-mediated transcription—mechanism of inhibition. J Biol Chem. 1998;273:7030–7037. doi: 10.1074/jbc.273.12.7030. [DOI] [PubMed] [Google Scholar]
- 35.Rabbitts T H. Chromosomal translocations in human cancer. Nature. 1994;372:143–149. doi: 10.1038/372143a0. [DOI] [PubMed] [Google Scholar]
- 36.Robb L, Lyons I, Li R, Hartley L, Kontgen F, Harvey R P, Metcalf D, Begley C G. Absence of yolk sac hematopoiesis from mice with a targeted disruption of the scl gene. Proc Natl Acad Sci USA. 1995;92:7075–7079. doi: 10.1073/pnas.92.15.7075. [DOI] [PMC free article] [PubMed] [Google Scholar]
- 37.Robb L, Rasko J E, Bath M L, Strasser A, Begley C G. scl, a gene frequently activated in human T cell leukaemia, does not induce lymphomas in transgenic mice. Oncogene. 1995;10:205–209. [PubMed] [Google Scholar]
- 38.Robey E, Chang D, Itano A, Cado D, Alexander H, Lans D, Weinmaster G, Salmon P. An activated form of Notch influences the choice between CD4 and CD8 T cell lineages. Cell. 1996;87:483–492. doi: 10.1016/s0092-8674(00)81368-9. [DOI] [PubMed] [Google Scholar]
- 39.Sanchez-Garcia I, Rabbitts T H. Transcriptional activation by TAL1 and FUS-CHOP proteins expressed in acute malignancies as a result of chromosomal abnormalities. Proc Natl Acad Sci USA. 1994;91:7869–7873. doi: 10.1073/pnas.91.17.7869. [DOI] [PMC free article] [PubMed] [Google Scholar]
- 40.Sawada S, Littman D R. A heterodimer of Heb and an E12-related protein interacts with the CD4 enhancer and regulates its activity in T-cell lines. Mol Cell Biol. 1993;13:5620–5628. doi: 10.1128/mcb.13.9.5620. [DOI] [PMC free article] [PubMed] [Google Scholar]
- 41.Shivdasani R A, Mayer E L, Orkin S H. Absence of blood formation in mice lacking the T-cell leukaemia oncoprotein tal-1/SCL. Nature. 1995;373:432–434. doi: 10.1038/373432a0. [DOI] [PubMed] [Google Scholar]
- 42.Stanulla M, Wang J, Chervinsky D S, Thandla S, Aplan P D. DNA cleavage within the MLL breakpoint cluster region is a specific event which occurs as part of higher-order chromatin fragmentation during the initial stages of apoptosis. Mol Cell Biol. 1997;17:4070–4079. doi: 10.1128/mcb.17.7.4070. [DOI] [PMC free article] [PubMed] [Google Scholar]
- 43.Thandla S, Aplan P D. Molecular biology of acute lymphocytic leukemia. Semin Oncol. 1997;24:45–56. [PubMed] [Google Scholar]
- 44.Visvader J E, Fujiwara Y, Orkin S H. Unsuspected role for the T-cell leukemia protein SCL/tal-1 in vascular development. Genes Dev. 1998;12:473–479. doi: 10.1101/gad.12.4.473. [DOI] [PMC free article] [PubMed] [Google Scholar]
- 45.Voronova A F, Lee F. The E2A and tal-1 helix-loop-helix proteins associate in vivo and are modulated by Id proteins during interleukin 6-induced myeloid differentiation. Proc Natl Acad Sci USA. 1994;91:5952–5956. doi: 10.1073/pnas.91.13.5952. [DOI] [PMC free article] [PubMed] [Google Scholar]
- 46.Wadman I, Li J, Bash R O, Forster A, Osada H, Rabbitts T H, Baer R. Specific in vivo association between the bHLH and LIM proteins implicated in human T cell leukemia. EMBO J. 1994;13:4831–4839. doi: 10.1002/j.1460-2075.1994.tb06809.x. [DOI] [PMC free article] [PubMed] [Google Scholar]
- 47.Wadman I A, Osada H, Grutz G G, Agulnick A D, Westphal H, Forster A, Rabbitts T H. The LIM-only protein Lmo2 is a bridging molecule assembling an erythroid, DNA-binding complex which includes the TAL1, E47, GATA-1 and Ldb1/NLI proteins. EMBO J. 1997;16:3145–3157. doi: 10.1093/emboj/16.11.3145. [DOI] [PMC free article] [PubMed] [Google Scholar]
- 48.Yan W, Young A Z, Soares V C, Kelley R, Benezra R, Zhuang Y. High incidence of T-cell tumors in E2A-null mice and E2A/ld1 double-knockout mice. Mol Cell Biol. 1997;17:7317–7327. doi: 10.1128/mcb.17.12.7317. [DOI] [PMC free article] [PubMed] [Google Scholar]
- 49.Zhao X-F, Aplan P D. The hematopoietic transcription factor SCL binds the p44 subunit of TFIIH. J Biol Chem. 1999;274:1388–1393. doi: 10.1074/jbc.274.3.1388. [DOI] [PubMed] [Google Scholar]


