CELL BIOLOGY Correction for “A set of NF-κB–regulated microRNAs induces acquired TRAIL resistance in Lung cancer,” by Young-Jun Jeon, Justin Middleton, Taewan Kim, Alessandro Laganà, Claudia Piovan, Paola Secchiero, Gerard J. Nuovo, Ri Cui, Pooja Joshi, Giulia Romano, Gianpiero Di Leva, Bum-Kyu Lee, Hui-Lung Sun, Yonghwan Kim, Paolo Fadda, Hansjuerg Alder, Michela Garofalo, and Carlo M. Croce, which was first published June 15, 2015; 10.1073/pnas.1504630112 (Proc. Natl. Acad. Sci. U.S.A. 112, E3355–E3364).
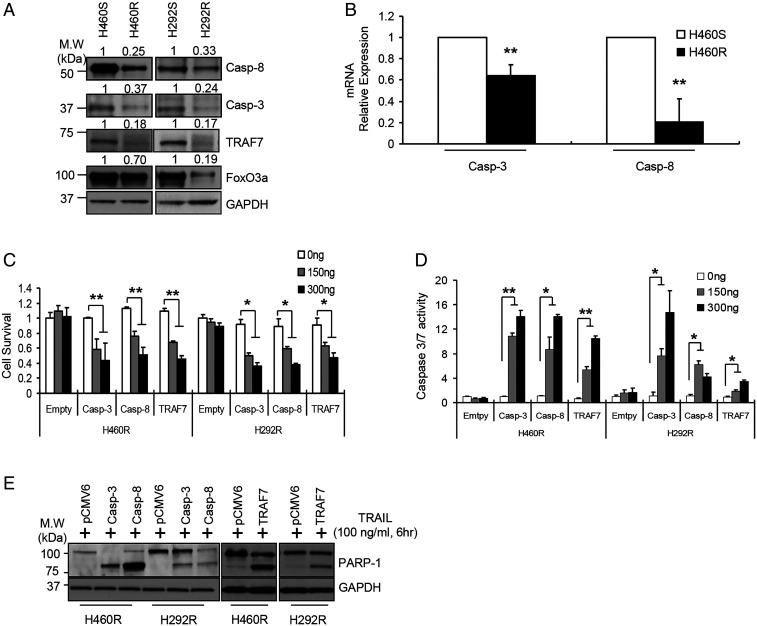
The authors note that “We realized that the images of TRAF7 in H292S/H292R and H460S/H460R in Fig. 3A were duplicated from the same raw image and found the actual TRAF7 in H292S/H292R was on the right next to the TRAF7 band in H460S/H460R based on our raw data image. We believe this duplication happened when we reassembled the western images for manuscript preparation. We made a correction from the original raw data and recalculated band intensities for the new TRAF7 bands. We sincerely apologize for the inconvenience for the readers of PNAS.”
Fig. 3.
Caspase-8, caspase-3, and TRAF-7 overexpression increases sensitivity to TRAIL in cells with acquired resistance. (A) Down-regulation of caspase-8, caspase-3, FoxO3a, and TRAF-7 in TRAIL-resistant cells. The bands were quantified by ImageJ software and the relative values normalized by the value of each GAPDH. (B) qRT-PCR showing caspase-3 and caspase-8 mRNAs down-regulation in H460R compared with H460S cells. (C–E) Proliferation (C), caspase-3/7 assay (D), and Western blot showing PARP-1 cleavage (E) after caspase-3, caspase-8, and TRAF-7 overexpression in TRAIL-resistant cells. Error bars indicate mean ± SD (n = 3) and the P values were calculated by two-tailed Student t test (*P < 0.02, **P < 0.01).
The corrected Fig. 3 and its legend appear below.


