

Abstract
Alzheimer disease (AD) is a progressive neurodegenerative disease causing cognitive decline in the aging population. To develop disease-modifying treatments, understanding the mechanisms behind the pathology is important, which should include observations using human brain samples. We reported previously on the association of lysosomal proteins progranulin (PGRN) and prosaposin (PSAP) with amyloid plaques in non-demented aged control and AD brains. In this study, we investigated the possible involvement of PGRN and PSAP in tangle formation using human brain tissue sections of non-demented aged control subjects and AD cases and compared with cases of frontotemporal dementia with granulin (GRN) mutations. The study revealed that decreased amounts of PGRN and PSAP proteins were detected even in immature neurofibrillary tangles, while colocalization was still evident in adjacent neurons in all cases. Results suggest that neuronal loss of PGRN preceded loss of PSAP as tangles developed and matured. The GRN mutation cases exhibited almost complete absence of PGRN in most neurons, while PSAP signal was preserved. Although based on correlative data, we suggest that reduced levels of PGRN and PSAP and their interaction in neurons might predispose to accumulation of p-Tau protein.
Keywords: Alzheimer disease, Neuropathology, Progranulin, Prosaposin, Tangles
INTRODUCTION
Dementias are a group of irreversible, progressive brain disorders, which are clinically characterized by impairment of cognition, behavior, and activities of daily living. Approximately, 50 million people globally are affected by dementia (1). Alzheimer disease (AD) is the most common form of dementia and imposes a major burden on patients and caregivers. It is pathologically characterized by amyloid beta (Aβ) peptide-containing plaques and neurofibrillary tangles (NFTs) in vulnerable brain regions. In AD, NFT pathology starts in the trans-entorhinal region, progresses to the hippocampus, and then to cortical regions (2–4). The hippocampus and temporal cortical regions are severely affected by NFT; and NFT pathology correlates with cognitive decline in AD (5, 6), while plaque load reaches a plateau earlier in AD and does not increase as dementia worsens (7). Although NFT pathogenesis has been studied for several decades, the exact mechanism for their formation remains elusive. Elucidating how selective neurons develop NFTs is an important question for developing effective treatments for AD.
NFTs are composed of aggregated and hyperphosphorylated tau protein (p-Tau) (8, 9). A number of studies have suggested that the primary events in tangle formation are excess activity of glycogen synthase kinase 3 (GSK3) and p70 S6 kinase, the main tau kinases, and decreased activity of protein phosphatase 2A, the main tau phosphatase (10, 11). However, alternative hypotheses, including defects in lysosomal autophagic and ubiquitin proteasome degradation systems, have also been suggested and identified in AD brains (12, 13). Other hypotheses include the role of transcellular prion-like exosomal transmission and tunneling nanotubes for the accumulation of tau aggregates (14, 15). Ultimately, p-Tau accumulates due to failure of cellular degradative and lysosomal processes to remove them. Neuropathological studies have demonstrated the progressive formation of intracellular p-Tau accumulation starting from pre-tangles to mature tangles, leading to ghost tangles which are the remains of degenerated neurons (3).
Considering that most clinical trials of novel AD-modifying treatments are not showing effectiveness in preventing cognitive decline, greater understanding of the mechanisms behind the pathology, beyond the amyloid hypothesis, are needed to find new potential therapeutic targets. With this in mind, we considered 2 significant lysosomal proteins, progranulin (PGRN) and prosaposin (PSAP), whose dysfunction might enhance tangle pathology formation.
PGRN is a growth factor involved in regulation of multiple functions such as axonal growth, neurite length (16–18), inflammation (18), and particularly lysosomal homeostasis (19). PGRN is encoded by the granulin (GRN) gene, and mutations are highly penetrant causes of frontotemporal dementia (FTD) (20, 21). Mutations in 3 genes (C9ORF72, tau or GRN) are the causes of most forms of FTD (21–25). FTD due to mutations in GRN or C9ORF72 are associated with TDP-43-positive/ubiquitin-positive inclusions (26). FTD cases with heterozygous mutations in GRN have decreased expression of PGRN in neurons and enhanced neuroinflammation due to a deficit of PGRN protein in the brain (20). From these studies, it was concluded that the loss of functional PGRN protein might also be a contributing factor for AD. However, several studies have demonstrated that total levels of PGRN protein are increased in brain tissue regions affected by AD (27, 28). We previously observed that while PGRN was associated with amyloid plaques and in microglia, most mature and ghost NFTs did not show significant PGRN immunoreactivity (27).
The effect of PGRN deficiency on NFT formation has previously been examined by deleting the Grn gene in a mutant tau transgenic mouse model, which resulted in exacerbated tau pathologies due to enhanced activity of cyclin-dependent kinases (29, 31). Deficiency of PGRN in neuronal cell culture models resulted in lysosomal enlargement and accumulation of certain insoluble proteins (19, 31). These results suggested that reduced amounts of PGRN inhibit efficient lysosomal function required for autophagy, promoting the development of NFTs by reducing the proteolytic removal of abnormal or phosphorylated tau.
While most studies of FTD models have focused on PGRN, PGRN and PSAP colocalize extensively in neurons in human brains and should be considered as essential partners (27). PSAP is also lysosomal-associated and potentially neuroprotective (32, 33). It is the precursor to 4 saposin peptides, termed sphingolipid activator proteins (SAP), that assist in the lysosomal hydrolysis of sphingolipids (34). Mutations in the PSAP gene lead to severe lysosomal storage disorders (35, 36). Mutation in the saposin C region of PSAP gene has been linked to α-synuclein accumulation in lysosomes in Parkinson disease cases (37).
Interaction of PGRN and PSAP regulates their lysosomal translocation, cleavage, secretion, and function (38). Both PGRN and PSAP proteins are localized to neuronal lysosomes in brain, where they regulate lysosomal hydrolases. PSAP binds to pro-cathepsin-D (proCathD), and they modulate activation and processing of each other (39). PGRN also binds to proCathD and regulates its maturation and activity. Functional mutation (c.26 C>A, p. A9D) in the GRN gene expressed in iPSC-derived neurons led to impaired processing of PSAP to SAP, glucocerebrosidase (GCase) enzyme deficiency, and lipid and insoluble protein accumulation (40), as well as decreased GCase enzyme activity in mouse tissue expressing this mutation (41). These studies indicated that deficiency of these 2 proteins will influence lysosome degradative function, possibly resulting in accumulation of insoluble proteins.
Based on our study showing PGRN and PSAP accumulation on Aβ plaques, but not with NFTs, the aim of the present study was to measure how PGRN and PSAP and their interactions change with the progressive development of mature and extracellular tangles. Using brain tissue sections from middle temporal gyrus (MTG) and hippocampus of non-demented low plaque, high plaque and AD dementia cases, and superior frontal gyrus from GRN-mutated FTD cases, we identified that PGRN and PSAP immunoreactivities are decreased in NFT-bearing neurons compared to adjacent non-tangle-bearing neurons. The results suggested loss of PGRN preceded loss of PSAP in formation of tangles. Overall, our data might provide further insights into the role of PGRN and PSAP in NFT development in human brain tissue samples.
MATERIALS AND METHODS
Human Brain Tissue Samples
Human brain tissue samples used in this study were obtained from the Banner Sun Health Research Institute Brain and Body Donation Program, Sun City, AZ. The operations of this longitudinal clinicopathological study have been described previously (42). Tissue studies carried out in Japan were approved by Shiga University of Medical Science Ethical Committee (Certificate no. 29-114). Demographic details of cases used in this study are summarized in the Table.
Table.
Detailed Demographic and Diagnostic Description of Individual Cases Used in Study
| ID | Gender | Age/yr | PMI/hr | Last MMSE Test Score | Last MMSE Before Death (months) | APOE4 | In House Classification |
|||||||
|---|---|---|---|---|---|---|---|---|---|---|---|---|---|---|
| Plaque Score (0–15) | Tangle Score (0–15) | Tangle Score for T or H (0–3) | Thal Phase | BRAAK Score | Plaque Density | NIA-Reagan (1997) | NIA-AA (2012) | |||||||
| LP-1 | M | 97 | 2.5 | 29 | 15 | 3/3 | 0.5 | 8 | 1.5 | IV | Sparse | Criteria not met | ||
| LP-2 | F | 103 | 3 | 30 | 7 | 3/3 | 0 | 7.5 | 1.5 | IV | Zero | Criteria not met | ||
| LP-3 | M | 89 | 3.02 | 24 | 2 | 3/3 | 3 | 8 | 1.5 | IV | Sparse | Criteria not met | ||
| LP-4 | F | 93 | 2.33 | 28 | 12 | 3/3 | 5 | 7.5 | 1.5 | Phase 2 (A1) | IV | Frequent | Criteria not met | Low ADNC |
| LP-H | M | 80 | 3.5 | 2/2 | 4.5 | 5 | 0.5 | Phase 2 (A1) | III | Sparse | Criteria not met | |||
| HP-1 | F | 88 | 3.12 | 30 | 20 | 13.5 | 7.5 | 1.5 | III | Frequent | Intermediate | |||
| HP-2 | F | 86 | 2.33 | 29 | 7 | 3/3 | 10 | 8 | 1 | Phase 3 (A2) | IV | Frequent | Criteria not met | Intermediate ADNC |
| HP-3 | F | 82 | 3.17 | 29 | 8 | 2/3 | 11 | 7 | 1.5 | Phase 4 (A3) | IV | Frequent | Criteria not met | Intermediate ADNC |
| HP-4 | F | 101 | 2.57 | 20 | 11 | 3/3 | 11.5 | 7.5 | 1.5 | Phase 3 (A2) | IV | Frequent | Criteria not met | Intermediate ADNC |
| HP-H | M | 91 | 4.25 | 29 | 47 | 2/3 | 15 | 8.5 | 3 | IV | Moderate | Criteria not met | ||
| AD-1 | F | 85 | 3.42 | 2 | 15 | 3/3 | 14 | 15 | 3 | VI | Frequent | High | ||
| AD-2 | M | 77 | 3.62 | 10 | 10 | 3/4 | 15 | 15 | 3 | VI | Frequent | High | ||
| AD-3 | F | 68 | 3.08 | 6 | 9 | 2/2 | 12.5 | 15 | 3 | Phase 5 (A3) | VI | Frequent | High | High ADNC |
| AD-4 | M | 92 | 2 | 19 | 5 | 3/4 | 15 | 13.5 | 3 | Phase 5 (A3) | V | Frequent | High | |
| AD-H | F | 86 | 2.5 | 28 | 55 | 15 | 12.5 | 3 | Phase 5 (A3) | V | Frequent | High | ||
| GRN-1 | M | 54 | 3.33 | 20 | 45 | 3/3 | 0 | 0 | 0 | Phase 0 (A0) | 0 | Zero | Not AD | |
| GRN-2 | M | 55 | 2 | 3/4 | 0 | 1.5 | 1 | Phase 1 (A1) | III | Zero | Not AD | |||
| GRN-3 | F | 56 | 3 | 3/3 | 0 | 1 | 0 | Phase 0 (A0) | I | Zero | Criteria not met | |||
| PS-1 | M | 48 | 2.66 | 5 | 15 | 3/3 | 15 | 15 | 3 | Phase 5 (A3) | VI | Frequent | High | High ADNC |
Brain Tissue Preservation and Fixation
All brains were processed at autopsy in a standardized manner. The median postmortem interval for autopsies in the BBDP was 3.8 hours. After brain removal, the cerebellum and brainstem are separated from the hemispheres, then each brain is sliced in a custom-designed frame into 1-cm-thick coronal slabs. The hemispheres are divided, with the left hemisphere being frozen on dry ice for storage at −80°C, and the right hemisphere being fixed for 48 hours in a neutral-buffered 10% formalin solution. After fixation, the coronal pieces are rinsed and transferred to a phosphate-buffered solution of 15% glycerol/15% ethylene glycol as cryoprotectant. Brain regions used for subsequent studies are dissected from frozen or fixed coronal slices by experienced neuroanatomists.
Neuropathological Diagnosis Criteria
All donated brains received full neuropathological diagnosis including reference to the pre-mortem clinical history of each case. Consensus clinical and neuropathological criteria were used to diagnose AD in these cases. To assess the severity of AD pathology in each case, tissue sections from 5 standard brain regions (i.e. entorhinal cortex, hippocampus, frontal cortex, temporal cortex and parietal cortex) were stained with Thioflavin-S, Gallyas and Campbell–Switzer histological stains and assessed semiquantitatively for the density of NFTs and amyloid plaques (42). This scheme of providing semiquantitative measure of plaque and tangle load has been used in the BBDP brain bank for over 30 years. For each case, each brain region was ranked on a scale of 0–3 based on 0 being no plaques or tangles, 1 being few plaques or tangles, 2 being moderate numbers of plaques and tangles, and 3 being numerous plaques and tangles. By combining the measures across these 5 brain regions, assessment of AD pathology was ranked on an ordinal scale of 0–15 for plaques and tangles (43). The cases were classified into low-plaque (LP) non-demented (plaque score < 6), high-plaque (HP) non-demented (plaque score 6–14) and AD with dementia (plaque score > 12). In addition, current consensus diagnosis criteria (Thal phase, Braak score, Plaque density, NIA-Reagan, and NIA-Alzheimer’s Association) are included where available. Some criteria are missing from older cases (Table).
Antibodies
The following primary antibodies were used in this study: Progranulin (R&D Systems, Minneapolis, MN; catalog no. AF2420, goat), used at 1:1000 for immunohistochemistry (IHC), Prosaposin (R&D Systems; catalog no. AF8520, rabbit), used at 1:1500 for IHC, pTau clone AT180 (pTau-Thr 235) (ThermoFisher, Waltham, MA; catalog no. MN1040, mouse), used at 1:1000 for IHC and pTau rabbit monolonal (pTau-Ser202) (Abcam, Cambridge, MA; catalog no.ab108387) used at 1:1000 for IHC. The fluorescent-labeled secondary antibodies (see below) used for confocal microscopy were obtained from ThermoFisher Scientific.
Dot Blot Analyses of PGRN and PSAP Antibody Affinities to Purified Proteins
A dot-blot method was used to measure the relative affinities of the PGRN and PSAP antibody used for IHC to paraformaldehyde (PFA)-fixed purified PGRN and PSAP proteins. Serial dilutions of purified PGRN recombinant protein (R&D Systems; catalog no, 2420-PG) and PSAP recombinant protein (SinoBiological, Beijing, China; catalog no.16224-H08H) over the concentration range (100 ng–15 pg/spot) were mixed, applied to duplicate nitrocellulose membranes, dried and then fixed using PFA vapor for 30 minutes. This was designed to model these proteins fixed in situ in tissue. Membranes were then blocked in 5% milk diluted in TBST and incubated in the same antibody dilutions used for IHC (PGRN: 1:1000–PSAP: 1:1500) for 2 hours. Membranes were then washed, reacted with HRP-conjugated anti-goat or anti-rabbit immunoglobulin G (IgG) for 2 hours, washed and reacted with HRP chemiluminescence substrate (Nacalai-Tesque, Kyoto, Japan) followed by signal detection using Fusion FX (Vilber, France) imaging system. The mean relative intensities of signal intensity between PGRN and PSAP antibodies were determined relative to each protein concentration.
Fluorescent Confocal Immunohistochemistry
Cellular localization of PGRN, PSAP, and p-Tau was examined using multiple-color fluorescent confocal IHC. Tissue sections were rinsed 3 times with phosphate-buffered saline-Triton X100 (PBSTx) (0.1 M Phosphate Buffer, pH 7.6, 0.137 M NaCl, 0.3% Triton X100) and incubated with optimal dilutions of antibodies at room temperature overnight with shaking. After 3 washes (10 minutes each) in PBSTx, sections were incubated with optimal concentrations of fluorescent-labeled secondary antibodies in the dark. Bound primary antibodies were detected with Alexa Fluor 488 (donkey anti-goat IgG), Alexa Fluor 568 (donkey anti-rabbit IgG), or Alexa Fluor 647 (donkey anti-mouse IgG) (ThermoFisher). After washing and mounting, sections were counterstained with Sudan Black B (1% solution in 70% ethanol for 3 minutes) to quench tissue autofluorescence, destained with 70% ethanol, and counterstained with DAPI to reveal nuclei. The sections were coverslipped using antifading fluorescent mounting media (ImmunoMount, ThermoFisher). Sections were imaged using a Leica SP8 confocal microscope (Leica, Wetzlar, Germany) and compiled Z-scans of images were obtained. Images were processed with Leica microscope software (LAS X Life Science microscope software).
Quantification of PGRN, PSAP, and p-Tau-Immunoreactive Areas
To measure area of immunoreactivity, tissue sections from a complete series of cases (Table) were stained with mixtures of PGRN, PSAP, and p-Tau antibodies. After mounting and coverslipping of sections, images at 40× magnification were captured from each section, taking p-Tau-immunoreactive areas in random fields of gray matter for each section. Z-scans were compiled and final image analyses were carried out with Adobe Photoshop software. We measured the area of immunoreactivity occupied by reaction product in the compiled Z-scan of each image. With the same threshold being applied to all images, regions of interest (ROI) were drawn based on p-Tau-immunoreactive neuronal area in the merged channels. Channels were subsequently separated, and fluorescent integrated densities of PGRN, PSAP, and p-Tau were measured within the respective ROI. As a control, 2 adjacent p-Tau-negative neurons were also chosen, and fluorescent integrated densities were measured in a same manner. Measured fluorescent integrated density values were divided by ROI area to calculate ratio of fluorescent intensity per cell. For p-Tau-occupied area, p-Tau-immunoreactive area was measured and divided by ROI area. The p-Tau-occupied area within the neuron was used as an indicator for tangle maturity in this study. Each data point represents an individual tangle or neuron. Mean values of p-Tau-occupied areas were calculated for each group, and then data was analyzed with further statistical analysis. Mean values of PGRN and PSAP were also calculated for each group, and then the compiled mean data was compared between tangles and neurons within each group, and between groups with appropriate statistical analysis.
Proximity Ligation Assay
The proximity ligation assay (PLA) allows in situ detection of protein-protein interactions (62). We utilized the Duolink Proximity Ligation Assay kit, and followed the manufacturer’s protocol (Sigma-Aldrich, St. Louis, MO). Tissue sections were rinsed 3 times with phosphate-buffered saline-Triton X100 (PBSTx) (0.1 M Phosphate Buffer, pH 7.6, 0.137 M NaCl, 0.3% Triton X100) and incubated with Duolink blocking solution for 60 minutes at 37°C in a humidity chamber. Sections were incubated subsequently with mixtures of the optimal dilutions of the specific antibodies raised in goat (PGRN) and rabbit (PSAP) for 2 hours at 37°C. After 2 washes (5 minutes each) in wash buffer A, sections were incubated with optimal concentrations of oligonucleotide-labeled secondary probes (anti-goat neg and anti-rabbit plus PLA probe) for 1 hour at 37°C. After 2 washes, ligase enzyme was added to form closed-circle DNA templates if the 2 proteins are in close proximity (40 nm). Subsequently, sections were washed 2 times, and incubated with polymerase enzyme for 120 minutes at 37°C in the dark to amplify the signal. Sections were washed 2 times with wash buffer A, and once with wash buffer B to stop the amplification reaction. This was followed by incubation with p-Tau AT-180 antibody for 10 minutes, and with fluorescent secondary antibody Alexa Fluor 647 (donkey anti-mouse IgG) for 10 minutes. Lastly, sections were counterstained with Sudan Black B (1% solution in 70% ethanol for 3 minutes) to quench tissue autofluorescence, destained with 70% ethanol, and stained with DAPI. PLA signals were visualized with a Leica SP8 microscope with Cy3 filter with laser settings of excitation 540 nm/emission 574 nm.
Statistical Analysis
All statistical analyses were carried out with GraphPad Prism v7.0 software, La Jolla, CA, http://www.graphpad.com. The results are presented as mean ± standard error of mean. To calculate statistical difference between 3 groups with 2 variables, two-way ANOVA with Sidak’s multiple comparison test was used, and with 1 variable, one-way ANOVA with Kruskal-Wallis test was used. Correlation analysis was presented with Spearman R score.
RESULTS
Assessment of PGRN and PSAP Antibody Affinities to PFA-Fixed Purified Protein
As comparing signal intensities in tissue sections between PGRN and PSAP antibodies was central to the methodology being used, preliminary experiments were carried out to compare the performance of antibodies under standard conditions. Purified PGRN and PSAP proteins were mixed at known concentrations, applied to nitrocellulose membranes and fixed with PFA. Antibodies were tested at the same dilutions used for subsequent tissue studies. Results showed that both antibodies produced similar signal intensity over the purified protein range of 100 ng/spot to 15 pg/spot (Supplementary Fig. S1).
Different Types of p-Tau-Immunoreactive Structures and Their Association with PGRN and PSAP
To identify p-Tau-immunoreactive structures, the mouse monoclonal antibody AT180, which identified p-Tau pThr 231 was used as it identified structures with greater sensitivity than the rabbit monoclonal to p-Tau that identifies pSer 202 (similar to the widely used p-Tau antibody AT8) (Supplementary Fig. S2).
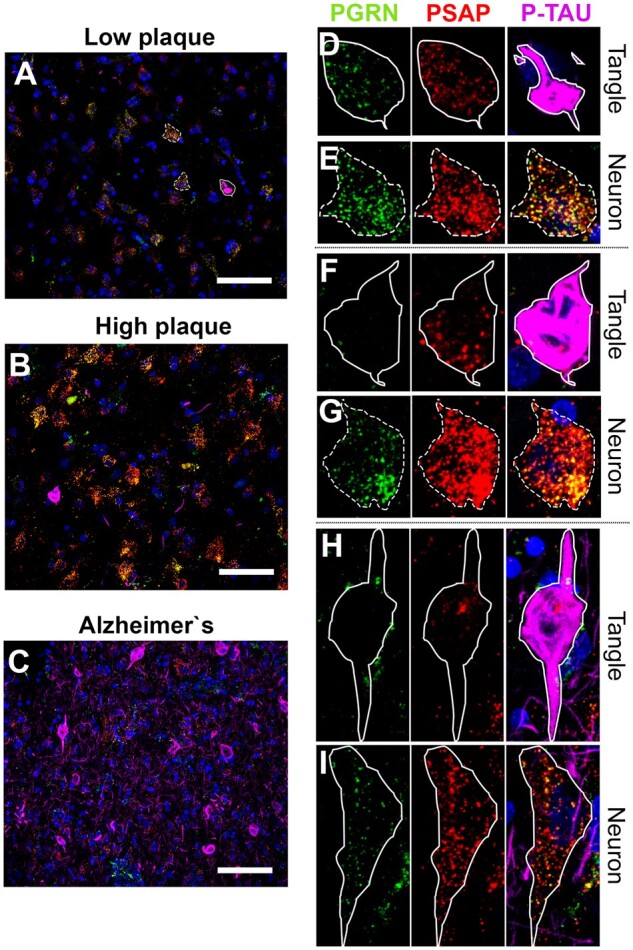
We performed triple-color immunofluorescent histochemistry to study the staining patterns of PGRN and PSAP in neurons with increasing intracellular amounts of p-Tau NFT pathology. Our observations were carried out using brain tissue sections of MTG from 4 cases from each group that had been staged according to degree of plaque pathology (LP, HP, and AD groups). These non-demented LP and HP cases had similar degrees of NFT pathology (Table). We selected the cases with tangle scores above 1 for temporal cortex from the LP and HP groups. As a negative control, an LP case without positive tangles was stained, and neuronal immunoreactivity patterns assessed. Representative images from all sections are shown in Figure 1. PGRN and PSAP signals were shown to be colocalized in almost all neurons without p-Tau-positive structures (Fig. 1A, arrows). We proceeded with observations of PGRN and PSAP staining in different types of p-Tau-immunoreactive structures ranging from neuronal perikarya with thread-like p-Tau structures (Fig. 1B) to ghost extracellular tangles (Fig. 1G). PGRN immunoreactivity appeared to be slightly decreased in neurons with only p-Tau-immunoreactive threads (Fig. 1B, arrowhead) compared to adjacent neurons without p-Tau immunoreactivity (Fig. 1B, arrows). Pre-tangles with limited intracellular p-Tau accumulation and intact nuclei in LP and HP control cases showed decreased immunoreactivity of PGRN but maintained relatively normal levels of PSAP (Fig. 1C, arrowhead). As tangles developed to mature tangles, PGRN and PSAP immunoreactivity was markedly reduced in neurons with increasing p-Tau accumulation (Fig. 1D, arrowhead). In mature tangles with intact nuclei, PGRN and PSAP immunoreactivities were sparse (Fig. 1E, arrowheads), while generally negative in ghost tangles without nuclei (Fig. 1F, arrowhead).
Figure 1.

PGRN and PSAP and its association to different types of p-Tau-immunoreactive structures. Photomicrographs of progranulin (PGRN-green), prosaposin (PSAP-red), and phosphorylated tau (p-Tau-magenta)-immunoreactive structures association in MTG sections of low plaque, high plaque, and AD cases. (A) Neurons without p-Tau immunoreactivity in aged control. (B) Extracellular neutrophil thread (arrow) with PGRN and PSAP in low plaque case. (C) Pre-tangle: Early stage of neurofibrillary tangle formation with PGRN and PSAP in low plaque case. (D) Pre-tangle with PGRN and PSAP in high plaque case. (E) Mature tangle with PGRN, and PSAP in AD case. (F) Extracellular ghost tangle with PGRN, and PSAP in AD case. Scale bars: 20 μm.
Quantitative Studies of PGRN and PSAP in NFTs and Control Neurons in MTG
PGRN and PSAP signals in different p-Tau-immunoreactive structures present in the LP, HP, and AD cases were measured according to the described protocol. These data were analyzed to determine if there were correlations between the losses of PGRN and/or PSAP signals and increase in p-Tau-immunoreactive area. To examine if neurons with progressively greater p-Tau immunoreactivity had progressively decreased amounts of PGRN and PSAP, we measured PGRN and PSAP fluorescent intensities in p-Tau-immunoreactive neurons and compared to p-Tau-negative adjacent neurons in all sections. The overall distribution of measures of AT180-p-Tau-immunoreactive NFTs, PGRN and PSAP can be seen in Figure 2A–C. P-Tau-immunoreactive neurons (magenta) were not abundant in LP and HP groups compared to AD cases but provided examples of early or pre-tangle formation to examine the hypothesis. P-Tau-immunoreactive tangles were selected and ROI drawn (Fig. 2D, F, and H). As hypothesized, p-Tau-occupied area (p-tau area/total neuronal area) within the neuron was significantly higher in AD cases (Fig. 3A). It indicates that NFTs were more abundant in AD cases, were mostly mature or ghost tangles, and covered the complete area of affected neurons, whereas NFTs in LP and HP were in early or pre-tangle stages regardless of plaque abundancy. Adjacent non-p-Tau-immunoreactive control neurons were also selected for analyses (Fig. 2E, G, and I). Fluorescence intensities of PGRN and PSAP were measured in selected ROI and normalized to total neuronal area. PGRN signal in NFT was significantly decreased compared to the adjacent control neurons in the same microscopic field in LP and HP cases (Fig. 3B) but was not significantly different in AD cases. This could be due to NFT pathology being more severe in AD cases, where healthy neurons are sparse but where most of the p-Tau-negative neurons had decreased amounts of PGRN. As NFT pathology developed, the immunoreactivity of PGRN in healthy control neurons also decreased significantly.
Figure 2.
Representative photomicrographs of NFTs in LP, HP, and AD cases showing parameters for measurements. (A–C) Prevalence of NFTs in LP, HP, and AD cases. Scale bars: 50 μm. (D, F, H) Illustration of measurement of NFTs in LP, HP, and AD case, respectively. NFTs were selected and ROI was drawn to measure PGRN and PSAP fluorescent intensity, and p-Tau-immunoreactive area was measured to calculate tangle-occupied area within neuron, respectively. Scale bars: 20 μm. (E, G, I) Adjacent control neurons were selected and ROI was drawn to measure PGRN and PSAP fluorescent intensity. Scale bars: 20 μm.
Figure 3.

Semiquantitative measurements of PGRN and PSAP immunofluorescent intensity in NFTs. (A) p-Tau-occupied area was calculated from p-Tau-immunoreactive area value divided by total ROI area; p < 0.05 was considered as statistically significant. (B) PGRN fluorescent intensity was measured and divided by total ROI area to calculate ratio per area. (C) PSAP fluorescent intensity was measured and divided by total ROI area to calculate ratio per area. (D) Correlation analysis of PGRN ratio per area to p-Tau-occupied area. Spearman R score <0 indicates negative correlation. (E) Correlation analysis of PSAP ratio per area to p-Tau-occupied area.
PSAP measurements also revealed that NFTs had significantly decreased amounts of PSAP compared to adjacent control neurons in all groups (Fig. 3C). There was also a significant decrease in levels of PSAP in adjacent healthy neurons of AD compared to HP cases. These results may suggest that decreased PGRN level contributes to accumulation of p-Tau in neurons, and the decreased levels of PSAP continue this process. Correlation analysis of PGRN and PSAP integrated fluorescent intensity with p-Tau-occupied area within neurons showed a significant negative correlation for PSAP (Fig. 3D, E). It can be interpreted that as levels of PGRN and PSAP expression decrease, p-Tau-occupied area within neurons increases.
PGRN and PSAP in NFTs and Control Neurons in Hippocampus
As NFT pathology in hippocampus correlates to cognitive decline, it is an important region to study. NFTs tend to develop in hippocampus before cortical regions (2, 3). We examined PGRN and PSAP association with NFTs in individual hippocampal sections from LP, HP, and AD cases for qualitative comparison only as we had limited numbers of cases with available hippocampus sections. PGRN and PSAP fluorescent intensities were measured in 3 to 4 different fields. This showed a similar pattern as the MTG sections with few NFTs in LP and HP cases (Fig. 4A–C). PGRN and PSAP signal appeared to be lower in tangle-bearing neurons compared to adjacent neurons in hippocampal sections in all cases (Fig. 4D–F). As expected, PGRN and PSAP fluorescent intensity was lower in tangle-bearing neurons compared to adjacent control neurons (Fig. 4G, H).
Figure 4.

PGRN, and PSAP immunofluorescent intensity in NFTs of hippocampal section of LP, HP, and AD cases. (A–C) Prevalence of NFTs in LP, HP, and AD cases. Scale bars: 100 μm. NFTs were selected and ROI was drawn to measure PGRN and PSAP fluorescent intensity. Adjacent control neurons were selected and ROI was drawn to measure PGRN and PSAP fluorescent intensity. (D–F) Higher magnification of square box in panels A-C for better visualization. Scale bars: 20 μm. (G) PGRN fluorescent intensity was measured and divided by total ROI area to calculate ratio per area; p < 0.05 was considered as statistically significant. (H) PSAP fluorescent intensity was measured and divided by total ROI area to calculate ratio per area; p < 0.05 was considered as statistically significant.
PGRN and PSAP in a PS1 and GRN-Mutated Cases
It has been reported that cortical pyramidal neurons in FTD cases with GRN mutations may have insufficient amounts of PGRN protein to be fully functional (20). We also observed that most neurons of GRN mutation cases had no PGRN immunoreactivity, but some did show abnormal patterns of aggregated PGRN immunoreactivity (Fig. 5B) (Supplementary Fig. S3). This pattern of aggregated PGRN was not observed in the LP, HP, and AD cases. However, in neurons of GRN mutation cases, PSAP signal appeared to be preserved (Fig. 5C). The cases examined had minimal p-Tau-positive features compared to the AD cases (Fig. 5E) (Supplementary Fig. S3). From these results, it can be suggested that loss of PGRN alone might not be sufficient to initiate p-Tau accumulation in neurons with tangle formation, while loss of PGRN and PSAP could play a role in NFT development in AD. Mutations in the Presenilin-1 (PS1) gene is one of the more common causes of early onset familial AD. The PS1-mutated case examined had numerous tangles (Fig. 5F), similar to the sporadic AD cases. This case also showed a similar pattern to AD as loss of PGRN and PSAP was observed in mature tangles (Fig. 5G–J, with straight line). However, adjacent control neurons had both PGRN and PSAP immunoreactivity preserved (Fig. 5G–J, with dotted line) in this PS1 mutation case.
Figure 5.

PGRN and PSAP in NFTs of a Presenilin-1-mutated AD case and Granulin-mutated FTD cases. (A) Distribution of PGRN and PSAP immunoreactivity in a NFT structure of FTD case with GRN mutation shown by low magnification photomicrograph. Scale bar: 50 μm. (B–E) Higher-magnification photomicrograph of square box in panel A. Scale bars: 20 μm. (F) Prevalence of PGRN and PSAP immunoreactivity in NFTs in a PS1-mutated EOAD case. Scale bar: 50 μm. (G–J) Higher-magnification photomicrograph of square box in panel F. Straight line = p-Tau bearing neurons; dotted line = control neurons. Scale bars: 20 μm.
Interaction of PGRN and PSAP in Neurons and Tangles
Since interaction of PGRN and PSAP has been reported in primary murine neuronal cells and gene-transfected human HEK293 cell lines (45), but not in situ in brain tissue sections, we proceeded with confirming their interaction in neurons on human brain sections using the fluorescent probed PLA. This assay allows the detection of protein-protein interactions in situ at endogenous protein levels using antigen-specific antibodies raised in different species. Figure 6A illustrates the basic mechanism of how this assay works. When the 2 proteins of interest are localized within 40 nm from each other, antibody bound probes to circular-DNA bound to fluorophore, which was detected as a positive signal by fluorescence microscopy. PGRN and PSAP interactions were detected in cortical neurons on MTG brain sections in Figure 6B–D. Sections were double-stained with p-Tau antibody, which revealed some PGRN-PSAP interaction in tangles but less than in adjacent neurons (Fig. 6C, D). This result suggests that functional interaction of PGRN and PSAP is decreased in tangles compared to control neurons. Primary antibodies, and polymerase enzyme omitted negative control sections showed no signal (Supplementary Fig. S4).
Figure 6.

Interaction of PGRN and PSAP in situ demonstrated with proximity ligation assay. (A) Illustrations of PLA assay. (B) Interaction of PGRN and PSAP in situ detected by PLA in neuron of MTG tissue section. (C) Higher-magnification photomicrograph of square box in panel B. Interaction of PGRN and PSAP with p-Tau staining. (D) Interaction of PGRN and PSAP by PLA in p-Tau bearing neuron (arrowhead) and control neurons (arrow). Scale bars: 20 μm.
DISCUSSION
The aim of this study was to investigate whether selective loss of PGRN in neurons and accompanying decreases in PSAP predisposed neurons to accumulate p-Tau. Since the discovery from studies of FTD cases that mutations in the GRN gene lead to reduced levels of PGRN protein and neurodegeneration (20), attempts to show if similar mechanisms were ongoing in AD have been made. However, unlike in FTD cases due to mutation in GRN gene where PGRN in brain levels are decreased, we and others have shown that total levels of PGRN are increased in AD-affected brains (27, 28). In AD brains, we reported increased levels of PGRN associated with Aβ plaques, however in this study, we observed that NFTs did not generally show PGRN immunoreactivity (27). As our previous study had demonstrated PGRN and PSAP interactions in human aged and AD brains, this led to the hypothesis that loss of PGRN in neurons could be a critical step that makes neurons vulnerable to p-Tau accumulation as a result of lysosomal dysfunction not efficiently removing abnormal proteins at early stages of accumulation.
The rationale for this study was to examine and measure colocalization of PGRN, PSAP and p-Tau not only in AD cases with abundant NFTs, but to examine tissue sections from similar aged non-demented subjects that have differing degrees of AD-like pathological features. These cases are ideal to study the progression of NFT formation from pre-tangles with limited intracellular p-Tau in neurons to mature tangles that mostly had intracellular p-Tau with intact nuclei to ghost tangles representing the degenerative skeleton of affected tangled neurons without nuclei. The naming scheme of the progression of NFTs from pre-tangles to mature tangles to ghost tangles is consistent with the classification schemes defined by Braak et al (3, 46).
Our main finding was that PGRN was lost earlier than PSAP in neurons that had just begun to accumulate p-Tau immunoreactivity. This was noticeable in LP, HP, and AD cases. By comparison, it was observed in GRN mutation FTD cases that PSAP immunoreactivity was generally preserved in cases with little PGRN immunoreactivity. As these cases showed very little p-Tau immunoreactivity, it supported our hypothesis that loss of PGRN alone might not be sufficient to precipitate p-Tau accumulation.
The loss of neurons due to formation of NFTs plays a central role in the loss of cognitive function and the pathology of AD (5). As therapeutic approaches aimed to reducing amyloid beta plaques are not showing significant effectiveness, it is vital to understand how NFTs develop and how other factors are involved to identify possible therapeutic targets. It has been established that NFTs develop in a progressive manner not only in severity but in regional distribution (46). Initial NFT formation can be detected in transentorhinal cortex (6). The accumulation of highly aggregated and hyperphosphorylated proteins occurs initially as thread-like structures and then spreads to fill neurons forming mature (intracellular) tangles with nuclei. At later stages, these structures breakdown to form the cytoskeleton of ghost extracellular tangles that are abundant in vulnerable regions of brains of AD cases (47).
The initial stages resulting in aggregated and hyperphosphorylated tau are supposed to occur due to excess tau kinase activity and reduced tau phosphatase (48–50). Although tau can aggregate into toxic oligomeric forms without being hyperphosphorylated, pathological studies such as this one uses p-Tau as sensitive markers for abnormal tau; detection of aggregated tau without these modifications is not as sensitive. Tau proteins, whether 4 repeat (4R) and 3 repeat (3R) can aggregate under pathological circumstances, particularly if mutations are present, and this can be exacerbated if the molecules become phosphorylated (53, 54). Normally cellular mechanisms exist that can remove and digest early accumulations of abnormal proteins such as tau. However, it has been suggested that lysosomal dysfunction resulting in deficits in degradative enzymes reduces removal of early accumulations of abnormal tau or other proteins before they become pathological (52). Most studies of PGRN deficiencies have focused on cases of FTLD with known GRN mutations that have resulted in deficiency of functional PGRN protein. A number of studies have described lysosomal dysfunction in tissues with GRN mutations or in constructed experimental models (55). One study that examined several FTD/GRN mutation cases observed increased levels of AT8-immunoreactive p-Tau (Ser/Thr 202/205) in these cases compared to controls (51). This finding contradicts our observations of GRN mutation cases (Fig. 5; Supplementary Fig. S3), where only sparse AT180 immunoreactivity was detected in these cases using standard immunostaining procedures. This other study employed an antigen retrieval technique using heat treatment of free-floating sections to detect p-Tau in GRN mutation cases. As such enhancement is not required to demonstrate p-Tau immunoreactivity in AD cases, we employed standard IHC methods with these GRN mutation cases and could not reveal p-Tau immunoreactivity to any extent while demonstrating abundant p-Tau in AD cases (51). In addition, standard neuropathological criteria showed that the GRN mutation FTD cases we examined did not have severe Braak tangle scores compared to the AD cases (Table) (51).
Previous evidence suggests that there is an impairment of lysosomal degradation pathways in AD brains that could contribute to the accumulation of aggregated proteins including aggregated phosphorylated tau (52). In this study, we showed decreased amounts of PGRN and PSAP proteins in p-Tau-immunoreactive NFTs compared to adjacent neurons in cortical and hippocampal region of human brain tissue sections in non-demented control and AD cases. Deficiency of PGRN is recognized to affect lysosomal enzyme levels, function, and making the cell vulnerable to insoluble protein aggregates (56). A recent study using lipidomic and transcriptomics of lysosomal dysfunction due to PGRN deficiency showed upregulated gene expression of lysosomal genes, increased lysosomal numbers in neurons, and excessive accumulation of lipofuscin (57). FTLD cases with GRN haploinsufficiency and NCL cases with homozygous mutations GRN also showed accumulations of lysosomal and other insoluble proteins in brain cells (55). P301L tau transgenic mice with deficiency of PGRN due to genetic manipulation of Grn genes were associated with exacerbated intracellular p-Tau pathology (29, 30). Another study of mice with mutated PGRN also showed increased p-Tau (Ser 202) (58).
The involvement of PSAP in NFT formation has not been the subject of any reported studies. However, PSAP deficiency has been associated with lysosomal storage diseases. A heterozygous PSAP mouse model showed neurofuscin-like accumulation in neurons (59). Pleiomorphic inclusions associated with lysosomal markers, and ubiquitination were detected in neuronal cells of PSAP-deficient human brain tissue (60). The interaction of PGRN and PSAP is important for these proteins to be functional in lysosomes as alterations in their interaction changed their biological properties (40, 61). The PLA assay is a well-characterized, sensitive technique to detect protein-protein interaction in their native form (62), and has been used for AD research (63). Here, we evidenced the interaction of PGRN and PSAP in situ in neurons of human brain tissue, and of decreased interactions in tangle-bearing neurons using the PLA assay. The autophagy-lysosomal pathway has been demonstrated to be the main degradative pathway of p-Tau in neurons, and p-Tau was revealed to interact with autophagy markers in postmortem brain tissues using a PLA assay (52).
In summary, our observational measurements of PGRN and PSAP in a staged series of cases identified possible early loss of PGRN in tangle-forming neurons followed by decreased amounts of PSAP. Surprisingly, there have been few studies on the involvement of PSAP with AD or FTD pathological features. Our previous studies indicated how these 2 key proteins were strongly associated with each in normal neurons and on amyloid plaques (27). Loss of PGRN alone due to GRN mutation cases examined in this study did not appear predispose to accumulation of p-Tau, a finding that contradicts an earlier reported study (51). The questions raised about mechanisms indicated by these observations can now be examined in experimental cell systems with targeted gene knockdown.
Supplementary Material
This work was supported by grant funds Japan Society for the Promotion of Science (JSPS) to I.T. (20K20588), and from JSPS to D.G.W. (19K0784300). The tissues for this study were provided by the Arizona Study of Aging and Neurodegeneration, Brain and Body Donation Program, Banner Research Institute. The operation of the Banner Sun Health Research Institute Brain and Body Donation Program has been supported by the National Institute of Neurological Disorders and Stroke (U24 NS072026 National Brain and Tissue Resource for Parkinson’s Disease and Related Disorders), the National Institute on Aging (P30 AG19610 Arizona Alzheimer’s Disease Core Center), the Arizona Department of Health Services (contract 211002, Arizona Alzheimer’s Research Center), the Arizona Biomedical Research Commission (contracts 4001, 0011, 05-901 and 1001 to the Arizona Parkinson’s Disease Consortium), and the Michael J. Fox Foundation for Parkinson’s Research (The Prescott Family Initiative).
The authors have no conflict of interest.
Supplementary Data can be found at academic.oup.com/jnen.
REFERENCES
- 1.World Alzheimer Report 2018. | Alzheimer’s Disease International. Available at: https://www.alz.co.uk/research/world-report-2018. Accessed 2020.
- 2.Braak H, Braak E.. Neuropathological stageing of Alzheimer-related changes. Acta Neuropathol 1991;82:239–59 [DOI] [PubMed] [Google Scholar]
- 3.Alafuzoff I, Arzberger T, Al-Sarraj S, et al. Staging of neurofibrillary pathology in Alzheimer’s disease: A study of the BrainNet Europe consortium. Brain Pathol 2008;18:484–96 [DOI] [PMC free article] [PubMed] [Google Scholar]
- 4.Deture MA, Dickson DW.. The neuropathological diagnosis of Alzheimer’s disease Mol. Neurodegen 2019;14:1–18 [DOI] [PMC free article] [PubMed] [Google Scholar]
- 5.Nelson PT, Braak H, Markesbery WR.. Neuropathology and cognitive impairment in Alzheimer disease: A complex but coherent relationship. J Neuropathol Exp Neurol 2009;68:1–14 [DOI] [PMC free article] [PubMed] [Google Scholar]
- 6.Lace G, Savva GM, Forster G, et al. Hippocampal tau pathology is related to neuroanatomical connections: An ageing population-based study. Brain 2009;132:1324–34 [DOI] [PubMed] [Google Scholar]
- 7.Nelson PT, Alafuzoff I, Bigio EH, et al. Correlation of alzheimer disease neuropathologic changes with cognitive status: A review of the literature. J Neuropathol Exp Neurol 2012;7171:362–81. [DOI] [PMC free article] [PubMed] [Google Scholar]
- 8.Goedert M, Wischik CM, Crowther RA, et al. Cloning and sequencing of the cDNA encoding a core protein of the paired helical filament of Alzheimer disease: Identification as the microtubule-associated protein tau. Proc Natl Acad Sci USA 1988;85:4051–5 [DOI] [PMC free article] [PubMed] [Google Scholar]
- 9.Spillantini MG, Crowther RA, Goedert M.. Comparison of the neurofibrillary pathology in Alzheimer’s disease and familial presenile dementia with tangles. Acta Neuropathol 1996;92:42–8 [DOI] [PubMed] [Google Scholar]
- 10.Pei J-J, Sjögren M, Winblad B.. Neurofibrillary degeneration in Alzheimer’s disease: From molecular mechanisms to identification of drug targets. Curr Opin Psychiatry 2008;21:555–61 [DOI] [PubMed] [Google Scholar]
- 11.Llorens-Martín M, Jurado J, Hernández F, Avila J.. GSK-3β, a pivotal kinase in Alzheimer disease. Front Mol Neurosci 2014;7:46. [DOI] [PMC free article] [PubMed] [Google Scholar]
- 12.Chung KM, Hernández N, Sproul AA, Yu WH.. Alzheimer’s disease and the autophagic-lysosomal system. Neurosci Lett 2019;697:49–58 [DOI] [PubMed] [Google Scholar]
- 13.Choi J, Levey AI, Weintraub ST, et al. Oxidative modifications and down-regulation of ubiquitin carboxyl-terminal hydrolase L1 associated with idiopathic Parkinson’s and Alzheimer’s Diseases. J Biol Chem 2004;279:13256–64 [DOI] [PubMed] [Google Scholar]
- 14.Clavaguera F, Bolmont T, Crowther RA, et al. Transmission and spreading of tauopathy in transgenic mouse brain. Nat Cell Biol 2009;11:909–13 [DOI] [PMC free article] [PubMed] [Google Scholar]
- 15.Frost B, Jacks RL, Diamond MI.. Propagation of Tau misfolding from the outside to the inside of a cell. J Biol Chem 2009;284:12845–52 [DOI] [PMC free article] [PubMed] [Google Scholar]
- 16.Gao X, Joselin AP, Wang L, et al. Progranulin promotes neurite outgrowth and neuronal differentiation by regulating GSK-3β. Protein Cell 2010;1:552–62 [DOI] [PMC free article] [PubMed] [Google Scholar]
- 17.Van Damme P, Van Hoecke A, Lambrechts D, et al. Progranulin functions as a neurotrophic factor to regulate neurite outgrowth and enhance neuronal survival. J Cell Biol 2008;181:37–41 [DOI] [PMC free article] [PubMed] [Google Scholar]
- 18.Martens LH, Zhang J, Barmada SJ, et al. Progranulin deficiency promotes neuroinflammation and neuron loss following toxin-induced injury. J Clin Invest 2012;122:3955–9 [DOI] [PMC free article] [PubMed] [Google Scholar]
- 19.Tanaka Y, Suzuki G, Matsuwaki T, et al. Progranulin regulates lysosomal function and biogenesis through acidification of lysosomes. Hum Mol Genet 2017;26:969–88 [DOI] [PubMed] [Google Scholar]
- 20.Mao Q, Zheng X, Gefen T, et al. FTLD-TDP with and without GRN mutations cause different patterns of CA1 pathology. J Neuropathol Exp Neurol 2019;78:844–53 [DOI] [PMC free article] [PubMed] [Google Scholar]
- 21.Baker M, Mackenzie IR, Pickering-Brown SM, et al. Mutations in progranulin cause tau-negative frontotemporal dementia linked to chromosome 17. Nature 2006;442:916–9 [DOI] [PubMed] [Google Scholar]
- 22.DeJesus-Hernandez M, Mackenzie IR, Boeve BF, et al. Expanded GGGGCC hexanucleotide repeat in noncoding region of C9ORF72 causes chromosome 9p-linked FTD and ALS. Neuron 2011;72:245–56 [DOI] [PMC free article] [PubMed] [Google Scholar]
- 23.Stanford PM, Shepherd CE, Halliday GM, et al. Mutations in the tau gene that cause increase in three repeat tau and frontotemporal dementia. Brain 2003;126:814–26 [DOI] [PubMed] [Google Scholar]
- 24.Rademakers R, Cruts M, Van Broeckhoven C.. The role of tau (MAPT) in Frontotemporal dementia and related Tauopathies. Hum Mutat 2004;24:277–95 [DOI] [PubMed] [Google Scholar]
- 25.Cruts M, Gijselinck I, Van Der Zee J, et al. Null mutations in progranulin cause ubiquitin-positive frontotemporal dementia linked to chromosome 17q21. Nature 2006;442:920–4 [DOI] [PubMed] [Google Scholar]
- 26.Josephs KA, Ahmed Z, Katsuse O, et al. Neuropathologic features of frontotemporal lobar degeneration with ubiquitin-positive inclusions with progranulin gene (PGRN) mutations. J Neuropathol Exp Neurol 2007;66:142–51 [DOI] [PubMed] [Google Scholar]
- 27.Mendsaikhan A, Tooyama I, Bellier JP, et al. Characterization of lysosomal proteins Progranulin and Prosaposin and their interactions in Alzheimer’s disease and aged brains: Increased levels correlate with neuropathology. Acta Neuropathol Commun 2019;7:215. [DOI] [PMC free article] [PubMed] [Google Scholar]
- 28.Minami SS, Min S-W, Krabbe G, et al. Progranulin protects against amyloid beta deposition and toxicity in Alzheimer’s disease mouse models. Nat Med 2014;20:1157–64 [DOI] [PMC free article] [PubMed] [Google Scholar]
- 29.Hosokawa M, Arai T, Masuda-Suzukake M, et al. Progranulin reduction is associated with increased tau phosphorylation in P301L tau transgenic mice. J Neuropathol Exp Neurol 2015;74:158–65 [DOI] [PubMed] [Google Scholar]
- 30.Takahashi H, Klein ZA, Bhagat SM, et al. ; For the Alzheimer’s Disease Neuroimaging Initiative. Opposing effects of progranulin deficiency on amyloid and tau pathologies via microglial TYROBP network. Acta Neuropathol 2017;133:785–807. [DOI] [PMC free article] [PubMed] [Google Scholar]
- 31.Kleinberger G, Wils H, Ponsaerts P, et al. Increased caspase activation and decreased TDP-43 solubility in progranulin knockout cortical cultures. J Neurochem 2010;115:735–47 [DOI] [PubMed] [Google Scholar]
- 32.Liu B, Mosienko V, Vaccari Cardoso B, et al. Glio- and neuro-protection by prosaposin is mediated by orphan G-protein coupled receptors GPR37L1 and GPR37. Glia 2018;66:2414–26 [DOI] [PMC free article] [PubMed] [Google Scholar]
- 33.Nabeka H, Saito S, Li X, et al. Interneurons secrete prosaposin, a neurotrophic factor, to attenuate kainic acid-induced neurotoxicity. IBRO Rep 2017;3:17–32 [DOI] [PMC free article] [PubMed] [Google Scholar]
- 34.O'Brien JS, Kishimoto Y.. Saposin proteins: Structure, function, and role in human lysosomal storage disorders. FASEB J 1991;5:301–8 [DOI] [PubMed] [Google Scholar]
- 35.Hulková H, Cervenková M, Ledvinová J.. A novel mutation in the coding region of the prosaposin gene leads to a complete deficiency of prosaposin and saposins, and is associated with a complex sphingolipidosis dominated by lactosylceramide accumulation. Hum Mol Genet 2001;10:927–40 [DOI] [PubMed] [Google Scholar]
- 36.Sun Y, Witte DP, Zamzow M, et al. Combined saposin C and D deficiencies in mice lead to a neuronopathic phenotype, glucosylceramide and α-hydroxy ceramide accumulation, and altered prosaposin trafficking. Hum Mol Genet 2007;16:957–71 [DOI] [PubMed] [Google Scholar]
- 37.Oji Y, Hatano T, Ueno SI, et al. Variants in saposin D domain of prosaposin gene linked to Parkinson’s disease. Brain 2020;143:1190–205 [DOI] [PubMed] [Google Scholar]
- 38.Zhou X, Sun L, de Oliveira FB, et al. Prosaposin facilitates sortilin-independent lysosomal trafficking of progranulin. J Cell Biol 2015;210:991–1002 [DOI] [PMC free article] [PubMed] [Google Scholar]
- 39.Gopalakrishnan MM, Grosch HW, Locatelli-Hoops S, et al. Purified recombinant human prosaposin forms oligomers that bind procathepsin D and affect its autoactivation. Biochem J 2004;383:507–15 [DOI] [PMC free article] [PubMed] [Google Scholar]
- 40.Valdez C, Ysselstein D, Young TJ, et al. Progranulin mutations result in impaired processing of prosaposin and reduced glucocerebrosidase activity. Hum Mol Genet 2020;29:716–26 [DOI] [PMC free article] [PubMed] [Google Scholar]
- 41.Zhou X, Paushter DH, Pagan MD, et al. Progranulin deficiency leads to reduced glucocerebrosidase activity. PLoS One 2019;14:e0212382. [DOI] [PMC free article] [PubMed] [Google Scholar]
- 42.Beach TG, Adler CH, Sue LI, et al. Arizona study of aging and neurodegenerative disorders and brain and body donation program. Neuropathol 2015;35:354–89 [DOI] [PMC free article] [PubMed] [Google Scholar]
- 43.Beach TG, Sue LI, Walker DG, et al. Striatal amyloid plaque density predicts Braak neurofibrillary stage and clinicopathological Alzheimer’s disease: Implications for amyloid imaging. JAD 2012;28:869–76 [DOI] [PMC free article] [PubMed] [Google Scholar]
- 44.Dore K, Pao Y, Lopez JS, et al. SYNPLA, a method to identify synapses displaying plasticity after learning. Proc Natl Acad Sci USA 2020;117:3214–9 [DOI] [PMC free article] [PubMed] [Google Scholar]
- 45.Zhou X, Sullivan PM, Sun L, Hu F.. The interaction between progranulin and prosaposin is mediated by granulins and the linker region between saposin B and C. J Neurochem 2017;143:236–43 [DOI] [PMC free article] [PubMed] [Google Scholar]
- 46.Braak H, Braak E.. Evolution of neuronal changes in the course of Alzheimer’s Disease. J Neural Transm Suppl 1998;53:127–40 [DOI] [PubMed] [Google Scholar]
- 47.Uchihara T.Pretangles and neurofibrillary changes: Similarities and differences between AD and CBD based on molecular and morphological evolution. Neuropathol 2014;34:571–7 [DOI] [PubMed] [Google Scholar]
- 48.Liu R, Zhou XW, Tanila H, et al. Phosphorylated PP2A (tyrosine 307) is associated with Alzheimer neurofibrillary pathology: In Focus. J Cell Mol Med 2007;12:241–57 [DOI] [PMC free article] [PubMed] [Google Scholar]
- 49.Deters N, Ittner LM, Götz J.. Substrate-specific reduction of PP2A activity exaggerates tau pathology. Biochem Biophys Res Commun 2009;379:400–5 [DOI] [PubMed] [Google Scholar]
- 50.Corcoran NM, Martin D, Hutter-Paier B, et al. Sodium selenate specifically activates PP2A phosphatase, dephosphorylates tau and reverses memory deficits in an Alzheimer’s disease model. J Clin Neurosci 2010;17:1025–33 [DOI] [PubMed] [Google Scholar]
- 51.Hosokawa M, Kondo H, Serrano GE, et al. Accumulation of multiple neurodegenerative disease-related proteins in familial frontotemporal lobar degeneration associated with granulin mutation. Sci Rep 2017;7:1513. [DOI] [PMC free article] [PubMed] [Google Scholar]
- 52.Piras A, Collin L, Grüninger F, et al. Autophagic and lysosomal defects in human tauopathies: Analysis of post-mortem brain from patients with familial Alzheimer disease, corticobasal degeneration and progressive supranuclear palsy. Acta Neuropathol Commun 2016;4:22. [DOI] [PMC free article] [PubMed] [Google Scholar]
- 53.Uchihara T, Hara M, Nakamura A, et al. Tangle evolution linked to differential 3- and 4-repeat tau isoform deposition: A double immunofluorolabeling study using two monoclonal antibodies. Histochem Cell Biol 2012;137:261–7 [DOI] [PubMed] [Google Scholar]
- 54.Hara M, Hirokawa K, Kamei S, et al. Isoform transition from four-repeat to three-repeat tau underlies dendrosomatic and regional progression of neurofibrillary pathology. Acta Neuropathol 2013;125:565–79 [DOI] [PubMed] [Google Scholar]
- 55.Götzl JK, Mori K, Damme M, et al. Common pathobiochemical hallmarks of progranulin-associated frontotemporal lobar degeneration and neuronal ceroid lipofuscinosis. Acta Neuropathol 2014;127:845–60 [DOI] [PubMed] [Google Scholar]
- 56.Guo A, Tapia L, Bamji SX, et al. Progranulin deficiency leads to enhanced cell vulnerability and TDP-43 translocation in primary neuronal cultures. Brain Res 2010;1366:1–8 [DOI] [PubMed] [Google Scholar]
- 57.Evers BM, Rodriguez-Navas C, Tesla RJ, et al. Lipidomic and transcriptomic basis of lysosomal dysfunction in progranulin deficiency. Cell Rep 2017;20:2565–74 [DOI] [PMC free article] [PubMed] [Google Scholar]
- 58.Fujita K, Chen X, Homma H, et al. Targeting Tyro3 ameliorates a model of PGRN-mutant FTLD-TDP via tau-mediated synaptic pathology. Nat Commun 2018;9:1–21 [DOI] [PMC free article] [PubMed] [Google Scholar]
- 59.Yoneshige A, Suzuki K, Suzuki K, et al. A mutation in the saposin C domain of the sphingolipid activator protein (Prosaposin) gene causes neurodegenerative disease in mice. J Neurosci Res 2010;88:2118–34 [DOI] [PubMed] [Google Scholar]
- 60.Sikora J, Harzer K, Elleder M.. Neurolysosomal pathology in human prosaposin deficiency suggests essential neurotrophic function of prosaposin. Acta Neuropathol 2007;113:163–75 [DOI] [PMC free article] [PubMed] [Google Scholar]
- 61.Nicholson AM, Finch NCA, Almeida M, et al. Prosaposin is a regulator of progranulin levels and oligomerization. Nat Commun 2016;7:1–14 [DOI] [PMC free article] [PubMed] [Google Scholar]
- 62.Koos B, Andersson L, Clausson CM, et al. Analysis of protein interactions in situ by proximity ligation assays. Curr Top Microbiol Immunol 2014;377:111–26 [DOI] [PubMed] [Google Scholar]
- 63.Lundgren JL, Vandermeulen L, Sandebring-Matton A, et al. Proximity ligation assay reveals both pre-A and postsynaptic localization of the APP-processing enzymes ADAM10 and BACE1 in rat and human adult brain. BMC Neurosci 2020;21:6. [DOI] [PMC free article] [PubMed] [Google Scholar]
Associated Data
This section collects any data citations, data availability statements, or supplementary materials included in this article.