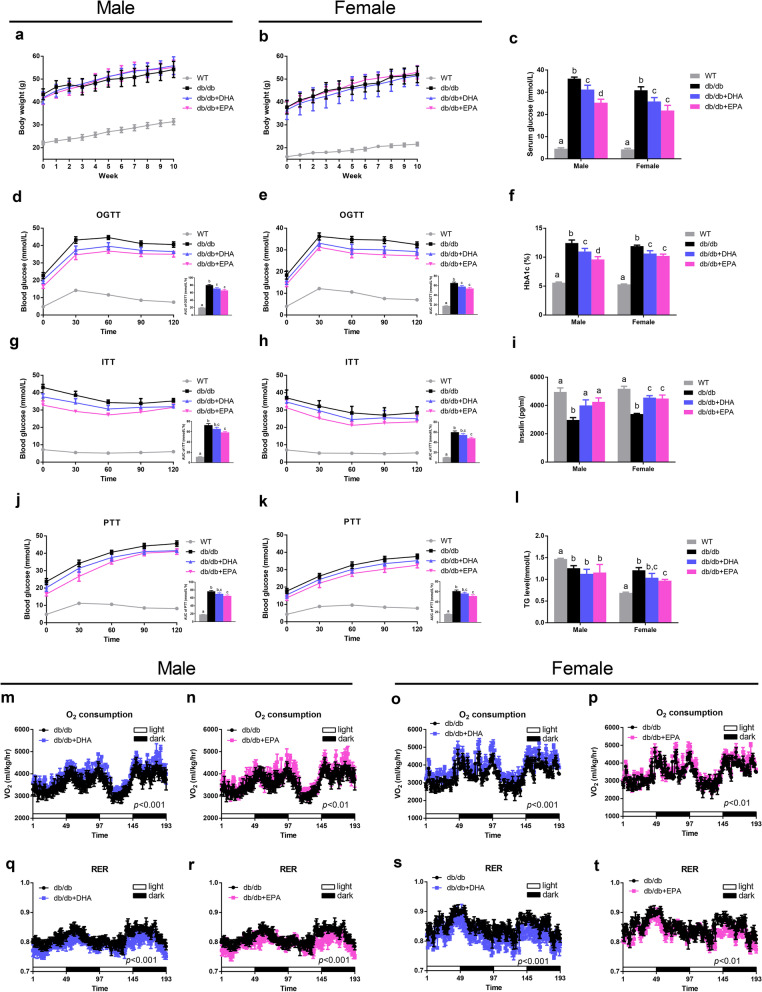
Fig. 1.
Differential effects of DHA and EPA on glucose homeostasis and metabolic profile in db/db mice. The db/db mice were fed either a control diet (db/db), DHA-enriched diet (db/db + DHA), or EPA-enriched diet (db/db + EPA) for 10 weeks (n = 6 male and n = 6 female per group). a, b Body weight curves. c Serum glucose levels. d, e, g, h, j, k Time-dependent profiles of serum glucose levels in OGTT, ITT, and PTT with AUC. f Blood HbA1c levels. i Serum insulin levels. l Serum TG levels. m–p Oxygen consumption. q–t RER. Data are presented as the mean ± SEM. Data with different superscript letters are significantly different (P < 0.05) using one-way ANOVA followed by Tukey’s multiple comparison post-test. P values in m–t were assessed by two-way ANOVA

