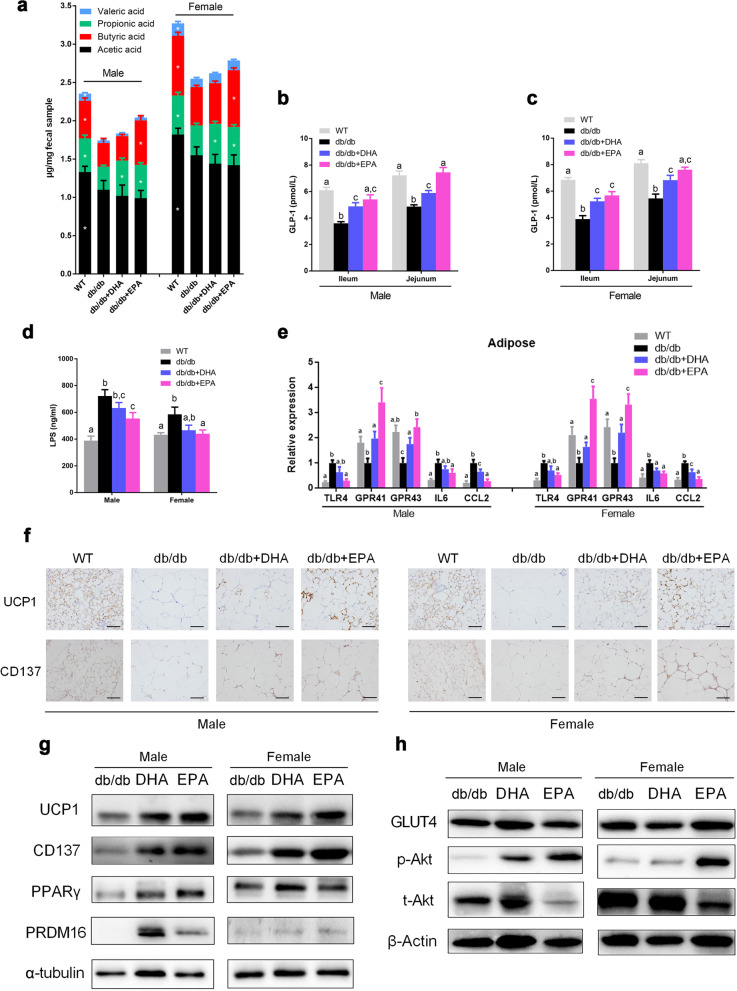
Fig. 6.
EPA and DHA promote SCFA production and beiging of WAT (n = 6 male and n = 6 female per group). a Individual SCFA levels in cecum content. b, c GLP-1 concentrations in small intestinal. d Serum LPS levels. e mRNA expression of TLR4, GPR41, GPR43, IL6, and CCL2 in WAT. f Representative images of UCP1 and CD137 staining in adipose tissues. Scale bar, 100 μm. g Representative adipose immunoblots for UCP1, CD137, PRDM16, and PPARγ. h Representative adipose immunoblots for GLUT4, p-AKT, and t-AKT. Graph bars with different superscript letters are significantly different (P < 0.05)

