Abstract
The biological roles of DNA methylation have been elucidated by profiling methods based on whole-genome or reduced-representation bisulfite sequencing, but these approaches do not efficiently survey the vast numbers of noncoding regulatory elements in mammalian genomes. Here we present a extended representation bisulfite sequencing (XRBS) method for targeted profiling of DNA methylation. Our design strikes a balance between expanding coverage of regulatory elements and reproducibly enriching informative CpG dinucleotides in promoters, enhancers, and CTCF binding sites. Barcoded DNA fragments are pooled prior to bisulfite conversion, allowing multiplex processing and technical consistency in low input samples. Application of XRBS to single leukemia cells enabled us to evaluate genetic copy-number variations and methylation variability across individual cells. Our analysis highlights heterochromatic H3K9me3 regions as having the highest cell-to-cell variability in their methylation, likely reflecting inherent epigenetic instability of these late replicating regions, compounded by differences in cell cycle stages among sampled cells.
CpG methylation contributes to the stability and transcriptional regulation of mammalian genomes 1-3. CpG density is bimodal, depleted from most of the genome, with the exception of high density CpG islands that are frequently promoter-associated 4,5. DNA methylation impacts diverse gene regulatory processes and is intricately regulated to guide complex biological processes such as embryogenesis, aging, and tumorigenesis 6-8. Beyond promoters, DNA methylation patterns at distal regulatory elements have been implicated in determining cell identity and chromatin structure, especially at enhancers and CTCF binding sites 9,10. Comprehensive profiling of DNA methylation is essential to understand cell state dynamics.
The gold standard method for reading CpG methylation is to convert unmethylated cytosines to uracil with bisulfite treatment prior to sequencing, while 5-methyl- and 5-hydroxymethylcytosines are protected from conversion. Whole genome bisulfite sequencing (WGBS) samples the entire genome, but is inefficient because vast CpG-depleted regions consume sequencing capacity. In contrast, reduced representation bisulfite sequencing (RRBS) uses restriction digest to enrich for CpG dense regions and thus provides high coverage of a fraction of the genome at reduced sequencing cost 11-13. However, RRBS lacks coverage of enhancer regions and CTCF binding sites that are outside of CpG islands. Methylation arrays can capture predefined regions of interest with high reproducibility, but require relatively large amounts of input material. Here, we present a strategy for profiling DNA methylation across promoters, enhancers and CTCF sites that is efficient and compatible with low input samples and single cells.
Results
A low input method for targeted DNA methylation profiling
We sought to design a DNA methylation assay with expanded coverage, including promoters, enhancers and other regulatory elements, that would allow multiplexing and analysis of low input samples. Such a method should enrich CpG-containing regions for efficiency, but not be limited to CpG island promoters. RRBS enriches CpG dense loci by purifying short genomic fragments after restriction by the methylation-insensitive enzyme MspI (cuts CCGG). Thus, RRBS captures fragments flanked by two proximate MspI sites on both ends 11,12. We tested whether a procedure that also captured sequences flanked by a single MspI site could expand sampling of functional elements. In-silico analysis indicated that such a method could capture significantly more CpG dinucleotides: considering all CpGs within 300 bases of an MspI site, the method could theoretically cover 14.8 million CpGs or 50.5% of all CpGs in the human genome. In comparison, RRBS covers 5.6% or 11.3% of CpGs if selecting fragments up to a length of 120 or 220 bases, respectively. More recent implementations (e.g. enhanced reduced representation bisulfite sequencing, ERRBS 14,15) that consider fragments up to a length of 320 bases cover 15.3% of CpGs (Extended Data Fig. 1a).
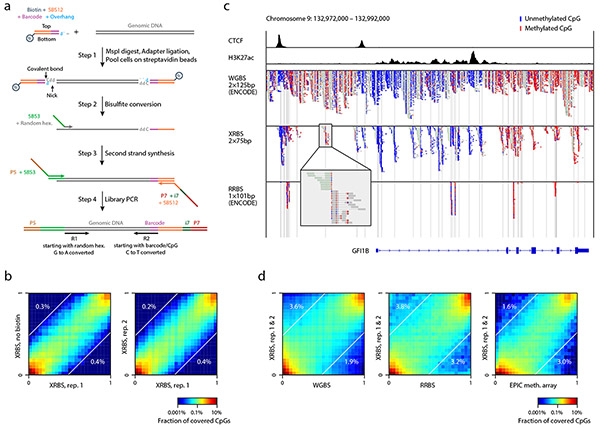
We implemented this strategy in the following experimental design. First, we optimized a one step incubation that combined MspI restriction and ligation of the restricted genomic fragments to adapters containing sample-identifying barcodes (Fig. 1a). Second, we pooled samples, captured adapted fragments, and removed excess volume in a biotin-enrichment step prior to bisulfite conversion 16. We designed barcoded adapters with a methylated top strand (bisulfite-protected) and a bottom strand that is unphosphorylated (preventing the formation of a covalent bond) and biotinylated. This enabled us to efficiently release fragments during a combined bisulfite conversion reaction. Third, we used a random hexamer extension step to incorporate a second adapter sequence (Fig. 1a). We reasoned that this approach would expand coverage to genomic sequences with isolated MspI sites, and recover degraded fragments that are generated during bisulfite conversion 17,18 and are prevalent in low-quality DNA samples such as FFPE tissues. In addition, hexamer sequences often prime imperfect matches and can thus be used as a unique molecular identifier (UMI) to identify duplicate reads originating from library PCR (see Methods).
Fig. 1 ∣. An extended representation DNA methylation profiling method compatible with low input samples.
A) Schematic of extended representation bisulfite sequencing (XRBS). Barcoding samples in a single well through sequential lysis, digestion, and ligation minimizes DNA loss. Binding biotinylated adapters to streptavidin beads enables multiple samples to be combined into a single bisulfite conversion reaction, minimizing batch effects introduced during conversion. Random hexamer-primed second strand synthesis recovers fragmented DNA. PCR amplification yields sequencing libraries.
B) Heatmaps compare individual CpG methylation values acquired by XRBS with or without biotinylated adapters (left, Pearson’s r=0.96), and between technical replicates (right, r=0.97) for K562 cells. Percentages indicate the fraction of CpGs that differed between conditions (difference in beta-values >0.5). Analysis limited to CpGs with at least 15-fold coverage (n=313,330 and 721,760 CpGs).
C) Genome plot for the GFI1B gene locus compares read coverage between XRBS and public WGBS and RRBS datasets for K562 cells. Boxes represent reads, and unmethylated (blue) and methylated (red) CpGs are indicated. CTCF and H3K27ac ChIP-seq tracks reveal functional elements. Vertical grey lines mark MspI restriction sites. Insert shows XRBS reads flanking an isolated MspI site, which is not covered by RRBS.
D) Heatmaps compare individual CpG methylation values between XRBS and public WGBS (r=0.91), RRBS (r=0.90), or EPIC methylation array (r=0.90) datasets for K562 cells. Percentages indicate the fraction of CpGs that differed between conditions (difference in beta-values >0.5).
We first generated libraries from 10ng of purified genomic DNA from K562 cells and sequenced technical replicate libraries to ~40 million paired-end reads (Extended Data Fig. 1b-d, Supplementary Table 1). In addition, we generated another replicate without the biotin enrichment step. We confirmed high concordance between all three replicates (Pearson’s r=0.96-0.97; Fig. 1b) and comparable library complexity in libraries with and without biotin (Extended Data Fig. 1e), ruling out negative effects of biotin on adapter ligation efficiency.
Next, we compared our extended representation bisulfite-sequencing method (XRBS) to WGBS and RRBS. Figure 1c illustrates a representative region at the GFI1B gene locus. While a high coverage WGBS profile shows uniform coverage across the entire 20kb region, read coverage from XRBS is enriched around individual MspI sites. XRBS achieves much higher coverage of the region than RRBS, including a 10kb intronic enhancer and multiple CTCF-binding sites. XRBS sequencing reads mapped to various positions up and downstream of isolated MspI restriction sites, consistent with our expectations and explaining the expanded coverage (Fig. 1c). DNA methylation values of individual CpGs correlate well between XRBS, WGBS, RRBS, and EPIC methylation array datasets (r=0.90-0.91; Fig. 1d). Taken together, XRBS generates accurate DNA methylation profiles, expands genomic sampling of sequences flanked by a single MspI site and is compatible with pre-bisulfite sample multiplexing.
XRBS expands coverage over enhancers and CTCF binding sites
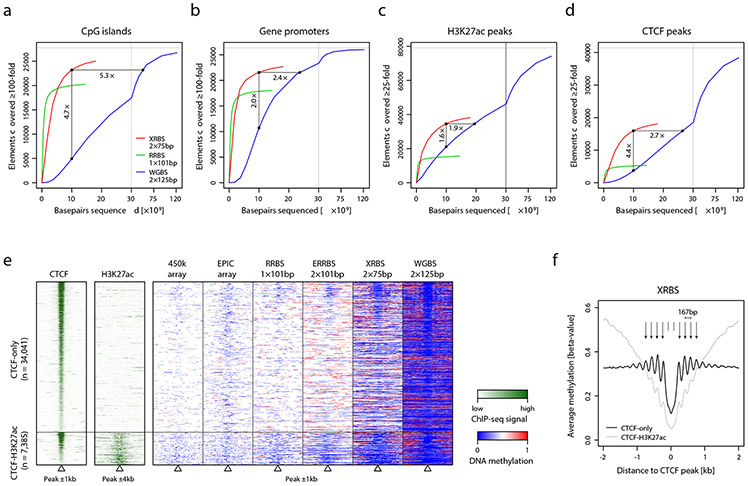
To evaluate coverage of functionally-relevant genomic regions, we systematically compared coverage and enrichment over elements such as CpG islands, gene promoters, enhancers, and CTCF binding sites. DNA methylation changes in each of these regions has been linked to transcriptional regulation 4,9,19-21. We compared the genomic coverage of these elements between XRBS, WGBS, and RRBS. For purposes of comparison, we downsampled each dataset to 10 billion base pairs of sequencing data (e.g., corresponding to 66.7 million 75 base paired-end reads in the case of XRBS). We considered an element to be covered if all contained CpGs accumulated to ≥100-fold coverage. With these criteria, XRBS captured 83.5% of CpG islands (compared to 72.0% for RRBS; Fig. 2a, Extended Data Fig. 2a-c). WGBS captured a lower fraction (17.8%) at this sequencing depth since it does not enrich for CpG-rich regions. We found that achieving similar coverage of CpG islands by WGBS would require ~5.3-fold deeper sequencing. Considering all promoters regardless of CpG-density, XRBS, RRBS and WGBS captured 81.7%, 67.7%, and 40.3%, respectively (Fig. 2b). Achieving a similar coverage by WGBS would require ~2.4-fold deeper sequencing than XRBS. When sequenced to saturation (~18 billion base pairs, corresponding to 120 million 75 base paired-end reads), XRBS captured 25,025 CpG islands (90.2%) and 22,684 gene promoters (86.1%).
Fig. 2 ∣. XRBS efficiently covers CpGs in regulatory elements.
A,B) Plots show the number of CpG islands (A) or promoters (B) with at least 100-fold combined coverage as a function of sequencing depth (x-axis) for XRBS (red), WGBS (blue), and RRBS (green) in K562 cells. Enrichment for functional elements at a uniform sequencing depth of 10 billion base pairs is indicated. Vertical grey line indicates break in x-axis scale.
C,D) Plots show the number of H3K27ac peaks (C) or CTCF peaks (D) with at least 25-fold combined coverage as a function of sequencing depth (x-axis) for XRBS (red), WGBS (blue), and RRBS (green).
E) Heatmap depicts 2kb genomic regions (rows, n=41,426 regions) centered at CTCF binding sites and stratified by overlap with H3K27ac peaks. Regions are divided into 100 equally sized windows. Panels from left to right show: CTCF ChIP-seq signal, H3K27ac ChIP-seq signal, and methylation calls from 450k methylation array, EPIC methylation array, RRBS, enhanced RRBS (ERRBS), XRBS, and WGBS. All datasets except XRBS and ERRBS were retrieved from ENCODE 51. ERRBS shows data from IMR90 cells 52.
F) Plot shows average DNA methylation levels from XRBS across 4kb regions centered at CTCF binding sites stratified by whether they overlap H3K27ac peaks. Periodicity of DNA methylation around CTCF binding sites is consistent with positioned nucleosomes, but more pronounced for CTCF-only sites.
We next considered coverage of enhancers and CTCF binding sites. Enhancers are distal gene regulatory elements that are marked by histone 3 lysine 27 acetylation (H3K27ac). DNA methylation over enhancers has been shown to negatively correlate with target gene expression 22. CTCF is a DNA-binding protein with roles in nuclear architecture. DNA methylation antagonizes CTCF binding at CTCF motifs, which frequently occur in regions of moderate to low CpG density. When sequenced to saturation, XRBS covers 38,211 H3K27ac peaks and 18,059 CTCF sites with ≥25-fold coverage, compared to 15,239 H3K27ac peaks and 5,170 CTCF sites with RRBS (Fig. 2c,d, Extended Data Fig. 2d, 3a). At a sequencing depth of 10 billion base pairs, XRBS captures 1.6-fold more H3K27ac peaks and 4.4-fold more CTCF sites than WGBS. Achieving a similar coverage using WGBS would require ~1.6-fold and ~2.7-fold deeper sequencing than with XRBS for H3K27ac and CTCF peaks, respectively.
To further analyze how XRBS performs relative to other DNA methylation profiling technologies, we visualized DNA methylation around CTCF binding sites (Fig. 2e). We found that the 10ng XRBS profile provided noticeably higher coverage compared to RRBS, Illumina 450k and EPIC methylation arrays. It revealed the nucleosome occupancy-associated periodicity of DNA methylation relative to CTCF binding sites, as reported previously (Fig. 2f; 23-25. Notably, this patterning was more pronounced at ‘CTCF-only’ binding sites, compared to CTCF binding sites overlapping H3K27ac peaks. We also evaluated capture of repetitive elements and found that XRBS profiles provided information on a number of LTR, SINE, and LINE families (Extended Data Fig. 3b,c). These collective analyses indicate that XRBS captures a wide spectrum of regulatory elements with higher efficiency and lower sequencing requirements.
XRBS detects differential DNA methylation across cell types
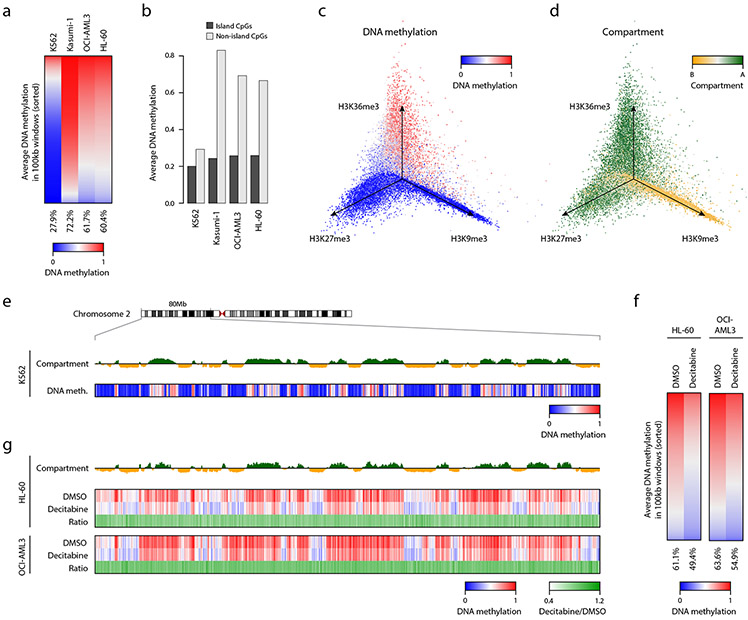
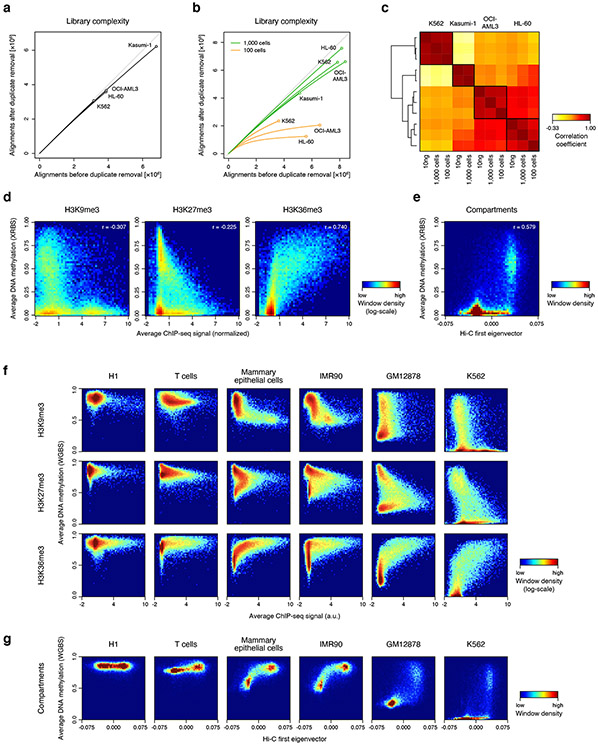
We next used XRBS to compare methylation patterns across biological samples. In addition to K562 cells, we generated XRBS libraries for three other leukemia cell lines (Kasumi-1, OCI-AML3, and HL-60) from 10ng of purified DNA, as well as 1,000 and 100 cells sorted directly into lysis buffer. Using low-coverage sequencing of ~5 million paired-end reads per library (Extended Data Fig. 4a-c), we found that K562 cells were globally hypomethylated (average beta-value = 0.28), Kasumi-1 cells were globally hypermethylated (average beta-value = 0.72) while OCI-AML3 and HL-60 showed intermediate methylation levels (average beta-value = 0.62 and 0.60, respectively; Fig. 3a). These differences in average global DNA methylation primarily reflect non-CpG island CpGs, as most CpG islands remain relatively hypomethylated across the cell lines (Fig. 3b).
Fig. 3 ∣. XRBS reveals variable hypomethylation in cell lines and in response to demethylating agent.
A) Heatmap shows genome-wide DNA methylation in 100kb windows across four cell lines. Windows are sorted by decreasing DNA methylation for each cell line. Average methylation for each cell line is indicated below.
B) Bar plot shows average DNA methylation levels for CpG islands and non-CpG island regions across cell lines. Individual samples are shown.
C) Isometric projection plot positions all 100kb genomic windows (dots) according to their normalized signal for three histone modifications in K562 cells. Windows are colored by average DNA methylation of non-island CpGs. Windows marked by repressive marks (H3K27me3 and H3K9me3) are generally unmethylated, while only windows marked by H3K36me3 are methylated, consistent with very low global DNA methylation in K562 cells (see also Extended Data Fig. 4F).
D) Isometric projection plot as in panel C but with windows colored by the Hi-C experiment-derived first eigenvector 21. The H3K36me3 and H3K27me3 histone marks overlap with compartment A, while the H3K9me3 mark overlaps with compartment B in K562 cells.
E) Genome plot shows average DNA methylation and the Hi-C-derived first eigenvector for K562 cells for a 80Mb genomic segment of chromosome 2. Megabase-scale hypomethylated blocks primarily overlap compartment B (orange), whereas shorter hypomethylated regions and hypermethylated regions overlap compartment A (green).
F) Heatmap shows genome-wide DNA methylation in 100kb windows across DMSO and decitabine treated HL-60 and OCI-AML3 cells. Windows are sorted according to DNA methylation for each treatment. Average methylation for each cell line is indicated below.
G) Genome plot for the same region as in panel E shows the Hi-C-derived first eigenvector illustrating compartments A (green) and B (orange) for HL-60 cells 26, and average DNA methylation for HL-60 or OCI-AML3 treated with decitabine or control. Ratio shows methylation difference between decitabine and control. Decitabine reduces methylation in both compartments to a similar extent.
To contextualize the extensive hypomethylation observed in K562 cells, we overlaid public data for histone modifications (ChIP-seq) and chromosome topology (Hi-C). We considered three modifications that mark active transcripts (H3K36me3), facultative heterochromatin (H3K27me3) or constitutive heterochromatin (H3K9me3). Examination of 100kb-windows revealed that DNA methylation strongly correlated with the active H3K36me3 mark (r=0.74), but negatively correlated with the inactive H3K27me3 (r=−0.31) and H3K9me3 marks (r=−0.23; Fig. 3c, Extended Data Fig. 4d). Next, we considered genomic compartments called from public Hi-C data 21,26. Compartment A is generally associated with active euchromatin, while compartment B represents transcriptionally silent heterochromatin. We found that compartment B regions were enriched for H3K9me3 and were largely hypomethylated, consistent with block hypomethylation and with prior reports of extreme hypomethylation in K562 cells (Fig. 3d,e, Extended Data Fig. 4e; 27. Hypomethylated regions in K562 were also detected in compartment A, and tended to associate with H3K27me3. In contrast, H3K36me3-positive regions were relatively hypermethylated, consistent with prior studies suggesting that H3K36me3 may protect regions from DNA methylation loss 28. We next compared these results in K562 cells to a broader range of cell types for which public DNA methylation, ChIP-seq and compartment data were available. As expected, we observed limited hypomethylation in H1 embryonic stem cells and primary T-cells (Extended Data Fig. 4f,g). Primary mammary epithelial cells and cultured IMR90 fibroblasts showed intermediate hypomethylation, with H3K27me3-positive regions being less methylated than H3K36me3-positive regions, but more methylated than H3K9me3-positive regions. The GM12878 cell line exhibited extensive hypomethylation of both H3K27me3- and H3K9me3-positive regions, but to a lesser extent than the severely hypomethylated K562 model.
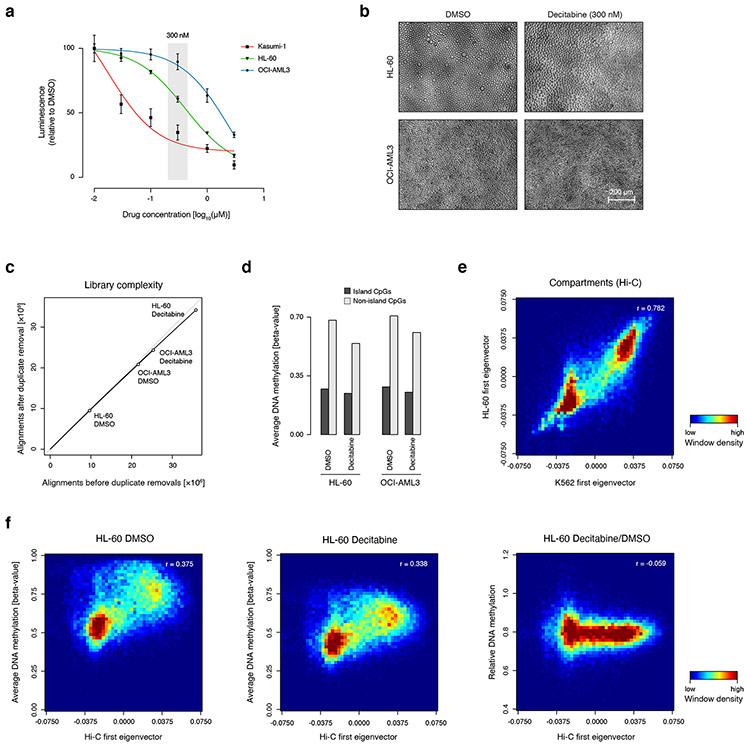
In order to detect differential methylation across an isogenic system, we treated cell lines with 300nM decitabine, which inhibits DNA methyltransferase enzymes through covalent entrapment on DNA (Extended Data Fig. 5a,b; 29. We treated HL-60 and OCI-AML3, as these had intermediate global methylation levels among the four cell lines examined, and profiled DNA methylation using XRBS (Extended Data Fig. 5c). Five days of decitabine treatment reduced average global methylation levels by 19.1% in HL-60 and 13.7% in OCI-AML3 (Fig. 3f). DNA methylation levels decreased more dramatically in non-island CpGs (20.2% and 14.0%), while CpG islands were less affected (9.5% and 11.2%; Extended Data Fig. 5d). Decitabine reduced methylation to a similar extent in both compartment A and B, irrespective of differences in original methylation levels (Fig. 3g, Extended Data Fig. 5e,f; 21,26. In conclusion, low-coverage XRBS reveals global differences in methylation levels over functional elements between different cell types, as well as widespread reduction in DNA methylation levels across these elements in response to decitabine treatment.
XRBS profiles inform enhancer states and CTCF binding
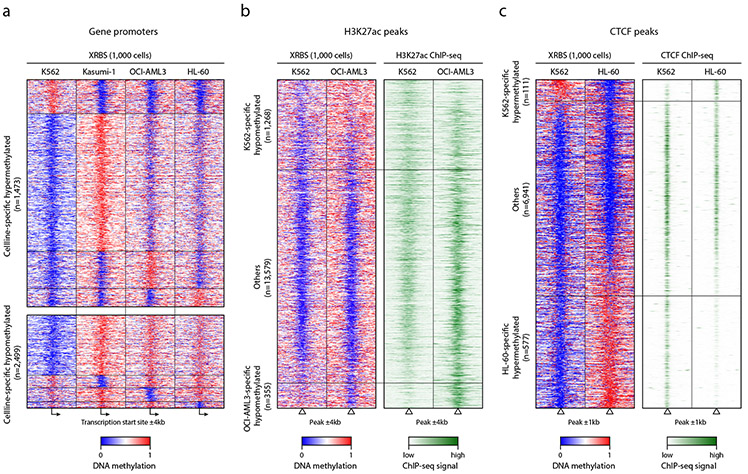
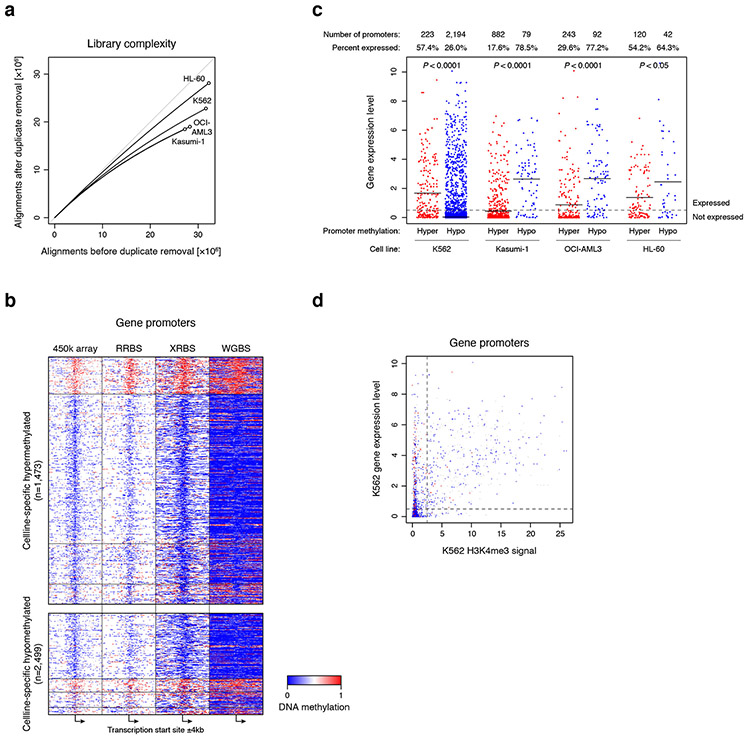
The increased coverage of XRBS (Fig. 2) provided an opportunity to investigate differential methylation over promoters, enhancers, and CTCF binding sites across cell types. We deeply sequenced 1,000 cell libraries from all four cell lines (Extended Data Fig. 6a). Of 1,473 promoters that were specifically hypermethylated in a single cell line, the majority were detected in Kasumi-1 (62.0%), in line with its high global DNA methylation levels (Fig. 4a, Extended Data Fig. 6b, Supplementary Table 2). We identified 2,499 promoters that were specifically hypomethylated in a single cell line, with the vast majority detected in the K562 cell line (92.4%). We further compared these results with available gene expression datasets. Promoters with cell-specific hypermethylation tended to lack RNA expression in the corresponding cell type (71.4%; Extended Data Fig. 6c). Conversely, promoters that were specifically hypomethylated in Kasumi-1, OCI-AML3 or HL-60 tended to be expressed in the corresponding cell type (75.1%). In contrast, promoter hypomethylation in K562 cells was not predictive of expression (Extended Data Fig. 6c,d), likely due to the pronounced global hypomethylation in this cell line.
Fig. 4 ∣. XRBS predicts regulatory states of functional elements.
A) Heatmap depicts 8kb genomic regions (rows, n=3,972 promoters) centered at transcription start sites and divided into 100 equally sized bins. Panels show average methylation from 1,000-cell XRBS profiles for the indicated cell types. Promoters (rows, ≥25-fold combined coverage in every cell line) are grouped by the cell line in which they are specifically hypermethylated (top) or hypomethylated (bottom). Hypomethylated promoters specific to K562 cells are downsampled for visualization. A full list of differentially methylated promoters is provided in Supplementary Table 2.
B) Heatmap depicts 8kb regions (rows, n=15,202 regions) centered on H3K27ac peaks identified in K562 and OCI-AML3 ChIP-seq datasets. Rows are ordered by DNA methylation difference between both cell lines. Panels show average methylation from 1,000-cell XRBS profiles and H3K27ac signals for K562 and OCI-AML3. Cell line-specific DNA hypomethylation correlates with H3K27ac signal. Peaks not specifically hypomethylated in either cell line (‘Others’) were downsampled for visualization.
C) Heatmap depicts 2kb regions (rows, n=7,629 regions) centered on CTCF peaks identified in HL-60 and K562 CTCF ChIP-seq datasets. Rows are ordered by DNA methylation difference between both cell lines. CTCF peaks with cell type-specific DNA hypermethylation are depleted for CTCF binding in the respective cell line. Peaks not specifically hypermethylated in either cell line (‘Others’) were downsampled for visualization.
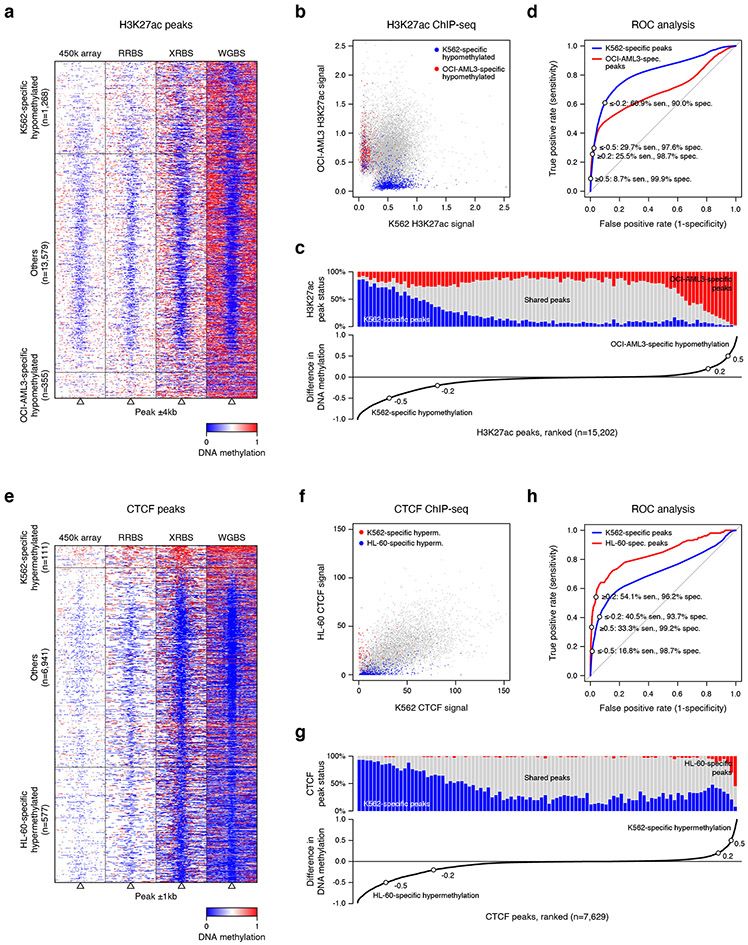
We next examined whether differential DNA methylation over enhancers could act as a surrogate marker for H3K27ac 30-32. We aggregated 16,825 H3K27ac peaks from ChIP-seq datasets for K562 and OCI-AML3 cells that were covered in our XRBS dataset. Of these peaks, 7.5% and 2.1% were specifically hypomethylated in K562 and OCI-AML3 cells, respectively, while the remaining 90.3% were predominantly hypomethylated in both cell lines (Fig. 4b, Extended Data Fig. 7a,b). Of peaks specifically hypomethylated in OCI-AML3 cells, 98.9% overlapped an H3K27ac peak in OCI-AML3, compared to 3.7% in K562 (P < 0.0001, Fisher’s exact test; Extended Data Fig. 7c,d). Conversely, of peaks specifically hypomethylated in K562 cells, 86.5% overlapped H3K27ac peaks in K562, compared to 22.6% in OCI-AML3 (P < 0.0001). Hence, hypomethylation correlates with H3K27ac, indicating that XRBS methylation profiling is an efficient method to infer enhancer activity.
We also evaluated whether XRBS could detect differential CTCF binding. CTCF binding often occurs in CpG sparse regions, but is antagonized by DNA methylation 33,34. We evaluated differential DNA methylation over a merged set of CTCF binding sites from HL-60 and K562 cell lines that were covered in our XRBS data (n=7,629). We found a close correspondence between cell line-specific hypomethylation and CTCF binding (Fig. 4c, Extended Data Fig. 7e,f). Of peaks specifically hypermethylated in HL-60 cells (n=577), only 9.9% coincided with a CTCF peak in HL-60, compared to 99.8% in K562 (P < 0.0001, Fisher’s exact test; Extended Data Fig. 7g,h). Conversely, of peaks specifically hypermethylated in K562 cells (n=111), 52.3% were overlapping a CTCF peak in K562, compared to 88.3% in HL-60 (P < 0.001). Hence, XRBS methylation data can serve as a proxy for CTCF binding.
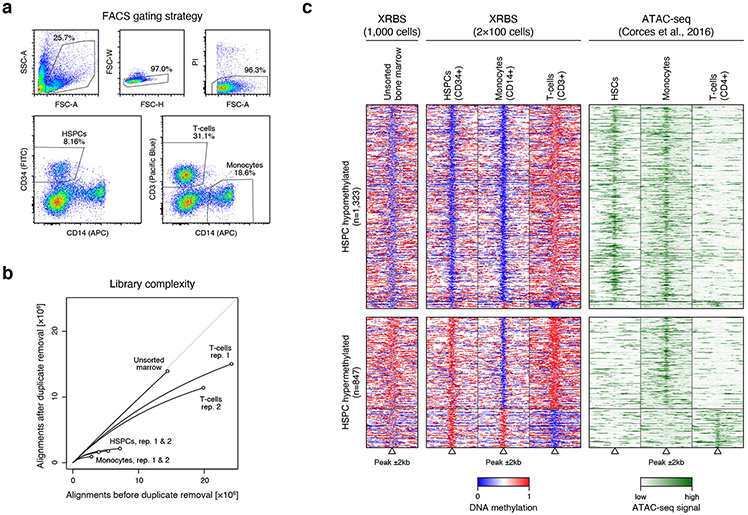
Finally, we leveraged the high sensitivity of XRBS to profile DNA methylation of sorted hematopoietic cell populations from a limited human bone marrow sample. We specifically profiled hematopoietic stem/progenitor cells (HSPCs), monocytes and T-cells, in each case generating XRBS data from 100 flow sorted cells (Extended Data Fig. 8a,b). We identified 2,170 differentially methylated candidate regulatory elements 35 between monocytes and T-cells that were covered in our XRBS data (Extended Data Fig. 8c). We found that elements specifically hypermethylated in T-cells (n=1,872) frequently gained methylation relative to undifferentiated HSPCs (68.2%), while elements specifically hypermethylated in monocytes (n=298) more often shared their methylation state with HSPCs (84.6%, P < 0.0001, Fisher’s exact test). We evaluated whether this differential DNA methylation correlated with differences in chromatin accessibility as measured by ATAC-seq 36. There was a high correlation (Spearman’s r=0.37-0.52) between DNA hypomethylation and chromatin accessibility across all three cell types (Extended Data Fig. 8c). These collective results indicate that XRBS can evaluate DNA methylation over regulatory elements and predict their activity or binding state in cultured cell lines as well as in limited populations of purified primary cells.
Multimodal single cell profiling using XRBS
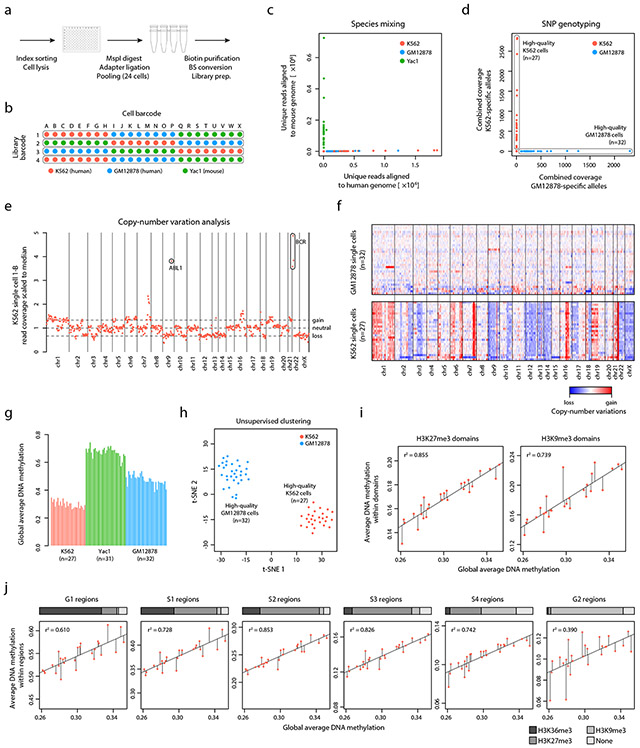
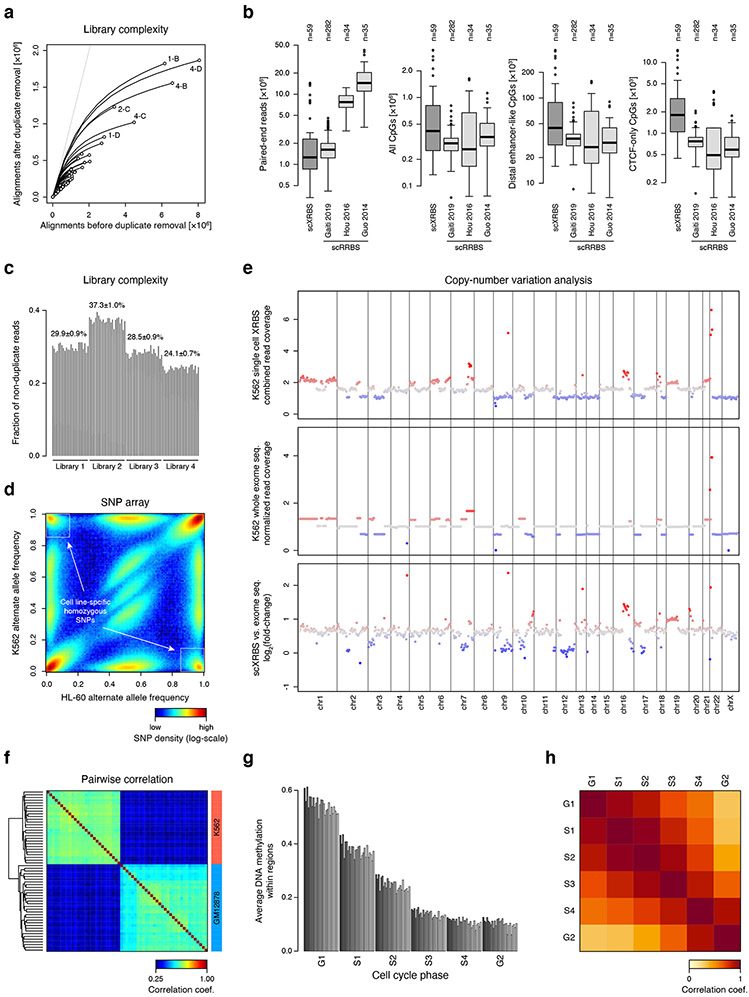
Key features of XRBS that enable multiplexing, such as early barcoding and pooled bisulfite conversion, could be well-suited for single cell profiling. We specifically reasoned that multiple single cells could be barcoded upfront using biotinylated adaptors and combined into a single bisulfite reaction on streptavidin beads. This could increase sensitivity at low inputs and reduce the variability introduced by bisulfite conversion by treating multiple samples in a single reaction. We therefore index sorted single cells from human (K562 and GM12878) and mouse (Yac1) cell lines into a 96-well plate. In each well, we restricted DNA with MspI and ligated one of 24 cell-identifying barcoded biotinylated adapters (Supplementary Table 3). We then combined reactions into four pools and performed bisulfite conversion (Fig. 5a,b). We next carried out second strand synthesis and library amplification with four separate library barcodes. Sequencing of these single cell libraries to high depth yielded up to 1.87 million unique reads and 3.43 million CpGs (coverage ≥1-fold) in a single cell profile (Extended Data Fig. 9a,b). An inherent feature of single cell XRBS (scXRBS) is the ability to call PCR duplicates based on the mapping position and sequence of the hexamer-primed end; we found that the PCR duplication rate was similar across cells within a pool (Extended Data Fig. 9c). An additional advantage of the method, relative to single cell RRBS (scRRBS), is the notably increased coverage of CpG-sparse regulatory elements (Extended Data Fig. 9b).
Fig. 5 ∣. Single cell XRBS reveals epigenetic and genetic heterogeneity.
A) Schematic of single cell experimental setup. Cells are sorted into separate barcoding reactions, and then pooled for subsequent bisulfite conversion, hexamer extension, and library amplification.
B) Schematic shows barcoding strategy for 96 single cells from three cell lines (K562 red, GM12878 blue, and Yac1 green) through a combination of 24 single cell barcodes and four library barcodes.
C) Scatterplot shows for each scXRBS profile (dots) the number of reads that align specifically to the mouse genome (x-axis) versus the human genome (y-axis), confirming the absence of cross contamination between human and mouse cells prepared in the same reaction pool.
D) Scatterplot shows for each single K562 or GM12878 cell XRBS profile (dots) coverage of homozygous SNPs specific to K562 (y-axis) or GM12878 (x-axis) cells, confirming the absence of cross contamination between the two human cell lines.
E) Plot shows copy number variations for single K562 cells inferred from XRBS profiles. Amplification of the prototypic BCR-ABL fusion is detected.
F) Heatmap depicts copy number variations inferred for single GM12878 (n=32, top) and K562 cells (n=27, bottom). Single cells are ordered in decreasing read coverage. Single GM12878 cells are largely copy number neutral, while single K562 cells exhibit multiple chromosomal and sub-chromosomal abnormalities.
G) Barplot shows the average genome-wide DNA methylation for high-quality single cell K562, GM12878, and Yac1 profiles.
H) Plot shows t-SNE analysis of pairwise distances between high-quality single cell K562 and GM12878 profiles.
I) Scatterplots compare single cell average DNA methylation within H3K27me3 domains (y-axis, left) and H3K9me3 domains (right) against genome-wide average DNA methylation levels (x-axis). Diagonal lines indicate results from linear regression analysis and residuals for each single cell.
J) Scatterplots compare single cell average DNA methylation within various early and late replicating regions (y-axis) against genome-wide average DNA methylation levels (x-axis). Horizontal bar above each plot shows the fraction of regions associated with active and repressive histone marks (H3K36me3, H3K27me3, and H3K9me3). Diagonal lines indicate results from linear regression analysis and residuals for each single cell.
To evaluate cross contamination between cells or barcodes, we studied mouse and human single cells from the same bisulfite reaction. Alignment of scXRBS data to genomes from both species confirmed that barcode cross contamination was extremely rare (Fig. 5c). Furthermore, we could distinguish K562 and GM12878 cells based on homozygous single nucleotide polymorphisms (SNPs), providing further evidence for minimal cross-contamination (see Methods; Fig. 5d, Extended Data Fig. 9d, Supplementary Table 4). The experiment yielded high-quality sequencing data for 27 K562 cells, 32 GM12878 cells and 31 Yac1 cells.
In addition to gaining epigenetic and SNP information, we used scXRBS methylation profiles to determine genetic copy-number variations (CNVs) in the same single cells. We developed a computational approach that calculated the relative read coverage in 637 bins across the genome (see Methods). Comparing K562 cells to GM12878 cells (which show a predominantly normal karyotype), we detected CNVs in the single cell data that were consistent with bulk sequencing (Fig. 5e,f, Extended Data Fig. 9e). These included a BCR-ABL amplification characteristic of K562 cells 37,38. Individual scXRBS methylation profiles also showed sporadic chromosomal gains and losses that are consistent with genetic instability in both cell lines. Thus, XRBS profiles provide simultaneous insight into the methylation and activity of functional elements and genetic aberrations in the same single cells.
A challenge in evaluating cell-to-cell variability of DNA methylation relates to low coverage and the rate with which individual CpG dinucleotides are reproducibly covered across single cells. We considered whether this could be addressed by XRBS. We found that 93.3±1.1% of CpGs sites covered in a given single K562 or GM12878 cell were also covered in at least one other cell. Average DNA methylation levels were similar across single cells of a given cell type (29.9±2.6%, 67.5±3.5% and 47.5±3.7% for K562, Yac1 and GM12878, respectively; Fig. 5g). Furthermore, single cell methylation profiles from a given human cell line were highly correlated (Extended Data Fig. 9f), and could be clearly clustered by t-SNE dimensionality reduction analysis (Fig. 5h).
We next considered the relationship between variability in DNA methylation and chromatin states. Relative to global DNA methylation levels, we found that H3K9me3-marked genomic regions were associated with the highest cell-to-cell variability. In contrast, H3K27me3-marked regions had lower cell-to-cell variability despite having similar average DNA methylation levels (Fig. 5i). Based on prior observations, we hypothesized that this heterogeneity is related to replication timing, where late replicating H3K9me3 regions may less accurately maintain their DNA methylation levels 28,39. Integration of our DNA methylation data with replication timing data for K562 cells 40 confirmed that late replicating regions (“G2 phase”) were indeed the most variable (Pearson’s r2=0.39) and showed the lowest average DNA methylation levels overall (Fig. 5j, Extended Data Fig. 9g,h). Furthermore, early replicating regions, marked by H3K36me3 and H3K27me3, exhibited less cell-to-cell variability (r2=0.69±0.17) and higher average DNA methylation levels. Our results support a model in which DNA hypomethylation observed in many cell lines and tumor samples reflects two separate mechanisms: First, hypomethylation in inaccessible, heterochromatic regions is caused by cumulative loss of DNA methylation at CpGs that have not maintained their parental methylation state before re-entering subsequent cell division. Second, we speculate that asynchronous sampling of single cells at different timepoints between DNA replication and cell division, during which DNA methylation is propagated to nascent daughter strands, also significantly contributes to the apparent DNA methylation heterogeneity of late replicating regions in single cell methylomes.
Discussion
DNA methylation of CpG dinucleotides impacts transcriptional activity and genome stability, and is altered in human disease. XRBS leverages an early barcoding step for high sensitivity and sample multiplexing, making it highly scalable and amenable to limited samples and single cells. XRBS enriches for regions where CpG methylation has been shown to be functionally relevant - promoters, CpG islands, CTCF insulators, and enhancers 41. It thus provides significant advantages over prior methods in terms of its efficiency, coverage, and sensitivity.
Single cell XRBS data enabled us to resolve DNA methylation, to link heterogeneity to late replicating domains, and to coordinate epigenetic changes with genetic features, including CNVs and SNPs. XRBS provides an alternative to the existing repertoire of single cell epigenetic technologies 42-44 as a highly multiplexed method that targets informative genomic regions and is compatible with small inputs and single cells. Although sparsity remains an issue with scXRBS, we note that its inherent efficiency and enrichment improves the reproducibility with which individual CpG dinucleotides can be measured and compared across cells. The method and computational strategies introduced here can be used to contextualize single cell DNA methylation within a background of genetic alterations, an area of particular interest for the field of cancer epigenetics 45. Single-cell XRBS data revealed that late replicating H3K9me3-marked regions exhibit the highest cell-to-cell variability in DNA methylation, building on previous reports 28. We suggest this heterogeneity is a result of the innate variability of these regions, and is likely compounded by asynchronous cell cycle phases of the individual profiled cells. Future iterations of XRBS could leverage droplets or nanowells to increase throughput and gain new insights into methylomes and their variability in tissues, tumors, and experimental models.
Methods
Biological samples
K562 (CCL-243), HL-60 (CCL-240), and Yac-1 (TIB-160) were obtained from ATCC. OCI-AML3 was obtained from DSMZ (ACC 582). All cell lines were routinely tested for mycoplasma contamination and maintained in a 37°C humidity-controlled incubator with 5.0% CO2. Cells were maintained in exponential phase growth by passaging every 3 to 4 days. Cells were grown in RPMI supplemented with 10% heat inactivated fetal bovine serum and 1% penicillin/streptomycin.
Bone marrow donors consented to an excess sample banking and sequencing protocol that covered all study procedures and was approved by the Institutional Review Board (IRB) of the Dana-Farber/Harvard Cancer Consortium.
DNA purification
Cells were collected and washed in cold PBS twice and then the pellet was snap frozen in liquid nitrogen. DNA was harvested by thawing the cell pellets at room temperature and resuspending in PBS, as directed by the Qiagen DNA Mini Blood Kit (51104).
Flow Sorting and Cellular Lysis
For experiments directly performed on cell lines (1,000, 100, and single cell experiments), viable cells were counterstained with 1:1000 μL of propidium iodide in PBS. Primary human bone marrow was thawed and viable cells were counted using Trypan stain and a hemocytometer. Cells were stained for 20 mins on ice with 1:100 CD3-Pacific Blue (BD Biosciences 558124) for T cells, 1:1000 CD14-APC (Beckman Coulter IM2580U) for monocytes, and 1:100 CD34-FITC (BD Biosciences 348053) for HSPCs. Viable cells were gated and sorted using the Sony SH800 sorter into 96 well plates preloaded with 3 μL of lysis buffer (40 mM Tris-Ac, 1mM EDTA, and 1 mM DTT). Incubation at 75°C for 30 minutes was followed by adding 0.5 μL of Qiagen Protease and a 4 hour incubation at 55°C and a 30 minute incubation at 75°C to inactivate the proteinase 46.
Barcoded Adapters
Adapters consisting of a methylated top strand and biotinylated bottom strand were resuspended in Tris EDTA (TE) buffer at 100 μM, and annealed prior to use. All adapters and primers described in this study were obtained from IDT. Briefly, annealing of adapters involved combining equimolar volumes of each adapter and heating to 95°C for 5 mins, followed by slow cooling to 4°C at a rate of 0.1°C/sec. The methylated top strand contains a partial SBS12 sequence followed by an 8 base C-depleted barcode (top strand: 5’-/5SpC3/GG AGT T/iMe-dC/A GA/iMe-dC/ GTG TG/iMe-dC/ T/iMe-dC/T T/iMe-dC//iMe-dC/ GAT /iMe-dC/TD DDD DDD D-3’). The biotinylated bottom strand complements the methylated top strand with an additional two bases at the 5’ end (5’-CG-3’) complementary to the sticky end left by the MspI enzyme (bottom strand: 5’-CGH HHH HHH HAG ATC GGA AGA GCA CAC GTC TGA ACT CC/3Bio/−3’). The 5’ end of the bottom strand is left unphosphorylated, which prevents the formation of a covalent bond to the 3’-OH of a digested DNA fragment. The final ligation product of an adapter to an MspI-digested DNA fragment therefore has a nick between the biotinylated bottom strand adapter and the DNA fragment, facilitating efficient release from streptavidin beads during bisulfite conversion.
For designing sets of barcodes for multiplexing, we considered both base distribution and color distribution on Illumina 2-channel instruments: We first identified all 3,468 C-depleted barcodes that contained at least one A, T, and G, and the same nucleotide not more than three times in a row. We then selected a set of 96 barcodes that had the highest minimum distance between any pair (at least 3) and the highest average distance between all pairs. Recommended subsets of 4, 8, 16, and 32 barcodes are provided in Supplementary Table 3.
Digestion and Ligation
3 μL of digestion and ligation reagents are added to each well, which held 3 μL of either purified DNA or lysis buffer containing sorted cells. The final reaction contains 10 U MspI enzyme (NEB R0106M), 800 U T4 DNA ligase (NEB M0202M), 1.5 mM ATP (NEB P0756L), 10 nM annealed barcoded adapter, and 1x CutSmart Buffer that is compatible with both MspI restriction enzyme and T4 DNA ligase. The reaction is incubated for 2 hours at 37°C and 1 hour at 22°C, followed by 4°C hold. Both digestion of the DNA with MspI and ligation to double stranded adapters occur concurrently. Adapter sequences were designed such that adapter ligation to digested DNA ends does not result in a new MspI restriction site. When digestion and ligation occur simultaneously, the equilibrium shifts from intramolecular ligations (between two MspI digested DNA fragments) to intermolecular ligations (MspI DNA and adapter). We chose to design adapters with an overhang in order to obviate a fill-in and A-tailing step used in many RRBS library preparation protocols.
Streptavidin Bead Binding & Sample Combination
C1 streptavidin beads (Thermo Fisher 65001) were washed with 1x Bind & Wash (B&W) buffer three times according to the kit instructions. Beads are resuspended in 2x B&W buffer and 10 μL are distributed to each reaction. The beads are incubated with barcoded samples on a rotator at room temperature for 15 minutes. For multiplexed single cell libraries, the beads from 24 distinctly barcoded wells are combined and placed in an eppendorf tube. Using a magnet the beads are separated from the solution containing enzymes and resuspended in 20 μL of water. Resuspended beads are then added to 130 μL of conversion reagent for the bisulfite conversion.
Bisulfite Conversion
Bisulfite conversion was performed directly on DNA bound to streptavidin beads, using the Zymo DNA Methylation Lightning Kit (D5046) according to the manufacturer’s instructions with the following modification: After the initial conversion reaction at 98°C, the reactions are transferred to an eppendorf and the streptavidin beads are pelleted through centrifugation at 4°C for 10 mins at 16,000 rcf. The supernatant, containing single-stranded, bisulfite-converted DNA with a 5’ barcoded methylated adapter, is separated from the beads and processed further. Bisulfite converted DNA is eluted in 26 μL of water.
Hexamer Extension and Clean Up
Bisulfite converted single stranded DNA is mixed with 1x NEB Buffer 2.1, 0.4 mM dNTP mix, and 2 μM random hexamer primer (5-TAC ACG ACG CTC TTC CGA TCT NNN NNN-3’). The solution is heated at 95°C for 45 seconds and then transferred immediately to ice. 1 μL of Klenow enzyme (Enzymatics P7010-HC-L), which has strand displacing activity, is added to each reaction. Hexamer base pairing is mediated through a gradual increase in temperature from a 4°C incubation and an incremental increase in temperature to 37°C at a rate of 1°C per second. Multiple hexamers can bind during this step. Klenow enzyme extends the hexamer primer generating the second strand during a 37°C incubation for 1.5 hours. Because of the strand displacing activity, the hexamer bound farthest from the MspI site is extended and displaces other shorter hexamer extension products. This results in a linear amplification, with single stranded products as well as a double stranded fragment of the longest extension product. A 1x SPRI is used to remove excess hexamer primer and is eluted in 12 μL of water. 10.5 μL of the elute is used for the final library PCR. Library fragment size distribution is 150 to 600 basepairs and peaks around 300 base pairs.
PCR and Clean Up
A final library amplification is carried out with 2x KAPA HiFi U+ mix (Kapa KK2801) and 0.4 μM P5 and P7 PCR primers with 6+14 cycles. 98°C 1 min; 6x (98°C 20 sec, 58°C 30 sec, 72°C 1 min); 16x (98°C 20 sec, 65°C 30 sec, 72°C 1 min); 72°C 3 min; 4°C hold. 1x SPRI is used to clean up excess library primers. The following primer sequences were used: P7 primer with i7 index: 5-CAA GCA GAA GAC GGC ATA CGA GAT -i7- GTG ACT GGA GTT CAG ACG TGT GC TCT T-3’; P5 primer without i5 index: 5’- AAT GAT ACG GCG ACC ACC GAG ATC TAC ACT CTT TCC CTA CAC GAC GCT CTT CCG ATC T-3’; P5 primer with i5 index: 5’-AAT GAT ACG GCG ACC ACC GAG ATC TCA C -i5- AC ACT CTT TCC CTA CAC GAC GCT CTT CCG ATC T-3’. Index sequences used in this study are provided in Supplementary Table 1.
Decitabine treatment
Influence of decitabine treatment on viability of Kasumi, HL-60, and OCI-AML3 cells was evaluated through a drug dose response curve. Cells were plated and treated for 5 days with half-log concentrations ranging from 10 nM - 3 μMof decitabine. 30,000 Kasumi cells, 10,000 HL60 cells, and 50,000 OCI-AML3 cells were seeded per well of a 96 well plate based on the recommended seeding density of each cell line. The total volume was 100 μL after drug treatment on day 0. At day 3, cells were imaged and an additional 50 μL of 1x drug in RPMI culture media was added and mixed with the cells. At day 5, 50 μL of CellTiter-Glo reagent was added, followed by an 8 minute incubation on a rotator at room temperature. Luminescence was imaged using a plate reader and data was plotted using PRISM 2.14.
For XRBS profiles, HL-60 and OCI-AML3 cells were treated with 300 nM decitabine in 6 well plates. Cells were harvested after 5 days and gDNA was extracted using Qiagen DNA Mini Blood Kit (51104). 10ng of gDNA were used for each library preparation.
Next-generation sequencing and barcode splitting
All libraries were sequenced using the Illumina NextSeq 500 platform according to manufacturer’s instructions. Paired-end data was generated using either 2x36 or 2x75 sequencing cycles, as detailed in Supplementary Table 1, and split by single-index or dual-index library barcodes using bcl2fastq. The 8bp sample barcode is located at the beginning of read 2, which is mostly C-to-T converted. The 6bp random hexamer sequence is located at the beginning of read 1, which is mostly G-to-A converted and provides a higher complexity sequence for read 1 based cluster identification on the Illumina platform. Fastq files were first split by expected sample barcodes, allowing for one mismatch. For libraries that contained only a single sample barcode, two mismatches were allowed. For one sequencing run that showed poor read quality at the beginning of read 2 due to low sequence complexity, we included all reads for a given library barcode (labeled ‘NA’ in Supplementary Table 1). Notably sequencing with multiple barcodes improves read quality because increased cluster diversity on the flow cell supports their discrimination. If sequencing a single barcode is unavoidable, we recommend using dark cycles to avoid the issue of low complexity at the beginning of read2 and spiking-in of other genomic libraries. Sample barcode and random hexamer sequence were trimmed from read 1 and read 2, and appended to the read identifier. Subsequently, read 1 and read 2 were swapped to ensure compatibility with downstream analysis tools. Resulting fastq files are provided on GEO/SRA (GSE149954).
Genome alignment and DNA methylation calling
Before alignment, primer dimers were filtered using Cutadapt version 2.7 and the following parameters: --discard -a GCTCTTCCGATCT. Short read pairs were trimmed using TrimGalore version 0.6.5 and the following parameters: --paired --illumina --nextseq 20. High-quality sequencing reads were then aligned to an in-silico bisulfite-converted reference genome (hg38 and mm10) using methylCtools version 1.0.0 (https://github.com/hovestadt/methylCtools, 47 and bwa mem version 0.7.17. Sorted alignments were further processed to only maintain uniquely mapped read pairs with a mapping score ≥1, that were mapping to an MspI cut site, and that had an insert size between 20bp and 600bp. Putative PCR duplicates were removed by considering the outer mapping position of both paired-end reads (read 2 being located at the MspI cut site, read 1 being located at variable positions), as well as the random hexamer sequence that was trimmed prior to alignment and functions as a unique molecular identifier (UMI). For library complexity analysis, alignments were downsampled prior to this step. We note that multiple random hexamer priming events during the second strand synthesis step might lead to additional sequencing reads from the same original fragment that cannot be identified using this approach. DNA methylation calling was performed using methylCtools bcall and the --trimPE parameter. Detailed quality metrics for each library are provided in Supplementary Table 1. DNA methylation values were deposited on GEO (GSE149954) for all samples reported in this study.
Visualization and differential DNA methylation analysis
All downstream analyses were performed in R (version 3.6.2), making extensive use of the data.table and GenomicRanges packages. We combined methylated and unmethylated calls for both strands of a CpG dinucleotide prior to calculating beta-values. For many analyses, average DNA methylation values within genomic regions were used. Regions include CpG islands, promoters (1kb up- and downstream of all transcription start sites of protein-coding genes), H3K27ac peaks, CTCF binding sites (ENCODE narrowPeak files), and genomic 100kb-windows. For these analyses, average methylation values within these regions were calculated by summarizing calls for methylated and unmethylated CpGs across the entire region, and then calculating a single beta-value. For 100kb-windows, CpGs within islands were not included. Minimum coverage thresholds were applied as indicated. Similarly, average methylation values were calculated for each genomic bin when visualized as heatmaps (genomic regions were separated in 100 equally-sized bins). Differential DNA methylation analysis was performed by sorting regions according to their difference in average methylation values (for H3K27ac peaks and CTCF binding sites) or by applying a threshold (0.5) on the difference between the average methylation values of one cell line to the average of the other three cell lines (for promoters).
External datasets
A full list of the published datasets used in this study is provided in Supplementary Table 5. Briefly, whole-bisulfite sequencing data (WGBS) and reduced-representation bisulfite sequencing data (RRBS) for K562 cells, as well as enhanced reduced-representation bisulfite sequencing data (ERRBS) for IMR90 cells, was downloaded as raw fastq files and processed similar to XRBS datasets to allow for a direct comparison. For comparisons that indicate the number of sequenced bases (e.g. Fig. 2a-d, Extended Data Fig. 2b-d), we used the number of high-quality sequencing reads (multiplied by the read length) to adjust for quality differences between sequencing runs that are less likely to represent differences between methods. For XRBS, WGBS, ERRBS, and RRBS datasets, high-quality reads represent 85.2%, 87.9%, 85.4%, and 58.6% of reads coming from the sequencer, respectively. Single cell RRBS datasets were downloaded as methylation calls if available 45,48, or reprocessed from fastq files 49. Hi-C datasets were downloaded as hic files and processed using Juicer tools to generate eigenvectors at 100kb resolution. For comparison to Hi-C eigenvectors, other datasets were converted to the hg19 assembly using the liftOver tool. All other analyses were performed using the hg38 assembly.
Single-cell genotyping analysis
We first identified single-nucleotide polymorphisms (SNPs) that were homozygous for different alleles in K562 and GM12878 cell lines. For this purpose, we obtained Illumina Infinium Omni5Exome-4 data from ENCODE and calculated allele frequencies using the GenomeStudio software. We identified 153,154 SNPs that distinguished the two cell lines (allele frequency smaller 0.15 or larger 0.85, shown in Extended Data Fig. 9d). These positions were assessed in the genome alignments of each single cell using samtools mpileup (version 1.8) and the following parameters: -v -t DP,AD --max-depth 1000000. Resulting vcf-files were further processed in R (version 3.6.2) matching allele counts from sequencing data to annotated genotypes. We filtered allele counts that were not informative because of the C-to-T conversion of unmethylated cytosines during bisulfite treatment. This filtering step was performed taking into account the strandedness of the originating genomic strand, thereby salvaging half of the sequencing information contained in this context. Specifically, we were able to retain information from a G/A context from positive strands and a C/T context from negative strands. Finally, we summarized K562- and GM12878-specific allele counts for each single cell (shown in Fig. 5d, summarized counts provided in Supplementary Table 4).
Single-cell copy-number variation analysis
We developed an approach that uses read coverage at MspI restriction sites to estimate copy-number variations (CNVs) in single cell XRBS data. For this purpose, we first generated genomic bins based on the combined read coverage of the predominantly copy-number neutral GM12878 cells (32 cells). Each chromosome was separated into bins that each had a combined coverage of ~10,000 reads. Across all chromosomes, a total of 637 bins were generated. Read coverage within bins was then quantified for each single cell from the K562 and GM12878 cell lines relative to the exact combined coverage in GM12878 cells. Individual CNV profiles were further normalized by the total read coverage in each single cell (shown in Fig. 5e,f). We verified the validity of this approach by comparing results for the K562 cell lines to a published copy-number data based on exome-sequencing 50. While a number of chromosomal regions shown alternating copy-number states between the two approaches, this likely reflects differences in the cells used for these analyses, as other copy-number variations are detected at high resolution (for example in chromosome 1, shown in Extended Data Fig. 9e)
Extended Data
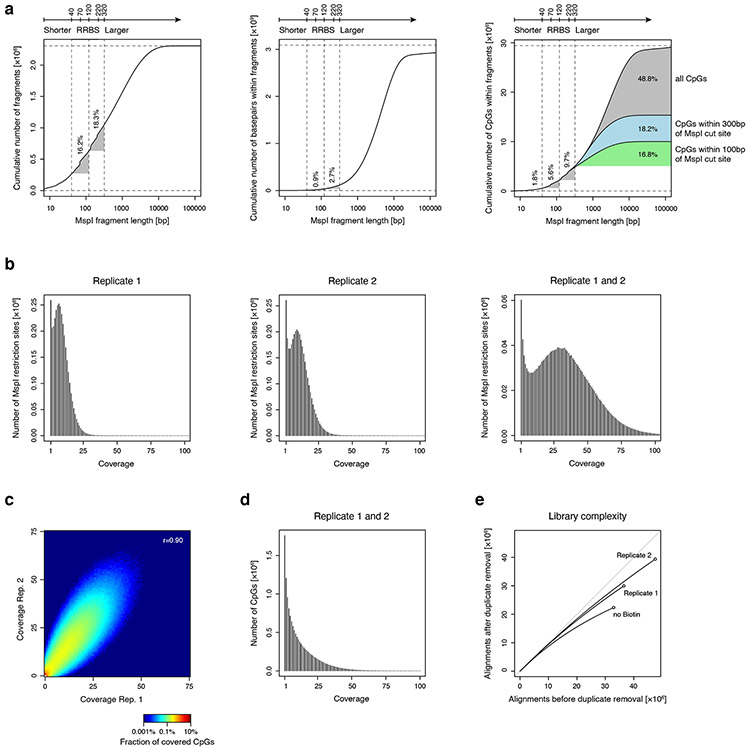
Extended Data Fig. 1 ∣. Evaluation of single MspI anchor design for methyl-CpG profiling.
A) Plots show results from an in silico MspI restriction digest analysis of the human genome. The cumulative number of MspI fragments (total of 2.3 million, left), of basepairs (total of 3.1 billion, middle), and of CpGs (total of 29.4 million, right) is shown relative to increasing MspI fragment length. Vertical dotted lines show the size range of fragments captured in typical RRBS experiments. This analysis shows that RRBS of MspI fragments 40-120 bases in length covers only 0.9% of the genome, but enriches for 5.6% of genomic CpGs. Recent implementations of RRBS (e.g. enhanced RRBS; 14,15 that consider fragments up to 320 bases in length cover an additional 9.7% of CpGs. Approximately 35.0% of CpGs that are located within 300 bases of a single MspI site are not captured by these techniques.
B) Histogram shows coverage depth of MspI restriction sites for individual replicates of a 10ng XRBS library (left, middle), and both replicates combined (right).
C) Heatmap shows coverage depth of CpGs between replicates of a 10ng XRBS library (Pearson’s r= 0.90).
D) Histogram shows coverage depth of CpGs in the combined dataset of both replicates (n=2 independently generated libraries).
E) Plot shows unique reads as a function of aligned reads in millions. With greater sequencing depth the fraction of unique reads decreases, as the chance of sampling a non-unique read (i.e. PCR duplicate) increases.
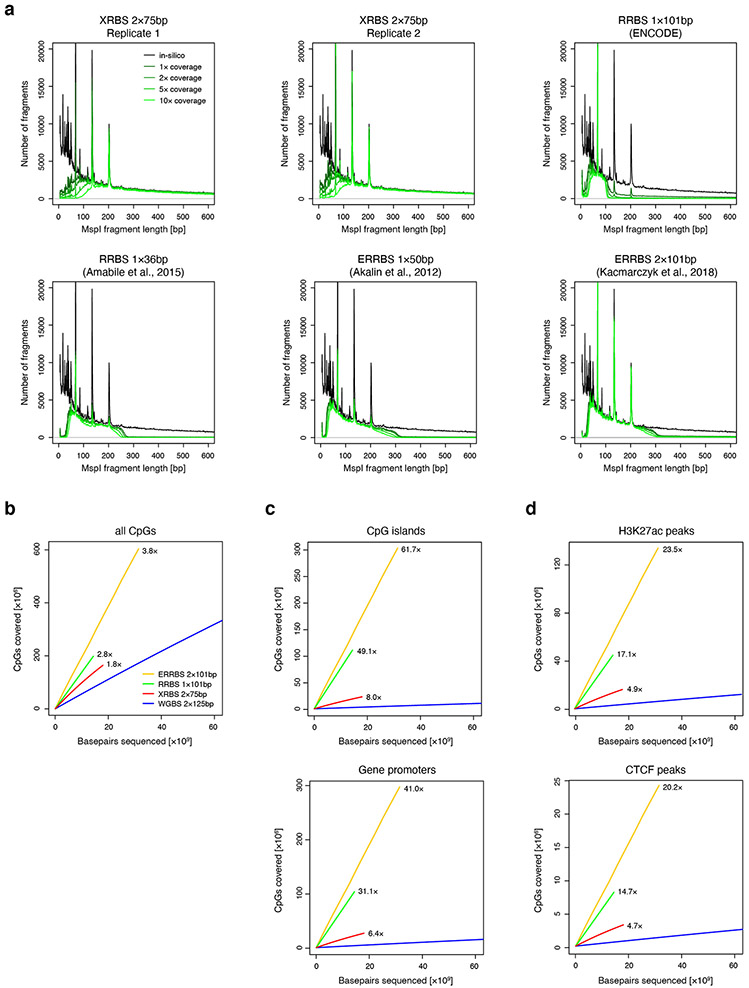
Extended Data Fig. 2 ∣. Comparison of MspI fragment detection and CpG coverage over regulatory elements.
A) Plot shows number of detected fragments plotted as a function of calculated MspI fragment length from XRBS 10ng library replicates and from public RRBS and enhanced RRBS (ERRBS) datasets. Because of the random hexamer-primed second strand elongation step, XRBS efficiently detects fragments that exceed the selected fragment size range in RRBS (ENCODE; Amabile et al.: 40-220bp) and ERRBS (70-320bp). XRBS less efficiently captures short fragments (<70bp) compared to ERRBS and RRBS. Peaks in the graph correspond to three fragments commonly generated from Alu repetitive elements.
B) Plot compares CpG coverage as a function of sequencing depth (x-axis) for XRBS (red), WGBS (blue, ENCODE), ERRBS (orange; 52) and RRBS (green, ENCODE).
C) Downsampling analysis plot as in panel B but restricted to CpGs within CpG islands (top) and gene promoters (bottom).
D) Downsampling analysis plot as in panel B but restricted to CpGs within H3K27ac peaks (top) and CTCF binding sites (bottom).
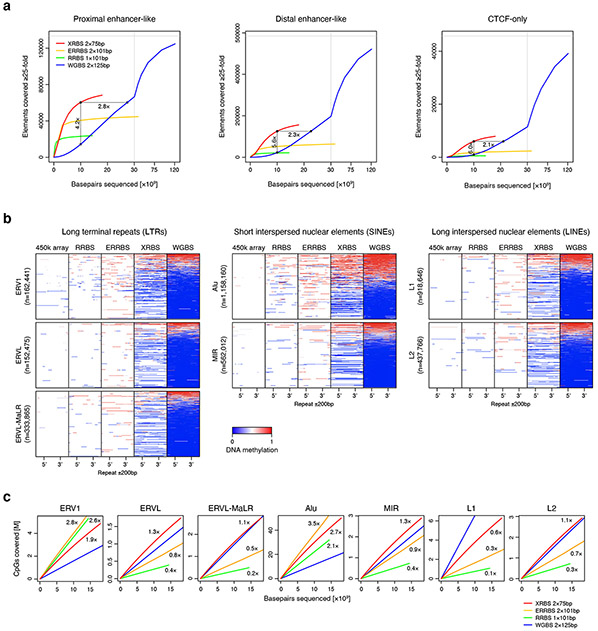
Extended Data Fig. 3 ∣. XRBS efficiently covers CpGs in regulatory elements and repetitive regions.
A) Plots show the number of proximal enhancer-like, distal enhancer-like, and CTCF-only elements (as defined in the ENCODE SCREEN database) with at least 25-fold combined coverage as a function of sequencing depth for XRBS (red), WGBS (blue), ERRBS (orange), and RRBS (green). Enrichment for functional elements at a uniform sequencing depth of 10 billion base pairs is indicated. Vertical grey line indicates break in x-axis scale.
B) Heatmaps depict genomic regions (rows, n= 3,725,365 LTRs, SINEs, and LINEs) containing different repeat element families (as defined by RepeatMasker). Individual repeat elements are divided into 50 equally sized windows (5’ and 3’ position indicated). Upstream and downstream regions (±200bp) are divided into 25 equally sized windows. Panels from left to right show DNA methylation calls from 450k methylation array, RRBS, ERRBS, XRBS, and WGBS.
C) Plots compare CpG coverage within different repeat element families as a function of sequencing depth for XRBS (red), WGBS (blue), ERRBS (orange), and RRBS (green). CpG enrichment relative to WGBS is indicated. In comparison to RRBS, XRBS enriches for most repeat families, with the exception of Alu and ERV1 elements that frequently contain MspI restriction sites and are also efficiently captured (see also Extended Data Fig. 2a).
Extended Data Fig. 4 ∣. Correlation of DNA methylation with histone marks and compartment calls.
A) Plot shows unique reads as a function of aligned reads in low-coverage XRBS libraries from K562, HL-60, OCI-AML3, and Kasumi-1 cells.
B) Plot shows unique reads as a function of aligned reads in low-coverage libraries from K562, Kasumi-1, HL-60, OCI-AML3 cells. Libraries were generated from 1,000 (green) and 100 (orange) cells sorted directly into lysis buffer. Libraries generated from 1,000 cells are comparable to libraries generated from 10ng of purified DNA (panel A), whereas 100 cell libraries show reduced complexity.
C) Heatmap shows Pearson correlation of XRBS methylation profiles of 100kb windows generated from 10ng gDNA, 1,000 or 100 sorted cells across four cell lines. Dendrogram derived from unsupervised clustering is indicated to the left. Sample grouping by DNA methylation is consistent with cell identity, indicating low technical variability between input material.
D) Heatmaps show correlation between average DNA methylation values and signal for H3K9me3 (left), H3K27me3 (center), and H3K36me3 (right) in 100kb-windows for K562 cells.
E) Heatmap shows correlation between DNA methylation and the Hi-C-derived first eigenvector indicating compartment A (positive values) and compartment B (negative values) in 100kb-windows for K562 cells.
F) Heatmap shows correlation between average DNA methylation values and ChIP seq signal for H3K9me3 (top), H3K27me3 (middle), and H3K38me3 (bottom) in 100kb-windows for human H1 embryonic stem cells, primary T cells and mammary epithelial cells, and cultured IMR90, GM12878 and K562 cells.
G) Heatmap as in panel F, but shows correlation between average DNA methylation values and the Hi-C-derived first eigenvector (x-axis). Positive values correspond to compartment A and negative values correspond to compartment B. While hypomethylation of compartment B is most pronounced in K562 cells, a similar trend is also observed in other cultured cell lines and in primary mammary epithelial cells.
Extended Data Fig. 5 ∣. Characterization of decitabine treatment of cancer cell lines.
A) Plot shows dose response curve for decitabine treatment of three cell lines Kasumi, HL-60, and OCI-AML3. Viability was measured using cell titer glo and is reported as luminescence relative to control DMSO treated cells (n=3 independently treated replicates, error bars represent standard deviation).
B) Images show HL60 and OCI-AML3 cells treated with 300 nM decitabine and a DMSO vehicle control. Morphology of decitabine treated cells similar to control, repeated three times. Scale bar is indicated and applies to all images.
C) Plot shows unique reads as a function of aligned reads in XRBS libraries from DMSO- and decitabine-treated HL-60 and OCI-AML3 cells.
D) Barplot shows average DNA methylation values across island (dark grey) and non-island (light grey) CpGs in DMSO- and decitabine-treated HL-60 and OCI-AML3 cells. For example, average methylation of non-island CpGs in HL-60 cells is reduced from 68.1% to 54.3% by decitabine treatment (20.2% reduction, n=1 library per treatment).
E) Heatmap shows correlation between Hi-C-derived first eigenvectors from K562 and HL-60 cell lines in 100kb-windows, indicating high agreement in compartment structure between both cell lines.
F) Heatmaps show correlation between average DNA methylation values and Hi-C-derived eigenvector in 100kb-windows for DMSO- (left) and decitabine-treated HL-60 cells (center). Heatmap on the right shows relative DNA methylation values of decitabine- and DMSO-treated cells. Despite compartment B showing lower methylation compared to compartment A at baseline, induced DNA hypomethylation with decitabine treatment affects compartment A and B equally.
Extended Data Fig. 6 ∣. Differential DNA methylation of gene promoters.
A) Plot shows unique reads as a function of aligned reads in 1,000 cell high-coverage libraries of four cell lines.
B) Heatmap depicts 8kb regions (rows, n=3,972 promoters) centered at transcription start sites that show cell line-specific hyper- or hypomethylation (as in Fig. 4a) and divided into 100 equally sized windows. Panels from left to right show methylation calls from 450k methylation array, RRBS, XRBS, and WGBS. All datasets except XRBS were retrieved from ENCODE 51.
C) Plot shows expression levels for genes that were associated with cell line-specific promoter hyper- and hypo-methylation. Genes with an expression level larger than 0.5 are considered as expressed. Average gene expression levels are indicated by horizontal lines. P-values were generated using a two-sided Mann-Whitney U test. In K562, the majority (74.0%) of hypomethylated promoters are associated with non-expressed genes, which is unique to this cell line, consistent with global hypo-methylation in K562.
D) Scatterplot compares gene expression level and H3K4me3 ChIP-seq signal for gene promoters that were identified as differentially methylated between all four cell lines. Individual promoters (dots) are colored if specifically hypermethylated (red) and hypermethylated (blue) in K562 cells. This analysis shows that promoters which are not expressed and specifically hypomethylated in K562 (n=1,624 promoters) are generally negative for the H3K4me3 histone mark (98.7%), whereas promoters that are hypomethylated and expressed (n=570) are more frequently positive for H3K4me3 (45.0%).
Extended Data Fig. 7 ∣. Evaluating the use of XRBS DNA methylation profiling to predict H3K27 acetylation and CTCF binding.
A) Heatmap depicts 8kb regions (rows, n=15,202 peaks) centered on H3K27ac peaks, grouped into regions that are hypomethylated specifically in K562 or OCI-AML3 cells (as in Fig. 4b). Peaks that are not specifically hypomethylated (‘Others’) are downsampled for visualization. Regions are divided into 100 equally sized windows. Panels from left to right show: methylation calls from 450k methylation array, RRBS, XRBS, and WGBS. All datasets except XRBS were retrieved from ENCODE 51.
B) Scatterplot shows merged H3K27ac peaks from OCI-AML3 and K562 ChIP-seq datasets. Individual peaks (dots) are colored if specifically hypomethylated in K562 (blue) or OCI-AML3 (red) cells.
C) Line plot (bottom) shows difference in methylation between K562 and OCI-AML3 cells over merged H3K27ac peaks (n=15,202 peaks). Of these peaks, 7.5% and 2.1% are specifically hypomethylated in K562 (methylation difference ≤−0.5) and OCI-AML3 (≥0.5) cells, respectively. Bar plot (top) shows the fraction of cell line-specific H3K27ac peaks within 100 equally sized bins grouped by difference in methylation. Shared peaks are indicated in gray.
D) Receiver operating characteristic (ROC) curve shows performance of predicting cell line-specific H3K27ac peaks based on difference in DNA methylation over peaks that are covered by XRBS. Sensitivity and specificity are indicated at different thresholds (±0.2 and ±0.5, as in panel C).
E) Heatmap depicts 2kb regions (rows, n=7,629 peaks) centered at merged CTCF peaks from K562 and HL-60 Chip-seq datasets. Individual peaks (dots) are colored if specifically hypermethylated in K562 or HL-60 cells (as in Fig. 4c). Peaks not specifically hypermethylated (‘Others’) are downsampled for visualization. Panels from left to right show methylation calls from 450k methylation arrays, RRBS, XRBS, and WGBS. All datasets except XRBS were retrieved from ENCODE 51.
F) Scatterplot shows merged CTCF peaks from K562 and HL-60 ChIP-seq datasets. Individual CTCF binding sites (dots) are colored if specifically hypermethylated in K562 (red) or HL-60 (blue) cells.
G) Line plot (bottom) shows difference in methylation between K562 and HL-60 cells over merged CTCF peaks (n=7,629 peaks). Bar plot (top) shows the fraction of cell line-specific CTCF peaks within 100 equally sized bins grouped by difference in methylation. Shared peaks are indicated in gray.
H) ROC curve shows performance of predicting cell line-specific CTCF peaks based on difference in DNA methylation over peaks that are covered by XRBS. Sensitivity and specificity are indicated at different thresholds (±0.2 and ±0.5, as in panel G).
Extended Data Fig. 8 ∣. XRBS profiling of limited human bone marrow cell types.
A) Plots show the gating strategy for fluorescence assisted cell sorting (FACS) of human bone marrow of CD34+ HSPCs, CD3+ T cells, and CD14+ monocytes. Singlets (FSC-W vs. -H) and viable cells (PI vs. FSC-A) were sorted based on cell surface marker signal.
B) Plot shows unique reads as a function of aligned reads in libraries from unsorted human bone marrow, HSPCs, monocytes, and T cells. Libraries were generated from 100 sorted cells. 1000 cells were used for the unsorted bone marrow library.
C) Heatmap depicts 4kb regions (rows, n=2,170 regions) centered over elements defined in the ENCODE SCREEN database. Only differentially methylated elements between monocytes and T cells are shown. Elements were stratified by their methylation status in HSPCs (hypomethylated: top; hypermethylated: bottom). Methylation levels of the unsorted bone marrow are shown for comparison (left). ATAC-seq signal for sorted hematopoietic stem cells (HSCs), monocyte, and CD4+ T cells (obtained from 36).
Extended Data Fig. 9 ∣. Evaluation of single cell XRBS profiles.
A) Plot shows unique reads as a function of aligned reads in single cell XRBS profiles (n=96 cells). With greater sequencing depth the fraction of unique reads decreases, as the chance of sampling a non-unique read (i.e. PCR duplicate) increases.
B) Boxplots compare DNA methylation profiles from human scXRBS (n=59 cells) and three published scRRBS datasets generated from human cells: Chronic lymphocytic leukemia (n=282 cells) 49, hepatocellular carcinoma and HepG2 cells (n=34 cells) 45, and oocytes, sperm and pronuclei (n=35 cells) 48. Single cells from Hou et al. were generated using the scTrio-seq protocol that in part resembles scRRBS. Only CpGs within 75 bases of an MspI cut site were considered for scRRBS libraries to adjust for differences in read lengths. Libraries from Gaiti et al. were sequenced at 2x51 bases. Left plot shows the number of paired-end reads sequenced for each cell. Other plots show the number of CpGs covered (≥1-fold) across all CpGs in the genome, CpGs within distal enhancer-like regions, and CpGs within ‘CTCF-only’ regions (SCREEN database). Both strands of a CpG dinucleotide are assessed individually. Although sequenced at the lowest depth, scXRBS libraries on average capture the most CpGs, particularly in CpG-sparse regions. Boxplots were generated in R using default settings: Bounds of box and thick horizontal line represent 25th, 75th, and 50th percentile of observations, whiskers represent minimum and maximum observations, and outliers are indicated as dots.
C) Barplot shows the fraction of unique reads (i.e. reads not representing PCR duplicates) per single cell library. Within the same PCR reaction, the duplicate rate was very similar, irrespective of the total number of aligned reads per single cell. Each bar plot represents a single cell XRBS library. Twenty four barcoded cells were in each of 4 independent libraries.
D) Heatmap compares alternate allele frequencies from SNP array data for K562 and HL-60 cell lines. Cell line-specific homozygous alleles are indicated by white boxes boxes and were used for single cell SNP analysis in Fig. 5d.
E) Plots show copy number variation calls from combined single cell XRBS profiles (top) and whole exome sequencing data (middle) for K562 cells. A number of chromosomes show differences in copy number between XRBS and whole exome sequencing (bottom). However, these differences likely represent true copy number variations between K562 cells used for these experiments.
F) Heatmap shows pairwise correlation coefficients of single cell methylation profiles. Dendrogram shows unsupervised clustering. Single cell XRBS profiles cluster by cell type.
G) Barplot shows K562 single cell average DNA methylation values within various early and late replicating regions. Each bar represents an individual K562 single cell library. There are 32 single cell libraries plotted for each cell cycle phase.
H) Heatmap shows pairwise correlation of average DNA methylation values within various early and late replicating regions. Late replicating regions (G2 phase) cluster separately. These results suggest that one source of single cell DNA methylation heterogeneity is decreased fidelity of maintenance DNA methylation in late replicating domains.
Supplementary Material
Acknowledgements
B.E.B. is the Bernard and Mildred Kayden Endowed MGH Research Institute Chair and an American Cancer Society Research Professor. This research was supported by a Pioneer Award from the NIH Common Fund and National Cancer Institute (DP1CA216873), and by the Gene Regulation Observatory at the Broad Institute. S.J.S. was supported by a Medical Scientist Training Award from the National Institute of General Medical Sciences (T32GM007753). V.H. was supported by a Human Frontier Science Program long-term fellowship (LT000596/2016-L). We thank R. Boursiquot for technical assistance and L. Gaskell, W. Flavahan and other Bernstein lab members for helpful discussions.
Footnotes
Competing interests
B.E.B. discloses financial interests in Fulcrum Therapeutics, HiFiBio, Arsenal Biosciences, Cell Signaling Technologies and BioMillenia. The remaining authors declare no competing interests.
Data Availability Statement
The datasets generated during the current study have been deposited in GEO with the primary accession code GSE149954.
References:
- 1.Zamudio N et al. DNA methylation restrains transposons from adopting a chromatin signature permissive for meiotic recombination. Genes Dev. 29, 1256–1270 (2015). [DOI] [PMC free article] [PubMed] [Google Scholar]
- 2.Yoder JA, Walsh CP & Bestor TH Cytosine methylation and the ecology of intragenomic parasites. Trends Genet. 13, 335–340 (1997). [DOI] [PubMed] [Google Scholar]
- 3.Walsh CP, Chaillet JR & Bestor TH Transcription of IAP endogenous retroviruses is constrained by cytosine methylation. Nat. Genet. 20, 116–117 (1998). [DOI] [PubMed] [Google Scholar]
- 4.Deaton AM & Bird A CpG islands and the regulation of transcription. Genes Dev. 25, 1010–1022 (2011). [DOI] [PMC free article] [PubMed] [Google Scholar]
- 5.Bird AP DNA methylation and the frequency of CpG in animal DNA. Nucleic Acids Res. 8, 1499–1504 (1980). [DOI] [PMC free article] [PubMed] [Google Scholar]
- 6.Baylin SB & Jones PA A decade of exploring the cancer epigenome - biological and translational implications. Nat. Rev. Cancer 11, 726–734 (2011). [DOI] [PMC free article] [PubMed] [Google Scholar]
- 7.Zemach A, McDaniel IE, Silva P & Zilberman D Genome-wide evolutionary analysis of eukaryotic DNA methylation. Science 328, 916–919 (2010). [DOI] [PubMed] [Google Scholar]
- 8.Yin Y et al. Impact of cytosine methylation on DNA binding specificities of human transcription factors. Science 356, (2017). [DOI] [PMC free article] [PubMed] [Google Scholar]
- 9.Song Y et al. Dynamic Enhancer DNA Methylation as Basis for Transcriptional and Cellular Heterogeneity of ESCs. Mol. Cell 75, 905–920.e6 (2019). [DOI] [PMC free article] [PubMed] [Google Scholar]
- 10.Flavahan WA et al. Insulator dysfunction and oncogene activation in IDH mutant gliomas. Nature 529, 110–114 (2016). [DOI] [PMC free article] [PubMed] [Google Scholar]
- 11.Gu H et al. Preparation of reduced representation bisulfite sequencing libraries for genome-scale DNA methylation profiling. Nat. Protoc 6, 468–481 (2011). [DOI] [PubMed] [Google Scholar]
- 12.Meissner A et al. Genome-scale DNA methylation maps of pluripotent and differentiated cells. Nature 454, 766–770 (2008). [DOI] [PMC free article] [PubMed] [Google Scholar]
- 13.Boyle P et al. Gel-free multiplexed reduced representation bisulfite sequencing for large-scale DNA methylation profiling. Genome Biol. 13, 1–10 (2012). [DOI] [PMC free article] [PubMed] [Google Scholar]
- 14.Akalin A et al. Base-pair resolution DNA methylation sequencing reveals profoundly divergent epigenetic landscapes in acute myeloid leukemia. PLoS Genet. 8, e1002781 (2012). [DOI] [PMC free article] [PubMed] [Google Scholar]
- 15.Garrett-Bakelman FE et al. Enhanced reduced representation bisulfite sequencing for assessment of DNA methylation at base pair resolution. J. Vis. Exp e52246 (2015). [DOI] [PMC free article] [PubMed] [Google Scholar]
- 16.Li G et al. Joint profiling of DNA methylation and chromatin architecture in single cells. Nat. Methods 16, 991–993 (2019). [DOI] [PMC free article] [PubMed] [Google Scholar]
- 17.Tanaka K & Okamoto A Degradation of DNA by bisulfite treatment. Bioorg. Med. Chem. Lett 17, 1912–1915 (2007). [DOI] [PubMed] [Google Scholar]
- 18.Kint S, De Spiegelaere W, De Kesel J, Vandekerckhove L & Van Criekinge W Evaluation of bisulfite kits for DNA methylation profiling in terms of DNA fragmentation and DNA recovery using digital PCR. PLoS One 13, e0199091 (2018). [DOI] [PMC free article] [PubMed] [Google Scholar]
- 19.Ben-Hattar J & Jiricny J Methylation of single CpG dinucleotides within a promoter element of the Herpes simplex virus tk gene reduces its transcription in vivo. Gene vol. 65 219–227 (1988). [DOI] [PubMed] [Google Scholar]
- 20.Schübeler D Function and information content of DNA methylation. Nature 517, 321–326 (2015). [DOI] [PubMed] [Google Scholar]
- 21.Rao SSP et al. A 3D map of the human genome at kilobase resolution reveals principles of chromatin looping. Cell 159, 1665–1680 (2014). [DOI] [PMC free article] [PubMed] [Google Scholar]
- 22.Liu XS et al. Editing DNA Methylation in the Mammalian Genome. Cell 167, 233–247.e17 (2016). [DOI] [PMC free article] [PubMed] [Google Scholar]
- 23.Fu Y, Sinha M, Peterson CL & Weng Z The insulator binding protein CTCF positions 20 nucleosomes around its binding sites across the human genome. PLoS Genet. 4, e1000138 (2008). [DOI] [PMC free article] [PubMed] [Google Scholar]
- 24.Schuyler RP et al. Distinct Trends of DNA Methylation Patterning in the Innate and Adaptive Immune Systems. Cell Rep. 17, 2101–2111 (2016). [DOI] [PMC free article] [PubMed] [Google Scholar]
- 25.Wiehle L et al. DNA (de)methylation in embryonic stem cells controls CTCF-dependent chromatin boundaries. Genome Res. 29, 750–761 (2019). [DOI] [PMC free article] [PubMed] [Google Scholar]
- 26.Li Y et al. Alterations of specific chromatin conformation affect ATRA-induced leukemia cell differentiation. Cell Death Dis. 9, 200 (2018). [DOI] [PMC free article] [PubMed] [Google Scholar]
- 27.Varley KE et al. Dynamic DNA methylation across diverse human cell lines and tissues. Genome Res. 23, 555–567 (2013). [DOI] [PMC free article] [PubMed] [Google Scholar]
- 28.Zhou W et al. DNA methylation loss in late-replicating domains is linked to mitotic cell division. Nat. Genet. 50, 591–602 (2018). [DOI] [PMC free article] [PubMed] [Google Scholar]
- 29.Diesch J et al. A clinical-molecular update on azanucleoside-based therapy for the treatment of hematologic cancers. Clin. Epigenetics 8, 71 (2016). [DOI] [PMC free article] [PubMed] [Google Scholar]
- 30.Aran D & Hellman A DNA methylation of transcriptional enhancers and cancer predisposition. Cell 154, 11–13 (2013). [DOI] [PubMed] [Google Scholar]
- 31.Aran D, Sabato S & Hellman A DNA methylation of distal regulatory sites characterizes dysregulation of cancer genes. Genome Biol. 14, R21 (2013). [DOI] [PMC free article] [PubMed] [Google Scholar]
- 32.Li Q et al. Integrative eQTL-based analyses reveal the biology of breast cancer risk loci. Cell 152, 633–641 (2013). [DOI] [PMC free article] [PubMed] [Google Scholar]
- 33.Bell AC & Felsenfeld G Methylation of a CTCF-dependent boundary controls imprinted expression of the Igf2 gene. Nature 405, 482–485 (2000). [DOI] [PubMed] [Google Scholar]
- 34.Hark AT et al. CTCF mediates methylation-sensitive enhancer-blocking activity at the H19/Igf2 locus. Nature 405, 486–489 (2000). [DOI] [PubMed] [Google Scholar]
- 35.Moore JE et al. Expanded encyclopaedias of DNA elements in the human and mouse genomes. Nature vol. 583 699–710 (2020). [DOI] [PMC free article] [PubMed] [Google Scholar]
- 36.Corces MR et al. Lineage-specific and single-cell chromatin accessibility charts human hematopoiesis and leukemia evolution. Nat. Genet 48, 1193–1203 (2016). [DOI] [PMC free article] [PubMed] [Google Scholar]
- 37.Barretina J et al. The Cancer Cell Line Encyclopedia enables predictive modelling of anticancer drug sensitivity. Nature 483, 603–607 (2012). [DOI] [PMC free article] [PubMed] [Google Scholar]
- 38.McGahon AJ et al. Downregulation of Bcr-Abl in K562 cells restores susceptibility to apoptosis: characterization of the apoptotic death. Cell Death Differ. 4, 95–104 (1997). [DOI] [PubMed] [Google Scholar]
- 39.Charlton J et al. Global delay in nascent strand DNA methylation. Nat. Struct. Mol. Biol 25, 327–332 (2018). [DOI] [PMC free article] [PubMed] [Google Scholar]
- 40.Hansen RS et al. Sequencing newly replicated DNA reveals widespread plasticity in human replication timing. Proc. Natl. Acad. Sci. U. S. A 107, 139–144 (2010). [DOI] [PMC free article] [PubMed] [Google Scholar]
- 41.Greenberg MVC & Bourc’his D The diverse roles of DNA methylation in mammalian development and disease. Nat. Rev. Mol. Cell Biol 20, 590–607 (2019). [DOI] [PubMed] [Google Scholar]
- 42.Mulqueen RM et al. Highly scalable generation of DNA methylation profiles in single cells. Nat. Biotechnol 36, 428–431 (2018). [DOI] [PMC free article] [PubMed] [Google Scholar]
- 43.Luo C et al. Robust single-cell DNA methylome profiling with snmC-seq2. Nat. Commun 9, 3824 (2018). [DOI] [PMC free article] [PubMed] [Google Scholar]
- 44.Luo C et al. Single-cell methylomes identify neuronal subtypes and regulatory elements in mammalian cortex. Science 357, 600–604 (2017). [DOI] [PMC free article] [PubMed] [Google Scholar]
- 45.Hou Y et al. Single-cell triple omics sequencing reveals genetic, epigenetic, and transcriptomic heterogeneity in hepatocellular carcinomas. Cell Res. 26, 304–319 (2016). [DOI] [PMC free article] [PubMed] [Google Scholar]
- 46.Chen C et al. Single-cell whole-genome analyses by Linear Amplification via Transposon Insertion (LIANTI). Science 356, 189–194 (2017). [DOI] [PMC free article] [PubMed] [Google Scholar]
- 47.Hovestadt V et al. Decoding the regulatory landscape of medulloblastoma using DNA methylation sequencing. Nature 510, 537–541 (2014). [DOI] [PubMed] [Google Scholar]
- 48.Guo F et al. Active and passive demethylation of male and female pronuclear DNA in the mammalian zygote. Cell Stem Cell 15, 447–459 (2014). [DOI] [PubMed] [Google Scholar]
- 49.Gaiti F et al. Epigenetic evolution and lineage histories of chronic lymphocytic leukaemia. Nature 569, 576–580 (2019). [DOI] [PMC free article] [PubMed] [Google Scholar]
- 50.Ghandi M et al. Next-generation characterization of the Cancer Cell Line Encyclopedia. Nature 569, 503–508 (2019). [DOI] [PMC free article] [PubMed] [Google Scholar]
- 51.ENCODE Project Consortium. An integrated encyclopedia of DNA elements in the human genome. Nature 489, 57–74 (2012). [DOI] [PMC free article] [PubMed] [Google Scholar]
- 52.Kacmarczyk TJ et al. ‘Same difference’: comprehensive evaluation of four DNA methylation measurement platforms. Epigenetics Chromatin 11, 21 (2018). [DOI] [PMC free article] [PubMed] [Google Scholar]
Associated Data
This section collects any data citations, data availability statements, or supplementary materials included in this article.
Supplementary Materials
Data Availability Statement
The datasets generated during the current study have been deposited in GEO with the primary accession code GSE149954.


