Abstract
Objective:
The authors explored the development and validation of machine-learning models for augmenting the echocardiographic grading of aortic stenosis (AS) severity.
Background:
In AS, symptoms and adverse events develop secondarily to valvular obstruction and left ventricular decompensation. The current echocardiographic grading of AS severity focuses on the valve and are limited by diagnostic uncertainty.
Methods:
Using echocardiography (ECHO) measurements (ECHO cohort, n=1,052), we performed patient similarity analysis to derive high-severity and low-severity phenogroups of AS. We subsequently developed a supervised machine-learning classifier and validated its performance with independent markers of disease severity obtained using computed tomography (CT) (CT cohort, n=752) and cardiovascular magnetic resonance (CMR) imaging (CMR cohort, n=160). The classifier’s prognostic value was further validated using clinical outcomes (aortic valve replacement [AVR] and death) observed in the ECHO and CMR cohorts.
Results:
In 1,964 patients from the 3 multi-institutional cohorts, 1,346 (68%) subjects had either nonsevere or discordant AS severity. Machine learning identified 1,117 (57%) patients as having high-severity and 847 (43%) as having low-severity of AS. High-severity patients in CT and CMR cohorts had higher valve calcium scores and left ventricular mass and fibrosis, respectively than the low-severity group. In the Echo cohort, progression to AVR and progression to death in patients who did not receive AVR was faster in the high-severity group. Compared with the conventional classification of disease severity, machine learning based severity classification improved discrimination (integrated discrimination improvement 0.07; 95% confidence interval: 0.02 to 0.12) and reclassification (net reclassification improvement 0.17; 95% confidence interval: 0.11 to 0.23) for the outcome of AVR at 5 years. For both ECHO and CMR cohorts, we observed prognostic value of the machine-learning classifications for subgroups with asymptomatic, non-severe or discordant AS.
Conclusions:
Machine-learning can integrate ECHO measurements to augment the classification of disease severity in most patients with AS, with major potential to optimize the timing of AVR.
Keywords: Aortic stenosis, Topological data analysis, Machine learning
INTRODUCTION
Aortic stenosis is characterized both by progressive valve narrowing and the remodeling response of the myocardium. It remains the most prevalent valvular heart disease in developed countries, a burden that is only set to expand with an ageing population (1). Assessment of disease severity is important for patient risk stratification and optimization of aortic valve replacement (AVR) surgery (2,3). This is currently performed using echocardiography (ECHO) which grades the severity of valve narrowing on the basis of the aortic valve area, the transvalvular mean gradient, and the peak aortic jet velocity (4,5). However, this approach does not consider the myocardial remodeling response, provides only modest risk stratification, and is frequently limited by discordant results regarding disease severity, leading to diagnostic uncertainty.
Interest has increased in alternative methods for risk stratifying patients with AS, including computed tomography (CT) assessments of the valve (the aortic valve CT calcium score) and cardiovascular magnetic resonance (CMR) assessments of the myocardium (myocardial fibrosis and left ventricular (LV) remodeling), both of which appear to provide improved prognostic information (6–8). However, these imaging modalities are expensive, not widely available and involve either radiation exposure or the administration of intravenous contrast agents. There is therefore a need for accurate, yet simple methods to improve risk assessment in AS.
Novel machine-learning approaches can disentangle hidden relationships between standard echocardiographic variables and improve our understanding of complex cardiovascular disease states (9–11). In this study, we aimed to use machine-learning to identify pathophysiologically and prognostically informative patient groups based on standard echocardiographic measurements acquired in routine clinical practice. We then sought to validate these machine-learning groups against CT and CMR assessments of AS severity and against future clinical outcomes. We hypothesized that our machine-learning approach would improve the classification of disease severity in AS and the prediction of adverse patient outcomes compared with standard approaches.
METHODS
In this multi-modality imaging study, we used routinely measured echocardiographic variables acquired in a prospective Canadian study to develop our novel machine-learning approach for identifying unique patient groups (phenogroups) with AS (ECHO cohort n = 1,052) (Central Illustration). The echocardiographic data were visually verified and re-analyzed centrally in echo corelab (Québec Heart and Lung Institute). Severe aortic stenosis was defined as aortic valve area <1 cm2 and mean gradient ≥40 mm Hg. Discordant AS was defined as aortic valve area <1 cm2 and mean gradient <40 mm Hg and further included three previously defined phenotypes of low-flow low gradient AS with reduced ejection fraction (stroke volume index ≤35 ml/m2, EF <50%) or preserved ejection fraction (stroke volume index >35 ml/m2, EF <50%), and normal flow, low gradient (stroke volume index >35 ml/m2 ejection fraction ≥50%) (4). Next, to identify these phenogroups in external cohorts, we developed a supervised machine-learning classifier, which when provided with the echocardiographic features, would provide disease severity group labels for new individuals. This classifier was used for performing external validation in two cohorts: an international multicenter CT cohort that included 752 patients who underwent both echocardiography and CT calcium scoring and a United Kingdom CMR cohort of 160 patients who underwent both ECHO and CMR. Phenogroup validation was then performed in two steps: 1) Validation of disease biolomarkers: the potential ability of machine-learning phenogroups to discriminate AS severity was assessed by comparison with independent CT and CMR disease severity assessments; and 2) Clinical Validation: The phenogroups were compared for their association with future clinical outcomes (not used in development of the model), in particular, follow up data for death and AVR in both the ECHO (internal clinical validation) and CMR cohorts (external clinical validation). The detailed clinical characteristics including symptomatic status of the patients enrolled in the ECHO, CT and CMR cohorts have been published previously and summarized in the Supplementary Materials (8,12,13). All 3 cohorts used for this study received the proper ethical oversight and institutional review board/ethics committee approval as previously published (8,12,13).
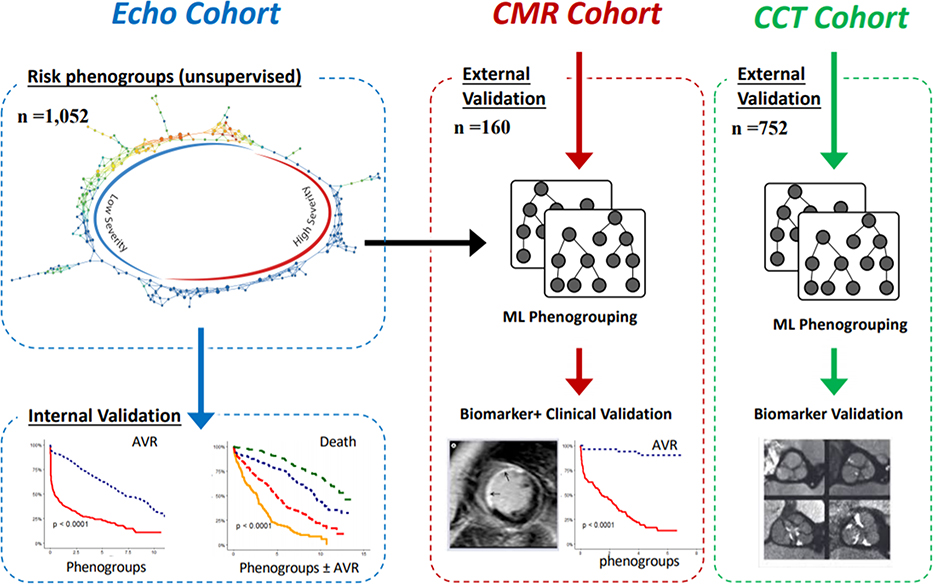
Central Illustration: Overall analytical approach.
Topological data analysis related risk labels were first generated in the ECHO cohort using standard echocardiographic parameters. A machine-learning-based ensemble classifier was then trained to identify patients belonging to the high-severity (HS) and low-severity (LS) groups. The accuracy of this classifier was established in a split sample within the ECHO cohort. Time-to-event analyses for two clinical l endpoints (aortic valve replacement [AVR] and death) was undertaken for patients in the ECHO cohort as an internal validation. Two other cohorts (the cardiovascular magnetic resonance [CMR] cohort and the computed tomography [CT] cohort) were used for external validation by testing the association of phenogroups with CT and CMR-based features of disease severity. Clinical data from the CMR cohort was used to conduct external validation of the prognostic information provided by the machine-learning phenogroups.
Generation of phenogroups
First, we used topological data analysis (TDA), an unsupervised machine-learning framework that distributes patients along a visualized network (Supplementary Appendix), to generate low- and high-severity disease groups based only on echocardiographic data from the ECHO cohort. In particular we used 5 routinely acquired echocardiographic features (see supplementary methods section for details of echocardiography measurements) as inputs to generate a network: aortic valve area indexed to body surface area, LV ejection fraction, aortic valve mean gradient, stroke volume indexed to body surface area and aortic valve peak velocity. The addition of more clinical and echocardiographic features did not offer additional model enrichment to delineate the topological model (Supplementary Figure 1). We also verified other unsupervised techniques (i.e., Hierarchical cluster analysis, K-means and t-Distributed Stochastic Neighbor Embedding) and ascertained the inherent groupings of TDA were superior than the traditional clustering methods.
To extend these patient-specific phenogroup labels to an external cohort, we developed a supervised machine-learning model that would predict the phenogroup label for any new patient. The technical details of the model generation and performance of the supervised machine learning classifier is presented in the Supplemental Appendix. The machine-learning classifier developed in the ECHO cohort was highly accurate and so it was then applied to the CT and CMR cohorts and used to categorize these patients into the relevant machine-learning phenogroups. We have made this classifier publicly available on https://as-gps.herokuapp.com/.
Biological and Clinical Validation
We tested the validity of the machine-learning phenogroups by assessing their association with independent markers of biological disease severity in AS. These methods included CT assessment of AS (aortic valve calcium score), CMR markers of myocardial damage (myocardial fibrosis - late gadolinium enhancement [LGE] and the indexed extracellular volume on T1 mapping; LV remodeling - LV mass indexed to body surface area, LV end diastolic volume, longitudinal systolic function) as well as biomarkers (B-type natriuretic peptide and high-sensitivity troponin I). Finally, we validated these machine-learning phenogroups against hard clinical outcomes, investigating their association with future AVR and death in both the ECHO and CMR cohorts.
Statistical analysis
Throughout this paper, we used nonparametric methods for statistical inference. Continuous variables were summarized as median and interquartile range (first to third interquartile ranges), whereas categorical variables were summarized as using counts and percentages. Accuracy of the ensemble machine-learning model to predict phenogroups was tested using area under the receiver operating characteristic curve. Association of phenogroups with CT and CMR based disease features was tested with Mann-Whitney U test and Fisher’s exact test, as appropriate. Association of the phenogroups with time to events was examined using Kaplan-Meier survival plots and tested using the Wilcoxon test. In all the time-to-event analyses, time zero represented the day of cohort enrollment. By definition, AVR preceded death and thus time to AVR was right censored at the point of AVR placement or the longest follow up available. Predictive performance of the Phenogroups was compared with that of the currently used AS risk-stratification (3) using the integrated discrimination improvement (IDI) and continuous net reclassification index (NRI) adapted to time to event data (14). Following software programs were used for analyses: Ayasdi platform version 7.9 (Ayasdi, Inc., Menlo Park, California) for disease severity label generation; (OptiML, BigML.com, Corvallis, Oregon, http://bigml.com) for generation of machine-learning-based ensemble classifier; Stata 14.2 (Stata Corp, College Station, TX) for statistical analyses; and the R package survIDINRI for estimation of IDI and NRI. Statistical significance was tested at a type I error rate of 0.05 and Bonferroni correction was applied to correct for multiple testing.
RESULTS
Overall, the three cohorts evaluated in this study included a total of 1,964 (75 [67 to 82] years of age, 41.2% female) aortic stenosis patients of whom 1,117 (57%) were categorized into the high-severity phenogroup. The median aortic valve area was 0.89 (0.70 to 1.18) cm2 with aortic valve peak velocity of 3.56 (2.79 to 4.27) m/s. A total of 598 (30.4%) patients had discordant echocardiographic parameters. A low ejection fraction (EF < 50%) was present in 18%, 6% and 16% from the Echo, CT and CMR groups respectively. On examining the 3 cohorts separately, the ECHO cohort included 1,052 patients, 18% of whom had severe AS based on concordant echocardiographic features (Table 1). In comparison, both the CMR (n = 160) and CT (n = 752) cohorts had higher proportion of patients with severe AS (29% and 51% respectively). In total, 23%, 30% and 45% of the cases from the Echo, CT and CMR cohorts were asymptomatic at the time of enrollment (Table 1)
Table 1.
Clinical and echocardiographic characteristics of the study cohorts
| ECHO Cohort | CMR Cohort | CT Cohort | |
|---|---|---|---|
| Number of Patients | 1052 | 160 | 752 |
| Age, y | 73 [64 – 79] | 70 [64 – 75] | 79 [72 – 85] |
| Gender, Male, n (%) | 603 (57.3) | 111 (69.4) | 441 (58.6) |
| Body Mass Index, kg/m2 | 26.9 [24.1 – 30.1] | 28.0 [25.6 – 31.2] | 27.4 [24.6 – 30.9] |
| Body Surface Area, m2 | 1.81 [1.65 – 1.94] | 1.86 [1.74 – 1.99] | 1.83 [1.69 – 1.97] |
| Heart Rate, bpm | 66 [60 – 75] | 64 [57 – 71] | 67 [60 – 76] |
| Systolic Blood Pressure, mmHg | 130 [117 – 145] | 148 [134 – 163] | 132 [120 – 147] |
| Diastolic Blood Pressure, mmHg | 72 [64 – 80] | 83 [77 – 92] | 71 [65 – 80] |
| Comorbidities | |||
| Hypertension, n (%) | 751 (71.4) | 108 (67.5) | 583 (77.6) |
| Diabetes Mellitus, n (%) | 286 (27.2) | 25 (15.6) | 221 (29.4) |
| Dyslipidemia, n (%) | 608 (57.8) | 71 (44.4) | 498 (66.3) |
| Obesity, n (%) | 277 (26.3) | 53 (33.1) | 230 (30.6) |
| Coronary Artery Disease, n (%) | 608 (57.8) | 60 (37.5) | 360 (47.9) |
| Echocardiography | |||
| LV Ejection Fraction, % | 63 [55 – 70] | 57 [52 – 62] | 63 [58 – 65] |
| Stroke Volume Index, mL | 38 [33 – 44] | 44 [37 – 49] | 41 [35 – 48] |
| AV Peak Velocity, m/s | 3.2 [2.6 – 3.9] | 3.9 [3.3 – 4.4] | 4.1 [3.3 – 4.6] |
| AV Mean Gradient, mmHg | 23 [15 – 35] | 34 [22 – 43] | 41 [26 – 52] |
| Aortic Valve Area, cm2 | 0.99 [0.76 – 1.23] | 0.87 [0.73 – 1.10] | 0.79 [0.62 – 1.01] |
| Aortic Valve Area Index, cm2/m2 | 0.55 [0.42 – 0.68] | 0.46 [0.39 – 0.58] | 0.43 [0.35 – 0.55] |
| AS Severity Grading, n (%) | |||
| Mild/Moderate AS | 349 (33.2) | 66 (41.2) | 183 (24.3) |
| Discordant Grading | 514 (48.9) | 48 (30.0) | 186 (24.7) |
| Severe AS | 189 (18.0) | 46 (28.7) | 383 (50.9) |
Values are median (interquartile range) or n (%). AS = aortic stenosis; AV -= aortic valve; CMR = cardiovascular magnetic resonance; CT = computed tomography; ECHO = echocardiography; LV = left ventricular.
Generation of phenogroups
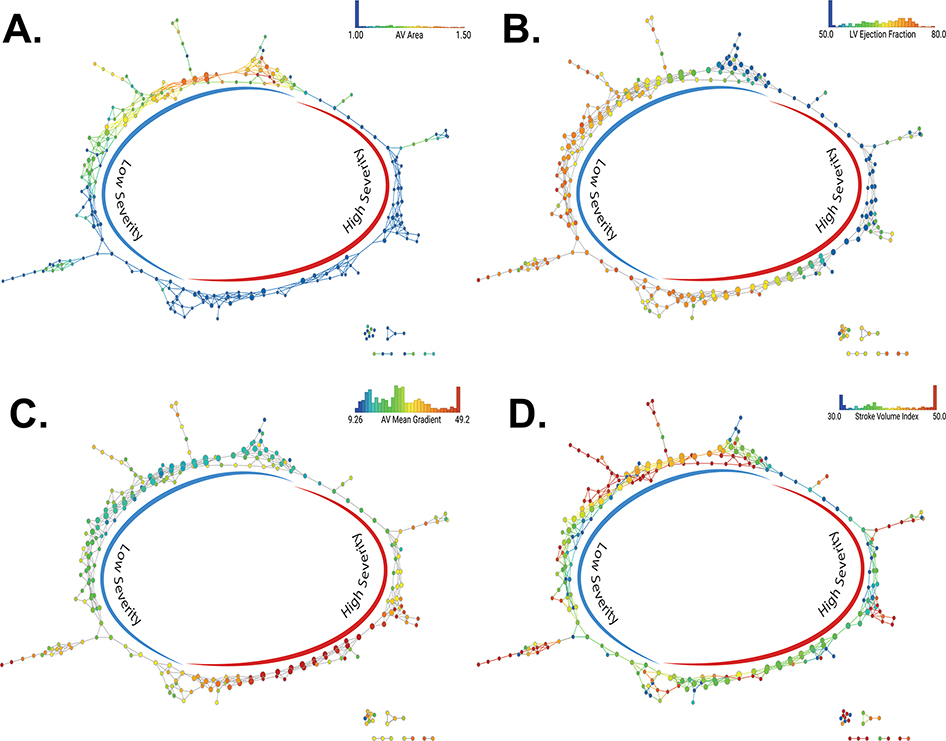
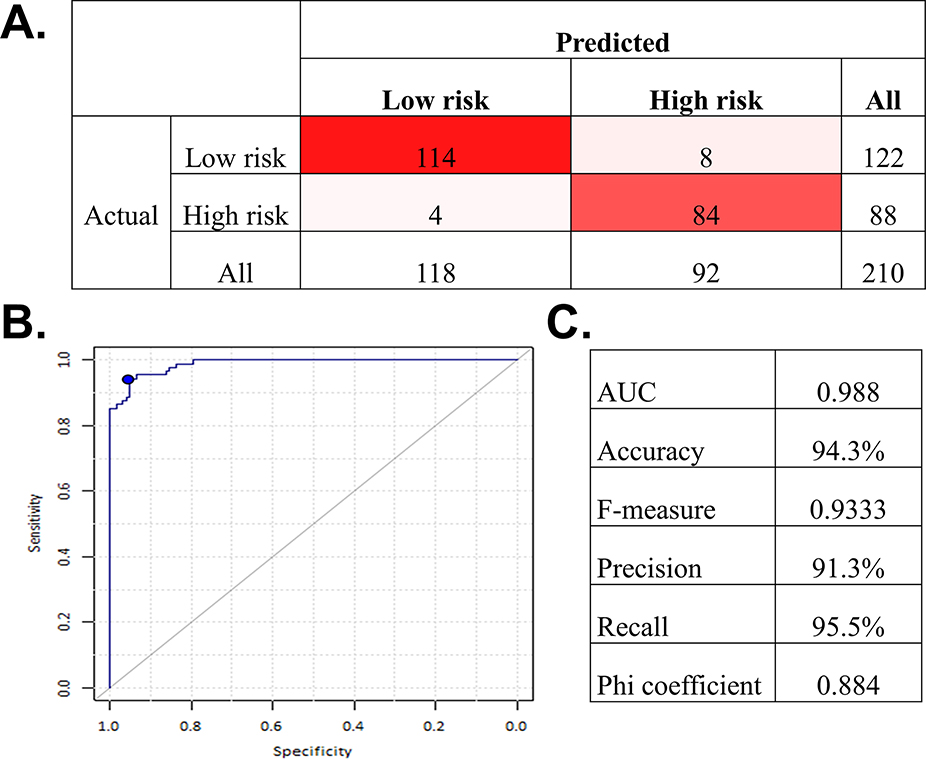
First, severity labels were generated in an unsupervised fashion on the ECHO dataset. The degree of AS severity was different in the high and low-severity groups (Supplementary table 1); the distribution of the echocardiographic features used in the network across the phenogroup labels is shown in Figure 1. Each echocardiographic feature demonstrated a smooth gradient across the networks, with preserved values consistently segregating to the left and impaired values segregating to the right sides of the respective graphs. The performance of the supervised classifier for application in external cohorts is shown in Figure 2.
Figures 1. Distribution of echo parameters across the TDA network.
(A) Distribution of the aortic valve area index across the topological data analysis (TDA) network. The color scales for nodes are adjusted to identify the distribution of aortic valve area < 1 cm2 and > 1.5 cm2 in the same shade of blue and red respectively. (B) Distribution of the left ventricular ejection fraction across the TDA network. The color scales for nodes are adjusted to identify the distribution of ejection fraction < 50% using the same shade of blue. (C) Distribution of the aortic valve mean gradient across the TDA network. (D) Distribution of the stroke volume index across the TDA network. The color scales for nodes are adjusted to identify the distribution of stroke volume indexed to body surface area< 30 ml/m2 and over 50 ml/m2 in the same blue and red, respectively. ECHO = echocardiography.
Figure 2. Accuracy of the machine learning ensemble classifier to predict the TDA cluster membership in the test set.
(A) Confusion matrix (B) Receiver operating characteristic curve (C) Estimated metrics of accuracy. (n=210). AUC = area under the curve; other abbreviation as in Figure 1.
Comparison of the phenogroups with current severity stratification
We first examined the potential reclassification provided by the machine-learning phenogroups as compared with conventional standard-of-care severity stratification (Table 2). In the ECHO cohort, almost all (~99%) of the patients classified traditionally as “concordant severe” on echocardiography were included in the high-severity group. However, important reclassification by the Machine-learning method was observed in the remaining patients who had both concordant non-severe AS and discordant echocardiographic measures. In particular 9% of patients with concordant non-severe AS based on standard classification were captured into the high-severity machine-learning group, while 64% of the “inconclusive” patients with discordant echocardiographic findings were deemed as having high severity based on machine learning.
Table 2.
Comparison of risk-stratification with the machine-learning and current standard-of-care approaches in all study cohorts
| Phenogroups | Standard-of-care AS Severity Grading | Total | ||
|---|---|---|---|---|
| Mild/Moderate | Discordant | Severe | ||
| ECHO Cohort | ||||
| Low Severity | 470 (91.4) | 125 (35.8) | 2 (1.1) | 597 (56.8) |
| High Severity | 44 (8.6) | 224 (64.2) | 187 (98.9) | 455 (43.3) |
| Total | 514 (100) | 349 (100) | 189 (100) | 1,052 (100) |
|
| ||||
| CMR Cohort | ||||
| Low Severity | 41 (85.4) | 9 (13.6) | 0 (0.0) | 50 (31.2) |
| High Severity | 7 (14.6) | 57 (86.4) | 46 (100) | 110 (68.8) |
| Total | 48 (100) | 66 (100) | 46 (100) | 160 (100) |
|
| ||||
| CT Cohort | ||||
| Low Severity | 169 (90.9) | 30 (16.4) | 1 (0.3) | 200 (26.6) |
| High Severity | 17 (9.1) | 153 (83.6) | 382 (99.7) | 552 (73.4) |
| Total | 186 (100) | 183 (100) | 383 (100) | 752 (100) |
Values are n (%). Abbreviations as in Table 1.
Biomarker Validation of AS Phenogroups
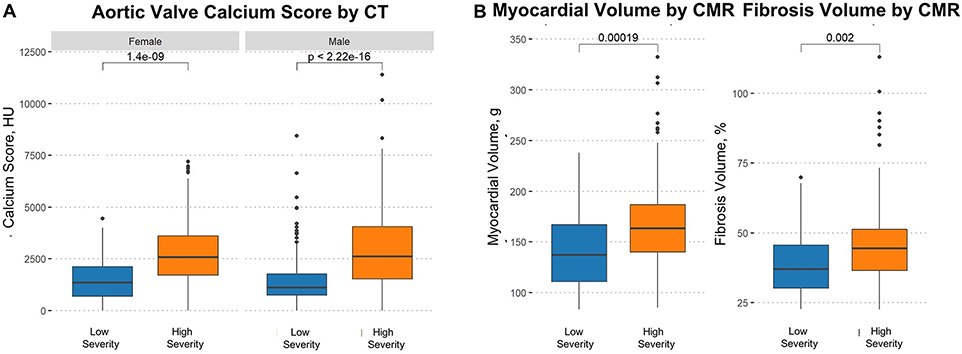
Table 3 shows the association of the machine-learning phenogroups with the CT and CMR assessments of AS severity. The median aortic valve calcium score was >2 times higher (p <0.0001) in the high-severity group as compared with the low-severity group - a finding that was replicated separately in both males and females (Figure 3). This resulted in a higher proportion of patients in the high-severity group with calcium scores in the severe range, using cutoffs of 2000 AU for men and 1200 AU in women, compared with low-severity patients (73% vs. 30%; p<0.0001) (3). With respect to CMR assessments of the myocardium, late gadolinium enhancement (replacement fibrosis) was twice as common in high-severity compared with low-severity patients (43.6% versus 20.0%, p = 0.004); the LV mass index and indexed extracellular volume (diffuse myocardial fibrosis) were also higher in the high-severity patients while longitudinal function was significantly reduced. Furthermore, cardiac biomarkers of heart failure (B-type natriuretic peptide) and myocardial injury (high-sensitivity troponin) were significantly increased in the high-severity patients. All these findings were consistently replicated in the subset of patients with non-severe/discordant AS suggesting appropriate reclassification by the machine-learning approach in this group (Table 3).
Table 3.
External Validation: disease correlates of machine-learning-based phenogroups
| All patients | Non-severe or discordant grading | |||||||
|---|---|---|---|---|---|---|---|---|
| High-severity | Low-severity | p value | High-severity | Low-severity | p value** | |||
| AV Calcium Score, HU | n | 552 | 200 | n | 170 | 199 | ||
| All | 752 | 2594 [1638 – 3752] | 1155 [730 – 1920] | <0.001 | 369 | 2052 [1185 – 3124] | 1152 [728 – 1904] | <0.001 |
| Females | 311 | 2577 [1709 – 3598] | 1351 [691 – 2117] | <0.001 | 121 | 1914 [1183 – 2875] | 1328 [684 – 2106] | 0.004 |
| Males | 441 | 2622 [1525 – 4046] | 1110 [738 – 1760] | <0.001 | 248 | 2080 [1236 – 3223] | 1110 [738 – 1760] | <0.001 |
| Severe calcium score*, n (%) | 752 | 403 (73.0) | 61 (30.5) | <0.001 | 369 | 100 (58.8) | 60 (30.2) | <0.001 |
|
| ||||||||
| CMR Parameters | n | 110 | 50 | n | 64 | 50 | ||
| LV Ejection Fraction, % | 160 | 67 [63 – 71] | 68 [63 – 70] | 0.821 | 114 | 66 [63 – 69] | 68 [63 – 70] | 0.333 |
| Stroke Volume Index, ml/m2 | 160 | 25 [22 – 31] | 25 [21 – 29] | 0.962 | 114 | 25 [21 – 31] | 25 [21 – 29] | 0.945 |
| LV Mass Index, g/m2 | 160 | 93 [79 – 103] | 77 [64 – 92] | <0.001 | 114 | 92 [80 – 103] | 77 [64 – 92] | <0.001 |
| Longitudinal Function, % | 159 | 11.5 [9.7 – 13.2] | 14.0 [12.2 – 15.2] | <0.001 | 114 | 11.5 [10.0 – 13.3] | 14.0 [12.2 – 15.2] | <0.001 |
| Myocardial Volume, g | 160 | 163 [140 – 186] | 137 [111 – 167] | <0.001 | 114 | 162 [140 – 181] | 137 [111 – 167] | 0.001 |
| Fibrosis Volume, % | 155 | 44.4 [36.4 – 51.2] | 37.0 [30.1 – 45.6] | 0.002 | 111 | 44.5 [38.1 – 49.7] | 37.0 [30.1 – 45.6] | 0.005 |
| Presence of LGE, n (%) | 160 | 48 (43.6) | 10 (20.0) | 0.004 | 114 | 29 (45.3) | 10 (20.0) | 0.005 |
| LV End-diastolic Volume, (ml) | 160 | 69 [62 – 79] | 70 [60 – 78] | 0.598 | 114 | 69 [64 – 79] | 70 [60 – 78] | 0.511 |
| LV End-systolic Volume, (ml) | 160 | 23 [18 – 27] | 23 [18 – 27] | 0.73 | 114 | 23 [20 – 28] | 23 [18 – 27] | 0.487 |
| Percent LGE, % | 44 | 7.0 [3.2 – 9.6] | 5.6 [4.9 – 11.5] | 0.936 | 29 | 5.9 [2.1 – 8.8] | 5.6 [4.9 – 11.5] | 0.61 |
| B-type natriuretic peptide, pg/ml | 138 | 32 [12 – 78] | 17 [10 – 43] | 0.012 | 108 | 32 [13 – 65] | 17 [10 – 43] | 0.031 |
| hs-troponin I, ng/ml | 155 | 8.0 [4.5 – 15.1] | 4.2 [2.9 – 7.6] | <0.001 | 112 | 7.8 [4.5 – 13.4] | 4.2 [2.9 – 7.6] | 0.001 |
Values are n, median (interquartile range), or n (%).
Cutoffs of 2,000 AU for men and 1,200 AU in women.
Myocardial fibrosis volume calculated by the indexed extracellular volume. AU = Agatston unit; LGE = late gadolinium enhancement; other abbreviations as in Table 1.
p-values are adjusted for multiple correction using the Bonferroni correction
Figure 3. Box plots displaying the distribution of aortic valve calcium score.
(A) Distribution of aortic valve calcium score by computed tomography, and (B) myocardial and fibrosis volume by cardiovascular magnetic resonance (CMR) in the high and low severity groups.
Clinical Validation of AS Phenogroups
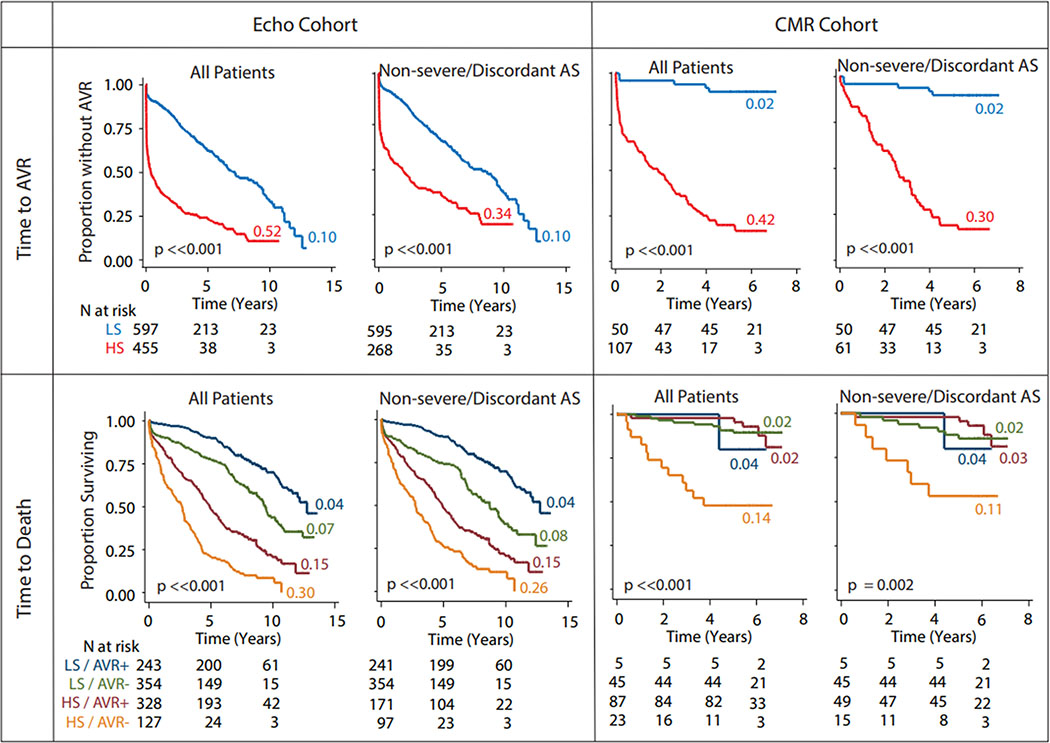
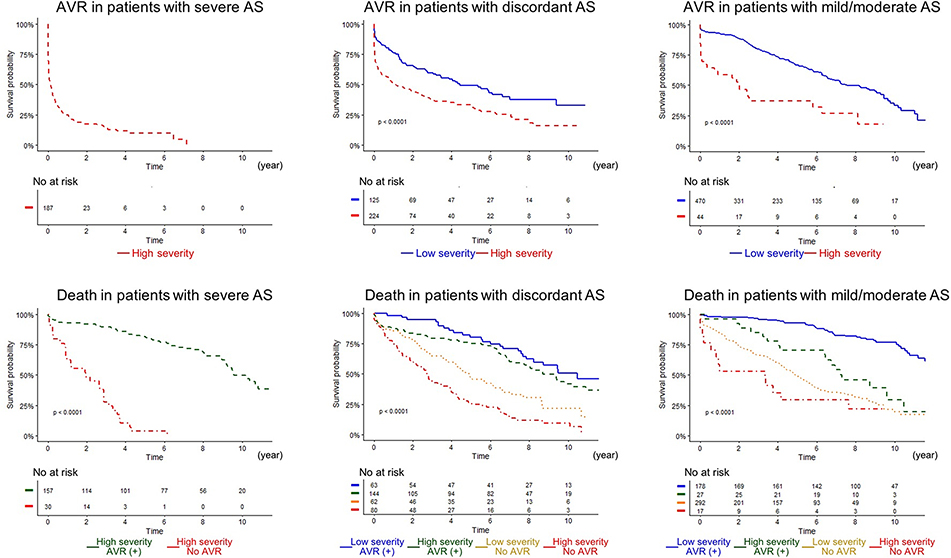
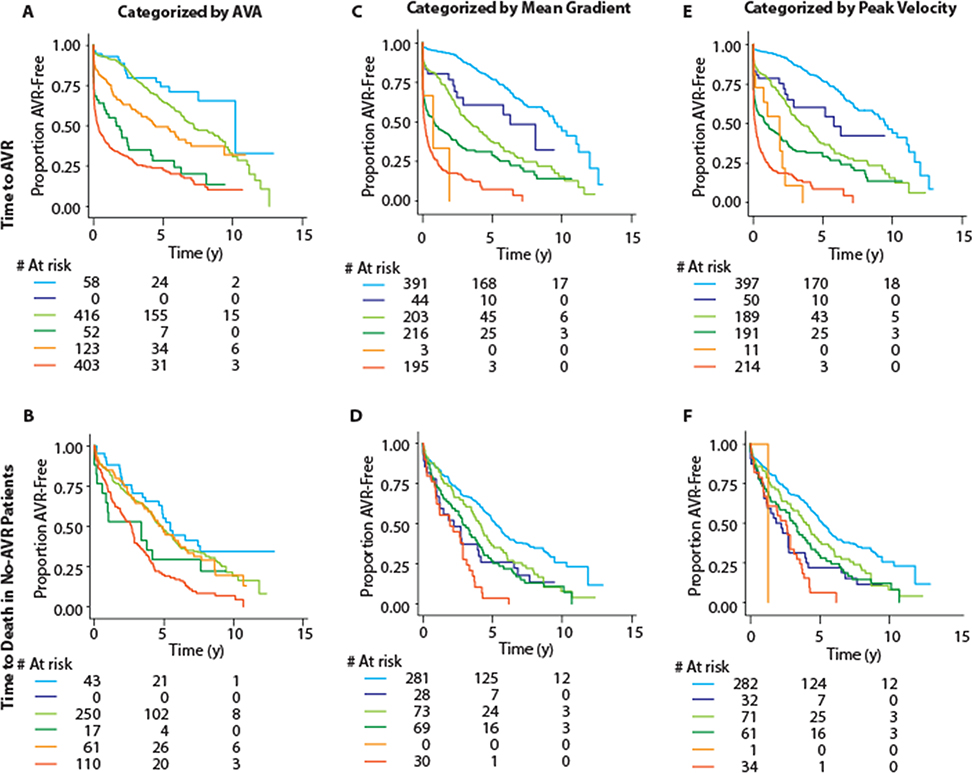
In the ECHO cohort, during a median follow-up of 5.6 years (interquartile range: 1.9 to 8.4 years), 571 (54%) patients underwent AVR and 506 (48%) died. Whereas in the CMR cohort, during a median follow up of 5.8 years (interquartile range: 5 to 6.2 years), 92 (57%) patients underwent AVR and 27 (17%) died. In the ECHO cohort, the high-severity machine-learning group progressed more rapidly to AVR compared to the low-severity group (Figure 4) (annual incidence rates >5 times that in the low-severity group, p <0.0001). In the CMR cohort this difference was even more stark (Figure 4) (annual incidence >20 times that in low-severity patients, p <0.0001). Even when the dataset was restricted to the non-severe/discordant AS patients, the high-severity group still progressed >3 times and >15 times faster to AVR than the low-severity group in the ECHO and CMR cohorts, respectively (Figure 4). This prognostic ability was retained when the patients with concordant non-severe and discordant AS grading were analyzed independently (Figure 5). Further, we found (Figure 6) that the TDA-based phenogroups continued to further stratify severity within each category of single echocardiographic features (e.g. peak velocity, mean gradient and aortic valve area) thereby indicating that the TDA groups proffered a superior prognostication as compared with any of the individual echocardiographic features that were used to generate the TDA-based severity groups.
Figure 4. Association of the phenogroups with time to aortic valve replacement and death in the ECHO and CMR cohorts.
All the analyses were done in all patients and in the subset of non-severe/discordant aortic stenosis patients. Panels show Kaplan-Meier plots for the color-coded subsets of patients. Appended to each curve is a color-coded number that indicates the annual incidence rate of the event in question for that specific subset of patients. Wilcoxon test was used to test the significance for difference between the curves, the results are shown at the lower-left corner of each Kaplan-Meier plot. HS, high severity; LS, low severity; AVR+, received aortic valve replacement; AVR- = did not receive aortic valve replacement; HS = high severity; LS = low severity; all other abbreviations as in Figures 1 and 3.
Figure 5. TDA-based phenogrouping demonstrated significant risk discrimination in all degrees of AS severity.
Left, middle, and right panels indicate patients with severe, discordant, and mild/moderate AS. (Top) Time to AVR in each TDA phenogroup is shown, whereas time to death in patients subdivided by TDA phenogroups and treatment (AVR) is depicted. There were only 2 (not shown in the graph) patients who were classified as low-risk in patients with severe AS. AS = aortic stenosis; all other abbreviations as in Figures 1 and 4.
Figure 6. Severity stratification with machine-learning-based groups within prognostic categories of component variables.
Figure shows Kaplan Meier plots for time to AVR (top row) and time to death in no-AVR patients (bottom row). Column-wise, the plots are for categorization based on aortic valve area (A, B), mean gradient (C, D) and peak velocity (E, F). Each of these variables was first trichotomized into mild, moderate and severe categories based on recommended cutoffs (>1.5, 1.0-<1.5 and <1.0 cm2 for aortic valve area; <20, 20-<40 and ≥40 mmHg for mean gradient; and <3, 3-<4 and ≥4 m/s for peak velocity). TDA-based phenogroups were the used to stratify within each of these categories. In all panels, the mild category is represented by blue color (stratified as light blue for low-severity and dark blue for high-severity), moderate category is indicated by green color (stratified as light green for low-severity and dark green for high-severity) and the severe category is represented by orange color (stratified as light orange for low-severity and dark orange for high-severity). As can be seen, TDA-based phenogroups continued to stratify patients within the prognostically defined categories of the component variables. Abbreviations as in Figures 1 and 4.
We compared the prognostic ability of the machine-learning phenogroups compared with conventional standard-of-care AS grading. In the ECHO cohort, the estimated IDI and NRI gained by the machine-learning phenogroups for the outcome of AVR at 5 years were 0.07 (95% CI 0.02 – 0.12) and 0.17 (95% CI 0.11 – 0.23) vs. the standard-of-care classification, indicating that the machine-learning phenogroups have better predictive ability. This finding appeared even stronger in the CMR cohort with corresponding values of 0.35 (95% CI 0.18 – 0.49) and 0.36 (95% CI 0.22 – 0.49), respectively. As an additional substantiation of the prognostic value of the machine-learning phenogroups, we compared the prognostic performance of these groups with CMR assessments of myocardial fibrosis. Once again, the machine-learning phenogroups provided better discrimination (IDI 0.22, 95% CI 0.11 – 0.33) and reclassification (NRI 0.48, 95% CI 0.08 – 0.60) for the outcome of AVR at 2 years compared with the presence of CMR LGE.
The association of phenogroups with time to death revealed consistent and interesting patterns across study cohorts. In the ECHO cohort, those who received an AVR progressed to death slower than those who did not - both in the high-severity group (Figure 4) (compare the orange and brown curves) and in the low-severity group (Figure 4) (compare the green and blue curves). High-severity patients who did not receive AVR progressed to death much faster as compared to all other patient groups. Furthermore, high-severity patients who received AVR progressed to death ~2 times faster than all low-severity patients regardless of whether they received an AVR or not (Figure 4) (compare red and green/blue curves). This pattern of association was retained in the non-severe/discordant aortic stenosis patients as well. In the CMR cohort, the high-severity patients who did not receive AVR continued to show the fastest progression to death - in all patients as well as non-severe/discordant AS patients (Figure 4) (lower right panel). Because the receipt of AVR modified time to death event and because the sample size was substantially limited for patients who did not receive AVR, we did not conduct the IDI and NRI analyses for this outcome.
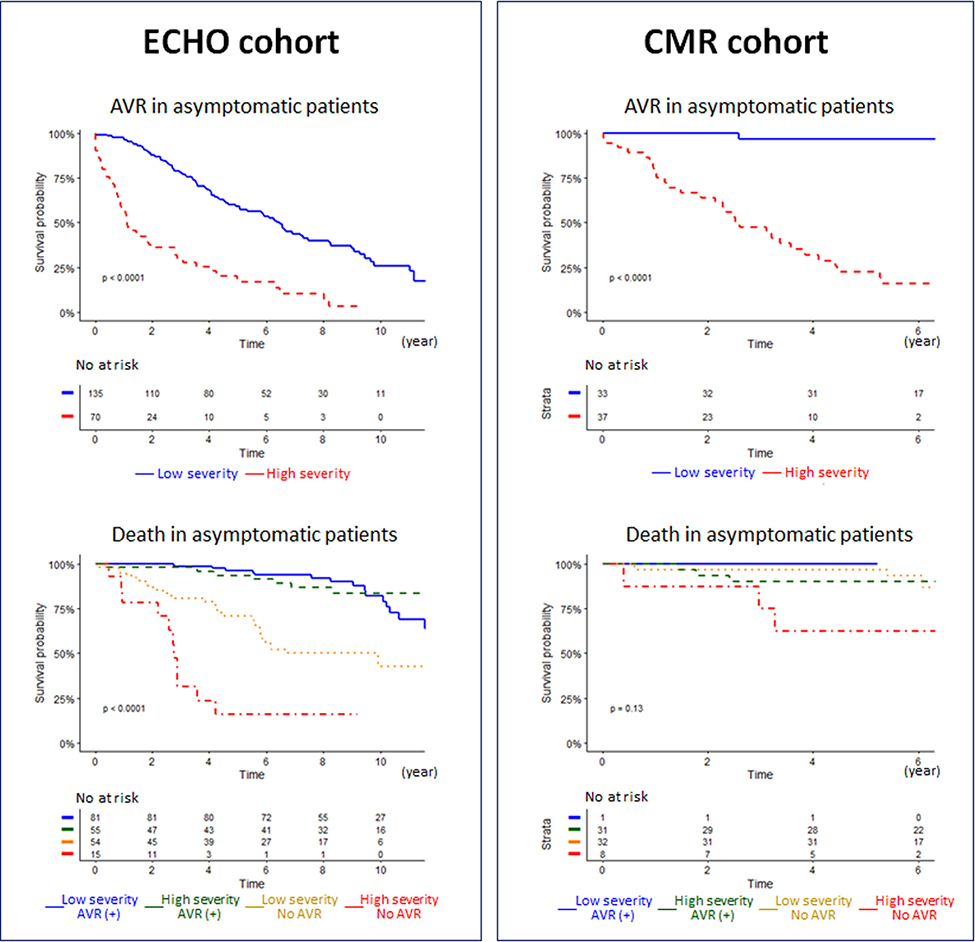
We also explored the prognostic value of the machine-learning classifier for patients with asymptomatic AS. In the ECHO cohort, total 205 asymptomatic patients were followed for a median interval of 8.1 years (interquartile range: 5.3 to 9.8 years). Total 136 (66%) patients had AVR and 59 (37%) patients died. In the CMR cohort, total 72 asymptomatic patients were followed for a median interval of 6.1 years (interquartile range: 5.7 to 6.5 years). Total 32 (44%) patients had AVR and 10 (14%) patients died. The high-severity machine-learning phenogroup continued to show significantly higher rates of AVR and Death than the low-severity phenogroup for the ECHO cohort and a similar trend was also noted in the CMR cohort (Figure 7).
Figure 7. Association of the phenogroups with time to aortic valve replacement and death in the ECHO and CMR cohort.
(Left and right) Survival curves in asymptomatic AS patients in the ECHO and CMR cohorts. (Top) Time to AVR in each TDA phenogroup is shown. (Lower) Time to death in patients subdivided by TDA phenogroups and treatment (AVR) is depicted. Abbreviations as in Figures 1, 3, 4, and 5.
DISCUSSION
The traditional focus of AS assessments has been on the valve. However, the left ventricular myocardial response to pressure overload is equally important. This study used 3 multicenter prospective cohorts of patients with AS to develop and then validate a novel machine-learning pipeline that integrates standard echocardiographic features to simplify the risk stratification of patients with AS. Nearly one third of patients had definitive echocardiographic features of severe AS and the machine-learning model correctly classified ~99% in the high-severity phenogroup. More importantly, the machine-learning model effectively reclassified the remaining two thirds of patients with either non-severe (mild/ moderate) AS or inconclusive discordant echocardiographic findings, without the need for any additional tests. The classification of low and high-severity phenogroups showed consistency with other known pathophysiological markers of disease severity as identified on CT and CMR imaging. Furthermore, the phenogroups showed incremental prognostic value, which was replicable across the study cohorts, and within the non-severe (mild/ moderate) and discordant subgroups in whom this reclassification is most likely to be of use. Together our study findings demonstrate that our open access machine-learning model can integrate echocardiographic features readily and meaningfully with robust performance across diverse international patient populations and provide powerful prediction of clinical events. This approach holds major promise in optimizing the timing of AVR, particularly for patient groups where traditional echocardiographic assessments are inconclusive.
The pathology and clinical presentations of AS are complex (15–17). The present machine-learning analysis identified meaningful AS risk subgroups and confirms our previous observations in animal models that first hinted at the value of machine-learning in understanding diverse phenotypic presentations in AS (9). Moreover, this analysis potentially addresses the existing debate whether classifying AS severity as mild, moderate or severe may have limitations in accurately risk stratifying many patients. For example, a recent study indicated high mortality even in patients determined to have moderate AS using current ECHO guidelines definitions (4,5,18). Moreover, in >30% patients not all echocardiographic features concur linearly with each other in a clinically consistent fashion (2,3,19). These patients with discordant echocardiographic assessments cause clinical uncertainty, (20–22) resulting in substantial cognitive burden, delays in clinical decision making, and the need for additional testing. Our results show that the machine-learning based phenogroups specifically add prognostic information to both these important categories of patient (non-severe and discordant AS) which cumulatively comprised nearly two thirds of the patients in our study. Although all the patients classified conventionally as severe were captured by our high-severity group, an important subset of the non-severe AS patients (8.6% to 14.6%, Table 2) were accurately identified to be high-severity by our classifier. Furthermore, the high-severity TDA phenogroup underwent AVR earlier than the low risk group. Whether these data support the application of AVR in high-severity patients without traditional criteria for intervention is now open to debate and requires future investigation. Further, the fact that high-severity patients who had an AVR were prognostically worse than low-severity patients who did not have AVR points towards the need for alternative and adjunct interventions for the high-severity patients. In totality, these findings demonstrate the additive and independent prognostic information embedded in our novel classifier which is being made freely available for future clinical trials.
Study Limitations:
The present investigation is observational in nature and thus has all the limitations implicit in all such studies. We did not directly assess the potential clinical and cost benefits that can be reaped by the machine-learning-based risk stratification in a controlled manner, but we provide a basis for conducting such studies in the future. The use of AVR as an end-point needs further considerations. The echocardiography parameters could have worsened and thus precipitated a decision to conduct surgery, however the IDI and NRI estimates were based on the echo parameters at enrollment and not prior to surgery. In effect, therefore the IDI and NRI estimates are likely to be an underestimate of the true influence of echo parameters on time to AVR. Moreover, we also used death as an end-point which was observed in 51.9% patients of the Echo cohort during follow-up. Because we wished to eliminate the potential confounding influence of AVR on death, we also restricted the analyses to those in whom AVR was not performed. This subset of no-AVR patients (n = 481) also had a high incidence of death (345, 71.7%). In this subset, the median time to death for the high-risk and low-risk patients (based on phenogroups) was 2.68 and 4.90 years, respectively. This data translates to a relative hazard of 2.01 and yields a post hoc power estimate of almost 100%. Moreover, the cardiac magnetic resonance cohort, though small provided an additional external validation of this observation. The replicability of the observations across diverse patient cohorts with data collected in real-world scenario and the significant associations observed with a range of independent disease severity indicators as well as adverse clinical outcomes strongly support the potential clinical utility of machine-learning phenogrouping.
Future Directions:
Future prospective work would need to address the potential role of this classifier for guiding the timing of surgical and transcatheter AVR, specifically in patients with asymptomatic AS or discordant AS. In addition, the phenotyping of patients with moderate AS who are phenogrouped as high-severity AS by the classifier is worthy of further exploration in lieu of the recent interest in evaluating the role of transcatheter AVR in heat failure patients with moderate AS (23). Future work would need to also investigate the incremental value of additional ECHO parameters of LV muscle and fluid mechanics that has been shown to improve the prognostic performance of machine learning models in heart failure patients (24). Specifically, the incorporation of biomarkers like LV global longitudinal strain and left atrial strain could improve the prognostic performance of the classifier for predicting AS severity and the timing of intervention. Finally, the concept of ‘Grading’ and ‘Staging’ as two distinct steps commonly used in cancer prognosis and therapy may be relevant even for AS patients. The current work focuses on augmenting the grading the AS severity using machine learning. However further staging by delineating the cardiac and extracardiac involvement beyond simply the aortic valve and the LV may be important. For example, a staging classification where assessment of left atrial, mitral valve, pulmonary vasculature, tricuspid valve and right-ventricular dysfunction has been recently illustrated to provide incremental prognostic value beyond simply assessing the aortic valve and the LV (25). Similarly, machine learning models that integrate both the grading of AS severity with additional cardiac and extracardiac involvement may be prognostically relevant and requires further considerations.
Conclusions
In conclusion, we demonstrate the superiority of a novel machine-learning approach for grading the severity of AS patients with advantages in terms of accuracy, biological plausibility and prognostic capability, compared to the conventional standard-of-care approach. This effect was most notable in the two thirds of patients with non-severe or discordant AS in whom clinical decision making is currently challenging and who require improved risk stratification to optimize the timing of AVR. Future studies are required to evaluate how these machine-learning phenogroups can be exploited to answer the continuing clinical conundrum of early versus late intervention for patients with AS.
Supplementary Material
COMPETENCY IN MEDICAL KNOWLEDGE.
We demonstrate the superiority of a novel machine-learning risk stratification approach for patients with AS with advantages in terms of accuracy, biological plausibility, and prognostic capability, compared to the conventional standard-of-care approach.
TRANSLATIONAL OUTLOOK.
We have made our classifier publicly available on https://asgps.herokuapp.com/ Future studies are required to evaluate how these machine-learning phenogroups can be exploited to answer the continuing clinical conundrum of early versus late intervention for patients with AS.
Acknowledgments
Funding / Grant: This work is supported in part by funds from the National Science Foundation (NSF: # 1920920) and National Institute of General Med ical Sciences of the National Institutes of Health under (NIH: #5U54GM104942-04). Dr. Tastet is supported by a doctoral scholar ship from Fonds de Recherche en Santé Québec. Dr. Newby is supported by the British Heart Foundation (CH/09/002, RE/18/5/34216, RG/16/10/32375); and is the recipient of a Wellcome Trust Senior Investigator Awrd (WT103782AIA). Dr. Dweck is supported by the British Heart Foundation (FS/14/78/31020); and is the recipient of the Sir Jules Thorn Award for Biomedical Research 2015 (15/JTA).
Abbreviations
- AVR
aortic valve replacement
- CT
computed tomography
- CMR
cardiovascular magnetic resonance
- ECHO
echocardiography
- TDA
Topological data analysis
- IDI
the integrated discrimination improvement
- NRI
net reclassification index
- HS
high severity
- LS
low severity
- AS
aortic stenosis
- LGE
late gadolinium enhancement
- LV
left ventricular
Appendix
Artificial Intelligence for Aortic Stenosis at Risk (AI for AS at Risk) International Consortium
Éric Larose, Department of Medicine, Institut Universitaire de Cardiologie et de Pneumologie de
Québec/Québec Heart and Lung Institute, Laval University, Québec, Canada
Ezequiel Guzzetti, Department of Medicine, Institut Universitaire de Cardiologie et de
Pneumologie de Québec/Québec Heart and Lung Institute, Laval University, Québec, Canada
Mathieu Bernier, Department of Medicine, Institut Universitaire de Cardiologie et de
Pneumologie de Québec/Québec Heart and Lung Institute, Laval University, Québec, Canada
Jonathan Beaudoin, Department of Medicine, Institut Universitaire de Cardiologie et de
Pneumologie de Québec/Québec Heart and Lung Institute, Laval University, Québec, Canada
Marie Arsenault, Department of Medicine, Institut Universitaire de Cardiologie et de
Pneumologie de Québec/Québec Heart and Lung Institute, Laval University, Québec, Canada Nancy Côté, Department of Medicine, Institut Universitaire de Cardiologie et de Pneumologie de Québec/Québec Heart and Lung Institute, Laval University, Québec, Canada
Russell Everett, Centre for Cardiovascular Science, University of Edinburgh, United Kingdom
William SA Jenkins, Centre for Cardiovascular Science, University of Edinburgh, United Kingdom
Christophe Tribouilloy, Department of Cardiology, Centre Hospitalier Universitaire d’Amiens, Picardie, France
Julien Dreyfus, Centre Cardiologique du Nord, Saint-Denis, France
Tiffany Mathieu, Department of Cardiology, Bichat Hospital, Paris, France
Cedric Renard, Department of Radiology, Centre Hospitalier Universitaire d/Amiens, Picardie, France
Mesut Gun, Department of Cardiology, Centre Hospitalier Universitaire d’Amiens, Picardie, France
Laurent Macron, Centre Cardiologique du Nord, Saint-Denis, France
Jacob W. Sechrist, Division of Cardiothoracic Imaging, Department of Radiology, University of Pittsburgh Medical Center, PA
Joan M. Lacomis, Division of Cardiothoracic Imaging, Department of Radiology, University of Pittsburgh Medical Center, PA
Virginia Nguyen, Department of Cardiology, Bichat Hospital, Paris, France
Laura Galian Gay, Department of Cardiology, Hospital Universitari Vall d’Hebron, Barcelona, Spain
Hug Cuéllar Calabria, Department of Cardiology, Hospital Universitari Vall d’Hebron, Barcelona, Spain
Ioannis Ntalas, Department of Cardiology, Guy’s and St Thomas’ NHS Foundation Trust, London, United Kingdom
Bernard Prendergast, Department of Cardiology, Guy’s and St Thomas’ NHS Foundation Trust, London, United Kingdom
Ronak Rajani, Department of Cardiology, Guy’s and St Thomas’ NHS Foundation Trust, London, United Kingdom
Arturo Evangelista, Department of Cardiology, Hospital Universitari Vall d’Hebron, Barcelona, Spain
João L. Cavalcante, Minneapolis Heart Institute, Minneapolis, USA
Footnotes
Disclosure: Dr. Sengupta is a consultant for Kencor Health, RCE Technologies, and Ultromics. All other authors have no relationships relevant to the contents of this paper to disclose.
Publisher's Disclaimer: This is a PDF file of an unedited manuscript that has been accepted for publication. As a service to our customers we are providing this early version of the manuscript. The manuscript will undergo copyediting, typesetting, and review of the resulting proof before it is published in its final form. Please note that during the production process errors may be discovered which could affect the content, and all legal disclaimers that apply to the journal pertain.
REFERENCES
- 1.Otto CM, Prendergast B. Aortic-valve stenosis--from patients at risk to severe valve obstruction. N Engl J Med 2014;371:744–56. [DOI] [PubMed] [Google Scholar]
- 2.Bonow RO, Brown AS, Gillam LD et al. ACC/AATS/AHA/ASE/EACTS/HVS/SCA/SCAI/SCCT/SCMR/STS 2017 Appropriate Use Criteria for the Treatment of Patients With Severe Aortic Stenosis: A Report of the American College of Cardiology Appropriate Use Criteria Task Force, American Association for Thoracic Surgery, American Heart Association, American Society of Echocardiography, European Association for Cardio-Thoracic Surgery, Heart Valve Society, Society of Cardiovascular Anesthesiologists, Society for Cardiovascular Angiography and Interventions, Society of Cardiovascular Computed Tomography, Society for Cardiovascular Magnetic Resonance, and Society of Thoracic Surgeons. J Am Coll Cardiol 2017;70:2566–2598. [DOI] [PubMed] [Google Scholar]
- 3.Baumgartner H, Hung J, Bermejo J et al. Recommendations on the Echocardiographic Assessment of Aortic Valve Stenosis: A Focused Update from the European Association of Cardiovascular Imaging and the American Society of Echocardiography. J Am Soc Echocardiogr 2017;30:372–392. [DOI] [PubMed] [Google Scholar]
- 4.Baumgartner H, Falk V, Bax JJ et al. 2017 ESC/EACTS Guidelines for the management of valvular heart disease. European heart journal 2017;38:2739–2791. [DOI] [PubMed] [Google Scholar]
- 5.Writing Committee Members, Otto CM, Nishimura RA, Bonow RO, Carabello BA, Erwin JP 3rd, Gentile F, Jneid H, Krieger EV, Mack M, McLeod C, O’Gara PT, Rigolin VH, Sundt TM 3rd, Thompson A, Toly C, et al. 2020 ACC/AHA Guideline for the Management of Patients With Valvular Heart Disease: A Report of the American College of Cardiology/American Heart Association Joint Committee on Clinical Practice Guidelines. J Am Coll Cardiol 2021;February2:e25–197. [DOI] [PubMed] [Google Scholar]
- 6.Musa TA, Treibel TA, Vassiliou VS et al. Myocardial Scar and Mortality in Severe Aortic Stenosis. Circulation 2018;138:1935–1947. [DOI] [PMC free article] [PubMed] [Google Scholar]
- 7.Chin CW, Semple S, Malley T et al. Optimization and comparison of myocardial T1 techniques at 3T in patients with aortic stenosis. European heart journal cardiovascular Imaging 2014;15:556–65. [DOI] [PMC free article] [PubMed] [Google Scholar]
- 8.Pawade T, Clavel MA, Tribouilloy C et al. Computed Tomography Aortic Valve Calcium Scoring in Patients With Aortic Stenosis. Circ Cardiovasc Imaging 2018;11:e007146. [DOI] [PubMed] [Google Scholar]
- 9.Casaclang-Verzosa G, Shrestha S, Khalil MJ et al. Network Tomography for Understanding Phenotypic Presentations in Aortic Stenosis. JACC Cardiovascular imaging 2019;12:236–248. [DOI] [PubMed] [Google Scholar]
- 10.Ng ACT, Delgado V, Bax JJ. Individualized Patient Risk Stratification Using Machine Learning and Topological Data Analysis. JACC Cardiovasc Imaging 2020. [DOI] [PubMed] [Google Scholar]
- 11.Tokodi M, Shrestha S, Bianco C et al. Interpatient Similarities in Cardiac Function: A Platform for Personalized Cardiovascular Medicine. JACC Cardiovasc Imaging 2020. [DOI] [PMC free article] [PubMed] [Google Scholar]
- 12.Capoulade R, Le Ven F, Clavel MA et al. Echocardiographic predictors of outcomes in adults with aortic stenosis. Heart 2016;102:934–42. [DOI] [PubMed] [Google Scholar]
- 13.Chin CWL, Everett RJ, Kwiecinski J et al. Myocardial Fibrosis and Cardiac Decompensation in Aortic Stenosis. JACC Cardiovasc Imaging 2017;10:1320–1333. [DOI] [PMC free article] [PubMed] [Google Scholar]
- 14.Uno H, Tian L, Cai T, Kohane IS, Wei LJ. A unified inference procedure for a class of measures to assess improvement in risk prediction systems with survival data. Stat Med 2013;32:2430–42. [DOI] [PMC free article] [PubMed] [Google Scholar]
- 15.Rajamannan NM, Evans FJ, Aikawa E et al. Calcific aortic valve disease: not simply a degenerative process: A review and agenda for research from the National Heart and Lung and Blood Institute Aortic Stenosis Working Group. Executive summary: Calcific aortic valve disease-2011 update. Circulation 2011;124:1783–91. [DOI] [PMC free article] [PubMed] [Google Scholar]
- 16.Nazarzadeh M, Pinho-Gomes AC, Smith Byrne K et al. Systolic Blood Pressure and Risk of Valvular Heart Disease: A Mendelian Randomization Study. JAMA Cardiol 2019. [DOI] [PMC free article] [PubMed] [Google Scholar]
- 17.Kaltoft M, Langsted A, Nordestgaard BG. Obesity as a Causal Risk Factor for Aortic Valve Stenosis. J Am Coll Cardiol 2020;75:163–176. [DOI] [PubMed] [Google Scholar]
- 18.Strange G, Stewart S, Celermajer D et al. Poor Long-Term Survival in Patients With Moderate Aortic Stenosis. J Am Coll Cardiol 2019;74:1851–1863. [DOI] [PubMed] [Google Scholar]
- 19.Delgado V, Clavel MA, Hahn RT et al. How Do We Reconcile Echocardiography, Computed Tomography, and Hybrid Imaging in Assessing Discordant Grading of Aortic Stenosis Severity? JACC Cardiovasc Imaging 2019;12:267–282. [DOI] [PubMed] [Google Scholar]
- 20.Blitz LR, Herrmann HC. Hemodynamic assessment of patients with low-flow, low-gradient valvular aortic stenosis. Am J Cardiol 1996;78:657–61. [DOI] [PubMed] [Google Scholar]
- 21.Guzzetti E, Pibarot P, Clavel MA. Normal-flow low-gradient severe aortic stenosis is a frequent and real entity. European heart journal cardiovascular Imaging 2019;20:1102–1104. [DOI] [PubMed] [Google Scholar]
- 22.Hachicha Z, Dumesnil JG, Bogaty P, Pibarot P. Paradoxical low-flow, low-gradient severe aortic stenosis despite preserved ejection fraction is associated with higher afterload and reduced survival. Circulation 2007;115:2856–64. [DOI] [PubMed] [Google Scholar]
- 23.Pibarot P, Messika-Zeitoun D, Ben-Yehuda O, et al. Moderate Aortic Stenosis and Heart Failure With Reduced Ejection Fraction: Can Imaging Guide Us to Therapy? JACC Cardiovasc Imaging. 2019;12:172–184. [DOI] [PubMed] [Google Scholar]
- 24.Cho JS, Shrestha S, Kagiyama N, Hu L, Ghaffar YA, Casaclang-Verzosa G, Zeb I, Sengupta PP. A Network-Based “Phenomics” Approach for Discovering Patient Subtypes From High-Throughput Cardiac Imaging Data. JACC Cardiovasc Imaging. 2020;13:1655–1670. [DOI] [PubMed] [Google Scholar]
- 25.Généreux P, Pibarot P, Redfors B, et al. Staging classification of aortic stenosis based on the extent of cardiac damage. Eur Heart J. 2017;38:3351–3358 [DOI] [PMC free article] [PubMed] [Google Scholar]
Associated Data
This section collects any data citations, data availability statements, or supplementary materials included in this article.


