

Abstract
Neurotensin (NT) serves as a neuromodulator in the brain where it regulates a variety of physiological functions. Whereas the central amygdala (CeA) expresses NT peptide and NTS1 receptors and application of NT has been shown to excite CeA neurons, the underlying cellular and molecular mechanisms have not been determined. We found that activation of NTS1 receptors increased the neuronal excitability of the lateral nucleus (CeL) of CeA. Both phospholipase Cβ (PLCβ) and phosphatidylinositol 4,5-bisphosphate (PIP2) depletion were required, whereas intracellular Ca2+ release and PKC were unnecessary for NT-elicited excitation of CeL neurons. NT increased the input resistance and time constants of CeL neurons, suggesting that NT excites CeL neurons by decreasing a membrane conductance. Depressions of the inwardly rectifying K+ (Kir) channels including both the Kir2 subfamily and the GIRK channels were required for NT-elicited excitation of CeL neurons. Activation of NTS1 receptors in the CeL led to GABAergic inhibition of medial nucleus of CeA neurons, suggesting that NT modulates the network activity in the amygdala. Our results may provide a cellular and molecular mechanism to explain the physiological functions of NT in vivo.
Keywords: excitability, action potential, K+ channels, G protein, peptide, synapse, receptor, GABA, PIP2
1. Introduction
Whereas neurotensin (NT) is a tridecapeptide originally isolated from bovine hypothalamus, it is also found in the central nervous system, as well as in the gastrointestinal tract. NT serves as a neuromodulator in the brain where it regulates a diverse range of functions including antinociception (Clineschmidt et al., 1979), hypothermia (Bissette et al., 1976), anterior pituitary hormone secretion, muscle relaxation (Kitabgi et al., 1992), blood pressure, and inflammation (St-Gelais et al., 2006). NT interacts with three types of receptors including the high affinity NTS1, the low affinity NTS2 and NTS3 receptors (Boules et al., 2013; St-Gelais et al., 2006). Both NTS1 and NTS2 receptors are G-protein coupled, whereas NTS3 is a single transmembrane amino acid receptor participating in the modulation of NT intracellular sorting and signaling processes (Sarret et al., 2003). Depending on the cell type, NTS1 receptors are capable of coupling to diverse G proteins including Gαq, Gαi, Gαo, Gα13 and Gαs, linking to a variety of intracellular signaling cascades including inositol phosphate, cyclic AMP, and arachidonic acid accumulation as well as the activation/inhibition of mitogen-activated protein kinases (ERK1/2 and JNK) and serine/threonine protein kinase Akt (Besserer-Offroy et al., 2017; Muller et al., 2011; Olsen et al., 2020). However, the signaling mechanism corresponding to individual physiological function of NT has not been fully determined.
The amygdala is an important structure involved in modulating emotion (Dejean et al., 2015; Janak and Tye, 2015; Ressler, 2010; Tye et al., 2011), pain (Neugebauer, 2015; Neugebauer et al., 2004; Veinante et al., 2013), alcohol use disorders (Gilpin et al., 2015; Silberman et al., 2008) and appetite (Petrovich, 2011, 2013; Smith and Lawrence, 2018; Zanchi et al., 2017). The amygdala is comprised of the lateral amygdala (LA), the basolateral amygdala (BLA), and the central amygdala (CeA). The CeA consists of 3 subnuclei: the capsular, lateral, and medial nucleus of CeA (LeDoux, 2000) (abbreviated as CeC, CeL and CeM, respectively), although the CeL and CeC are functionally considered together (CeL/C). Information flows from the LA and BLA into the CeA (Duvarci and Pare, 2014). Within the CeA, the CeL projects to the CeM, with no reciprocal projection from the CeM to the CeL (Pitkänen, 2000). The CeM is the major output nucleus of the amygdala and projects to regions that produce behavioral and physiologic responses to emotionally relevant events (Hopkins and Holstege, 1978; Pape and Pare, 2010; Pitkänen, 2000), although the CeL also sends GABAergic projections to behavioral and physiologic effector regions (Penzo et al., 2014).
The CeA is one of the sources of NT in the brain (Schroeder et al., 2019; Uhl et al., 1977). In rats, NT-immunoreactive neurons were identified in all subdivisions, with the greatest numbers in the CeL nucleus (Bayer et al., 1991; Cassell and Gray, 1989; Honkaniemi et al., 1990; Tay et al., 1989; Veening et al., 1984; Wray and Hoffman, 1983). In mice, NT-immunoreactive cells are expressed in both CeL (Honkaniemi et al., 1990; Kim et al., 2017; McCullough et al., 2018; Shimada et al., 1989; Wray and Hoffman, 1983) and CeM (Kim et al., 2017; McCullough et al., 2018) regions. The neurotensinergic circuits project from the CeA to a variety of brain regions including the parabrachial nucleus of the pons (Ma et al., 2019; Moga and Gray, 1985a, b; Torruella-Suarez et al., 2020), the bed of the stria terminalis (Uhl and Snyder, 1979), the substantia nigra pars compacta (Vankova et al., 1992) and reticulata (Gonzales and Chesselet, 1990), the ventromedial (Inagaki et al., 1983) and lateral (Allen and Cechetto, 1995) hypothalamus, the ventral tegmental area (Ma et al., 2019; Woodworth et al., 2018) and the locus coeruleus (Ma et al., 2019). The extensive projections of neurotensinergic fibers to diverse brain regions further support that NT plays important modulatory roles in the brain.
Reciprocally, the CeA also receives neurotensinergic innervations from the parabrachial nucleus (Block et al., 1989; Yamano et al., 1988). The neurotensinergic projections from the parabrachial nucleus target the CeL/C nuclei (Ponserre et al., 2020; Shinohara et al., 1988). In the CeA, NTS1 receptor mRNA (Alexander and Leeman, 1998) and NT-binding sites (Lantos et al., 1996) are expressed largely in the CeL. The apposition of neurotensinergic fibers and NT receptors in the CeL suggests that NT exerts important functions in the CeA. Consistent with the anatomical distribution of NT and NT receptors in the CeA, application of NT dose-dependently excites a majority of CeA neurons as assessed by extracellular recordings (Lu et al., 1996). However, the underlying ionic and signaling mechanisms have not been determined. In this study, we found that activation of NTS1 receptors facilitated neuronal excitability of CeA via phospholipase Cβ (PLCβ) and phosphatidylinositol 4,5-bisphosphate (PIP2) depletion-mediated depression of inwardly rectifying K+ (Kir) channels. Our results may provide one of the cellular and molecular mechanisms to explain the physiological functions of NT in the brain.
2. Materials and Methods
2.1. Preparation of amygdala slices
Coronal brain slices (300 μm) were prepared from virgin male and female Sprague-Dawley rats (21–35 days old) using the same procedures as described previously (Boyle et al., 2021a; Hu et al., 2020). Rats were purchased from Envigo RMS, INC. (Indianapolis, IN) and housed in the Center for Biomedical Research in the University of North Dakota with food and water available ad libitum until use. The animal rooms were maintained on a 14/10 h light–dark cycle (lights on at 7:00 a.m.), with a room temperature of 22°C. The number of males and females for each experiment was kept as equal as possible. After being deeply anesthetized with isoflurane, animals were decapitated and their brains were dissected out. After the trimming of the cerebellum, the caudal pole of the brain was glued to the plate of a vibrotome (Leica VT1200S) and then bathed in an ice-cold solution that contained (in mM) 130 NaCl, 24 NaHCO3, 3.5 KCl, 1.25 NaH2PO4, 2.5 CaCl2, 1.5 MgCl2, and 10 glucose, saturated with 95% O2 and 5% CO2. Slices were kept in this solution at 35°C until use. All procedures and experiments presented in this study were approved by the Institutional Animal Use and Care Committee of the University of North Dakota and performed in accordance with the National Institutes of Health Guide for the Care and Use of Laboratory Animals.
2.2. Recordings of action potentials, resting membrane potentials and holding currents from amygdala neurons
Whole-cell patch-clamp recordings using a Multiclamp 700B amplifier (Molecular Devices, Sunnyvale, CA) in current- or voltage-clamp mode were made from the neurons in the CeL visually identified with infrared video microscopy (Olympus BX51WI) and differential interference contrast optics. All the recordings were performed at ~33°C by warming the extracellular solution with the SH-27B single inline solution heaters (Warner Instruments). The recording electrodes were filled with (in mM) 120 K+-gluconate, 10 KCl, 5 NaCl, 2 MgCl2, 10 HEPES, 0.5 EGTA, 2 ATPNa2, 0.4 GTPNa, and 5 phosphocreatine (pH 7.3), unless stated otherwise. The extracellular solution was the same as the cutting solution. Data were filtered at 2 kHz, digitized at 10 kHz, acquired and analyzed subsequently using pCLAMP 10.7 software (Molecular Devices, Sunnyvale, CA). For the recordings of action potentials (APs), the above extracellular solution was supplemented with kynurenic acid (1 mM) to block glutamatergic transmission and picrotoxin (100 μM) to block GABAergic transmission. NT was dissolved in the extracellular solution and bath-applied to the slices. Because it has been demonstrated that 0.3 μM NT is a near-saturating concentration to excite CeA neurons (Lu et al., 1996), we used NT at this concentration for all the experiments for a better comparison. To prevent potential desensitization induced by repeated applications of the agonist, each slice was limited to only one application of NT. Resting membrane potentials (RMPs) and holding currents at −60 mV were recorded in the extracellular solution supplemented with tetrodotoxin (TTX, 0.5 μM), kynurenic acid (1 mM) and picrotoxin (100 μM).
2.3. Recordings of sIPSCs and mIPSCs from CeM neurons
Spontaneous IPSCs (sIPSCs) and miniature IPSCs (mIPSCs) were recorded in Clampex 10.7 from CeM neurons in the extracellular solution supplemented with DNQX (10 μM) and APV (50 μM) to block glutamatergic transmission. For mIPSCs, TTX (1 μM) was included in the above extracellular solution to block AP firing. The intracellular solution contained (mM) 135 CsCl, 2 MgCl2, 10 HEPES, 0.5 EGTA, 2 ATPNa2, 0.4 GTPNa, and 5 phosphocreatine (pH 7.3). The holding potential was at −60 mV. NT dissolved in extracellular solution at 1 μM was puffed to the CeL through a glass pipette connected to a picospritzer (Toohey company pressure system IIe). The pressure was set at 20 psi and puff duration was 60 s. The recorded synaptic events were analyzed by Clampfit 10.7 with “Event Detection” and “Template Search”. The data were then output to Excel and binned per minute with a custom formula in Excel. The frequency and amplitude of sIPSCs and mIPSCs in basal condition (denoted as control) were the averages of 5 min of recordings prior to the puffing of NT and those after the puffing of NT (denoted as NT) were the averages of 2 min of recordings when the maximal effect was achieved.
2.4. Data analysis
Data were presented as the means ± S. E. M. N number in the text was the number of cells used. Each experiment was conducted in slices cut from at least 4 animals and a maximum of 4 cells were recorded from each animal for the data used for each experiment to minimize potential influences of variation from individual animals. One-way ANOVA was used to ensure there was no significant difference for the data obtained from individual animals. Because the maximal response occurred within 5 min during the application of NT, we measured the peak response of NT for statistical analysis. Mann-Whitney test or Wilcoxon matched-pairs signed rank test (abbreviated as Wilcoxon test in the text) or two-way repeated measures ANOVA followed by Sidak multiple comparison test was used for statistical analysis as appropriate; P values were reported throughout the text and significance was set as P < 0.05.
2.5. Chemicals
The following chemicals were products of R&D Systems: NT, TTX, kynurenic acid, picrotoxin, SR 48692, GDP-β-S, U73122, U73343, heparin, thapsigargin, chelerythrine, bisindolylmaleimide II (Bis II), ML 133, and tertiapin-Q (TQ). Dioctanoyl phosphatidylinositol 4,5-bisphosphate (dic8-PIP2) was purchased from Echelon Biosciences. PD149163 was product of Millipore Sigma. Drugs were initially prepared in stock solution, aliquoted and stored at −20°C. For those chemicals requiring dimethyl sulfoxide (DMSO) as a solvent, the concentration of DMSO was less than 0.1%. This concentration of DMSO either in the recording pipettes or in the bath had no significant effects on NT-elicited facilitation of AP firing (data not shown).
3. Results
3.1. NT excites CeL neurons
Whereas application of NT has been shown to increase spontaneous firing frequency recorded from CeA by extracellular recordings (Lu et al., 1996), the underlying ionic and signaling mechanisms have not been determined. Because the NTS1 receptor mRNA (Alexander and Leeman, 1998) and NT-binding sites (Lantos et al., 1996) are more densely localized in the CeL, we limited our recordings to the CeL. The division of CeC, CeL and CeM in slices were shown in Fig. 1A and our previous publications (Boyle et al., 2021b; Hu et al., 2020). CeL neurons are divided electrophysiologically into three types: regular spiking (RS, ~54%), low-threshold bursting (LTB, ~34%) and late firing (LF, ~12%) (Amano et al., 2012; Dumont et al., 2002). We therefore recorded RMP and potential AP firing from the CeL neurons and tested the effects of NT on individual neurons. Among the 55 CeL neurons recorded, the classification of the neuronal types was 31 RS (~56.4%), 20 LTB (~36.4%) and 4 LF (~7.2%). In the 31 RS neurons, application of NT (0.3 μM) elicited AP firing from the RMPs in 12 cells (76 ± 18 APs/min, n = 12, P = 0.0005, Wilcoxon test, Fig. 1B1-B3) and subthreshold depolarization in 19 cells (Control: −66.1 ± 1.1 mV, NT: −63.9 ± 1.2 mV, net depolarization: 2.1 ± 0.6 mV, n = 19, P < 0.0001, Wilcoxon test, Fig. 1B4-B5). In the 20 LTB neurons, application of NT at the same concentration induced AP firing from the RMPs in 10 cells (74 ± 28 APs/min, n = 10, P = 0.002, Wilcoxon test, Fig. 1C1-C3) and subthreshold depolarization in 10 cells (Control: −62.6 ± 0.9 mV, NT: −59.4 ± 1.3 mV, net depolarization: 3.2 ± 0.8 mV, n = 10, P = 0.006, Wilcoxon test, Fig. 1C4-C5). In the 4 LF cells, application of NT elicited no AP firing from the RMPs but only subthreshold depolarization (Control: −67.5 ± 3.0 mV, NT: −63.6 ± 3.6 mV, net depolarization: 3.9 ± 1.2 mV, n = 4, P = 0.125, Wilcoxon test, data not shown). The possible reason that we failed to observe significant effects of NT on LF cells might be due to the small sample size of LF cells obtained, because the percentage of LF neurons in the CeL was low. We therefore limited our recordings to RS cells and LTB cells without using the LF cells for the rest of the experiments. There were no significant differences for NT-elicited AP firing numbers (F(1,380) = 0.413, P = 0.521, two-way ANOVA) and subthreshold depolarization (P = 0.056, Mann-Whitney test) between RS neurons and LTB neurons. We pooled the data attained from both RS neurons and LTB neurons by the sex of the rats and found that sex had no significant effect on NT-induced AP firing number (male: 76.3 ± 16.9 APs/min, n = 10, female: 74.3 ± 25.7 APs/min, n = 12, F(1,400) = 0.064, P = 0.8) and subthreshold depolarization (male: 2.27 ± 0.59 mV, n = 16, female: 2.73 ± 0.74 mV, n = 13, P = 0.589, Mann-Whitney test).
Figure 1. Bath application of NT elicits AP firing or subthreshold depolarization in CeL neurons.
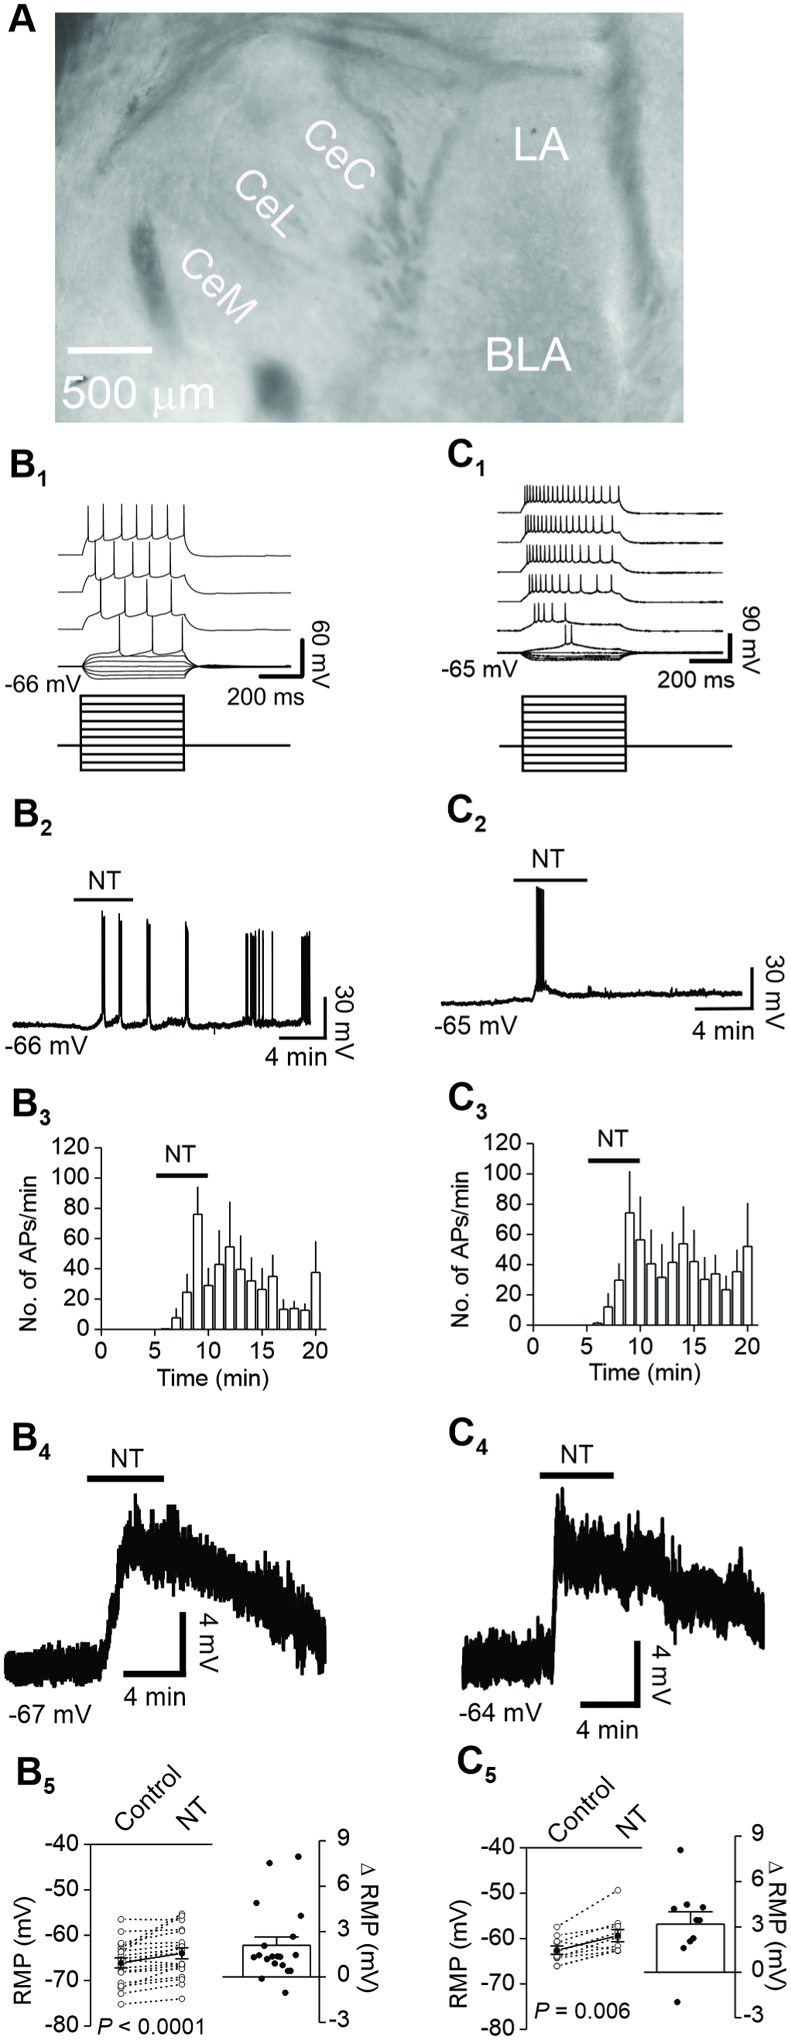
A, Microscopic photograph to show the location of CeL where electrophysiological recordings were conducted. LA: lateral nucleus; BLA: basolateral nucleus; CeC: capsular central amygdala; CeL: lateral central amygdala; CeM: medial central amygdala. B1-B5, bath application of NT (0.3 μM) elicited AP firing or subthreshold depolarization in regular spiking (RS) neurons. B1, voltage responses (upper) evoked by injection of negative or positive currents (lower). B2, bath application of NT induced AP firing recorded from the RMP from the same RS neuron. B3, summary time course of NT-elicited AP firing from 12 RS neurons. B4, bath application of NT elicited subthreshold depolarization from a RS neuron. B5, summary graph showing NT-elicited subthreshold depolarization (n = 19 RS neurons). Left: RMPs recorded from 19 RS neurons prior to and during the application of NT. Empty circles represent values from individual cells and the solid circles are their averages; Right: net depolarization by subtracting the membrane potentials during the application of NT from the resting membrane potentials in control condition. C1-C5, bath application of NT (0.3 μM) elicited AP firing or subthreshold depolarization in low-threshold bursting (LTB) neurons. C1, voltage responses (upper) evoked by injection of negative or positive currents (lower). C2, bath application of NT induced AP firing recorded from the RMP from the same LTB neuron. C3, summary time course of NT-elicited AP firing from 10 LTB neurons. C4, bath application of NT elicited subthreshold depolarization from a LTB neuron. C5, summary graph showing NT-elicited subthreshold depolarization (n = 10 LTB neurons). Left: RMPs recorded from 10 LTB neurons before and during the application of NT; empty circles represent values from individual cells and the solid circles are their averages; Right: net depolarization by subtracting the membrane potentials during the application of NT from the resting membrane potentials in control condition.
Because a large population of CeL neurons showed only subthreshold depolarization in response to NT, we next used a protocol composed of injecting a series of positive currents to evoke AP firing to further confirm the effects of NT on neuronal excitability. Bath application of NT significantly increased the number of APs evoked by injecting the positive currents in CeL neurons (n = 15, F(1,14) = 23.56, P = 0.0003, two-way repeated measures ANOVA followed by Sidak multiple comparison test, Fig. 2A1-A2), further confirming that NT augments the excitability of CeL neurons.
Figure 2. NT facilitates AP firing of CeL neurons via activation of NTS1 receptors.
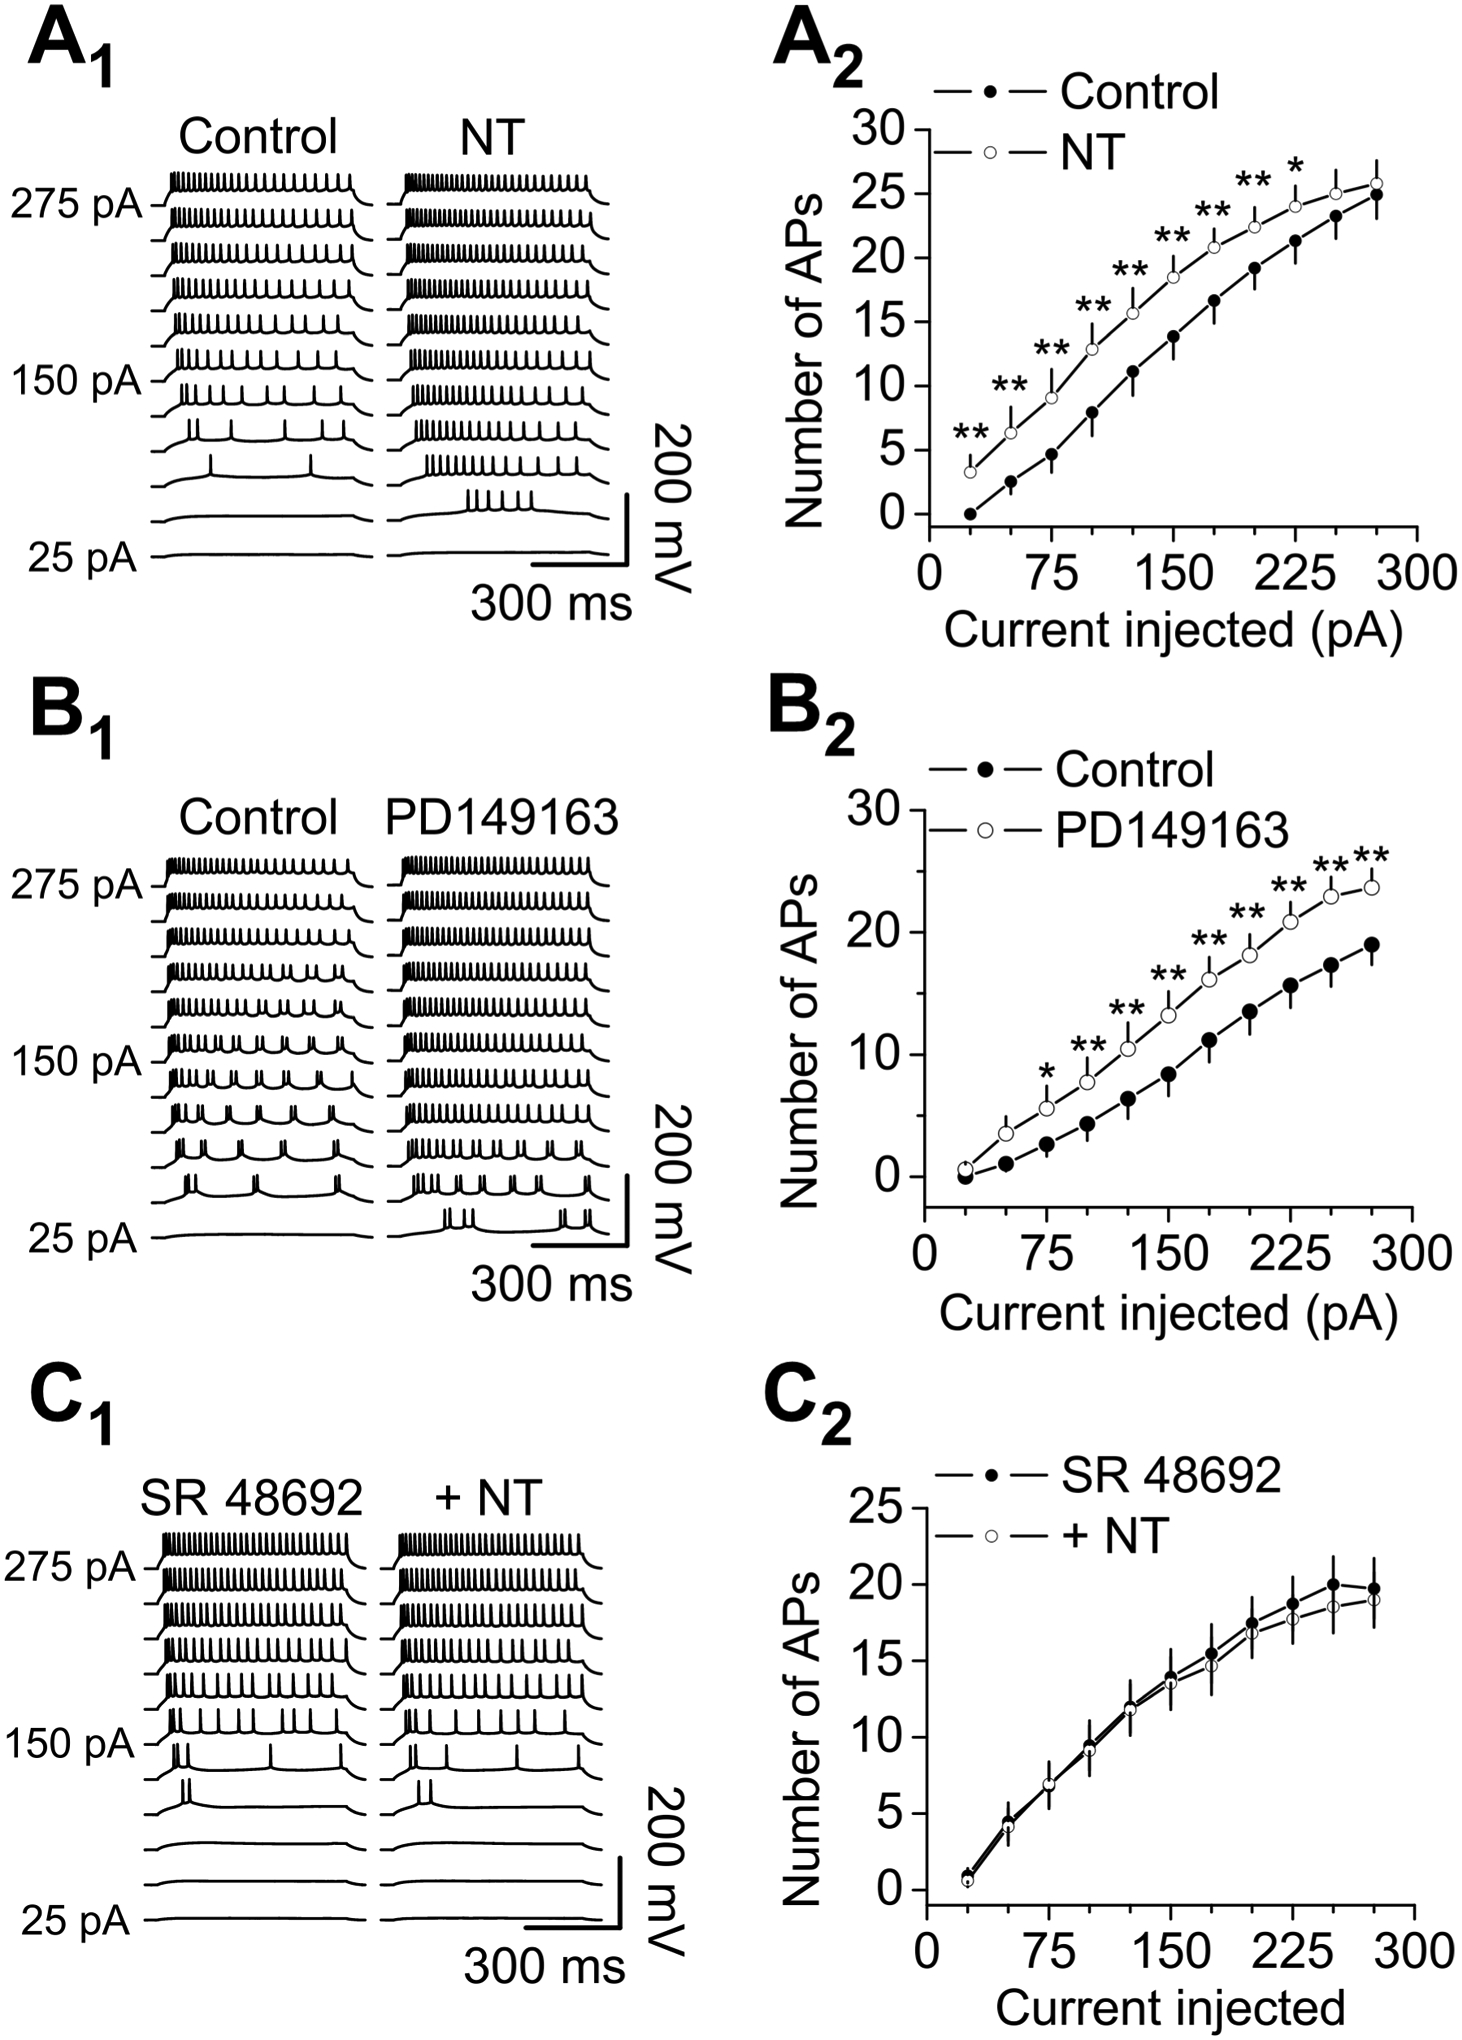
A1-A2, NT enhanced the number of APs evoked by injection of a series of positive currents from 25 Pa to 275 pA at an interval of 25 pA and a duration of 600 ms from CeL neurons. A1, AP traces elicited by injection of the positive currents before (left) and during (right) the application of NT from a CeL neuron. A2, Curve of current-AP number pooled from 15 CeL neurons. * P < 0.05, ** P < 0.01, two-way repeated measures ANOVA followed by Sidak multiple comparison test. B1-B2, application of the selective NTS1 agonist, PD149163 (0.3 μM), enhanced the number of APs evoked by the positive current injection protocol from CeL neurons. B1, AP traces elicited by injection of the positive currents before (left) and during (right) the application of PD149163 from a CeL neuron. B2, Curve of current-AP number pooled from 15 CeL neurons. * P < 0.05, ** P < 0.01, two-way repeated measures ANOVA followed by Sidak multiple comparison test. C1-C2, pretreatment of slices with and continuous bath application of the selective NTS1 antagonist, SR 48692 (1 μM), blocked NT-elicited augmentation of AP firing evoked by the positive current injection protocol from CeL neurons. C1, AP traces elicited by injection of the positive currents before (left) and during (right) the application of NT in the presence of SR 48692 from a CeL neuron. C2, Curve of current-AP number pooled from 15 CeL neurons. NT failed to augment AP firing numbers significantly before and during the application of NT in the presence of SR 48692 (two-way repeated measures ANOVA followed by Sidak multiple comparison test).
We further compared the properties of APs prior to and during the application of NT. We measured AP threshold, half-width, depolarization and repolarization velocities by selecting the first AP elicited by injection of 150 pA because NT-mediated facilitation of AP firing was usually among the largest at this current injection. NT failed to alter significantly AP threshold (Control: −30.8 ± 0.7 mV, NT: −31.3 ± 1.0 mV, n = 15, P = 0.273, Wilcoxon test) and half-width (Control: 0.43 ± 0.05 ms, NT: 0.44 ± 0.05 ms, n = 15, P = 0.277, Wilcoxon test), whereas NT significantly reduced the velocities of AP depolarization (Control: 77.8 ± 6.6 mV/ms, NT: 67.5 ± 6.9 mV/ms, n = 15, P = 0.004, Wilcoxon test) and repolarization (Control: −44.9 ± 3.7 mV/ms, NT: −37.5 ± 3.5 mV/ms, n = 15, P = 0.0006, Wilcoxon test).
3.2. NTS1, G proteins and PLCβ are required for NT-elicited augmentation of neuronal excitability in the CeL
Because NTS1 receptors are expressed in the CeA (Alexander and Leeman, 1998), we tested the roles of NTS1 receptors in NT-mediated increases in AP firing frequency. Application of the selective NTS1 agonist, PD149163 (0.3 μM), significantly increased the number of APs evoked by the positive current injection protocol (n = 15, F(1,14) = 36.76, P < 0.0001, two-way repeated measures ANOVA followed by Sidak multiple comparison test, Fig. 2B1-B2). Likewise, pretreatment of slices with and continuous bath application of the selective NTS1 antagonist, SR 48692 (1 μM), blocked NT-induced augmentation of AP firing number (n = 15, F(1,14) = 1.914, P = 0.188, two-way repeated measures ANOVA followed by Sidak multiple comparison test, Fig. 2C1-C2), further confirming the involvement of NTS1 receptors.
NTS1 receptors are coupled to a variety of G proteins including Gαq, Gαi, Gαo, Gα13 and Gαs (Besserer-Offroy et al., 2017; Muller et al., 2011; Olsen et al., 2020). We next tested the roles of G proteins in NT-elicited augmentation of neuronal excitability. Intracellular perfusion of the selective G protein inactivator, GDP-β-S (0.5 mM), blocked NT-evoked enhancement of AP numbers evoked by the positive current injection protocol in CeL neurons (n = 12, F(1,11) = 0.394, P = 0.543, two-way repeated measures ANOVA followed by Sidak multiple comparison test, Fig. 3A1-A2), demonstrating the requirement of G proteins. Because activation of NTS1 receptors increases the function of PLCβ (Besserer-Offroy et al., 2017), we tested the roles of PLCβ in NT-elicited excitation of CeL neurons. Pretreatment of slices with and continuous bath application of the selective PLC inhibitor, U73122 (5 μM), blocked NT-elicited increases in AP numbers (n = 16, F(1,15) = 0.00007, P = 0.993, two-way repeated measures ANOVA followed by Sidak multiple comparison test, Fig. 3B1-B2), whereas application of NT still facilitated AP firing numbers in slices pretreated with the inactive analog U73343 (5 μM) in the same fashion (n = 15, F(1,14) = 16.67, P = 0.001, two-way repeated measures ANOVA followed by Sidak multiple comparison test, Fig. 3C1-C2). These results indicate that PLCβ is required for NT-mediated increases in AP firing.
Figure 3. G proteins and PLCβ are required for NT-elicited augmentation of AP firing in CeL neurons.

A1-A2, Intracellular application of GDP-β-S (0.5 mM) blocked NT-elicited augmentation of AP firing numbers. A1, AP traces elicited by injection of the positive currents before (left) and during (right) the application of NT in a CeL neuron dialyzed with GDP-β-S via the recording pipette. A2, Curve of current-AP number pooled from 12 CeL neurons. NT failed to enhance AP firing numbers significantly in the presence of GDP-β-S (two-way repeated measures ANOVA followed by Sidak multiple comparison test). B1-B2, Pretreatment of slices with and continuous bath application of the selective PLCβ inhibitor, U73122 (5 μM), blocked NT-induced enhancement of AP firing. B1, AP traces elicited by injection of the positive currents before (left) and during (right) the application of NT in the presence of U73122 from a CeL neuron. B2, Curve of current-AP number pooled from 16 CeL neurons. NT failed to enhance AP firing numbers significantly in the presence of U73122 (two-way repeated measures ANOVA followed by Sidak multiple comparison test). C1-C2, Pretreatment of slices with and continuous bath application of the inactive analog, U73343 (5 μM), failed to alter NT-induced enhancement of AP firing. C1, AP traces elicited by injection of the positive currents before (left) and during (right) the application of NT in the presence of U73343 from a CeL neuron. C2, Curve of current-AP number pooled from 15 CeL neurons. * P < 0.05, ** P < 0.01, two-way repeated measures ANOVA followed by Sidak multiple comparison test.
3.3. Intracellular Ca2+ is not required for NT-elicited excitation of CeL neurons
We further tested the roles of intracellular Ca2+ release in NT-elicited augmentation of AP firing. Intracellular dialysis of an IP3 receptor blocker, heparin at 0.5 mg/ml, an effective concentration (Saleem et al., 2014), via the recording pipettes, did not block NT-mediated increases in AP firing numbers (n = 15, F(1,14) = 36.37, P < 0.0001, two-way repeated measures ANOVA followed by Sidak multiple comparison test, Fig. 4A1-A2), suggesting that Ca2+ release from the IP3-sensitive store is not required for NT-elicited excitation of CeL neurons. Furthermore, intracellular application of the endoplasmic reticulum Ca2+-ATPase inhibitor, thapsigargin (10 μM), via the recording pipettes did not block NT-induced increases in AP firing (n = 15, F(1,14) = 41.7, P < 0.0001, two-way repeated measures ANOVA followed by Sidak multiple comparison test, Fig. 4B1-B2), demonstrating that intracellular Ca2+ is not required for NT-mediated excitation of CeL neurons.
Figure 4. Intracellular Ca2+ release is unnecessary for NT-elicited augmentation of AP firing in CeL neurons.

A1-A2, Intracellular dialysis of the IP3 receptor blocker, heparin (0.5 mg/ml), did not alter significantly NT-mediated enhancement of AP firing. A1, AP traces elicited by injection of the positive currents before (left) and during (right) the application of NT in a CeL neuron perfused with heparin via the recording pipette. A2, Curve of current-AP number pooled from 15 CeL neurons. * P < 0.05, ** P < 0.01, two-way repeated measures ANOVA followed by Sidak multiple comparison test. B1-B2, Intracellular dialysis of thapsigargin (10 μM), failed to alter significantly NT-mediated augmentation of AP firing. B1, AP traces elicited by injection of the positive currents before (left) and during (right) the application of NT in a CeL neuron dialyzed with thapsigargin via the recording pipette. B2, Curve of current-AP number pooled from 15 CeL neurons. * P < 0.05, ** P < 0.01, two-way repeated measures ANOVA followed by Sidak multiple comparison test.
3.4. PKC is unnecessary for NT-induced excitation of CeL neurons
We further tested the roles of PKC in NT-elicited excitation of CeL neurons. Pretreatment of slices with and continuous bath application of the selective PKC inhibitor bisindolylmaleimide II (Bis II, 1 μM) failed to block NT-elicited augmentation of AP firing numbers (n = 14, F(1,13) = 53.52, P < 0.0001, two-way repeated measures ANOVA followed by Sidak multiple comparison test, Fig. 5A1-A2). Likewise, pretreatment of slices with and continuous bath application of another selective PKC inhibitor chelerythrine (10 μM) did not block NT-induced enhancement of AP firing numbers (n = 15, F(1,14) = 30.44, P < 0.0001, two-way repeated measures ANOVA followed by Sidak multiple comparison test, Fig. 5B1-B2). These results together suggest that PKC is not required for NT-mediated excitation of CeL neurons.
Figure 5. NT-elicited excitation of CeL neurons is independent of PKC activity, but mediated by degradation of PIP2.

A1-A2, Pretreatment of slices with and continuous bath application of the selective PKC inhibitor Bis II (1 μM) did not block NT-mediated enhancement of AP firing numbers. A1, AP traces elicited by injection of the positive currents before (left) and during (right) the application of NT in a CeL neuron treated with Bis II. A2, Curve of current-AP number pooled from 14 CeL neurons. * P < 0.05, ** P < 0.01, two-way repeated measures ANOVA followed by Sidak multiple comparison test. B1-B2, Pretreatment of slices with and continuous bath application of another selective PKC inhibitor chelerythrine (10 μM) failed to block NT-elicited augmentation of AP firing numbers. B1, AP traces evoked by injection of the positive currents before (left) and during (right) the application of NT in a CeL neuron treated with chelerythrine. B2, Curve of current-AP number pooled from 15 CeL neurons. ** P < 0.01, two-way repeated measures ANOVA followed by Sidak multiple comparison test. C1-C2, Intracellular application of diC8-PIP2 (20 μM) prevented NT-elicited augmentation of AP firing numbers. C1, AP traces evoked by injection of the positive currents before (left) and during (right) the application of NT in a CeL neuron intracellularly dialyzed with diC8-PIP2. C2, Curve of current-AP number pooled from 15 CeL neurons. NT failed to enhance AP firing numbers in CeL neurons dialyzed with diC8-PIP2 (two-way repeated measures ANOVA followed by Sidak multiple comparison test).
3.5. Depletion of PIP2 is involved in NT-mediated excitation of CeL neurons
PLCβ-mediated depletion of PIP2 has been demonstrated to be a mechanism underlying the modulation of numerous ion channels (Rodriguez-Menchaca et al., 2012; Suh and Hille, 2008). We further probed the roles of PIP2 depletion induced by activation of PLCβ in response to NTS1 receptor activation. Inclusion of the short-chain, water-soluble analog dioctanoyl (diC8)-PIP2 (20 μM) in the recording pipettes blocked NT-evoked augmentation of AP firing numbers (n =15, F(1,14) = 1.998, P = 0.179, Fig. 5C1-C2), suggesting that depletion of PIP2 is involved in NT-elicited excitation of CeL neurons.
3.6. NT increases the input resistance and membrane time constant of CeL neurons
We further used voltage clamp and recorded the holding currents at −60 mV in response to bath application of NT. Bath application of NT induced an inward holding current (−14.9 ± 3.1 pA, n = 14, P < 0.001, Fig. 6A1-A2). We measured the alteration of the input resistance (Rin) in response to NT application by injecting negative currents from 0 to −90 pA with 30 pA steps for a duration of 600 ms prior to and during the application of NT when the maximal effect of NT reached. We fit the I-V relationship with a linear function for each cell to obtain Rin, which equals the slope of the linear fitting (Fig. 6B1-B3). Application of NT significantly increased Rin (Control: 164 ± 9 MΩ, NT: 184 ± 11 MΩ, n = 16, P < 0.0001, Fig. 6B1-B3). NT also augmented the membrane time constant obtained by fitting a single exponential function to the voltage transient elicited by −60 pA current step (Control: 17.3 ± 1.3 ms, NT: 21.3 ± 1.9 ms, n = 16, P < 0.0001, Fig. 6C1-C3). These results together suggest that NT excites CeL neurons by reducing a membrane conductance.
Figure 6. Activation of NTS1 receptors elicits an inward current, increases input resistance and enhances membrane time constants.
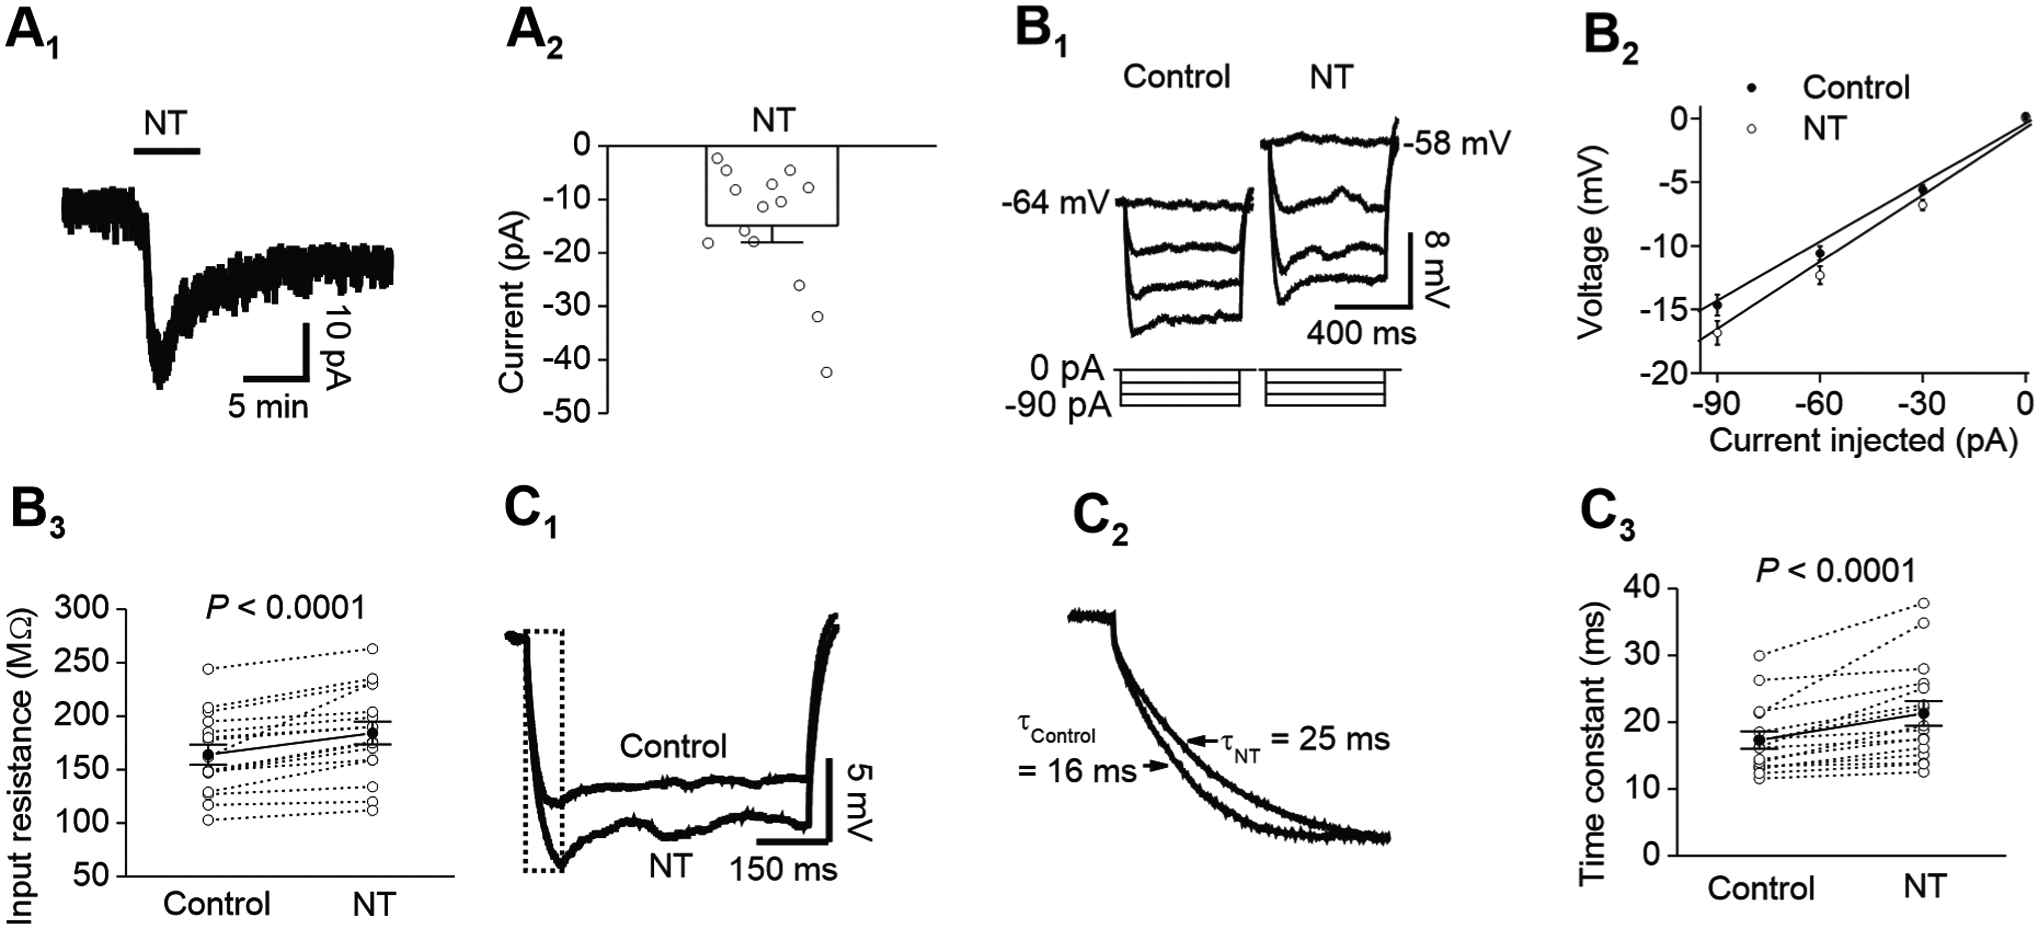
A1-A2, bath application of NT induced an inward current recorded at −60 mV from CeL neurons. A1, holding current recorded at −60 mV from a CeL neuron prior to, during and after the application of NT. A2, summary net currents induced by NT recorded at −60 mV from 14 CeL neurons. Open circles represented the values from individual cells and bar graph was the average. B1-B3, NT increased the input resistance of CeL neurons. B1, voltage responses evoked by injection of negative currents from 0 pA to −90 pA at an interval of 30 pA before (left) and during (right) the application of NT from a CeL neuron. B2, current voltage relationship averaged from 16 cells. Input resistance was obtained by linear fitting of the current-voltage relationship. B3, summary graph for input resistance before and during the application of NT (n = 16). C1-C3, NT augmented the time constant of CeL neurons. C1, voltage response evoked by injection of −60 pA prior to and during the application of NT. C2, expansion of the voltage transient shown in the box in C1 to demonstrate NT-induced increase in membrane time constants. C3, summary graph showing membrane time constants prior to and during the application of NT (n = 16).
3.7. NT excites CeL neurons by inhibition of a Kir channel
We further determined the ionic mechanisms whereby NTS1 activation depolarizes CeL neurons by measuring the current-voltage (I-V) relationship of the currents generated by NT. The extracellular solution was supplemented with TTX (0.5 μM) to block voltage-gated Na+ currents. Cells were held at −60 mV and stepped from −140 mV to −40 mV for 400 ms at a voltage interval of 10 mV every 10 s. Steady-state currents were measured within 5 ms prior to the end of the step voltage protocols. Under these circumstances, the I-V curve of the NT-elicited currents recorded from CeL neurons showed inward rectification with a reversal potential of − 82.3 ± 2.2 mV (n = 10, Fig. 7A1-A3), resembling that of the Kir channels. These results suggest that activation of NTS1 receptors excites CeL neurons by inhibiting a Kir channel.
Figure 7. NT excites CeL neurons via inhibition of Kir channels.
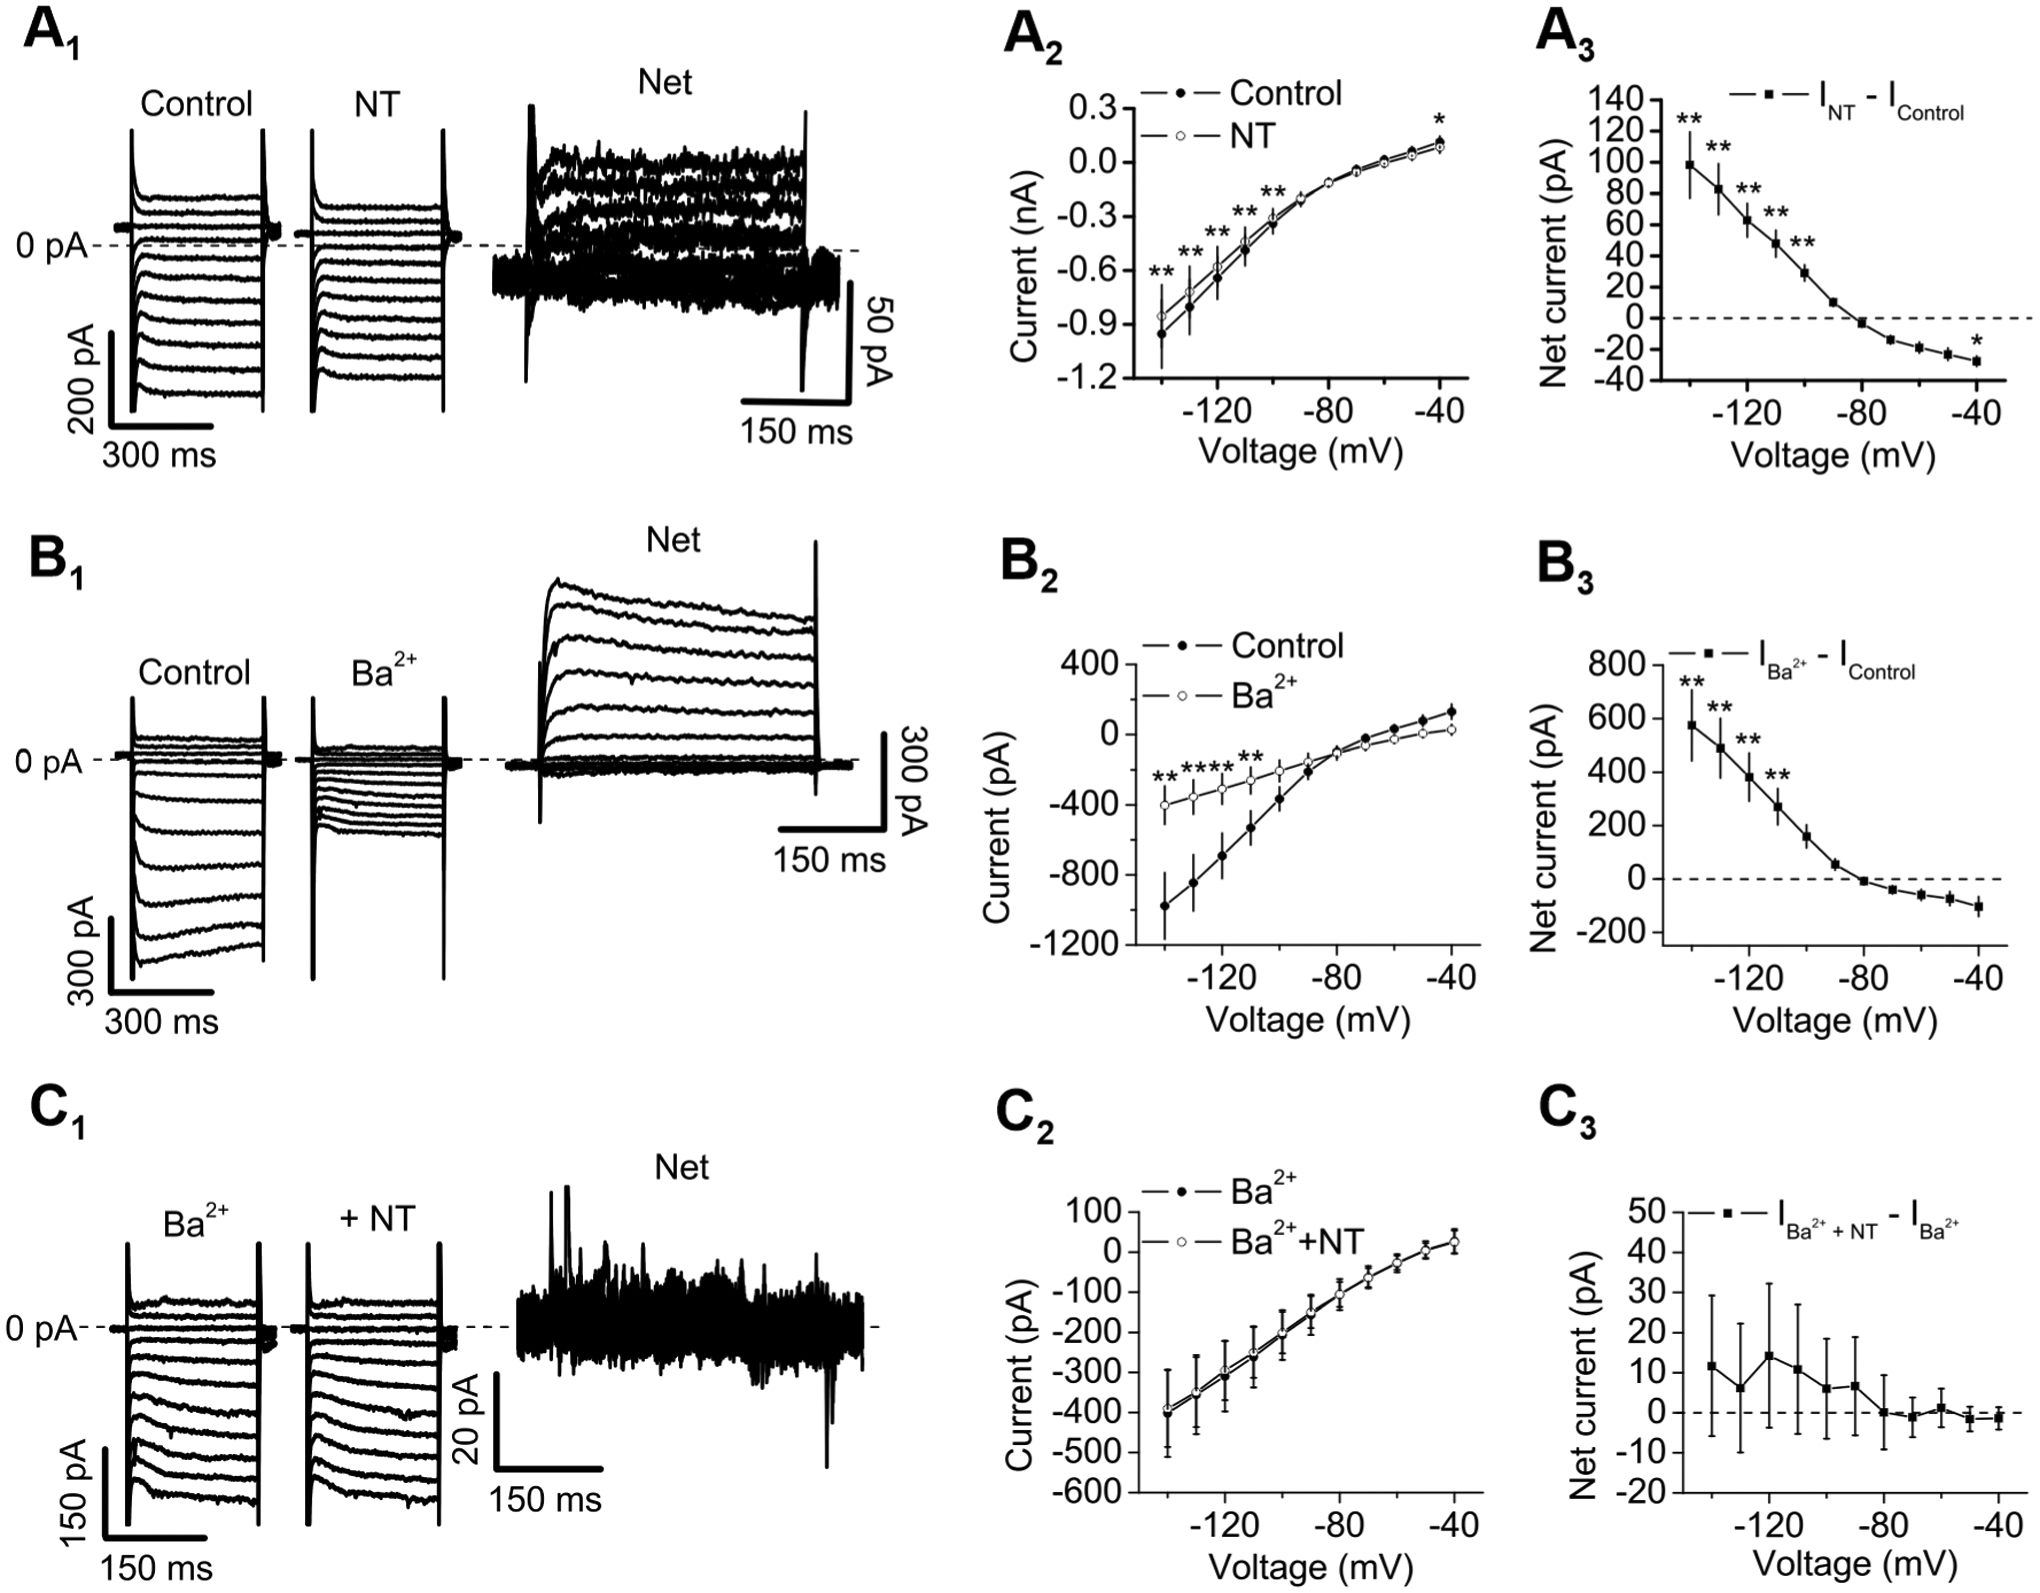
A1-A3, NT-elicited currents showed inward rectification. A1, Currents elicited by a voltage-step protocol before (left) and during (middle) the bath application of NT and the net current obtained by subtraction (right) from a CeL neuron. Cells were held at −60 mV and stepped from −140 mV to −40 mV for 400 ms at a voltage interval of 10 mV every 10 s. Steady-state currents were measured within 5 ms prior to the end of the step voltage protocols. Note the differences of the scale bars. The dash line was the zero-current level. A2, I-V curve averaged from 10 CeL neurons before and during the application of NT (two-way repeated measures ANOVA followed by Sidak multiple comparison test; Drug: F(1, 9) = 16.04, P = 0.0031; Voltage: F(10, 90) = 21.79, P < 0.0001; Drug × Voltage: F(10, 90) = 30.8, P < 0.0001; * P < 0.05, ** P < 0.01). A3, I-V curve of the net current obtained by subtracting the currents in control condition from those during the application of NT. Note that the net currents showed inward rectification, suggesting the involvement of Kir channels. B1-B3, Bath application of Ba2+ (300 μM) inhibited Kir channels. B1, Currents elicited by the voltage-step protocol before (left) and during (middle) bath application of NT and the net current obtained by subtraction (right) from a CeL neuron. B2, I-V curves averaged from 8 CeL neurons before and during the application of Ba2+ (two-way repeated measures ANOVA followed by Sidak multiple comparison test; Drug: F(1, 7) = 14.29, P = 0.0069; Voltage: F(10, 70) = 23.63, P < 0.0001; Drug × Voltage: F(10, 70) = 19.4, P < 0.0001; ** P < 0.0001). B3, I-V curve of the net current obtained by subtracting the currents in control condition from those during the application of Ba2+. C1-C3, Bath application of NT failed to induce currents further in the presence of Ba2+ (300 μM). C1, currents recorded from a CeL cell in response to the voltage-step protocol in the presence of Ba2+ alone (left) and Ba2+ plus NT (middle) and the net current obtained by subtraction (right). C2, I–V curves of the currents elicited by the voltage-step protocol in the presence of Ba2+ alone and Ba2+ together with NT from 8 CeL neurons (two-way repeated measures ANOVA followed by Sidak multiple comparison test; Drug: F(1, 7) = 0.212, P = 0.660; Voltage: F(10, 70) = 17.28, P < 0.0001; Drug × Voltage: F(10, 70) = 0.819, P = 0.612). C3, net currents obtained by subtracting the currents in the presence of Ba2+ alone from those recorded from the same cells in the presence of Ba2+ plus NT. There were no significant differences for the net currents at each voltage (two-way repeated measures ANOVA followed by Sidak multiple comparison test).
Because micromolar concentrations of Ba2+ (100–300 μM) have been shown to block Kir channels by at least 80% (Hu et al., 2017; Lacey et al., 1988; Li et al., 2019b), we included 300 μM Ba2+ in the extracellular solution to inhibit Kir channels. Bath application of 300 μM Ba2+ inhibited a current showing inward rectification (n = 8, Fig. 7B1-B3), suggesting that Ba2+ at this concentration inhibited Kir channels. In the presence of Ba2+, application of NT failed to evoke more currents (n = 8, Fig. 7C1-C3), further corroborating the involvement of Kir channels.
3.8. Both Kir2 and GIRK channels are involved in NT-elicited excitation of CeL neurons
We further characterized the subtypes of the Kir channels involved in NT-induced facilitation of neuronal excitability. There are seven Kir channel subfamilies that can be classified into four functional groups: (i) Kir2 subfamily including Kir2.1, Kir2.2, Kir2.3 and Kir2.4 form the classical Kir channels and are constitutively active; (ii) Kir3 subfamily comprising Kir3.1 (GIRK1), Kir3.2 (GIRK2), Kir3.3 (GIRK3) and Kir3.4 (GIRK4) encoded by the genes KCNJ3, KCNJ6, KCNJ9, and KCNJ5, respectively, constitute the G protein-gated GIRK channels; (iii) Kir6 subfamily encompassing Kir6.1 and Kir6.2 form the ATP-sensitive K+ (KATP) channels; and (iv) K+ transport channels include Kir1.1, Kir4.1, Kir4.2 and Kir7.1 (Hibino et al., 2010). KATP channels are unlikely to be involved because our recording solution in the pipettes contained 2 mM ATP which blocked KATP channels. We used ML 133, a specific blocker for Kir2 subfamily (Ford and Baccei, 2016; Huang et al., 2018; Kim et al., 2015; Sonkusare et al., 2016; Wang et al., 2011), to test the roles of the Kir2 subfamily in NT-elicited depression of Kir channels. Bath application of ML 133 (30 μM) by itself induced a significant inhibition of Kir currents from −110 to −140 mV (n = 12, F(1,11) = 14.37, P = 0.003, two-way repeated measures ANOVA followed by Sidak multiple comparison test, Fig. 8A1-A3), suggesting that the CeL neurons express tonically functional Kir2 channels. In the presence of ML 133, application of NT still significantly depressed Kir currents from −100 mV to −140 mV (n = 12, F(1,11) = 22.18, P = 0.0006, two-way repeated measures ANOVA followed by Sidak multiple comparison test, Fig. 8A4-A6). The NT-elicited depression of Kir currents in the presence of ML 133 was not significantly different from that induced by application of NT alone (F(1,220) = 2.089, P = 0.149, ordinary two-way ANOVA, Fig. 8A6). These results suggest that inhibition of Kir2 subfamily channels is insufficient to block NT-induced excitation of CeL neurons.
Figure 8. Both Kir2 and GIRK channels are involved in NT-elicited excitation of CeL neurons.

A1-A6, Bath application of the selective Kir2 channel blocker, ML 133 (30 μM), inhibited Kir currents and application of NT in the presence of ML 133 (30 μM) still significantly depressed Kir channel currents. A1, Currents elicited by the voltage-step protocol before (left) and during (middle) bath application of ML 133 and the net current obtained by subtraction (right) from a CeL neuron. Cells were held at −60 mV and stepped from −140 mV to −40 mV for 400 ms at a voltage interval of 10 mV every 10 s. Steady-state currents were measured within 5 ms prior to the end of the step voltage protocols. Note the differences of the scale bars. The dash line was the zero-current level. A2, I-V curve averaged from 12 CeL neurons before and during the application of NT (two-way repeated measures ANOVA followed by Sidak multiple comparison test; Drug: F(1, 11) = 14.37, P = 0.003; Voltage: F(10, 110) = 36.12, P < 0.0001; Drug × Voltage: F(10, 110) = 9.3, P < 0.0001; ** P < 0.01). A3, I-V curve of the net current obtained by subtracting the currents in control condition from those during the application of ML 133. Note that the net currents showed inward rectification, suggesting the involvement of Kir channels. A4, Currents elicited by the voltage-step protocol in the presence of ML 133 alone (left) and ML 133 plus NT (middle) and the net current obtained by subtraction (right) from a CeL neuron. A5, I-V curve averaged from 12 CeL neurons in the presence of ML 133 alone and during the application of both ML 133 and NT (two-way repeated measures ANOVA followed by Sidak multiple comparison test; Drug: F(1, 11) = 22.18, P = 0.0006; Voltage: F(10, 110) = 36.09, P < 0.0001; Drug × Voltage: F(10, 110) = 19.62, P < 0.0001; * P < 0.05, ** P < 0.01). A6, I-V curve of the net current obtained by subtracting the currents during the application of ML 133 plus NT from those in the presence of ML 133 alone. NT-induced net currents in control condition were co-plotted as a comparison. There was no significant difference for NT-elicited net currents in control condition and in the presence of ML 133. B1-B6, Bath application of the selective GIRK channel blocker, tertiapin-Q (TQ, 300 nM), inhibited Kir currents and application of NT in the presence of TQ still significantly depressed Kir channel currents. B1, Currents elicited by the voltage-step protocol before (left) and during (middle) bath application of TQ and the net current obtained by subtraction (right) from a CeL neuron. B2, I-V curve averaged from 11 CeL neurons prior to and during the application of TQ (two-way repeated measures ANOVA followed by Sidak multiple comparison test; Drug: F(1, 10) = 7.75, P = 0.019; Voltage: F(10, 100) = 73.69, P < 0.0001; Drug × Voltage: F(10, 100) = 12.06, P < 0.0001; ** P < 0.01). B3, I-V curve of the net current obtained by subtracting the currents in control condition from those during the application of TQ. Note that the net currents showed inward rectification, suggesting the expression of TQ-sensitive Kir currents in CeL neurons. B4, Currents elicited by the voltage-step protocol in the presence of TQ alone (left) and TQ plus NT (middle) and the net current obtained by subtraction (right) from a CeL neuron. B5, I-V curve averaged from 11 CeL neurons in the presence of TQ alone and during the application of both TQ and NT (two-way repeated measures ANOVA followed by Sidak multiple comparison test; Drug: F(1, 10) = 17.13, P = 0.0006; Voltage: F(10, 100) = 65.6, P < 0.0001; Drug × Voltage: F(10, 100) = 40.87, P < 0.0001; * P < 0.05, ** P < 0.01). B6, I-V curve of the net current obtained by subtracting the currents during the application of TQ plus NT from those in the presence of TQ alone. NT-induced net currents in control condition were co-plotted as a comparison. There was significant difference for NT-elicited net currents in control condition and in the presence of TQ only at −130 mV (* P = 0.023) and −140 mV (** P = 0.0006) (F(1,209) = 7.657, P = 0.006, ordinary two-way ANOVA followed by Sidak multiple comparison test). C1-C3, Bath application of both ML 133 (30 μM) and TQ (300 nM) inhibited Kir currents and application of NT in the presence of ML 133 and TQ depressed Kir channel currents only at −140 mV. C1, Currents elicited by the voltage-step protocol before (left) and during (middle) bath application of both ML 133 and TQ and the net current obtained by subtraction (right) from a CeL neuron. C2, I-V curve averaged from 14 CeL neurons in the presence of ML 133 and TQ and ML 133 and TQ plus NT (two-way repeated measures ANOVA followed by Sidak multiple comparison test; Drug: F(1, 13) = 14.52, P = 0.002; Voltage: F(10, 130) = 44.69, P < 0.0001; Drug × Voltage: F(10, 130) = 14.77, P < 0.0001; * P < 0.05, ** P < 0.01). C3, I-V curve of the net current obtained by subtracting the currents in control condition from those during the application of ML 133 plus TQ. C4, Currents elicited by the voltage-step protocol in the presence of ML 133 and TQ alone (left) and ML 133 and TQ plus NT (middle) and the net current obtained by subtraction (right) from a CeL neuron. C5, I-V curve averaged from 14 CeL neurons in the presence of ML 133 and TQ alone and during the application of both ML 133 and TQ plus NT (two-way repeated measures ANOVA followed by Sidak multiple comparison test; Drug: F(1, 13) = 2.318, P = 0.152; Voltage: F(10, 130) = 36.04, P < 0.0001; Drug × Voltage: F(10, 130) = 1.834, P = 0.061; ** P < 0.01). C6, I-V curve of the net current obtained by subtracting the currents during the application of ML 133 and TQ plus NT from those in the presence of ML 133 and TQ alone. NT-induced net currents in control condition were co-plotted as a comparison. There was significant difference for NT-elicited net currents in control condition and in the presence of ML 133 and TQ (F(1,242) = 56.64, P < 0.0001, ordinary two-way ANOVA). * P < 0.05, ** P < 0.01.
We further examined the roles of GIRK channels in NT-induced depression of Kir channels. TQ is a GIRK channel blocker (Jin et al., 1999; Jin and Lu, 1999). Bath application of TQ (300 nM) by itself significantly inhibited Kir channel currents from −110 mV to −140 mV (n = 11, F(1,10) = 7.75, P = 0.019, two-way repeated measures ANOVA followed by Sidak multiple comparison test, Fig. 8B1-B3), suggesting the tonically functional expression of GIRK channels in the CeL neurons. In the continuous presence of TQ, application of NT still significantly depressed the Kir currents (n = 11, F(1,10) = 17.13, P = 0.002, Fig. 8B4-B6). However, NT-mediated depression of Kir channel currents in the presence of TQ was significantly smaller than that observed in control condition at −130 mV and −140 mV (F(1,209) = 7.657, P = 0.006, two-way ordinary ANOVA followed by Sidak multiple comparison test; P = 0.023 at −130 mV, P = 0.0006 at −140 mV, Fig. 8B6), suggesting that a TQ-sensitive GIRK channel contributes to NT-induced excitation of CeL neurons.
Because the CeL neurons express both tonically functional Kir2 and GIRK channels, we then tested the hypothesis that activation of NTS1 receptors results in inhibition of both Kir2 and GIRK channels to excite CeL neurons by co-application of both ML133 and TQ. Co-application of both ML 133 (30 μM) and TQ (300 nM) by themselves significantly depressed Kir channel currents (n = 14, F(1,13) = 14.52, P = 0.002, Fig. 8C1-C3). In the presence of both ML 133 and TQ, application of NT depressed Kir channel currents only at −140 mV (n = 14, Drug: F(1,13) = 2.318, P = 0.152; Voltage: F(10,130) = 36.04, P < 0.0001; Drug × Voltage: F(10,130) = 1.834, P = 0.061, Fig. 8C4-C6). These results collectively indicate that the functions of both Kir2 and GIRK channels are involved in NTS1 receptor-mediated excitation of CeL neurons.
3.9. NT increases GABAergic transmission onto CeM neurons
Because CeL neurons make GABAergic synapses onto CeM neurons, we tested the effects of NT on sIPSCs recorded from CeM neurons. NT was puffed to the CeL from a glass pipette containing 1 μM NT connected to a picospritzer (Toohey company pressure system IIe). Under these circumstances, puffing NT to the CeL significantly increased sIPSC frequency (Control: 8.06 ± 1.28 Hz, NT: 11.67 ± 1.90 Hz, 148 ± 11% of control, n = 7, Fig. 9A1-A3) and amplitude (Control: −37.9 ± 5.0 pA, NT: −69.0 ± 14.3 pA, 174 ± 19% of control, n = 7, Fig. 9A4) recorded from the CeM neurons. When TTX (1 μM) was included in the extracellular solution to block AP firing, puffing NT in the CeL failed to alter mIPSC frequency (Control: 1.30 ± 0.39 Hz, NT: 1.21 ± 0.33 Hz, 96 ± 8% of control, n = 7, P = 0.47, Fig. 9B1-B3) and amplitude (Control: 53.4 ± 6.8 pA, NT: 49.5 ± 7.5 pA, 91 ± 4% of control, n = 7, P = 0.16, Fig. 9B4). These results together demonstrate that activation of NTS1 receptors in the CeL exerted increased GABAergic inhibition onto CeM neurons.
Figure 9. NTS1 receptor-mediated excitation of CeL neurons augments GABAergic transmission onto CeM neurons.

A1-A4, Local application of NT to CeL increased the frequency and amplitude of sIPSCs recorded from CeM neurons. A1, Traces of sIPSCs recorded from a CeM neuron prior to and during puffing NT to CeL. Note that application of picrotoxin (100 μM) at the end of experiment blocked sIPSC events, confirming they were GABAergic currents in origin. A2, Time course of sIPSC frequency recorded from 7 CeM neurons in response to puffing of NT to CeL. A3, Summarized sIPSC frequency recorded from 7 CeM neurons prior to and during puffing of NT to CeL. A4, Summarized sIPSC amplitude recorded from 7 CeM neurons prior to and during puffing of NT to CeL. B1-B4, Local puffing of NT to CeL failed to alter either the frequency or the amplitude of mIPSCs recorded from the CeM neurons in the presence of TTX. B1, Traces of mIPSCs recorded from a CeM neuron in response to puffing of NT to the CeL. B2, Time course of mIPSC frequency recorded from 7 CeM neurons in response to puffing of NT to CeL. B3, Summarized mIPSC frequency recorded from 7 CeM neurons in response to puffing of NT to CeL. B4, Summarized mIPSC amplitude recorded from 7 CeM neurons in response to puffing of NT to CeL.
4. Discussion
Our results demonstrate that activation of NTS1 receptors facilitates the excitability of CeL neurons via activation of PLCβ and PLCβ-mediated depletion of PIP2, whereas intracellular Ca2+ release and PKC are not required for NTS1 receptor-mediated excitation of CeL neurons. Activation of NTS1 receptors excites CeL neurons by depressing Kir channels including both Kir2 and GIRK channels. Application of NT to the CeL region facilitates GABAergic transmission onto the CeM neurons, suggesting that activation of NTS1 receptors in the CeL participates in network activity in the amygdala.
With extracellular recordings, Lu et al. found that 60% of the CeA neurons showed excitatory response and 9% of the CeA neurons displayed inhibitory reaction in response to NT (Lu et al., 1996). However, this study failed to specify the subnuclei of the CeA where the recordings were conducted. Furthermore, the ionic and signaling mechanisms underlying NT-elicited excitation or inhibition in the CeA have not been determined. In the current study, we limited our recordings to the CeL and observed the excitatory effect of NT in the CeL. Because CeL exerts GABAergic inhibition on CeM neurons and collateral inhibition on other CeL neurons as well and our results showed that puffing of NT to the CeL increased sIPSCs recorded from CeM neurons, one potential explanation for the inhibitory effect of NT observed with the extracellular recordings could be due to NT-mediated GABAergic inhibition in the CeM. NT has been shown to increase neuronal excitability by distinct ionic mechanisms depending on neuronal types. Activation of NT receptors excites neurons by at least two ionic mechanisms: activation of cation channels (Chien et al., 1996; Farkas et al., 1994; Wu et al., 1995) or inhibition of K+ channels (Xiao et al., 2014), although depression of Kir channels (Wang and Wu, 1996) and activation of a cationic conductance (Wu et al., 1995) are both involved in NT-mediated excitation of rat substantia nigra dopaminergic neurons. Our results showed that activation of NTS1 receptors excites CeL neurons by depressing Kir channels based on the following lines of evidence. First, bath application of NT increases the input resistance and membrane time constants of CeL neurons suggesting that activation of NTS1 receptors results in a reduction of membrane conductance. Second, the reversal potential of NT-sensitive currents is close to the K+ reversal potential, further supporting the involvement of K+ channels. Third, the I-V curve of the NT-sensitive currents is inwardly rectified. Fourth, the NT-elicited currents are sensitive to micromolar concentration of Ba2+.
Kir channels are divided into four functional groups including the Kir2, Kir3 (GIRK channels) and Kir6 (KATP channels) subfamily and the K+ transport channels (Hibino et al., 2010). KATP channels are unlikely to be responsible for NT-induced excitation of CeL neurons because the intracellular solution in the recording pipettes contained 2 mM ATP which could have inhibited KATP channels. ML 133 is a specific blocker for Kir2 subfamily (Ford and Baccei, 2016; Huang et al., 2018; Kim et al., 2015; Sonkusare et al., 2016; Wang et al., 2011). Application of ML 133 at a saturating concentration (30 μM) depressed Kir currents suggesting that the CeL neurons express tonically functional Kir2 channels. However, our result that NT-elicited depression of Kir currents was not significantly altered in the presence of ML 133 suggests that inhibition of Kir2 channels alone is not sufficient to block NT-elicited excitation of CeL neurons. TQ is a GIRK channel blocker (Jin et al., 1999; Jin and Lu, 1999). Our results showed that application of TQ depressed basal Kir channel currents suggesting that there is a tonic activity of GIRK channels. Following application of NT in the presence of TQ still significantly depressed Kir channel currents, although NT-induced depression of Kir currents at −130 mV and −140 mV was significantly smaller, compared with that in control condition. These results suggest that blocking GIRK channels is partially responsible for NT-elicited excitation of CeL neurons. Our results that bath application of either ML 133 or TQ resulted in a depression of Kir channel currents suggest that CeL neurons express functionally tonic Kir2 and GIRK channels. We therefore tested the hypothesis that both Kir2 and GIRK channels are involved in NT-elicited excitation of CeL neurons. In support of this hypothesis, co-application of ML 133 and TQ to block both Kir2 and GIRK channels dramatically inhibited NT-elicited depression of Kir channel currents.
Our results have shown that both G proteins and PLCβ are necessary for NTS1-elicited excitation of CeL neurons by depressing Kir channel currents. Consistent with our results, PLCβ activated by Gq/11-coupled receptors leads to depression of Kir channels (Cho et al., 2001; Hatcher-Solis et al., 2014; Karschin, 1999; Keselman et al., 2007; Lei et al., 2003; Meyer et al., 2001; Niemeyer et al., 2019). Activation of PLCβ breaks PIP2 to generate IP3 to increase intracellular Ca2+ release and diacylglycerol to activate PKC. Our results do not support a role for intracellular Ca2+ released from the IP3-sensitive store and PKC in NT-elicited excitation of CeL neurons. Consistent with our results, intracellular Ca2+ is generally not involved in modulation of Kir channels (Hibino et al., 2010). However, whether PKC is involved in the inhibition of Kir channels mediated by Gαq/11-coupled receptors is controversial. PKC has been shown to phosphorylate and depress Kir channels (Adney et al., 2015; Mao et al., 2004; Niemeyer et al., 2019; Stevens et al., 1999) and is involved in NT-elicited inhibition of Kir channels in rat substantia nigra dopaminergic neurons (Wu and Wang, 1995). There is also evidence demonstrating that the function of PKC is not required for the inhibition of Kir channels induced by Gαq/11-coupled receptors (Lei et al., 2003; Mark and Herlitze, 2000). Consistent with the later scenario, our results showed that activation of NTS1 receptors excites CeL neurons in a PKC-independent manner.
We tested the roles of PIP2 depletion in NT-mediated excitation of CeL neurons on the basis that PIP2 has been shown to regulate the functions of a variety of ion channels (Rodriguez-Menchaca et al., 2012; Suh and Hille, 2008). Intracellular dialysis of diC8-PIP2 prevented NT-elicited excitation. Because our results indicate that NTS1 activation facilitates the excitability of CeL neurons via depression of Kir channels, these results also suggest that NTS1 activation in CeL neurons depresses Kir channels via PIP2 depletion. In line with our results, tremendous evidence demonstrates that PLCβ-mediated PIP2 depletion is responsible for Gαq/11 receptor-elicited depression of Kir channels (Cho et al., 2005; Cho et al., 2001; Keselman et al., 2007; Lei et al., 2003; Mark and Herlitze, 2000; Meyer et al., 2001; Whorton and MacKinnon, 2011). The next question is how depletion of PIP2 results in depression of Kir channels. The direct interaction between the negative phosphate head-groups of PIP2 and positively charged residues in N- and C- termini of Kir channels is essential for activation of the channels (Suh and Hille, 2008; Xie et al., 2007). The association of PIP2 with Kir channels enables the intracellular channel-gating regulators such as Gβγ and Na+ ions to maintain the channel-open state (Huang et al., 1998; Li et al., 2019a; Niu et al., 2020; Wang et al., 2014), whereas activation of PLCβ increases the hydrolysis of PIP2 endowing the channel-close state (Hatcher-Solis et al., 2014; Sui et al., 1998).
Intracerebroventricular administration of NT or NTS1 agonists produce anxiolytic-like effects as measured by the rat ultrasonic vocalization model (Prus et al., 2014; Steele et al., 2017). Administration of the NTS1 agonist PD149163 blocks fear-potentiated startle (Shilling and Feifel, 2008). Microinjection of NT into the CeA of rats produces positively reinforcing effects (Laszlo et al., 2010) and facilitates passive avoidance learning (Laszlo et al., 2012). However, the underlying cellular and molecular mechanisms have not been determined except that NT has been shown to excite CeA neurons by extracellular recordings. The CeL, which is composed of several classes of GABAergic neurons (Cassell et al., 1999; Cassell and Gray, 1989; Ehrlich et al., 2009; Haubensak et al., 2010), gates fear expression by tonically inhibiting the CeM (Ciocchi et al., 2010), the major output of amygdala (LeDoux et al., 1988). Pharmacological inactivation of CeA (Goosens and Maren, 2003; Wilensky et al., 2006) or specific inactivation of the CeL (Ciocchi et al., 2010) during conditioning blocks the formation of fear memory, whereas fear conditioning induces changes in CeL neuronal activity such that a population of cells (CeLon) becomes excited, whereas another (CeLoff) is inhibited in response to the conditioned stimulus (Ciocchi et al., 2010; Duvarci et al., 2011; Haubensak et al., 2010). Consistent with this scenario, our results showed that NT-elicited excitation of CeL neurons exerts GABAergic inhibition on CeM neurons, which may explain the anxiolytic-like effects induced by NT or NTS1 agonists (Prus et al., 2014; Steele et al., 2017). Our results may therefore provide a cellular and molecular mechanism to understand the roles of NT in modulation of anxiety.
5. Conclusion
Whereas the CeA receives neurotensinergic innervations and expresses NT receptors and NT has been shown to excite CeA neurons by extracellular recordings, the underlying cellular and molecular mechanisms have not been determined. We demonstrate that activation of NTS1 receptors excites CeL neurons via depression of Kir channels. NTS1 receptor-elicited excitation of CeL neurons requires the functions of PLCβ and PIP2 depletion but is independent of intracellular Ca2+ release and PKC activity. Both the Kir2 subfamily channels and GIRK channels are involved in NT-elicited excitation of CeL neurons. Our results may provide one of the cellular and molecular mechanisms to explain the physiological functions of NT in vivo.
Highlights.
Activation of NTS1 neurotensin receptors excites central lateral amygdala (CeL) neurons
NTS1 receptor-induced excitation is mediated by depression of inwardly rectifying K+ (Kir) channels
Inhibitions of both Kir2 and GIRK channels are required for NTS1-elicited excitation of CeL neurons
PLCβ and PIP2 depletion are involved in NTS1-induced excitation of CeL neurons
PKC and intracellular Ca2+ release are unnecessary for NTS1-elicited excitation of CeL neurons
Acknowledgments
This work was supported by the National Institute Of General Medical Sciences (NIGMS) and National Institute Of Mental Health (NIMH) grant R01MH118258 to S.L.
Footnotes
Publisher's Disclaimer: This is a PDF file of an unedited manuscript that has been accepted for publication. As a service to our customers we are providing this early version of the manuscript. The manuscript will undergo copyediting, typesetting, and review of the resulting proof before it is published in its final form. Please note that during the production process errors may be discovered which could affect the content, and all legal disclaimers that apply to the journal pertain.
Declaration of competing interest:
None.
References
- Adney SK, Ha J, Meng XY, Kawano T, Logothetis DE, 2015. A Critical Gating Switch at a Modulatory Site in Neuronal Kir3 Channels. J Neurosci 35, 14397–14405. [DOI] [PMC free article] [PubMed] [Google Scholar]
- Alexander MJ, Leeman SE, 1998. Widespread expression in adult rat forebrain of mRNA encoding high-affinity neurotensin receptor. J Comp Neurol 402, 475–500. [PubMed] [Google Scholar]
- Allen GV, Cechetto DF, 1995. Neurotensin in the lateral hypothalamic area: origin and function. Neuroscience 69, 533–544. [DOI] [PubMed] [Google Scholar]
- Amano T, Amir A, Goswami S, Pare D, 2012. Morphology, PKCdelta expression, and synaptic responsiveness of different types of rat central lateral amygdala neurons. J Neurophysiol 108, 3196–3205. [DOI] [PMC free article] [PubMed] [Google Scholar]
- Bayer VE, Towle AC, Pickel VM, 1991. Vesicular and cytoplasmic localization of neurotensin-like immunoreactivity (NTLI) in neurons postsynaptic to terminals containing NTLI and/or tyrosine hydroxylase in the rat central nucleus of the amygdala. J Neurosci Res 30, 398–413. [DOI] [PubMed] [Google Scholar]
- Besserer-Offroy E, Brouillette RL, Lavenus S, Froehlich U, Brumwell A, Murza A, Longpre JM, Marsault E, Grandbois M, Sarret P, Leduc R, 2017. The signaling signature of the neurotensin type 1 receptor with endogenous ligands. Eur J Pharmacol 805, 1–13. [DOI] [PubMed] [Google Scholar]
- Bissette G, Nemeroff CB, Loosen PT, Prange AJ Jr., Lipton MA, 1976. Hypothermia and intolerance to cold induced by intracisternal administration of the hypothalamic peptide neurotensin. Nature 262, 607–609. [DOI] [PubMed] [Google Scholar]
- Block CH, Hoffman G, Kapp BS, 1989. Peptide-containing pathways from the parabrachial complex to the central nucleus of the amygdala. Peptides 10, 465–471. [DOI] [PubMed] [Google Scholar]
- Boules M, Li Z, Smith K, Fredrickson P, Richelson E, 2013. Diverse roles of neurotensin agonists in the central nervous system. Front Endocrinol (Lausanne) 4, 36. [DOI] [PMC free article] [PubMed] [Google Scholar]
- Boyle CA, Hu B, Quaintance KL, Lei S, 2021a. Involvement of TRPC5 channels, inwardly rectifying K(+) channels, PLCbeta and PIP2 in vasopressin-mediated excitation of medial central amygdala neurons. J Physiol 599, 3101–3119. [DOI] [PMC free article] [PubMed] [Google Scholar]
- Boyle CA, Hu B, Quaintance KL, Lei S, 2021b. Involvement of TRPC5 channels, inwardly rectifying K(+) channels, PLCbeta and PIP2 in vasopressin-mediated excitation of medial central amygdala neurons. J Physiol. [DOI] [PMC free article] [PubMed] [Google Scholar]
- Cassell MD, Freedman LJ, Shi C, 1999. The intrinsic organization of the central extended amygdala. Ann N Y Acad Sci 877, 217–241. [DOI] [PubMed] [Google Scholar]
- Cassell MD, Gray TS, 1989. Morphology of peptide-immunoreactive neurons in the rat central nucleus of the amygdala. J Comp Neurol 281, 320–333. [DOI] [PubMed] [Google Scholar]
- Chien PY, Farkas RH, Nakajima S, Nakajima Y, 1996. Single-channel properties of the nonselective cation conductance induced by neurotensin in dopaminergic neurons. Proc Natl Acad Sci U S A 93, 14917–14921. [DOI] [PMC free article] [PubMed] [Google Scholar]
- Cho H, Lee D, Lee SH, Ho WK, 2005. Receptor-induced depletion of phosphatidylinositol 4,5-bisphosphate inhibits inwardly rectifying K+ channels in a receptor-specific manner. Proc Natl Acad Sci U S A 102, 4643–4648. [DOI] [PMC free article] [PubMed] [Google Scholar]
- Cho H, Nam GB, Lee SH, Earm YE, Ho WK, 2001. Phosphatidylinositol 4,5-bisphosphate is acting as a signal molecule in alpha(1)-adrenergic pathway via the modulation of acetylcholine-activated K(+) channels in mouse atrial myocytes. J Biol Chem 276, 159–164. [DOI] [PubMed] [Google Scholar]
- Ciocchi S, Herry C, Grenier F, Wolff SB, Letzkus JJ, Vlachos I, Ehrlich I, Sprengel R, Deisseroth K, Stadler MB, Muller C, Luthi A, 2010. Encoding of conditioned fear in central amygdala inhibitory circuits. Nature 468, 277–282. [DOI] [PubMed] [Google Scholar]
- Clineschmidt BV, McGuffin JC, Bunting PB, 1979. Neurotensin: antinocisponsive action in rodents. Eur J Pharmacol 54, 129–139. [DOI] [PubMed] [Google Scholar]
- Dejean C, Courtin J, Rozeske RR, Bonnet MC, Dousset V, Michelet T, Herry C, 2015. Neuronal Circuits for Fear Expression and Recovery: Recent Advances and Potential Therapeutic Strategies. Biol Psychiatry 78, 298–306. [DOI] [PubMed] [Google Scholar]
- Dumont EC, Martina M, Samson RD, Drolet G, Pare D, 2002. Physiological properties of central amygdala neurons: species differences. Eur J Neurosci 15, 545–552. [DOI] [PubMed] [Google Scholar]
- Duvarci S, Pare D, 2014. Amygdala microcircuits controlling learned fear. Neuron 82, 966–980. [DOI] [PMC free article] [PubMed] [Google Scholar]
- Duvarci S, Popa D, Pare D, 2011. Central amygdala activity during fear conditioning. J Neurosci 31, 289–294. [DOI] [PMC free article] [PubMed] [Google Scholar]
- Ehrlich I, Humeau Y, Grenier F, Ciocchi S, Herry C, Luthi A, 2009. Amygdala inhibitory circuits and the control of fear memory. Neuron 62, 757–771. [DOI] [PubMed] [Google Scholar]
- Farkas RH, Nakajima S, Nakajima Y, 1994. Neurotensin excites basal forebrain cholinergic neurons: ionic and signal-transduction mechanisms. Proc Natl Acad Sci U S A 91, 2853–2857. [DOI] [PMC free article] [PubMed] [Google Scholar]
- Ford NC, Baccei ML, 2016. Inward-rectifying K(+) (Kir2) leak conductance dampens the excitability of lamina I projection neurons in the neonatal rat. Neuroscience 339, 502–510. [DOI] [PMC free article] [PubMed] [Google Scholar]
- Gilpin NW, Herman MA, Roberto M, 2015. The central amygdala as an integrative hub for anxiety and alcohol use disorders. Biol Psychiatry 77, 859–869. [DOI] [PMC free article] [PubMed] [Google Scholar]
- Gonzales C, Chesselet MF, 1990. Amygdalonigral pathway: an anterograde study in the rat with Phaseolus vulgaris leucoagglutinin (PHA-L). J Comp Neurol 297, 182–200. [DOI] [PubMed] [Google Scholar]
- Goosens KA, Maren S, 2003. Pretraining NMDA receptor blockade in the basolateral complex, but not the central nucleus, of the amygdala prevents savings of conditional fear. Behav Neurosci 117, 738–750. [DOI] [PubMed] [Google Scholar]
- Hatcher-Solis C, Fribourg M, Spyridaki K, Younkin J, Ellaithy A, Xiang G, Liapakis G, Gonzalez Maeso J, Zhang H, Cui M, Logothetis DE, 2014. G protein-coupled receptor signaling to Kir channels in Xenopus oocytes. Curr Pharm Biotechnol 15, 987–995. [DOI] [PMC free article] [PubMed] [Google Scholar]
- Haubensak W, Kunwar PS, Cai H, Ciocchi S, Wall NR, Ponnusamy R, Biag J, Dong HW, Deisseroth K, Callaway EM, Fanselow MS, Luthi A, Anderson DJ, 2010. Genetic dissection of an amygdala microcircuit that gates conditioned fear. Nature 468, 270–276. [DOI] [PMC free article] [PubMed] [Google Scholar]
- Hibino H, Inanobe A, Furutani K, Murakami S, Findlay I, Kurachi Y, 2010. Inwardly rectifying potassium channels: their structure, function, and physiological roles. Physiol Rev 90, 291–366. [DOI] [PubMed] [Google Scholar]
- Honkaniemi J, Pelto-Huikko M, Isola J, Rechardt L, 1990. Simultaneous localization of calcitonin gene-related peptide and neurotensin in rat central amygdaloid nucleus. Neurosci Lett 113, 1–6. [DOI] [PubMed] [Google Scholar]
- Hopkins DA, Holstege G, 1978. Amygdaloid projections to the mesencephalon, pons and medulla oblongata in the cat. Exp Brain Res 32, 529–547. [DOI] [PubMed] [Google Scholar]
- Hu B, Boyle CA, Lei S, 2020. Oxytocin receptors excite lateral nucleus of central amygdala by phospholipase Cbeta- and protein kinase C-dependent depression of inwardly rectifying K(+) channels. J Physiol 598, 3501–3520. [DOI] [PMC free article] [PubMed] [Google Scholar]
- Hu B, Cilz NI, Lei S, 2017. Somatostatin depresses the excitability of subicular bursting cells: Roles of inward rectifier K(+) channels, KCNQ channels and Epac. Hippocampus 27, 971–984. [DOI] [PMC free article] [PubMed] [Google Scholar]
- Huang CL, Feng S, Hilgemann DW, 1998. Direct activation of inward rectifier potassium channels by PIP2 and its stabilization by Gbetagamma. Nature 391, 803–806. [DOI] [PubMed] [Google Scholar]
- Huang X, Lee SH, Lu H, Sanders KM, Koh SD, 2018. Molecular and functional characterization of inwardly rectifying K(+) currents in murine proximal colon. J Physiol 596, 379–391. [DOI] [PMC free article] [PubMed] [Google Scholar]
- Inagaki S, Yamano M, Shiosaka S, Takagi H, Tohyama M, 1983. Distribution and origins of neurotensin-containing fibers in the nucleus ventromedialis hypothalami of the rat: an experimental immunohistochemical study. Brain Res 273, 229–235. [DOI] [PubMed] [Google Scholar]
- Janak PH, Tye KM, 2015. From circuits to behaviour in the amygdala. Nature 517, 284–292. [DOI] [PMC free article] [PubMed] [Google Scholar]
- Jin W, Klem AM, Lewis JH, Lu Z, 1999. Mechanisms of inward-rectifier K+ channel inhibition by tertiapin-Q. Biochemistry 38, 14294–14301. [DOI] [PubMed] [Google Scholar]
- Jin W, Lu Z, 1999. Synthesis of a stable form of tertiapin: a high-affinity inhibitor for inward-rectifier K+ channels. Biochemistry 38, 14286–14293. [DOI] [PubMed] [Google Scholar]
- Karschin A, 1999. G Protein Regulation of Inwardly Rectifying K(+) Channels. News Physiol Sci 14, 215–220. [DOI] [PubMed] [Google Scholar]
- Keselman I, Fribourg M, Felsenfeld DP, Logothetis DE, 2007. Mechanism of PLC-mediated Kir3 current inhibition. Channels (Austin) 1, 113–123. [DOI] [PubMed] [Google Scholar]
- Kim J, Zhang X, Muralidhar S, LeBlanc SA, Tonegawa S, 2017. Basolateral to Central Amygdala Neural Circuits for Appetitive Behaviors. Neuron 93, 1464–1479 e1465. [DOI] [PMC free article] [PubMed] [Google Scholar]
- Kim KS, Jang JH, Lin H, Choi SW, Kim HR, Shin DH, Nam JH, Zhang YH, Kim SJ, 2015. Rise and Fall of Kir2.2 Current by TLR4 Signaling in Human Monocytes: PKC-Dependent Trafficking and PI3K-Mediated PIP2 Decrease. J Immunol 195, 3345–3354. [DOI] [PubMed] [Google Scholar]
- Kitabgi P, De Nadai F, Labbe-Jullie C, Dubuc I, Nouel D, Costentin J, Masuo Y, Rostene W, Woulfe J, Lafortune L, et al. , 1992. Functional and pharmacological aspects of central neuropeptidergic transmission mediated by neurotensin and neuromedin n. Clin Neuropharmacol 15Suppl 1 Pt A, 313A–314A. [DOI] [PubMed] [Google Scholar]
- Lacey MG, Mercuri NB, North RA, 1988. On the potassium conductance increase activated by GABAB and dopamine D2 receptors in rat substantia nigra neurones. J Physiol 401, 437–453. [DOI] [PMC free article] [PubMed] [Google Scholar]
- Lantos TA, Palkovits M, Rostene W, Berod A, 1996. Neurotensin receptors in the human amygdaloid complex. Topographical and quantitative autoradiographic study. J Chem Neuroanat 11, 209–217. [DOI] [PubMed] [Google Scholar]
- Laszlo K, Toth K, Kertes E, Peczely L, Lenard L, 2010. The role of neurotensin in positive reinforcement in the rat central nucleus of amygdala. Behav Brain Res 208, 430–435. [DOI] [PubMed] [Google Scholar]
- Laszlo K, Toth K, Kertes E, Peczely L, Ollmann T, Madarassy-Szucs A, Lenard L, 2012. The role of neurotensin in passive avoidance learning in the rat central nucleus of amygdala. Behav Brain Res 226, 597–600. [DOI] [PubMed] [Google Scholar]
- LeDoux JE, 2000. Emotion circuits in the brain. Annu Rev Neurosci 23, 155–184. [DOI] [PubMed] [Google Scholar]
- LeDoux JE, Iwata J, Cicchetti P, Reis DJ, 1988. Different projections of the central amygdaloid nucleus mediate autonomic and behavioral correlates of conditioned fear. J Neurosci 8, 2517–2529. [DOI] [PMC free article] [PubMed] [Google Scholar]
- Lei Q, Jones MB, Talley EM, Garrison JC, Bayliss DA, 2003. Molecular mechanisms mediating inhibition of G protein-coupled inwardly-rectifying K+ channels. Mol Cells 15, 1–9. [PubMed] [Google Scholar]
- Li D, Jin T, Gazgalis D, Cui M, Logothetis DE, 2019a. On the mechanism of GIRK2 channel gating by phosphatidylinositol bisphosphate, sodium, and the Gbetagamma dimer. J Biol Chem 294, 18934–18948. [DOI] [PMC free article] [PubMed] [Google Scholar]
- Li H, Hu B, Zhang HP, Boyle CA, Lei S, 2019b. Roles of K(+) and cation channels in ORL-1 receptor-mediated depression of neuronal excitability and epileptic activities in the medial entorhinal cortex. Neuropharmacology 151, 144–158. [DOI] [PMC free article] [PubMed] [Google Scholar]
- Lu YF, Moriwaki A, Hayashi Y, Tomizawa K, Itano T, Matsui H, 1996. Effects of neurotensin on neurons in the rat central amygdaloid nucleus in vitro. Brain Res Bull 40, 135–141. [DOI] [PubMed] [Google Scholar]
- Ma C, Zhong P, Liu D, Barger ZK, Zhou L, Chang WC, Kim B, Dan Y, 2019. Sleep Regulation by Neurotensinergic Neurons in a Thalamo-Amygdala Circuit. Neuron 103, 323–334 e327. [DOI] [PubMed] [Google Scholar]
- Mao J, Wang X, Chen F, Wang R, Rojas A, Shi Y, Piao H, Jiang C, 2004. Molecular basis for the inhibition of G protein-coupled inward rectifier K(+) channels by protein kinase C. Proc Natl Acad Sci U S A 101, 1087–1092. [DOI] [PMC free article] [PubMed] [Google Scholar]
- Mark MD, Herlitze S, 2000. G-protein mediated gating of inward-rectifier K+ channels. Eur J Biochem 267, 5830–5836. [DOI] [PubMed] [Google Scholar]
- McCullough KM, Morrison FG, Hartmann J, Carlezon WA Jr., Ressler KJ, 2018. Quantified Coexpression Analysis of Central Amygdala Subpopulations. eNeuro 5. [DOI] [PMC free article] [PubMed] [Google Scholar]
- Meyer T, Wellner-Kienitz MC, Biewald A, Bender K, Eickel A, Pott L, 2001. Depletion of phosphatidylinositol 4,5-bisphosphate by activation of phospholipase C-coupled receptors causes slow inhibition but not desensitization of G protein-gated inward rectifier K+ current in atrial myocytes. J Biol Chem 276, 5650–5658. [DOI] [PubMed] [Google Scholar]
- Moga MM, Gray TS, 1985a. Evidence for corticotropin-releasing factor, neurotensin, and somatostatin in the neural pathway from the central nucleus of the amygdala to the parabrachial nucleus. J Comp Neurol 241, 275–284. [DOI] [PubMed] [Google Scholar]
- Moga MM, Gray TS, 1985b. Peptidergic efferents from the intercalated nuclei of the amygdala to the parabrachial nucleus in the rat. Neurosci Lett 61, 13–18. [DOI] [PubMed] [Google Scholar]
- Muller KM, Tveteraas IH, Aasrum M, Odegard J, Dawood M, Dajani O, Christoffersen T, Sandnes DL, 2011. Role of protein kinase C and epidermal growth factor receptor signalling in growth stimulation by neurotensin in colon carcinoma cells. BMC Cancer 11, 421. [DOI] [PMC free article] [PubMed] [Google Scholar]
- Neugebauer V, 2015. Amygdala pain mechanisms. Handb Exp Pharmacol 227, 261–284. [DOI] [PMC free article] [PubMed] [Google Scholar]
- Neugebauer V, Li W, Bird GC, Han JS, 2004. The amygdala and persistent pain. Neuroscientist 10, 221–234. [DOI] [PubMed] [Google Scholar]
- Niemeyer A, Rinne A, Kienitz MC, 2019. Receptor-specific regulation of atrial GIRK channel activity by different Ca(2+)-dependent PKC isoforms. Cell Signal 64, 109418. [DOI] [PubMed] [Google Scholar]
- Niu Y, Tao X, Touhara KK, MacKinnon R, 2020. Cryo-EM analysis of PIP2 regulation in mammalian GIRK channels. Elife 9. [DOI] [PMC free article] [PubMed] [Google Scholar]
- Olsen RHJ, DiBerto JF, English JG, Glaudin AM, Krumm BE, Slocum ST, Che T, Gavin AC, McCorvy JD, Roth BL, Strachan RT, 2020. TRUPATH, an open-source biosensor platform for interrogating the GPCR transducerome. Nat Chem Biol 16, 841–849. [DOI] [PMC free article] [PubMed] [Google Scholar]
- Pape HC, Pare D, 2010. Plastic synaptic networks of the amygdala for the acquisition, expression, and extinction of conditioned fear. Physiol Rev 90, 419–463. [DOI] [PMC free article] [PubMed] [Google Scholar]
- Penzo MA, Robert V, Li B, 2014. Fear conditioning potentiates synaptic transmission onto long-range projection neurons in the lateral subdivision of central amygdala. J Neurosci 34, 2432–2437. [DOI] [PMC free article] [PubMed] [Google Scholar]
- Petrovich GD, 2011. Learning and the motivation to eat: forebrain circuitry. Physiol Behav 104, 582–589. [DOI] [PMC free article] [PubMed] [Google Scholar]
- Petrovich GD, 2013. Forebrain networks and the control of feeding by environmental learned cues. Physiol Behav 121, 10–18. [DOI] [PMC free article] [PubMed] [Google Scholar]
- Pitkänen A, 2000. Connectivity of the rat amygdaloid complex. Oxford University Press., New York. [Google Scholar]
- Ponserre M, Peters C, Fermani F, Conzelmann KK, Klein R, 2020. The Insula Cortex Contacts Distinct Output Streams of the Central Amygdala. J Neurosci 40, 8870–8882. [DOI] [PMC free article] [PubMed] [Google Scholar]
- Prus AJ, Hillhouse TM, LaCrosse AL, 2014. Acute, but not repeated, administration of the neurotensin NTS1 receptor agonist PD149163 decreases conditioned footshock-induced ultrasonic vocalizations in rats. Prog Neuropsychopharmacol Biol Psychiatry 49, 78–84. [DOI] [PMC free article] [PubMed] [Google Scholar]
- Ressler KJ, 2010. Amygdala activity, fear, and anxiety: modulation by stress. Biol Psychiatry 67, 1117–1119. [DOI] [PMC free article] [PubMed] [Google Scholar]
- Rodriguez-Menchaca AA, Adney SK, Zhou L, Logothetis DE, 2012. Dual Regulation of Voltage-Sensitive Ion Channels by PIP(2). Front Pharmacol 3, 170. [DOI] [PMC free article] [PubMed] [Google Scholar]
- Saleem H, Tovey SC, Molinski TF, Taylor CW, 2014. Interactions of antagonists with subtypes of inositol 1,4,5-trisphosphate (IP3) receptor. Br J Pharmacol 171, 3298–3312. [DOI] [PMC free article] [PubMed] [Google Scholar]
- Sarret P, Krzywkowski P, Segal L, Nielsen MS, Petersen CM, Mazella J, Stroh T, Beaudet A, 2003. Distribution of NTS3 receptor/sortilin mRNA and protein in the rat central nervous system. J Comp Neurol 461, 483–505. [DOI] [PubMed] [Google Scholar]
- Schroeder LE, Furdock R, Quiles CR, Kurt G, Perez-Bonilla P, Garcia A, Colon-Ortiz C, Brown J, Bugescu R, Leinninger GM, 2019. Neuropeptides 76, 101930. [DOI] [PMC free article] [PubMed] [Google Scholar]
- Shilling PD, Feifel D, 2008. The neurotensin-1 receptor agonist PD149163 blocks fear-potentiated startle. Pharmacol Biochem Behav 90, 748–752. [DOI] [PMC free article] [PubMed] [Google Scholar]
- Shimada S, Inagaki S, Kubota Y, Ogawa N, Shibasaki T, Takagi H, 1989. Coexistence of peptides (corticotropin releasing factor/neurotensin and substance P/somatostatin) in the bed nucleus of the stria terminalis and central amygdaloid nucleus of the rat. Neuroscience 30, 377–383. [DOI] [PubMed] [Google Scholar]
- Shinohara Y, Yamano M, Matsuzaki T, Tohyama M, 1988. Evidences for the coexistence of substance P, neurotensin and calcitonin gene-related peptide in single neurons of the external subdivision of the lateral parabrachial nucleus of the rat. Brain Res Bull 20, 257–260. [DOI] [PubMed] [Google Scholar]
- Silberman Y, Shi L, Brunso-Bechtold JK, Weiner JL, 2008. Distinct mechanisms of ethanol potentiation of local and paracapsular GABAergic synapses in the rat basolateral amygdala. J Pharmacol Exp Ther 324, 251–260. [DOI] [PubMed] [Google Scholar]
- Smith CM, Lawrence AJ, 2018. Salt Appetite, and the Influence of Opioids. Neurochem Res 43, 12–18. [DOI] [PubMed] [Google Scholar]
- Sonkusare SK, Dalsgaard T, Bonev AD, Nelson MT, 2016. Inward rectifier potassium (Kir2.1) channels as end-stage boosters of endothelium-dependent vasodilators. J Physiol 594, 3271–3285. [DOI] [PMC free article] [PubMed] [Google Scholar]
- St-Gelais F, Jomphe C, Trudeau LE, 2006. The role of neurotensin in central nervous system pathophysiology: what is the evidence? J Psychiatry Neurosci 31, 229–245. [PMC free article] [PubMed] [Google Scholar]
- Steele FF 3rd, Whitehouse SC, Aday JS, Prus AJ, 2017. Neurotensin NTS1 and NTS2 receptor agonists produce anxiolytic-like effects in the 22-kHz ultrasonic vocalization model in rats. Brain Res 1658, 31–35. [DOI] [PubMed] [Google Scholar]
- Stevens EB, Shah BS, Pinnock RD, Lee K, 1999. Bombesin receptors inhibit G protein-coupled inwardly rectifying K+ channels expressed in Xenopus oocytes through a protein kinase C-dependent pathway. Mol Pharmacol 55, 1020–1027. [PubMed] [Google Scholar]
- Suh BC, Hille B, 2008. PIP2 is a necessary cofactor for ion channel function: how and why? Annu Rev Biophys 37, 175–195. [DOI] [PMC free article] [PubMed] [Google Scholar]
- Sui JL, Petit-Jacques J, Logothetis DE, 1998. Activation of the atrial KACh channel by the betagamma subunits of G proteins or intracellular Na+ ions depends on the presence of phosphatidylinositol phosphates. Proc Natl Acad Sci U S A 95, 1307–1312. [DOI] [PMC free article] [PubMed] [Google Scholar]
- Tay SS, Williams TH, Jew JY, 1989. Neurotensin immunoreactivity in the central nucleus of the rat amygdala: an ultrastructural approach. Peptides 10, 113–120. [DOI] [PubMed] [Google Scholar]
- Torruella-Suarez ML, Vandenberg JR, Cogan ES, Tipton GJ, Teklezghi A, Dange K, Patel GK, McHenry JA, Hardaway JA, Kantak PA, Crowley NA, DiBerto JF, Faccidomo SP, Hodge CW, Stuber GD, McElligott ZA, 2020. Manipulations of Central Amygdala Neurotensin Neurons Alter the Consumption of Ethanol and Sweet Fluids in Mice. J Neurosci 40, 632–647. [DOI] [PMC free article] [PubMed] [Google Scholar]
- Tye KM, Prakash R, Kim SY, Fenno LE, Grosenick L, Zarabi H, Thompson KR, Gradinaru V, Ramakrishnan C, Deisseroth K, 2011. Amygdala circuitry mediating reversible and bidirectional control of anxiety. Nature 471, 358–362. [DOI] [PMC free article] [PubMed] [Google Scholar]
- Uhl GR, Kuhar MJ, Snyder SH, 1977. Neurotensin: immunohistochemical localization in rat central nervous system. Proc Natl Acad Sci U S A 74, 4059–4063. [DOI] [PMC free article] [PubMed] [Google Scholar]
- Uhl GR, Snyder SH, 1979. Neurotensin: a neuronal pathway projecting from amygdala through stria terminalis. Brain Res 161, 522–526. [DOI] [PubMed] [Google Scholar]
- Vankova M, Arluison M, Leviel V, Tramu G, 1992. Afferent connections of the rat substantia nigra pars lateralis with special reference to peptide-containing neurons of the amygdalo-nigral pathway. J Chem Neuroanat 5, 39–50. [DOI] [PubMed] [Google Scholar]
- Veening JG, Swanson LW, Sawchenko PE, 1984. The organization of projections from the central nucleus of the amygdala to brainstem sites involved in central autonomic regulation: a combined retrograde transport-immunohistochemical study. Brain Res 303, 337–357. [DOI] [PubMed] [Google Scholar]
- Veinante P, Yalcin I, Barrot M, 2013. The amygdala between sensation and affect: a role in pain. J Mol Psychiatry 1, 9. [DOI] [PMC free article] [PubMed] [Google Scholar]
- Wang HL, Wu T, 1996. G alpha q/11 mediates neurotensin excitation of substantia nigra dopaminergic neurons. Brain Res Mol Brain Res 36, 29–36. [DOI] [PubMed] [Google Scholar]
- Wang HR, Wu M, Yu H, Long S, Stevens A, Engers DW, Sackin H, Daniels JS, Dawson ES, Hopkins CR, Lindsley CW, Li M, McManus OB, 2011. Selective inhibition of the K(ir)2 family of inward rectifier potassium channels by a small molecule probe: the discovery, SAR, and pharmacological characterization of ML133. ACS Chem Biol 6, 845–856. [DOI] [PMC free article] [PubMed] [Google Scholar]
- Wang W, Whorton MR, MacKinnon R, 2014. Quantitative analysis of mammalian GIRK2 channel regulation by G proteins, the signaling lipid PIP2 and Na+ in a reconstituted system. Elife 3, e03671. [DOI] [PMC free article] [PubMed] [Google Scholar]
- Whorton MR, MacKinnon R, 2011. Crystal structure of the mammalian GIRK2 K+ channel and gating regulation by G proteins, PIP2, and sodium. Cell 147, 199–208. [DOI] [PMC free article] [PubMed] [Google Scholar]
- Wilensky AE, Schafe GE, Kristensen MP, LeDoux JE, 2006. Rethinking the fear circuit: the central nucleus of the amygdala is required for the acquisition, consolidation, and expression of Pavlovian fear conditioning. J Neurosci 26, 12387–12396. [DOI] [PMC free article] [PubMed] [Google Scholar]
- Woodworth HL, Brown JA, Batchelor HM, Bugescu R, Leinninger GM, 2018. Determination of neurotensin projections to the ventral tegmental area in mice. Neuropeptides 68, 57–74. [DOI] [PMC free article] [PubMed] [Google Scholar]
- Wray S, Hoffman GE, 1983. Organization and interrelationship of neuropeptides in the central amygdaloid nucleus of the rat. Peptides 4, 525–541. [DOI] [PubMed] [Google Scholar]
- Wu T, Li A, Wang HL, 1995. Neurotensin increases the cationic conductance of rat substantia nigra dopaminergic neurons through the inositol 1,4,5-trisphosphate-calcium pathway. Brain Res 683, 242–250. [DOI] [PubMed] [Google Scholar]
- Wu T, Wang HL, 1995. Protein kinase C mediates neurotensin inhibition of inwardly rectifying potassium currents in rat substantia nigra dopaminergic neurons. Neurosci Lett 184, 121–124. [DOI] [PubMed] [Google Scholar]
- Xiao Z, Cilz NI, Kurada L, Hu B, Yang C, Wada E, Combs CK, Porter JE, Lesage F, Lei S, 2014. Activation of neurotensin receptor 1 facilitates neuronal excitability and spatial learning and memory in the entorhinal cortex: beneficial actions in an Alzheimer’s disease model. J Neurosci 34, 7027–7042. [DOI] [PMC free article] [PubMed] [Google Scholar]
- Xie LH, John SA, Ribalet B, Weiss JN, 2007. Activation of inwardly rectifying potassium (Kir) channels by phosphatidylinosital–4,5-bisphosphate (PIP2): interaction with other regulatory ligands. Prog Biophys Mol Biol 94, 320–335. [DOI] [PubMed] [Google Scholar]
- Yamano M, Hillyard CJ, Girgis S, Emson PC, MacIntyre I, Tohyama M, 1988. Projection of neurotensin-like immunoreactive neurons from the lateral parabrachial area to the central amygdaloid nucleus of the rat with reference to the coexistence with calcitonin gene-related peptide. Exp Brain Res 71, 603–610. [DOI] [PubMed] [Google Scholar]
- Zanchi D, Depoorter A, Egloff L, Haller S, Mahlmann L, Lang UE, Drewe J, Beglinger C, Schmidt A, Borgwardt S, 2017. The impact of gut hormones on the neural circuit of appetite and satiety: A systematic review. Neurosci Biobehav Rev 80, 457–475. [DOI] [PubMed] [Google Scholar]