Abstract
Normothermic machine perfusion (NMP) provides clinicians an opportunity to assess marginal livers before transplantation. However, objective criteria and point‐of‐care (POC) biomarkers to predict risk and guide decision making are lacking. In this investigation, we characterized trends in POC biomarkers during NMP and compared primate donation after circulatory death (DCD) livers with short and prolonged warm ischemic injury. Following asystole, livers were subjected to either 5 minutes (DCD‐5min, n = 4) or 45 minutes (DCD‐45min, n = 4) of warm ischemia time. Livers were flushed with heparinized UW solution, and preserved in cold storage before NMP. During flow‐controlled NMP, circulating perfusate and tissue biopsies were collected at 0, 2, 4, 6, and 8 hours for analysis. DCD‐45min livers had greater terminal portal vein pressure (8.5 vs. 13.3 mm Hg, P = 0.027) and terminal portal vein resistance (16.3 vs. 32.4 Wood units, P = 0.005). During perfusion, DCD‐45min livers had equivalent terminal lactate clearance (93% vs. 96%, P = 0.344), greater terminal alanine aminotransferase (163 vs. 883 U/L, P = 0.002), and greater terminal perfusate gamma glutamyltransferase (GGT) (5.0 vs. 31.7 U/L, P = 0.002). DCD‐45min livers had higher circulating levels of flavin mononucleotide (FMN) at hours 2 and 4 of perfusion (136 vs. 250 ng/mL, P = 0.029; and 158 vs. 293 ng/mL, P = 0.003; respectively). DCD‐5min livers produced more bile and demonstrated progressive decline in bile lactate dehydrogenase, whereas DCD‐45min livers did not. On blinded histologic evaluation, DCD‐45min livers demonstrated greater injury and necrosis at late stages of perfusion, indicative of nonviability. Conclusion: Objective criteria are needed to define graft viability during NMP. Perfusate lactate clearance does not discriminate between viable and nonviable livers during NMP. Perfusate GGT and FMN may represent POC biomarkers predictive of liver injury during NMP.
We characterized trends in point‐of‐care biomarkers during normothermic machine liver perfusion using non‐human primate DCD livers with short versus prolonged warm ischemic injury. Perfusate gamma‐glutamyl transferase and flavin mononucleotide may represent novel point‐of‐care biomarkers predictive of liver injury during NMP.

Abbreviations
- ALT
alanine aminotransferase
- AST
aspartate aminotransferase
- ALP
alkaline phosphatase
- CIT
cold ischemia time
- DCD
donation after circulatory death
- FMN
flavin mononucleotide
- GGT
gamma glutamyltransferase
- HA
hepatic artery
- H&E
hematoxylin and eosin
- LDH
lactate dehydrogenase
- NMP
normothermic machine perfusion
- POC
point of care
- PV
portal vein
- WIT
warm ischemia time
Normothermic machine perfusion (NMP) is emerging as a promising organ preservation strategy in liver transplantation, having demonstrated equivalent short‐term patient survival and reduced organ discard rates compared with cold storage controls.( 1, 2 ) One mechanism by which NMP enables clinicians to reduce discard rates is through real‐time graft assessment before transplantation.( 3, 4, 5, 6, 7 )
At present, the most sensitive and specific parameters indicating organ viability during NMP remain undefined and represent an active area of investigation.( 8 ) In the recent Viability Testing and Transplantation of marginal Livers trial, NMP was used to assess discarded human liver grafts, and those meeting specific viability criteria were subsequently transplanted. The criteria used in this study included lactate clearance ≤2.5 mmol/L, plus any two of the following: (1) any bile production, (2) pH ≥ 7.3, (3) evidence of glucose metabolism, (4) hepatic artery (HA) flow ≥ 150 mL/min and portal vein (PV) flow ≥ 500 mL/min, or (5) homogenous perfusion.( 6, 7 ) Using these parameters, 22 of 31 discarded organs met the viability criteria and were successfully transplanted with no primary nonfunction. However, it is important to note that 4 patients (18%, 3 donated after circulatory death [DCD] and 1 donated after brain death recipient) experienced early graft loss due to ischemic cholangiopathy and required re‐transplantation.
As such, there is an urgent need to continue the development of point‐of‐care (POC) metrics to define graft viability during NMP, particularly for DCD livers that represent a large potential pool of additional livers. In this study, we used a nonhuman primate DCD model to determine how a panel of POC metrics correlate with tissue viability defined by histologic evaluation. Herein, we demonstrate that perfusate gamma glutamyltransferase (GGT), alkaline phosphatase (ALP), and flavin mononucleotide (FMN) may represent useful markers in viability assessment during NMP.
Materials and Methods
Study Design
The goal of this study was to determine correlations among POC metrics available during NMP and liver viability, as determined by histologic evaluation. Nonhuman primate DCDs were randomly subjected to either a short warm ischemia time (WIT, 5 minutes) or prolonged WIT (45 minutes), defined as the time between asystole and cold flush. Following the allotted WIT, livers were flushed with heparinized 4°C UWS, briefly preserved on ice, and then underwent 8 hours of NMP. Physiologic parameters (pressure, flow, bile production) were recorded hourly. Serial tissue biopsies and perfusate specimens were collected every 2 hours of perfusion.
Liver Procurement
All animals received humane care through the Duke University Division of Laboratory Animal Resources according to criteria outlined in the “Guide for the Care and Use of Laboratory Animals” prepared by the National Academy of Sciences and published by the National Institutes of Health (NIH publication 86‐23 revised 1985).
Rhesus macaque primates were euthanized in controlled fashion with intravenous euthasol injection. Following confirmation of asystole, laparotomy was expeditiously performed and the liver was procured with care to avoid vascular and biliary injury. The PV and HA were identified and perfusion cannulae (Harvard Apparatus, Holliston, MA) were secured in place with suture ligation. The infrahepatic and suprahepatic vena cava were left open. At either 5 minutes (DCD‐5 min group) or 45 minutes WIT (DCD‐45 min group), the liver was flushed with 4°C heparinized UW cold storage solution (1,000 units in 50 mL) followed by additional UW flush solution until outflow appeared clear (250 mL through the PV and 250 mL through the HA). The bile duct was cannulated with a 14‐gauge catheter (BD Angiocath; Becton Dickinson, Ontario, Canada). The liver was then submerged in 4°C UW solution for a period of 60‐90 minutes before NMP.
Normothermic Machine Perfusion
An open‐circuit NMP system was designed consisting of a centrifugal pump console (Stockert SCPC; LivaNova PLC, London United Kingdom), a perfusate reservoir with built‐in oxygenator (CAPIOX FX05; Terumo Cardiovascular, Ann Arbor, MI), and Tygon laboratory tubing (Harvard Apparatus, Holliston MA). The oxygenator was supplied with a gas mixture of 95% O2/5% CO2 at 5 L/min (Airgas Inc., Durham NC). Perfusate flow was measured using a noninvasive ultrasound flow sensor (H9XL; Transonic Systems Inc., Ithaca NY). Hepatic arterial pressure was measured using a disposable intravenous monitoring transducer (Transpac, ICU Medical Inc., San Clemente, CA), and portal venous pressure was measured with a venous pressure transducer (P75 type 379; Hugo Sachs Elektronik, March‐Hugstetten Germany). Perfusate temperature was set to 37°C using a standalone heating unit (Micro‐Temp LT; Gentherm Medical, Cincinnati, OH).
To establish reperfusion, pressure lines were flushed with normal saline, and cannulae were connected in‐line with the centrifugal pump outflow through a Y‐connection. A C‐clamp was used on the portal inflow line to modify the pressure differential between the venous and arterial inflow lines. Centrifugal pump speed was slowly up‐titrated during a 5‐10‐minute warmup to establish an initial maximum portal pressure of 11‐12 mm Hg and initial hepatic mean arterial pressure of 65 mm Hg. Following the initial titration, the pump speed remained constant for the duration of the perfusion to establish a “flow‐controlled” system with pressure as the dependent variable.
Perfusate Composition
Perfusate composition was modeled after that used in commercially available NMP devices. A total circulating volume of 1 L was comprised of 2.5 units of human type O packed red blood cells, 500‐750 mL 5% human albumin solution (Plasbumin‐5; Grifols, Barcelona, Spain), 1 g/mL calcium carbonate (Fresnius Kabi, Lake Zurich, IL), 10,000 IU unfractionated heparin (Fresnius Kabi), and 20 units of insulin (Humulin; Eli Lilly, Indianapolis, IN). Perfusate pH was titrated to an initial minimum of 7.1 with 20‐28 mL of 8.4% sodium bicarbonate (Fresnius Kabi). Notably, red cells were spun at 2,500 rpm for 15 minutes before perfusate constitution to enable aspiration and discard the citrate‐containing supernatant. During the perfusion, 2,000 IU additional heparin was bolused every 2 hours.
Sample Collection
Perfusate was collected every 2 hours, centrifuged at 2500 rpm for 10 minutes, and the supernatant was flash‐frozen in liquid nitrogen before storage at −80°C. Sequential 1‐cm‐thick wedge biopsies were performed on the left lobe of the liver and stored in 10% formalin. Bile was collected continuously, but aliquoted every 2 hours, measured for volume, and flash‐frozen in liquid nitrogen.
Perfusate Analysis
Perfusate ALT, GGT, and ALP were measured using the Piccolo Hepatic Function Panel and Piccolo Xpress Chemistry Analyzer. Blood gas analysis, glucose, and electrolytes were monitored with iSTAT, CG4+ cartridges (Abbott Point of Care Inc., Abbott Park, IL). Perfusate Lactate was measured using Lactate Plus meter (Nova Biomedical, Waltham MA).
Perfusate FMN concentration was determined using fluorescent spectroscopy as previously described.( 9 ) Briefly, a stock control solution was made using fluorimetric riboflavin 5′‐monophosphate sodium salt hydrate (Sigma‐Aldrich, St. Louis, MO) dissolved in normal saline. Serial dilutions were used to generate controls ranging from 80 ng/mL to 5,000 ng/mL; 100 μL of each control or perfusate solution was loaded into a black 96‐well plate in duplicate and measured using a spectrofluorometer with an excitation wavelength of 450 nm and emission wavelength of 525 nm. A linear model based on the control samples with R2 = 0.999 was generated to estimate the sample concentration based on fluorescence.
For all markers, if a value was measured below the detection limit, a value of zero was assumed.
Bile Analysis
Bile lactate dehydrogenase (LDH) was analyzed with a Monkey Lactate Dehydrongenase ELISA kit according to the manufacturer’s instructions (MyBiosource, San Diego CA). Bile pH, Na, and glucose was determined using iSTAT, CG4+ cartridges (Abbott Point of Care).
Histology
Hematoxylin and eosin (H&E) staining used to evaluate tissue architecture. Suzuki score was determined by a blinded, board‐certified liver pathologist using the definitions outlined in Supporting Table S1. In a secondary analysis, the percent erythrocyte area occupying the hepatic sinusoids was estimated using ImageJ software (version 1.53e; National Institutes of Health, Bethesda, MD); briefly, unedited H&E images were broken into Hue‐Saturation‐Brightness stacks, and a minimal and maximal intensity threshold was set to identify and measure the percent area of red blood cells based on saturation.( 10 )
Statistics
All statistical analyses were performed with GraphPad Prism software, version 7.04 (GraphPad Software Inc., La Jolla, CA). All values are presented as median ± interquartile range (IQR). Differences between continuous values were analyzed using an unpaired Student t test. Differences between histologic grading scores were compared using a two‐tailed nonparametric Mann‐Whitney U test. Nonparametric Spearman correlation was used to compare perfusion parameters and/or POC markers with histologic injury score. P values less than 0.05 were considered significant.
Results
A total of eight livers were included in the study, four in the DCD‐5min group and four in the DCD‐45min group. All livers were perfused for 8 hours. Grossly, appearance was variable among both DCD‐5min livers and DCD‐45min livers (Fig. 1), with some showing persistent perfusion defects and others homogeneously reperfused within both groups.
FIG. 1.
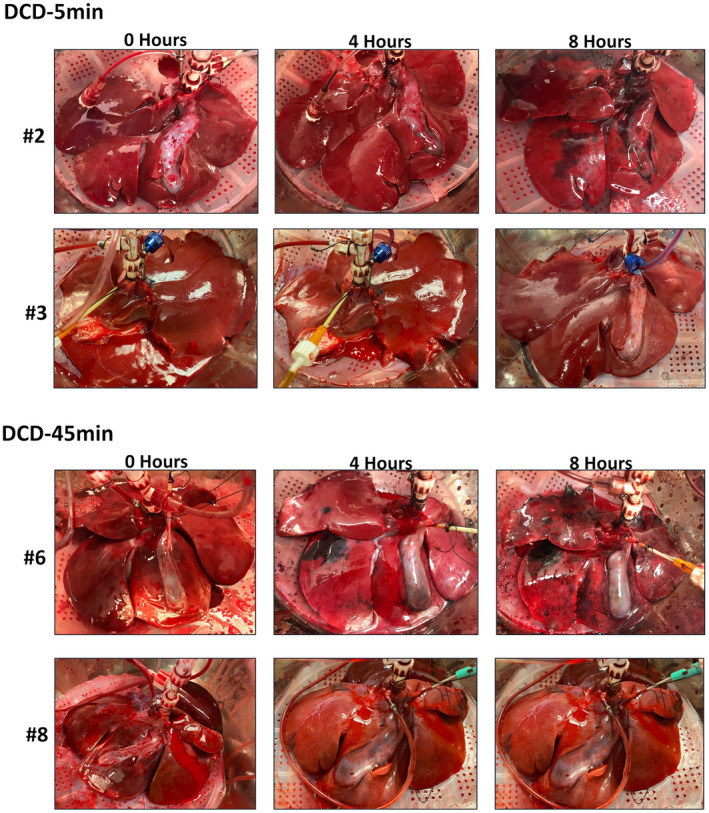
Gross appearance of select DCD‐5min and DCD‐45min livers at 0, 4, and 8 hours of perfusion.
Perfusion Parameters
Perfusion flow parameters are given in Table 1. The DCD‐5min livers had higher total flow per gram of liver tissue than DCD‐45min livers at all time points of perfusion (Fig. 2A). Portal pressure was similar between groups for the first 6 hours of perfusion, but diverged thereafter, with DCD‐45min livers showing an increase in PV pressure at hour 8 (8.5 ± 1.4 vs. 13.3 ± 0.8 mm Hg, P = 0.027; Fig. 2B). Portal vein resistance (PVR, defined as portal pressure/portal flow in mm Hg /mL/min, or Woods Units) demonstrated a similar trend in which DCD‐45min livers experienced a 2‐fold increase in resistance during the final hour of perfusion (16.3 ± 2.9 vs. 32.4 ± 2.3 Wood units, P = 0.005; Fig. 2C).
TABLE 1.
Perfusion Flow Parameters at 0, 2, 4, 6, and 8 Hours
| Hour | Total Flow (mL/min/g liver) | Portal Pressure (mm Hg ) | Portal Resistance (Wood Units) | ||||||
|---|---|---|---|---|---|---|---|---|---|
| DCD‐5min | DCD‐45min | P Value | DCD‐5min | DCD‐45min | P Value | DCD‐5min | DCD‐45min | P Value | |
| 0 | 4.4 ± 0.5 | 2.5 ± 0.4 | 0.024 | 11.7 ± 0.3 | 11.9 ± 0.7 | 0.806 | 21.5 ± 1.9 | 26.2 ± 3.9 | 0.32 |
| 2 | 4.7 ± 0.5 | 2.8 ± 0.5 | 0.047 | 8.5 ± 0.8 | 10.0 ± 1.1 | 0.311 | 14.4 ± 1.6 | 18.6 ± 3.0 | 0.27 |
| 4 | 4.7 ± 0.6 | 2.7 ± 0.5 | 0.035 | 7.4 ± 1.2 | 8.1 ± 0.7 | 0.649 | 13.1 ± 2.3 | 15.6 ± 2.3 | 0.46 |
| 6 | 4.4 ± 0.5 | 2.3 ± 0.4 | 0.025 | 7.2 ± 1 | 8.1 ± 1.4 | 0.628 | 13.1 ± 1.9 | 17.2 ± 3.1 | 0.29 |
| 8 | 4.0 ± 0.4 | 2.1 ± 0.3 | 0.008 | 8.5 ± 1.4 | 13.3 ± 0.8 | 0.027 | 16.3 ± 2.9 | 32.4 ± 2.3 | 0.005 |
FIG. 2.
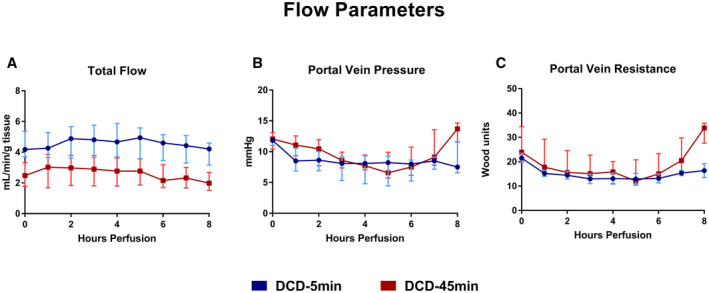
Flow parameters during 8 hours of NMP. (A) Total flow in milliliters per minute per gram of liver tissue. (B) Portal vein pressure in millimeter of mercury. (C) Portal vein resistance in Wood Units. All values displayed as median ± IQR.
Perfusate Biomarkers
Lactate
During perfusion, all livers cleared lactate, with 93% versus 96% terminal clearance from baseline in the DCD‐5min and DCD‐45min groups, respectively (P = 0.344; Fig. 3).
FIG. 3.
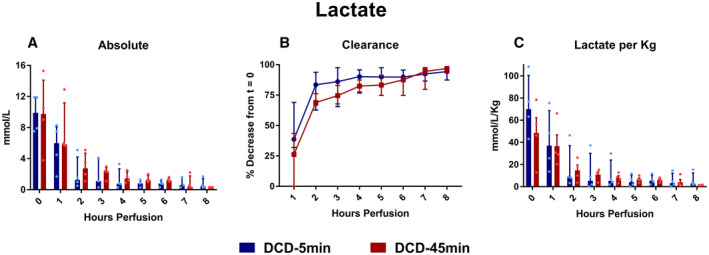
(A) Absolute lactate. (B) Percent clearance of lactate throughout perfusion. (C) Lactate normalized to liver weight in kilograms. All values displayed as median ± IQR.
ALT
Absolute ALT concentration was greater in the DCD‐45min group at hour 8 of perfusion (Fig. 4A; 163 vs. 884 IU/L, P = 0.002), as was the ALT when normalized to liver weight (1,295 vs. 4,099 U/L/Kg, P = 0.022). The mean total change from baseline (Δ ALT) was not statistically different between groups (Fig. 4C: +149 vs. +651 IU/L, P = 0.343); notably, one liver in the DCD‐45min group (#8) demonstrated a negative total Δ ALT. The change in ALT per hour at each time point (Δ ALT/hour) was similar between groups, but trended toward greater in the DCD‐45min group at hour 2: +6.9 vs. +42 IU/L/hour, P = 0.116 (Fig. 4D).
FIG. 4.
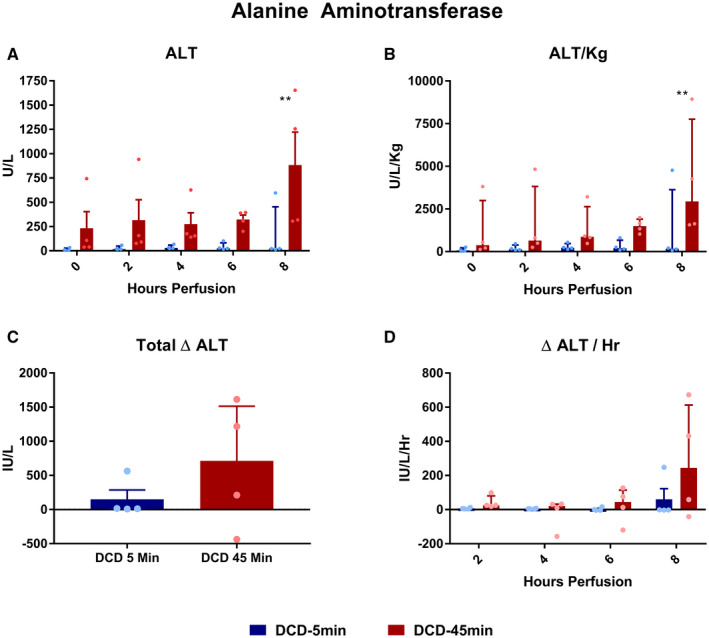
Perfusate ALT concentrations during perfusion. (A) Absolute concentration over time. (B) ALT normalized to liver weight in kilograms. (C) Delta ALT (final – initial). (D) Average delta ALT per hour for each time point. All values displayed as median ± IQR. *P < 0.05; **P < 0.01; and ***P < 0.001.
GGT and ALP
Throughout perfusion, absolute perfusate GGT concentrations were elevated in DCD‐45min livers compared with DCD‐5min livers at all time points (Fig. 5A,B). The mean total Δ GGT from baseline was greater in DCD‐45min livers (Fig. 5C, +0.75 vs. +31.8 U/L, P < 0.001), and the Δ GGT/hour was greater in DCD‐45min livers at hours 2 (0 vs. +6.4 U/L/hour, P = 0.002) and 4 (0 vs. +3.6 U/L/hour, P = 0.008) of perfusion, but not at hours 6 or 8 (Fig. 5D). Perfusate ALP concentration followed a trend similar to that of GGT with a greater absolute concentration throughout perfusion (Fig. 6A,B), a greater mean total Δ ALP in DCD‐45min livers (Fig. 6C, +12.5 vs. +70.8 U/L, P = 0.031), and greater Δ ALP/hour early in the course of perfusion (Fig. 6D, +1.8 vs. +15.5 U/L/hour at hour 2; P = 0.021).
FIG. 5.
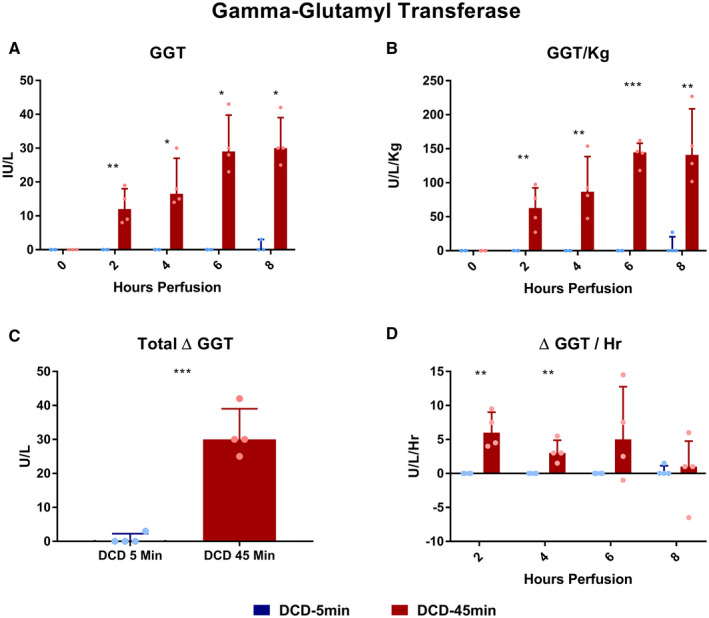
Perfusate GGT concentrations during perfusion. (A) Absolute concentration over time. (B) GGT normalized to liver weight in kilograms. (C) Delta GGT (final – initial). (D) Average delta GGT per hour for each time point. All values displayed as median ± IQR. *P < 0.05; **P < 0.01; and ***P < 0.001.
FIG. 6.
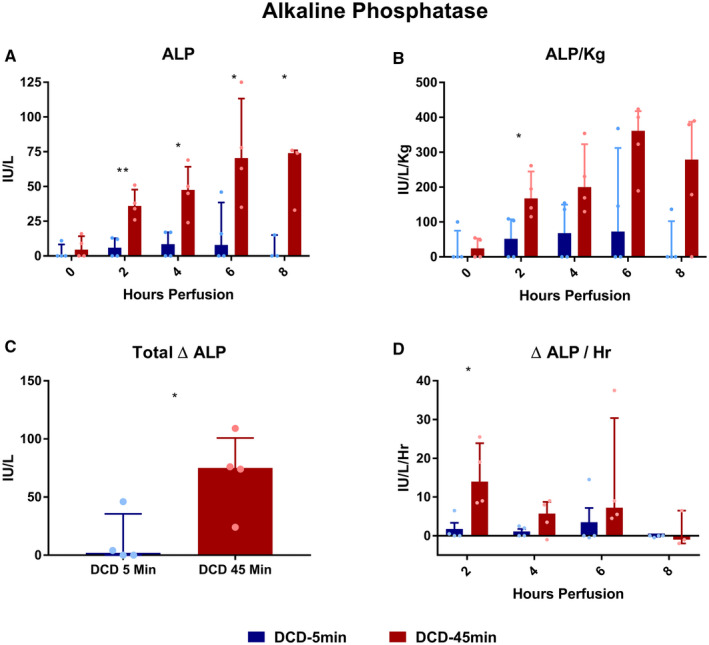
Perfusate ALP concentrations during perfusion. (A) Absolute concentration over time. (B) ALP normalized to liver weight in kilograms. (C) Delta ALP (final – initial). (D) Average delta ALP per hour for each time point. All values displayed as median ± IQR. *P < 0.05; **P < 0.01; and ***P < 0.001. ****Note: Due to a hemolyzed specimen, the hour‐8 value for in the DCD‐45min group was unable to be obtained and is not included.
FMN
The perfusate FMN concentration trended higher in DCD‐45min livers at the onset of perfusion (74.5 vs. 173 ng/mL [P = 0.071] at hour 0; 136 vs. 250 ng/mL [P = 0.029] at hour 2; and 158 vs. 293 ng/mL [P = 0.003] at hour 4; Fig. 7A); however, this trend was not statistically significant when FMN was normalized to liver weight (Fig. 7B). Notably, the mean Δ FMN/hour was most positive for both groups at the start of perfusion (+30.1 vs. +38.3 ng/mL/hour, P = 0.59) and trended in the negative range during the final hour of perfusion in both groups (−2.8 vs. −39 ng/mL/hour, P = 0.119; Fig. 7C).
FIG. 7.
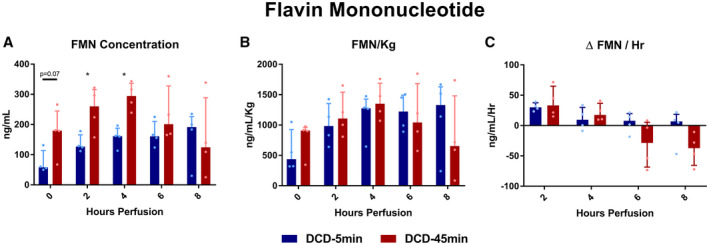
Perfusate FMN concentration. All values displayed as median ± IQR. *P < 0.05.
Bile Analysis
DCD‐5min livers produced more bile, in both absolute quantity (total 29.9 vs. 11.5 mL, P = 0.004) and volume per liver weight (total 219 vs. 52.8 mL/Kg, P = 0.003; Fig. 8). Biliary LDH concentration decreased over time in the DCD‐5min livers (hour 2 vs. 8: 76.3 vs. 34.1 ng/mL; P = 0.014), but not in the 45min WIT group (Fig. 9A). Bile glucose was frequently undetectable (lower limit = 20 mg/dL) in the DCD‐5min livers; however, this did not meet statistical significance compared with the DCD‐45min livers (Fig. 9B). Finally, biliary sodium concentration was similar between groups, but gradually increased in both groups throughout perfusion (Fig. 9C).
FIG. 8.
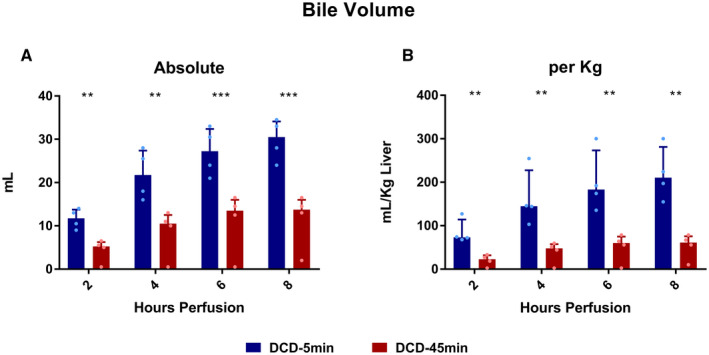
Bile volume produced during perfusion. All values displayed as median ± IQR. *P < 0.05; **P < 0.01; and ***P < 0.001.
FIG. 9.
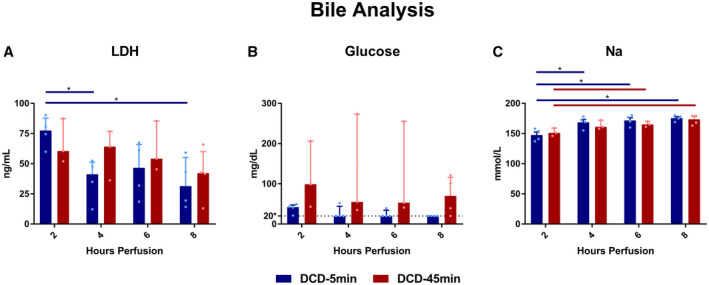
Bile markers at 2, 4, 6, and 8 hours of perfusion. (A) Biliary LDH. (B) Biliary glucose; dotted line denotes lower detection minimum of 20 mg/dL. (C) Bile sodium concentration. All values displayed as median ± IQR. *P < 0.05.
Histology
Representative H&E sections taken from peripheral wedge biopsies from all livers at all five time points are displayed in Fig. 10 (DCD‐5min group) and Fig. 11 (DCD‐45min group). On blinded analysis, the total Suzuki score was greater in DCD‐45min livers at hour 8 of perfusion (median 1.5 vs. 6, P = 0.0286; Fig. 12A). In addition, the necrosis score alone was also greater in DCD‐45min grafts at hour 8 (median 0 vs. 2, P = 0.0286; Fig. 12B). The biliary epithelium appeared normal in all samples in both groups. Using the Spearman correlation, we found that absolute GGT had the highest correlation with Suzuki score among any parameter (r = 0.723, P < 0.0001; Fig. 13F); however, bile volume, portal resistance, ALT, and ALP were all found to have significant correlations (Fig. 13).
FIG. 10.
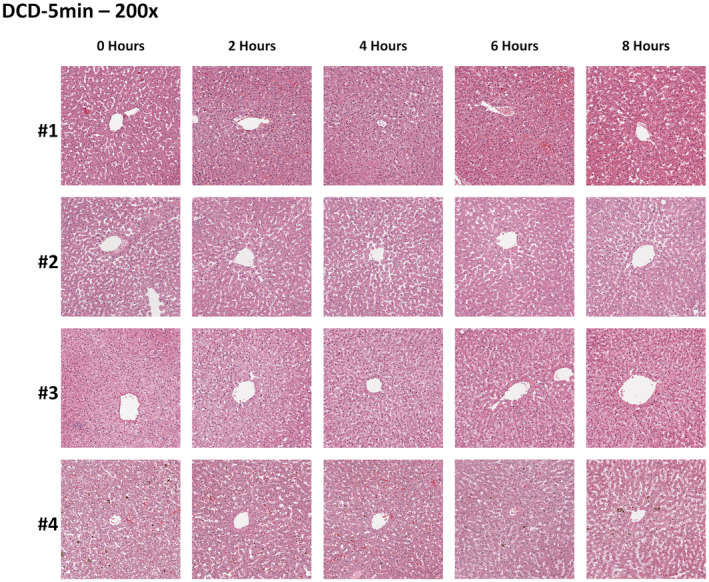
Representative DCD‐5min group H&E histology at 0, 2, 4, 6, and 8 hours. ×200 magnification.
FIG. 11.
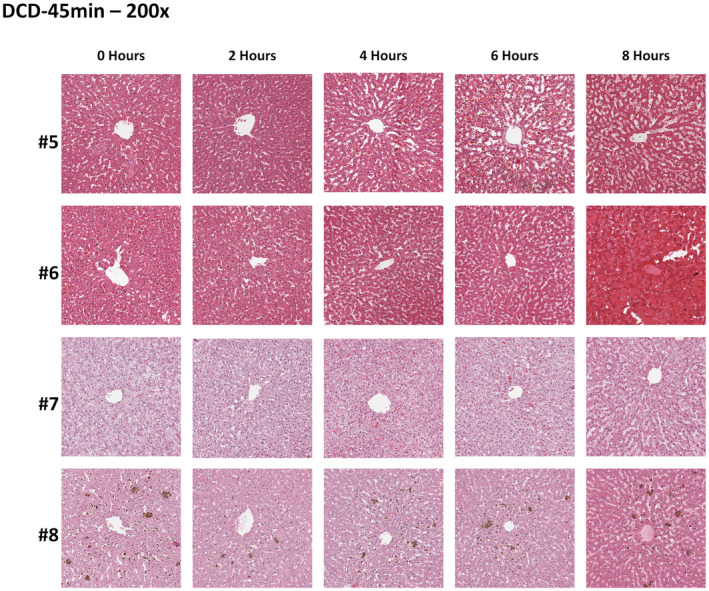
Representative DCD‐45min group H&E histology at 0, 2, 4, 6, and 8 hours. ×200 magnification.
FIG. 12.
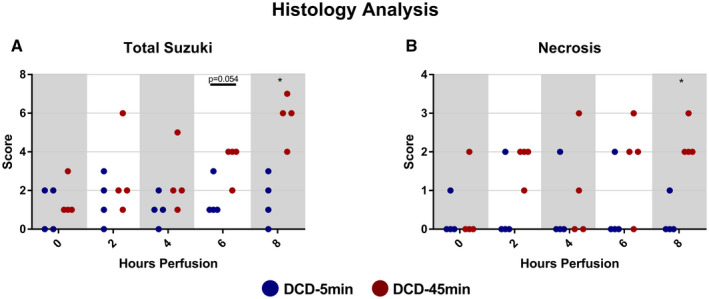
Injury scoring of wedge biopsies taken at 0, 2, 4, 6, and 8 hours of perfusion. (A) Total Suzuki score. (B) Necrosis‐only component of Suzuki score. *P < 0.05.
FIG. 13.
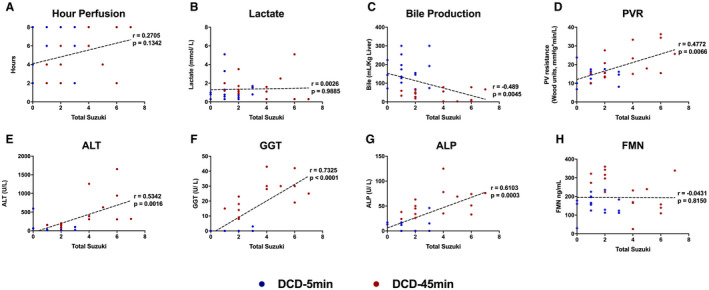
Nonparametric Spearman correlations between Suzuki score and various perfusion parameters and POC markers. Abbreviation: PVR, portal vein resistance. (A) Hour of perfusion. (B) Absolute lactate concentration. (C) Total bile production. (D) Portal vein resistance. (E) Absolute perfusate alanine aminotransferase concentration. (F) Absolute perfusate gamma‐glutamyl transferase concentration. (G) Absolute perfusate alkaline phosphatase concentration. (H) Absolute perfusate flavin mononucleotide concentration.
Finally, representative H&E sections were analyzed using ImageJ software to determine sinusoidal erythrocyte quantity, indicative of microvascular obstruction. For example, Fig. 14A demonstrates a representative section from liver #5 in the DCD‐45min group, and Fig. 14B demonstrates the image saturation‐based thresholding technique applied to estimate the percentage area (red pixels). In comparing groups, there was no difference between the estimated area at 2, 4, 6, or 8 hours; however, it was noted that DCD‐5min livers appeared to peak at 2 hours, while DCD‐45min livers peaked at hour 6 of perfusion (Fig. 14C).
FIG. 14.
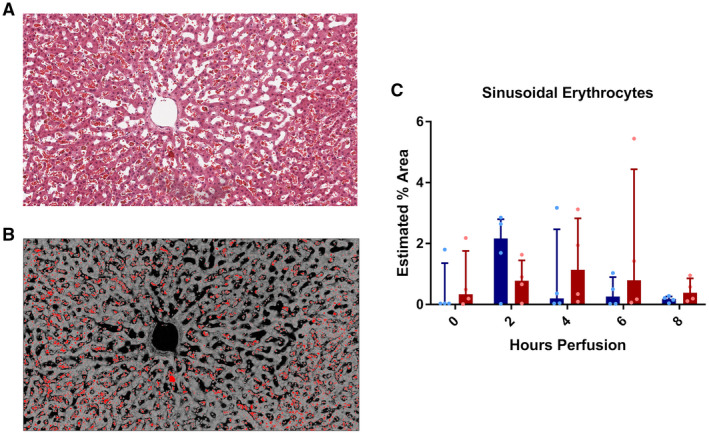
Estimated percent area of sinusoidal erythrocytes. (A) Representative image of liver #5 at hour‐6 time point demonstrating numerous erythrocytes congested in the sinusoids. (B) Representative image depicted in (A) with application of hue, saturation, and brightness stack thresholding (10) to estimate percent erythrocyte area. (C) Estimated percent erythrocyte area for each perfusion time point.
Discussion
This study compared POC biomarkers of viability during NMP in nonhuman primate DCD livers with short and prolonged warm ischemic injury. On histologic evaluation, DCD livers with prolonged WIT demonstrated evidence of progressive, severe injury consistent with nonviability. This was associated with greater terminal portal pressure and resistance and decreased flow, mechanical parameters easily measured in real time. On POC biochemical assessment, DCD‐45min livers were associated with higher levels of circulating ALP and GGT throughout perfusion, and importantly, greater Δ ALP/Δt and Δ GGT/Δt early in the course of perfusion. In addition, DCD‐45min livers demonstrated decreased bile production, early elevations in FMN, and late elevations in ALT compared with DCD‐5min livers. Strengths of this model include the controlled DCD WIT, the ability to perform serial biopsies to demonstrate the evolution of liver injury during perfusion, and clinical translatability of a nonhuman primate model.
Notably, both absolute perfusate lactate and the percent lactate clearance was comparable in DCD livers with short and prolonged WIT, suggesting that this is not a reliable biomarker of viability. Many clinicians rely on perfusate lactate as an indication of parenchymal viability, given that uptake and metabolism of lactate takes place in periportal hepatocytes.( 11 ) Consistent with prior reports,( 5, 6, 7, 12, 13 ) we observed the majority of clearance occurring within the first 2 hours of perfusion, suggesting that this is the most important window for evaluation. Still, while the inability to clear lactate is a justified exclusion criterion, our findings affirm that lactate clearance alone does not predict graft viability, particularly at later stages in perfusion. For example, liver #6 in this study, which was both grossly and histologically nonviable at the conclusion of perfusion (Figs. 2 and 12) had an initial lactate of 10.5 mmol/L, decreased to 3.4 mmol/L at hour 2, and ultimately measured below 0.3 mmol/L at hours 7 and 8 of perfusion.
Markers of biliary viability during perfusion are less well characterized. While simply measuring the bile volume was once considered a potential marker of viability,( 14 ) and we observed a trend in greater bile volume in our DCD‐5min group, clinical reports have suggested that bile volume on NMP does not correlate with organ viability or development of biliary complications.( 3, 4 ) Recently, Matton et al. demonstrated that biliary bicarbonate, pH, and glucose correlated with bile duct injury in human livers initially declined for transplantation, finding bicarbonate to have the highest predictive value in discriminating between livers with and without extrahepatic bile duct histologic injuries (area under the receiver operating characteristic curve of 0.91).( 15 ) Unfortunately, we could not assess bicarbonate and pH accurately because our samples were not collected under mineral oil, and thus were exposed to ambient carbon dioxide before our measurements. We did note, however, that bile glucose was generally lower among DCD‐5min livers, although this did not reach statistical significance, possibly due to a small number of samples (e.g., only one of four DCD‐45min livers produced a bile sample at hour 8).
Notably, we observed progressive increases in perfusate ALP and GGT concentration in the first 6 hours of perfusion in the DCD‐45min group, which were predominantly undetectable in DCD‐5min livers. Few series have reported trends in perfusate ALP or GGT during NMP,( 16, 17 ) but Reiling et al. noted similar trends in GGT elevation over time among nonlactate clearing human DCD livers (n = 3, not transplanted).( 17 ) In addition, we demonstrate that concentrations of these markers have moderate‐to‐strong positive correlation with histologic injury score. Given that these markers are readily accessible to clinicians on POC testing, ALP and GGT may represent convenient markers of biliary injury during machine perfusion, with potential value in predicting posttransplant biliary complications.
One important consideration in the interpretation of any POC assessment during NMP is the variability in liver size and perfusate composition and volume, the latter of which are particularly dynamic in “open” ex vivo lung perfusion systems (due to evaporative losses) or protocols in which volume is added throughout perfusion. These variables dramatically affect the concentrations of nearly all POC markers, and therefore must be considered during liver viability assessment. We posit that the prognostic utility of any marker during NMP is both device and protocol specific, until new parameters that normalize absolute biomarker content for graft size and circulating volume are developed and reported. Furthermore, given that the rates of change for most parameters are nonlinear throughout perfusion, the ideal assessment period for specific markers is also likely individualized, and it is unknown whether the absolute difference during perfusion or the rate change per time will have superior predictive value. In the case of ALP and GGT, our model suggests that the Δ /Δt is significantly greater within the first 2 hours of perfusion, and thus may be most useful in this period.
Another POC biomarker, FMN, is a mitochondrial complex I molecule that is dissociated during ischemia‐reperfusion injury,( 18, 19 ) and has recently been investigated in the context of machine perfusion.( 9 ) Muller et al. monitored FMN levels in livers undergoing hypothermic machine perfusion and found that FMN levels predicted allograft dysfunction and early graft loss.( 20 ) Our results in normothermic perfusion suggest that extended warm ischemia time is associated with greater elevations in FMN, peaking at the fourth hour of perfusion. Given the subsequent decline observed hours 6 through 8, we would hypothesize that, like lactate, ALP or GGT, the prognostic utility of FMN in NMP may be greatest at the start of perfusion.
Our study carries several limitations warranting discussion. Most importantly, we did not transplant these livers following perfusion; therefore, our determination of viability is based on histologic evaluation of the parenchyma at the end of NMP as a surrogate. Second, the livers used in our study were “discards” from primates undergoing euthanasia at the completion of an unrelated kidney transplant study endpoint; hence, the N is small and the organs had been subjected to immunosuppression before NMP. Finally, we used packed human type O red cells as the oxygen carrier in our perfusate, due to limited supply of primate blood. Although this blood was leuko‐reduced to prevent xenogeneic immune activation, it is known that human red blood cells are slightly larger (mean corpuscular volume [MCV] 80‐100 fL) than those in macaques (MCV 68‐84 fL), although macaques have a similar red cell distribution range (12.7‐15.4).( 21 ) Despite these limitations, our model demonstrated several trends that we believe warrant further investigation in human NMP systems with a transplant endpoint.
In conclusion, NMP is an important preservation tool that affords clinicians an assessment period before transplantation. Validated POC biomarkers indicative of graft injury are needed to determine which livers are suitable for transplantation. In this nonhuman primate model of NMP, we found that livers with prolonged WIT demonstrate early elevations in perfusate FMN, ALP, and GGT concentration during perfusion compared to those with less ischemic injury. These markers could be of prognostic value and should be investigated in the setting of larger human studies.
Supporting information
Fig S1
Table S1
Potential conflict of interest: Dr. Guy consults for NGM, Madrigal, and CymaBay.
References
Author names in bold designate shared co‐first authorship.
- 1.Nasralla D, Coussios CC, Mergental H, Akhtar MZ, Butler AJ, Ceresa CDL, et al. A randomized trial of normothermic preservation in liver transplantation. Nature 2018;557:50. [DOI] [PubMed] [Google Scholar]
- 2.MacConmara M, Hanish SI, Hwang CS, De Gregorio L, Desai DM, Feizpour CA, et al. Making every liver count: increased transplant yield of donor livers through normothermic machine perfusion. Ann Surg 2020;272:397‐401. [DOI] [PubMed] [Google Scholar]
- 3.Watson CJE, Kosmoliaptsis V, Pley C, Randle L, Fear C, Crick K, et al. Observations on the ex situ perfusion of livers for transplantation. Am J Transplant 2018;18:2005‐2020. [DOI] [PMC free article] [PubMed] [Google Scholar]
- 4.Watson CJE, Kosmoliaptsis V, Randle LV, Gimson AE, Brais R, Klinck JR, et al. Normothermic perfusion in the assessment and preservation of declined livers before transplantation: hyperoxia and vasoplegia—important lessons from the first 12 cases. Transplantation 2017;101:1084. [DOI] [PMC free article] [PubMed] [Google Scholar]
- 5.van Leeuwen OB, de Vries Y, Fujiyoshi M, Nijsten MWN, Ubbink R, Pelgrim GJ, et al. Transplantation of high‐risk donor livers after ex situ resuscitation and assessment using combined hypo‐and normothermic machine perfusion: a prospective clinical trial. Ann Surg 2019;270:906‐914. [DOI] [PubMed] [Google Scholar]
- 6.Laing RW, Mergental H, Yap C, Kirkham A, Whilku M, Barton D, Curbishley S, et al. Viability testing and transplantation of marginal livers (VITTAL) using normothermic machine perfusion: study protocol for an open‐label, non‐randomised, prospective, single‐arm trial. BMJ Open 2017;7:e017733. [DOI] [PMC free article] [PubMed] [Google Scholar]
- 7.Mergental H, Laing RW, Kirkham AJ, Perera MTPR, Boteon YL, Attard J, et al. Transplantation of discarded livers following viability testing with normothermic machine perfusion. Nat Commun 2020;11:1‐12. [DOI] [PMC free article] [PubMed] [Google Scholar]
- 8.Watson CJ, Jochmans I. From “gut feeling” to objectivity: machine preservation of the liver as a tool to assess organ viability. Current Transpl Rep 2018;5:72‐81. [DOI] [PMC free article] [PubMed] [Google Scholar]
- 9.Wang LU, Thompson E, Bates L, Pither TL, Hosgood SA, Nicholson ML, et al. Flavin mononucleotide as a biomarker of organ quality—a pilot study. Transplantation Direct 2020;6:e600. [DOI] [PMC free article] [PubMed] [Google Scholar]
- 10.Ferreira T, Rasband W. ImageJ user guide . ImageJ/Fiji 2012;1:155‐161. [Google Scholar]
- 11.Phypers B, Pierce JT. Lactate physiology in health and disease. Continuing Education in Anaesthesia, Critical Care & Pain 2006;6:128‐132. [Google Scholar]
- 12.Selzner M, Goldaracena N, Echeverri J, Kaths JM, Linares I, Selzner N, et al. Normothermic ex vivo liver perfusion using steen solution as perfusate for human liver transplantation: first North American results. Liver Transpl 2016;22:1501‐1508. [DOI] [PubMed] [Google Scholar]
- 13.Mergental H, Stephenson BTF, Laing RW, Kirkham AJ, Neil DAH, Wallace LL, et al. Development of clinical criteria for functional assessment to predict primary nonfunction of high‐risk livers using normothermic machine perfusion. Liver Transpl 2018;24:1453‐1469. [DOI] [PMC free article] [PubMed] [Google Scholar]
- 14.Sutton ME, op den Dries S, Karimian N, Weeder PD, de Boer MT, Wiersema‐Buist J, et al. Criteria for viability assessment of discarded human donor livers during ex vivo normothermic machine perfusion. PLoS One 2014;9:e110642. [DOI] [PMC free article] [PubMed] [Google Scholar]
- 15.Matton APM, de Vries Y, Burlage LC, van Rijn R, Fujiyoshi M, de Meijer VE, et al. Biliary bicarbonate, pH, and glucose are suitable biomarkers of biliary viability during ex situ normothermic machine perfusion of human donor livers. Transplantation 2019;103:1405. [DOI] [PMC free article] [PubMed] [Google Scholar]
- 16.Op den Dries S, Karimian N, Sutton ME, Westerkamp AC, Nijsten MWN, Gouw ASH, et al. Ex vivo normothermic machine perfusion and viability testing of discarded human donor livers. Am J Transplant 2013;13:1327‐1335. [DOI] [PubMed] [Google Scholar]
- 17.Reiling J, Butler N, Simpson A, Hodgkinson P, Campbell C, Lockwood D, et al. Assessment and transplantation of orphan donor livers: a back‐to‐base approach to normothermic machine perfusion. Liver Transpl 2020;26:1618‐1628. [DOI] [PubMed] [Google Scholar]
- 18.Kahl A, Stepanova A, Konrad C, Anderson C, Manfredi G, Zhou P, et al. Critical role of flavin and glutathione in complex I–mediated bioenergetic failure in brain ischemia/reperfusion injury. Stroke 2018;49:1223‐1231. [DOI] [PMC free article] [PubMed] [Google Scholar]
- 19.Stepanova A, Sosunov S, Niatsetskaya Z, Konrad C, Starkov AA, Manfredi G, et al. Redox‐dependent loss of flavin by mitochondrial complex I in brain ischemia/reperfusion injury. Antioxid Redox Signal 2019;31:608‐622. [DOI] [PMC free article] [PubMed] [Google Scholar]
- 20.Muller X, Schlegel A, Kron P, Eshmuminov D, Würdinger M, Meierhofer D, et al. Novel real‐time prediction of liver graft function during hypothermic oxygenated machine perfusion before liver transplantation. Ann Surg 2019;270:783‐790. [DOI] [PubMed] [Google Scholar]
- 21.Koo B‐S, Lee D‐H, Kang P, Jeong K‐J, Lee S, Kim K, et al. Reference values of hematological and biochemical parameters in young‐adult cynomolgus monkey (Macaca fascicularis) and rhesus monkey (Macaca mulatta) anesthetized with ketamine hydrochloride. Lab Anim Res 2019;35:7. [DOI] [PMC free article] [PubMed] [Google Scholar]
Associated Data
This section collects any data citations, data availability statements, or supplementary materials included in this article.
Supplementary Materials
Fig S1
Table S1


