Abstract
Abdominal aortic aneurysm (AAA) and atherosclerosis (AS) have considerable similarities in clinical risk factors and molecular pathogenesis. The aim of our study was to investigate the differences between AAA and AS from the perspective of metabolomics, and to explore the potential mechanisms of differential metabolites via integration analysis with transcriptomics. Plasma samples from 32 AAA and 32 AS patients were applied to characterize the metabolite profiles using untargeted liquid chromatography-mass spectrometry (LC-MS). A total of 18 remarkably different metabolites were identified, and a combination of seven metabolites could potentially serve as a biomarker to distinguish AAA and AS, with an area under the curve (AUC) of 0.93. Subsequently, we analyzed both the metabolomics and transcriptomics data and found that seven metabolites, especially 2'-deoxy-D-ribose (2dDR), were significantly correlated with differentially expressed genes. In conclusion, our study presents a comprehensive landscape of plasma metabolites in AAA and AS patients, and provides a research direction for pathogenetic mechanisms in atherosclerotic AAA.
Keywords: Abdominal aortic aneurysm (AAA), Atherosclerosis (AS), Untargeted metabolomics, Transcriptomics
1. Introduction
Abdominal aortic aneurysm (AAA) is defined as a localized, permanent, and irreversible dilation of the abdominal aorta beyond 50% of the normal vessel diameter (Subcommittee on Reporting Standards for Arterial Aneurysms et al., 1991). AAA is a complex disease mainly occurring in the aging population and associated with a mortality rate of 85%‒90% after rupture (Alcorn et al., 1996; Kent, 2014). Atherosclerosis (AS) is well known to contribute to the occurrence of AAA, which shares common risk factors such as smoking, increasing age, family history, and male sex (Ito et al., 2008). The main pathological features of AAA include chronic inflammation, vascular smooth muscle cell apoptosis, extracellular matrix degradation, and thrombosis (Wassef et al., 2001; Pearce and Shively, 2006), which are also involved in vulnerable atherosclerotic plaque formation, illustrating that AS may be an important driver for AAA (Cornuz et al., 2004; Palazzuoli et al., 2008). However, genome-wide sequencing has revealed that although AAA and AS have similar genetic pathways in lipid metabolism, smooth muscle cell function, and inflammation regulation, there are a large number of independent pathogenic gene loci (Bradley et al., 2013; Harrison et al., 2013; Jones et al., 2013; Leeper et al., 2013). Currently, there is no general agreement about the relationship between AAA and AS, and thus it is necessary to explore the differences between these two diseases from other perspectives.
Recent studies have indicated that dietary pattern is associated with AAA risk, and diet affects the body through metabolites (Haring et al., 2018; Kaluza et al., 2019). Metabolomics is the newest member of the omics trilogy and has become a powerful tool for functional genomics research in the post-genomics era (Zampieri et al., 2017). Metabolomics is commonly divided into two types, including targeted and untargeted analyses. Targeted metabolomics is mostly used to identify and quantify a limited number of known metabolites. In contrast, untargeted metabolomics can explore far more species, whether known or unknown. The major advantage of untargeted metabolomics is the potential identification of new metabolites and pathways linked to pathophysiological processes and disease susceptibility (Johnson et al., 2016; Schrimpe-Rutledge et al., 2016).
During the past decade, extensive research has applied untargeted metabolomics to cardiovascular diseases, including AS (Ussher et al., 2016). Several metabolites have been shown to affect the progression of AS. For example, trimethylamine N-oxide (TMAO) is a small organic compound whose concentration in blood increases after ingesting dietary L-carnitine and phosphatidylcholine (Ufnal et al., 2015). An untargeted metabolomic study identified that TMAO was mechanistically linked with cardiovascular disease risk in humans (Li et al., 2018). Compared with AS, only a few metabolomic studies have been carried out on AAA (Qureshi et al., 2017). A group of linoleic acid-containing triacylglycerols and diacylglycerols were shown to be increased in AAA patients (n=161) compared to patients with peripheral artery disease (n=168) using targeted metabolomics (Moxon et al., 2014). However, the research has been restricted to limited comparisons of lipids. In addition, it is also important to realize that metabolic fluxes are regulated by environmental stresses in addition to gene expression; in other words, metabolomics is a level downstream from transcriptomics (Macel et al., 2010). Gene expression profiling is conducive to understanding the molecular mechanisms of complex disorders, including heart disease and metabolic disorders (Kim et al., 2010). By comparing the transcriptomic profiles of AAA patients and aortic occlusive disease (AOD) patients, Biros et al. (2015) found that immune-related pathways and several important genes (such as cytotoxic T-lymphocyte-associated protein 4 (CTLA4), natural killer cell triggering receptor (NKTR), and cluster of differentiation 8A (CD8A)) were involved in AAA pathogenesis. A recent study further explored the gene expression patterns for tunica and media. Lipid-related processes in the adventitia were found to be correlated with AAA growth rate (Lindquist Liljeqvist et al., 2020). Integration of transcriptomics and metabolomics can screen a large number of metabolites so as to identify the most important metabolites between AAA and AS.
The aim of the present study is to throw light on the differential metabolic profiling between AAA and AS using untargeted liquid chromatography-mass spectrometry (LC-MS), and then to identify potential mediators for distinguishing AAA and AS patients. Moreover, we combined analysis of differential metabolites with gene expression profiling from the database to explore the crucial metabolites and genes in the progression of atherosclerotic AAA.
2. Materials and methods
2.1. Patient recruitment and clinical data collection
All patients were recruited from the Department of Vascular Surgery, Peking Union Medical College Hospital (Beijing, China). Patients with AAA and AS diagnosed by ultrasound or computed tomography (CT)were included. Non-atherosclerotic aneurysms (infectious or inflammatory) were excluded. In order to ensure the consistency of the AS group, only patients with carotid atherosclerotic stenosis were selected. The degree of stenosis was determined according to the North American Symptomatic Carotid Endarterectomy Trial (NASCET) standard (NASCET collaborators, 1991), and all AS patients were at or above 70% of the standard. Patients with known history of disease with an autoimmune component (such as inflammatory bowel disease), history of malignancy, or any digestive tract disease and surgery were excluded.
Demographic and clinical data were collected from patients. The enumeration data were described in terms of frequency and percentage, and the measurement data were generally represented by mean±standard deviation (SD). Normally distributed variables between two groups were analyzed by Student's t-test. The Mann-Whitney U test was applied for data of this type that were not normally distributed. Categorical variables were compared by the χ 2 test. All these analyses were carried out with GraphPad Prism 7.04 software (GraphPad Inc., CA, USA). Differences were considered to be statistically significant when P was <0.05.
2.2. Sample collection
Peripheral blood samples were collected in the morning after an overnight fast (≥8 h). Plasma samples were obtained by centrifugation at 3000 r/min (1692 relative centrifugal force) for 10 min at room temperature (ThermoFisher, Sorvall ST 16R, Germany), and then rapidly frozen and stored at -80 °C until analyzed.
2.3. LC-MS analysis
Plasma samples from the included patients were prepared for ultra-high-performance liquid tandem chromatography-quadrupole time of flight mass spectrometry (UHPLC-QTOFMS) analysis by application of validated protocols (Dunn et al., 2011). The LC-MS data were analyzed by SMICA (Version 15.0.2; Sartorius Stedim Data Analytics AB, Umea, Sweden) to conduct multivariate statistical analysis (MVA). Peak devolution, alignment, and integration were applied and the minimum fraction (Minfrac) and cut-off were set as 0.5 and 0.3, respectively, as the stringency. We applied an in-house tandem mass spectrometry (MS2) database which was constructed based on the Human Metabolome Database (HMDB, https://hmdb.ca), MassBank of North America (MoNA, https://mona.fiehnlab.ucdavis.edu), and METLIN (https://metlin.scripps.edu) databases for metabolite identification. Differential metabolites were obtained by comparing AAA and AS patients using Student's t-test. We also conducted Kyoto encyclopedia of genes and genomes (KEGG) pathway analysis for these differential metabolites. Receiver operator characteristic curve (ROC) analysis was performed and linear Support Vector Machine (SVM) analysis was conducted using the Biomarker analysis section of MetaboAnalyst (Version 3.0; https://www.metaboanalyst.ca). The area under curve (AUC) was calculated to show the potential diagnostic value for differential metabolites.
2.4. Transcriptomic profiling analysis
To enable more in-depth understanding of the pathogenetic differences between AAA and AS from a multi-omics perspective, we also acquired transcriptomic profiling data for AAA and AS samples from dataset GSE57691 in the Gene Expression Omnibus (GEO) database. This dataset contains an independent cohort of patients and includes tissue samples instead of plasma samples, as we used. We downloaded the series matrix file and annotated the probe IDs with gene symbols using the GPL10558 platform data table to obtain a gene expression matrix. The "limma" R package (Version 3.48.1) was used to conduct differentially expressed gene (DEG) screening and screened DEGs were subjected to gene ontology (GO) and KEGG pathway analyses using the Database for Annotation, Visualization, and Integrated Discovery (DAVID) V6.8 ( https://david.ncifcrf.gov) to obtain the biological functions of these DEGs.
2.5. Joint analysis of metabolomics and transcriptomics
To integrate the multi-omics data, we calculated the Spearman's correlation indices for differential omics data and visualized it with a heatmap (Shannon et al., 2003).
3. Results
3.1. Clinical characteristics of AAA and AS patients
To compare the differences in plasma metabolites between AAA and AS, 32 AAA and 32 AS patients were included in this study. The clinical characteristics of these participants are shown in Table 1 (Ji et al., 2021). Patients with AAA were slightly older (P=0.019), but there were no differences in gender, body mass index (BMI), or underlying diseases such as hypertension and diabetes, which would affect metabolism. Plasma concentrations of C-reactive protein (CRP) and homocysteine (Hcy) did not differ statistically. In addition, we examined the blood lipid profile and found that the total cholesterol (TC) and low-density lipoprotein-cholesterol (LDL-C) of the AAA group were higher than those of the AS group, which may be due to the use of lipid-lowering drugs. For AAA patients, the maximum aneurysm diameter was (5.3±1.4) cm, and the involved length was (7.8±3.3) cm.
Table 1.
Clinical characteristics of the two groups
| Characteristics | AAA (n=32) | AS (n=32) | P-value |
|---|---|---|---|
| Age (year) | 68.6±5.7 | 64.5±6.7 | 0.019* |
| Male | 26 (81.3%) | 28 (87.5%) | 0.491 |
| BMI (kg/m2) | 24.2±3.5 | 24.7±2.7 | 0.573 |
| Hypertension | 18 (56.3%) | 12 (37.5%) | 0.133 |
| Diabetes | 7 (21.9%) | 6 (18.8%) | 0.756 |
| CRP (mg/dL) | 4.2±10.2 | 1.6±2.4 | 0.155 |
| Hcy (μmol/L) | 19.0±7.3 | 16.6±6.3 | 0.182 |
| TC (mmol/L) | 4.5±1.3 | 3.2±0.7 | <0.001* |
| TG (mmol/L) | 1.5±0.9 | 1.2±0.6 | 0.469 |
| HDL-C (mmol/L) | 1.0±0.2 | 1.0±0.2 | 0.550 |
| LDL-C (mmol/L) | 2.9±1.1 | 1.8±0.6 | <0.001* |
| Diameter (cm) | 5.3±1.4 | N/A | N/A |
| Length (cm) | 7.8±3.3 | N/A | N/A |
Data are expressed as mean±standard deviation (SD) or number (percentage). * represents the difference was statistically significant. AAA: abdominal aortic aneurysm; AS: atherosclerosis; BMI: body mass index; CRP: C-reactive protein; Hcy: homocysteine; TC: total cholesterol; TG: triglyceride; HDL-C: high-density lipoprotein-cholesterol; LDL-C: low-density lipoprotein-cholesterol; N/A: not available.
3.2. Metabolic profiling and functional analysis
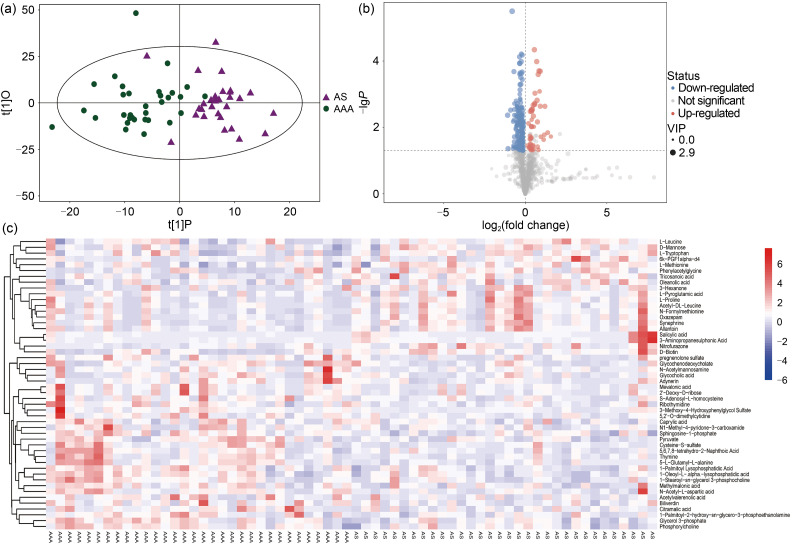
In all the samples from both groups, a total of 1606 metabolites were detected by LC-MS with negative ion mode, 299 of which could be qualitatively matched by MS. In order to visualize group separation and find significantly changed metabolites, we applied supervised orthogonal projections to latent structures-discriminate analysis (OPLS-DA). As revealed by OPLS-DA, the differences between the two groups of samples were quite significant, and the samples were basically in the 95% confidence interval (CI) (Fig. 1a). Furthermore, we obtained the value of variable importance from the projection (VIP) of the first principal component in OPLS-DA. This summarized the contribution of each variable to the model. The metabolites with VIP>1 and P<0.05 were considered to be significantly changed metabolites. It is evident from the volcano plot that there were 104 higher metabolites (30 qualitative metabolites) and 162 lower metabolites (20 qualitative metabolites) in the AAA group (Fig. 1b).
Fig. 1. Differential metabolites screening between AAA and AS patients. (a) The OPLS-DA showed that the samples are basically in the 95% CI, and AAA and AS patients can be clearly separated. (b) The volcano plot visually showed detected metabolites between the two groups. (c) The heatmap showed all 50 qualitative metabolites in the samples of two groups. AAA: abdominal aortic aneurysm; AS: atherosclerosis; VIP: variable importance from the projection; OPLS-DA: orthogonal projections to latent structures-discriminate analysis; CI: confidence interval.
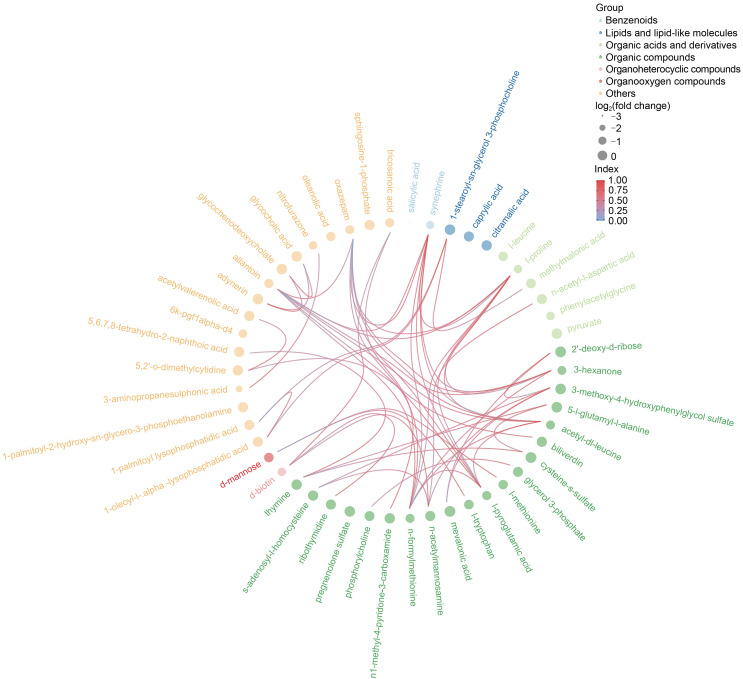
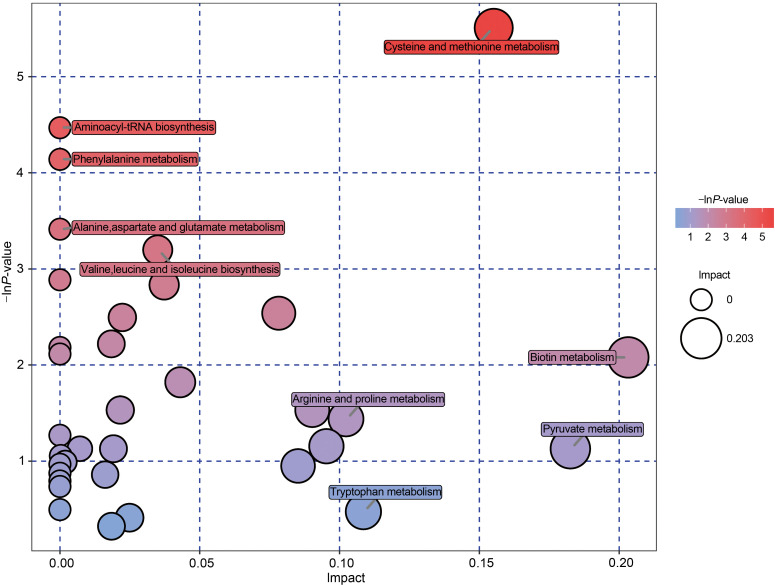
The differential metabolites obtained from the above analysis often have similarity and complementarity functions in biology, or are positively or negatively regulated by the same metabolic pathway, showing similar or opposite expression characteristics between the AAA and AS groups. Hierarchical clustering analysis of these characteristics classified the metabolites with the same characteristics into one group (Fig. 1c). Then we classified the different metabolites, calculated the related metabolites by Spearman analysis, and finally visualized them with a chord plot. All 50 metabolites were classified as benzenoids, lipids and lipid-like molecules, organic acids and derivatives, organic compounds, organoheterocyclic compounds, organooxygen compounds, or others (Fig. 2). In addition, commercial databases including KEGG and MetaboAnalyst were used for pathway enrichment analysis. We found that cysteine and methionine metabolism was the most significant pathway after enrichment analysis (Fig. 3).
Fig. 2. Chord plot analysis. All 50 differential metabolites were attributed to seven categories.
Fig. 3. Pathway enrichment analysis. Each bubble represents a metabolic pathway. The position at the abscissa and the size of the bubble represent the impact of the pathway. The position at the ordinate and the color of the bubble represent the enriched degree.
3.3. Filtration of differential metabolites between AAA and AS patients
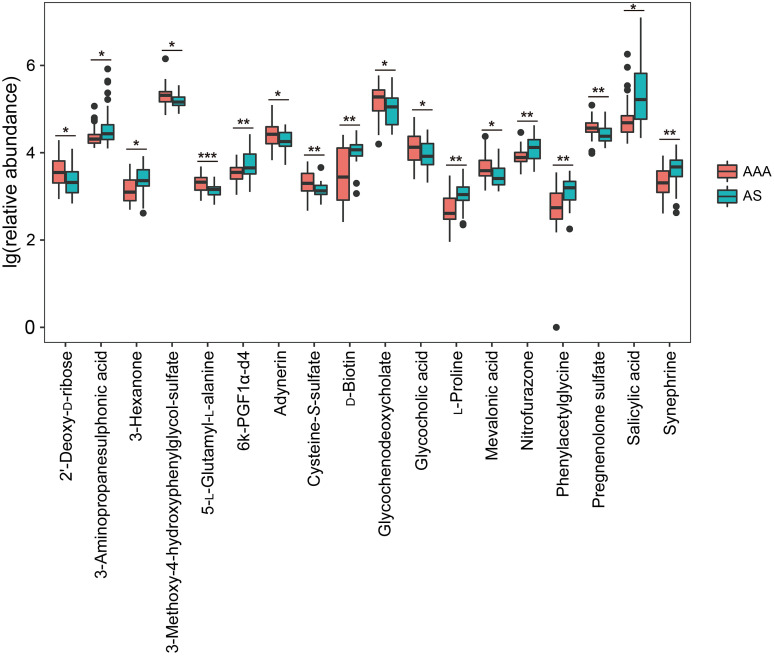
In order to reduce the number of differential metabolites for further analysis, the fold change was set as >1.50 or <0.67. Eighteen metabolites were confirmed: cysteine-S-sulfate, mevalonic acid, 5-L-glutamyl-L-alanine, 3-methoxy-4-hydroxyphenylglycol sulfate, pregnenolone sulfate, glycochenodeoxycholate, 2'-deoxy-D-ribose (2dDR), glycocholic acid, and adynerin were expressed more highly in the AAA group, and nine other metabolites were increased in the AS group (Fig. 4, Table S1).
Fig. 4. Filtered differential metabolites between AAA and AS patients. * P<0.05, ** P<0.01, *** P<0.001. AAA: abdominal aortic aneurysm; AS: atherosclerosis.
3.4. Subgroup analyses of differential metabolites in AAA patients
The threshold diameter for AAA repair is always set as 5.5 cm. To further examine the role of differential metabolites in AAA patients, we performed a subgroup comparative analysis between large (maximum diameter ≥5.5 cm, n=13) and small (maximum diameter <5.5 cm, n=19) AAAs. As shown in Table 2, 12 significantly differential metabolites were identified. For both this group of metabolites and the 18 filtered differential metabolites found when comparing AAA and AS, 2dDR was the only overlapping one.
Table 2.
Differential metabolites between large and small AAAs
| Metabolite | Mean | VIP | P-value | Fold change | |
|---|---|---|---|---|---|
| Large AAA | Small AAA | ||||
| 2dDR | 0.071 391 891 | 0.033 085 083 | 2.508 852 558 | 0.048 002 981 | 2.157 827 214 |
| Tridecanoic acid | 0.357 558 348 | 0.242 136 708 | 2.845 694 750 | 0.003 612 643 | 1.476 679 647 |
| Cellobiose | 0.012 745 954 | 0.008 677 840 | 2.135 654 099 | 0.029 007 197 | 1.468 793 321 |
| Acetohydroxamic acid | 0.028 123 177 | 0.020 150 806 | 1.759 087 615 | 0.042 008 168 | 1.395 635 331 |
| D-Ribose | 0.498 246 565 | 0.383 815 504 | 2.515 926 243 | 0.040 888 277 | 1.298 140 797 |
| D-Threitol | 0.388 525 175 | 0.445 448 059 | 1.612 862 776 | 0.047 210 139 | 0.872 212 073 |
| L-Valine | 1.501 790 518 | 1.725 737 775 | 2.053 685 057 | 0.021 940 332 | 0.870 231 005 |
| D-Mannose | 1.399 298 578 | 1.608 589 801 | 1.773 668 079 | 0.042 645 427 | 0.869 891 489 |
| L-Tryptophan | 1.189 142 462 | 1.410 047 883 | 2.275 400 929 | 0.019 603 593 | 0.843 334 809 |
| L-Methionine | 0.075 198 548 | 0.093 050 281 | 2.833 742 019 | 0.000 338 634 | 0.808 149 610 |
| L-Leucine | 2.837 439 159 | 3.565 975 188 | 2.651 520 606 | 0.004 620 671 | 0.795 697 954 |
| 3-Hydroxyisovaleric acid | 0.246 970 576 | 0.514 297 551 | 1.370 013 092 | 0.041 108 243 | 0.480 209 512 |
AAA: abdominal aortic aneurysm; VIP: the value of variable importance from the projection; 2dDR: 2'-Deoxy-D-ribose.
3.5. Diagnostic values of differential metabolites in AAA and AS patients
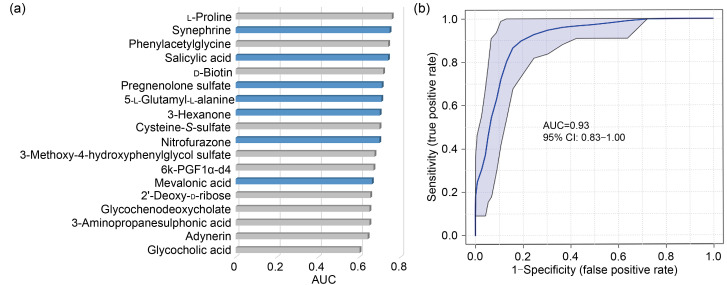
To test the diagnostic efficiencies of 18 selected metabolites between AAA and AS, an ROC was generated, and the AUC was computed for each incorporated feature (Fig. 5a). L-Proline had the highest AUC (0.76, 95% CI: 0.63–0.87) among all 18 metabolites, but was still insufficient to distinguish the two diseases. With the linear SVM algorithm, the best biomarker model was obtained by combining synephrine, salicylic acid, pregnenolone sulfate, 5-L-glutamyl-L-alanine, 3-hexanone, and nitrofurazone with mevalonic acid, and the peak AUC of the combined model was significantly higher than that of the single-metabolite model (AUC: 0.93, 95% CI: 0.83–1.00; Fig. 5b).
Fig. 5. ROC analysis for diagnostic values of differential metabolites. (a) Single variate analysis. Columns with blue color represent metabolites filtered by SVM algorithm. (b) Multivariate model using linear SVM algorithm (synephrine, salicylic acid, pregnenolone sulfate, 5-L-glutamyl-L-alanine, 3-hexanone, and nitrofurazone with mevalonic acid). AUC: area under the curve; ROC: receiver operator characteristic curve; SVM: support vector machine.
3.6. DEG screening and integration analysis
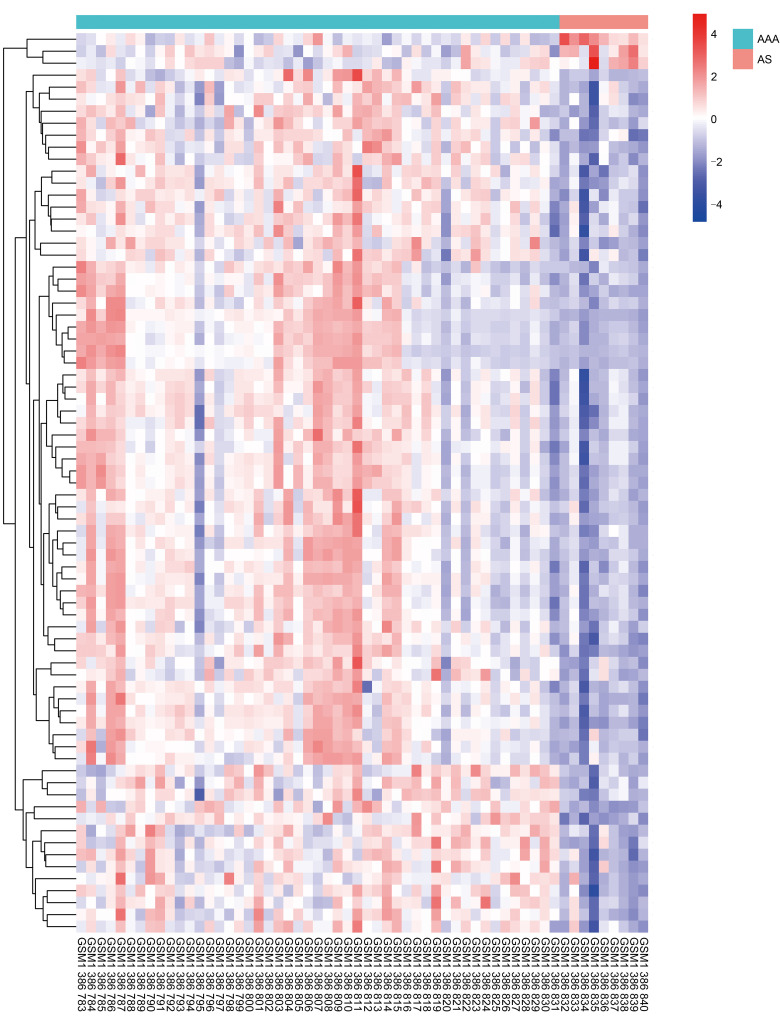
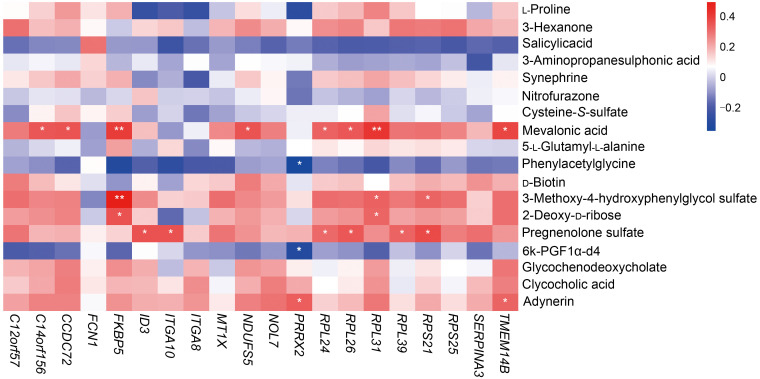
We selected 49 AAA samples and 9 AS atheroma samples from the GEO dataset (GSE57691). The threshold for DEG screening was set as |log2(fold change)|>1 and adjusted to P<0.01. In total, 75 DEGs were screened, of which 72 DEGs were up-regulated and 3 were down-regulated. The expression patterns of DEGs are shown in Fig. 6 and Table 3. The results of GO and KEGG pathway analyses are listed in Table S2. Spearman's correlation test was conducted between differential metabolites and DEGs to investigate the associations between two omics. Seven metabolites showed a correlation with transcriptomics, and the results were visualized as a correlation heatmap (Fig. 7). Furthermore, since GSE57691 also classified AAA samples into small AAA and large AAA, we conducted a subgroup analysis for AAA size integrating transcriptomics and metabolomics (Fig. S1).
Fig. 6. Heatmap showed DEGs between AAA and AS patients. AAA: abdominal aortic aneurysm; AS: atherosclerosis; DEG: differentially expressed gene.
Table 3.
Differentially expressed genes (DEGs) with top-20 |log2(fold change)|
| Gene symbol | Gene name | log2(fold change) | P-value |
|---|---|---|---|
| RPL31 | Ribosomal protein L31 | 2.947 149 | 8.12×10⁻⁹ |
| RPL26 | Ribosomal protein L26 | 2.841 221 | 0.020 029 |
| MT1X | Metallothionein 1X | 2.424 021 | 0.000 933 |
| RPL24 | Ribosomal protein L24 | 2.337 415 | 0.006 584 |
| ITGA8 | Integrin subunit α8 | 2.208 935 | 0.002 434 |
| RPL39 | Ribosomal protein L39 | 2.007 809 | 0.019 766 |
| SERPINA3 | Serpin family A member 3 | 1.626 579 | 0.006 732 |
| RPS25 | Ribosomal protein S25 | 1.554 147 | 0.007 467 |
| C12orf57 | Chromosome 12 open reading frame 57 | 1.523 047 | 0.000 357 |
| TMEM14B | Transmembrane protein 14B | 1.407 274 | 0.033 631 |
| CCDC72 | Translation machinery associated 7 homolog | 1.341 165 | 0.001 206 |
| PRRX2 | Paired-related homeobox 2 | 1.337 391 | 2.48×10⁻⁶ |
| FKBP5 | FKBP prolyl isomerase 5 | 1.325 069 | 0.000 432 |
| NDUFS5 | NADH:ubiquinone oxidoreductase subunit S5 | 1.307 802 | 0.018 787 |
| RPS21 | Ribosomal protein S21 | 1.271 324 | 0.007 063 |
| NOL7 | Nucleolar protein 7 | 1.258 512 | 0.031 010 |
| ITGA10 | Integrin subunit α10 | 1.253 124 | 0.000 379 |
| ID3 | Inhibitor of DNA binding 3, HLH protein | 1.244 650 | 0.001 011 |
| C14orf156 | SRA stem-loop interacting RNA binding protein | 1.230 766 | 0.042 435 |
| FCN1 | Ficolin 1 | -1.211 590 | 0.044 670 |
FKBP: FK506-binding protein; NADH: nicotinamide adenine dinucleotide; HLH: helix-loop-helix; SRA: steroid receptor RNA activator protein.
Fig. 7. Correlation analysis combined differential metabolites with expressed genes. * P<0.05, ** P<0.01.
4. Discussion
In this study, we performed a comprehensive untargeted metabolomic evaluation to explore the differences between AAA and AS in plasma metabolites, and further explored the associations between metabolites and expressed genes. First, we were able to identify a total of 18 differential metabolites between the two groups. Second, we discovered that the combination of synephrine, salicylic acid, pregnenolone sulfate, 5-L-glutamyl-L-alanine, 3-hexanone, nitrofurazone, and mevalonic acid could potentially serve as a biomarker for distinguishing between AAA and AS. Third, five metabolites including mevalonic acid, 3-methoxy-4-hydroxyphenylglycol sulfate, 2dDR, pregnenolone sulfate, and adynerin were found to be positively correlated with DEGs such as FK506-binding protein 5 (FKBP5), ribosomal protein L31 (RPL31), and RPL26.
AAA and AS are both complex multifactorial diseases with known environmental and genetic risk factors that contribute to disease development. On the one hand, AS represents an important independent risk factor for AAA, as patients with AAA often suffer from AS. The incidence of coronary artery disease in people with AAA was 53%, highlighting that AS is not likely to be a causal event in AAA (Ito et al., 2008). On the other hand, there are still some differences in clinical risk factors and deeper mechanisms between AAA and AS (Golledge and Norman, 2010). For example, diabetes is a risk factor which can lead to AS progressing, while some recent studies have observed that diabetes is independently associated with lower risk and small aortic diameter of AAA (Ning et al., 2020). Therefore, the relationships between AAA and AS remain unclear. More related studies from various perspectives and novel biomarkers with better clinical utility are needed. At present, AAA screening is mainly for men over 65 years old and offers lower cost effectiveness (US Preventive Services Task Force, 2019). It is valuable for disclosing the high-risk population for AAA in elderly patients with AS. In the current study, the AUC values were calculated for all identified metabolites using univariate ROC analyses. However, no metabolite was sensitive enough to be a biomarker, and the AUC values were between 0.60 and 0.76. Next, we manually selected combinations of metabolites to create biomarker models using linear SVM and found that a combination of synephrine, salicylic acid, pregnenolone sulfate, 5-L-glutamyl-L-alanine, 3-hexanone, and nitrofurazone with mevalonic acid could potentially serve as a biomarker to distinguish AAA and AS. It had an AUC of 0.93 and may set the stage for future research and clinical translation.
Among DEGs screened in transcriptomic analysis, RPL31 and RPL26 had the highest log2(fold change). RPL31 and RPL26 both belong to the ribosomal protein family. Gan et al. (2015) found that RPL31 was up-regulated in patients with Takayasu arteritis. RPL26 was found to play an important role in up-regulating p53 expression (Takagi et al., 2005). Although the role of p53 in aneurysm formation is not clear yet, Leeper et al. (2013) suggested that p53-dependent smooth muscle apoptosis might participate in AAA formation. In addition to an increase in p53 signaling, they also found a reduction of transformed mouse 3T3 cell double minute 2 (MDM2) in AAA formation. Since MDM2 was found to regulate p53 expression by inhibitory interactions with RPL26 (Ofir-Rosenfeld et al., 2008), we inferred that MDM2-RPL26-p53 axis might play a role in AAA formation.
Correlated analysis of transcriptomics data showed that five metabolites (mevalonic acid, 3-methoxy-4-hydroxyphenylglycol sulfate, 2dDR, pregnenolone sulfate, and adynerin) were positively correlated with differentially expressed genes, which all increased in AAA. 2dDR had the second largest fold change (1.71) between AAA and AS and was the only overlapping filtered metabolite in subgroup analysis (P=0.048), which deserves more attention. 2dDR is a deoxy-sugar derived from 2'-deoxy-D-1-phosphorylas, which also displays chemotactic activity in vitro (Haraguchi et al., 1994). A strong relationship between 2dDR and vascular endothelial growth factor (VEGF) was reported in a recent study (Dikici et al., 2020). VEGF and its receptors have a great pro-angiogenic effect through promoting the mobilization of inflammatory cells to pathological lesions, inducing the synthesis of pro-angiogenic factors by smooth muscle cells and more (Ferrara et al., 1991; Knox et al., 2001; Murakami et al., 2006; Ucuzian et al., 2010; van Hove and Benoit, 2015). Meanwhile, the significance of VEGF and angiogenesis in the development of AAA has already been confirmed. Pharmacological inhibition of VEGF substantially mitigates both AAA formation and further progression of established AAA in mice (Xu et al., 2019). In addition, 2dDR can induce cell apoptosis by provoking oxidative stress and reducing glutathione depletion (Ardestani et al., 2008; Fico et al., 2008). On the other hand, through integration analysis with transcriptomics data, FKBP5, a protein implicated in stress physiology, has been found to be positively correlated with 2dDR. A recent study revealed that upregulation of FKBP5 promotes nuclear factor-κB (NF-κB) signaling, which is a critical pro-inflammatory factor in AAA (Ma et al., 2018), by strengthening the interaction of key regulatory kinases, and NF-κB binding to the FKBP5 enhancer can in turn stimulate FKBP5 expression. The positive feedback loop eventually contributes to inflammation and cardiovascular risk (Zannas et al., 2019). It is plausible to hypothesize that 2dDR may promote the formation of AAA via angiogenesis and inflammation induced by upregulation of VEGF and NF-κB, as well as apoptosis of some key cells.
As this is a pilot study, there are several limitations in our work. First, the transcriptomics and metabolomics data were from different patients and samples. The integration analysis of the data for these two omics data can only be exploratory, because paired analysis using samples from the same patients would be more optimal. Second, the enrolled patients were from a single Chinese center, which had obvious regional characteristics. Third, in order to ensure consistency of the samples, all patients enrolled in the AS group suffered from carotid artery stenosis, and thus could not fully represent AS. Fourth, there are various factors that may have affected the plasma metabolites, such as diet and environment, and the AAA patients were also older than the AS patients ((68.6±5.7) vs. (64.5±6.7) years, P=0.019). We found that aging was associated with altered plasma triglyceride metabolism, for example in the mammalian target of rapamycin (mTOR) and adenosine 5'-monophosphate (AMP)-activated protein kinase (AMPK) pathways (Sharma and Ramanathan, 2020; Spitler and Davies, 2020) and our study did not take all these potential variations into consideration. Last but most important, the results need to be verified with a larger independent cohort of patients, the metabolites should be confirmed with their chemical standards, and all findings should be further confirmed by experimental models.
5. Conclusions
We carried out an untargeted metabolomic study with plasma samples from patients with AAA and AS, achieving identification of 18 metabolites that could be different in the progression of these two diseases. Filtered metabolites accurately distinguished AAA from AS with an AUC value of 0.93. In addition, combined with transcriptomics and a review of the literature, we found that 2dDR may be an important pathogenetic metabolite in the development of atherosclerotic AAA, which merits further research.
Supplementary information
Acknowledgments
This work was supported by the National Natural Science Foundation of China (Nos. 51890894, 81770481, and 82070492) and the Chinese Academy of Medical Sciences,Innovation Fund for Medical Sciences (CIFMS 2017-I2M-1-008). We thank Biotree (Shanghai, China) for assistance with LC-MS.
Author contributions
Lei JI and Siliang CHEN performed the experimental research and data analysis, wrote and edited the manuscript. Guangchao GU, Wei WANG, Jinrui Ren, Fang XU, Fangda LI, and Jianqiang WU collected the samples. Yuehong ZHENG, Dan YANG, Lei JI, and Siliang CHEN contributed to the study design, data analysis, writing and editing of the manuscript. All authors have read and approved the final manuscript and, therefore, have full access to all the data in the study and take responsibility for the integrity and security of the data.
Compliance with ethics guidelines
Lei JI, Siliang CHEN, Guangchao GU, Wei WANG, Jinrui REN, Fang XU, Fangda LI, Jianqiang WU, Dan YANG, and Yuehong ZHENG declare that they have no conflict of interest.
All procedures followed were in accordance with the ethical standards of the responsible committee on human experimentation (institutional and national) and with the Helsinki Declaration of 1975; as revised in 2008 (5). This study was approved by the Ethics Committee of the Peking Union Medical College Hospital, China (JS-2629). Informed consent was obtained from all patients for being included in the study. Additional informed consent was obtained from all patients for whom identifying information is included in this article.
References
- Alcorn HG, Wolfson SK, Sutton-Tyrrell K, et al. , 1996. Risk factors for abdominal aortic aneurysms in older adults enrolled in the Cardiovascular Health Study. Arterioscler Thromb Vasc Biol, 16(8): 963-970. 10.1161/01.atv.16.8.963 [DOI] [PubMed] [Google Scholar]
- Ardestani A, Yazdanparast R, Nejad AS, 2008. 2-Deoxy-D-ribose-induced oxidative stress causes apoptosis in human monocytic cells: prevention by pyridoxal-5'-phosphate. Toxicol in Vitro, 22(4): 968-979. 10.1016/j.tiv.2008.02.010 [DOI] [PubMed] [Google Scholar]
- Biros E, Gäbel G, Moran CS, et al. , 2015. Differential gene expression in human abdominal aortic aneurysm and aortic occlusive disease. Oncotarget, 6(15): 12984-12996. 10.18632/oncotarget.3848 [DOI] [PMC free article] [PubMed] [Google Scholar]
- Bradley DT, Hughes AE, Badger SA, et al. , 2013. A variant in LDLR is associated with abdominal aortic aneurysm. Circ Cardiovasc Genet, 6(5): 498-504. 10.1161/CIRCGENETICS.113.000165 [DOI] [PubMed] [Google Scholar]
- Cornuz J, Sidoti Pinto C, Tevaearai H, et al. , 2004. Risk factors for asymptomatic abdominal aortic aneurysm: systematic review and meta-analysis of population-based screening studies. Eur J Public Health, 14(4): 343-349. 10.1093/eurpub/14.4.343 [DOI] [PubMed] [Google Scholar]
- Dikici S, Bullock AJ, Yar M, et al. , 2020. 2-Deoxy-D-ribose (2dDR) upregulates vascular endothelial growth factor (VEGF) and stimulates angiogenesis. Microvasc Res, 131: 104035. 10.1016/j.mvr.2020.104035 [DOI] [PubMed] [Google Scholar]
- Dunn WB, Broadhurst D, Begley P, et al. , 2011. Procedures for large-scale metabolic profiling of serum and plasma using gas chromatography and liquid chromatography coupled to mass spectrometry. Nat Protoc, 6(7): 1060-1083. 10.1038/nprot.2011.335 [DOI] [PubMed] [Google Scholar]
- Ferrara N, Winer J, Burton T, 1991. Aortic smooth muscle cells express and secrete vascular endothelial growth factor. Growth Factors, 5(2): 141-148. 10.3109/08977199109000278 [DOI] [PubMed] [Google Scholar]
- Fico A, Manganelli G, Cigliano L, et al. , 2008. 2-Deoxy-D-ribose induces apoptosis by inhibiting the synthesis and increasing the efflux of glutathione. Free Radic Biol Med, 45(2): 211-217. 10.1016/j.freeradbiomed.2008.04.017 [DOI] [PubMed] [Google Scholar]
- Gan SJ, Ye B, Qian SX, et al. , 2015. Immune- and ribosome-related genes were associated with systemic vasculitis. Scand J Immunol, 81(2): 96-101. 10.1111/sji.12252 [DOI] [PubMed] [Google Scholar]
- Golledge J, Norman PE, 2010. Atherosclerosis and abdominal aortic aneurysm: cause, response, or common risk factors?Arterioscler Thromb Vasc Biol, 30(6): 1075-1077. 10.1161/ATVBAHA.110.206573 [DOI] [PMC free article] [PubMed] [Google Scholar]
- Haraguchi M, Miyadera K, Uemura K, et al. , 1994. Angiogenic activity of enzymes. Nature, 368(6468): 198. 10.1038/368198a0 [DOI] [PubMed] [Google Scholar]
- Haring B, Selvin E, He XT, et al. , 2018. Adherence to the dietary approaches to stop hypertension dietary pattern and risk of abdominal aortic aneurysm: results from the ARIC study. J Am Heart Assoc, 7(21): e009340. 10.1161/JAHA.118.009340 [DOI] [PMC free article] [PubMed] [Google Scholar]
- Harrison SC, Smith AJP, Jones GT, et al. , 2013. Interleukin-6 receptor pathways in abdominal aortic aneurysm. Eur Heart J, 34(48): 3707-3716. 10.1093/eurheartj/ehs354 [DOI] [PMC free article] [PubMed] [Google Scholar]
- Ito S, Akutsu K, Tamori Y, et al. , 2008. Differences in atherosclerotic profiles between patients with thoracic and abdominal aortic aneurysms. Am J Cardiol, 101(5): 696-699. 10.1016/j.amjcard.2007.10.039 [DOI] [PubMed] [Google Scholar]
- Ji L, Chen SL, Gu GC, et al. , 2021. Exploration of crucial mediators for carotid atherosclerosis pathogenesis through integration of microbiome, metabolome, and transcriptome. Front Physiol, 12: 645212. 10.3389/fphys.2021.645212 [DOI] [PMC free article] [PubMed] [Google Scholar]
- Johnson CH, Ivanisevic J, Siuzdak G, 2016. Metabolomics: beyond biomarkers and towards mechanisms. Nat Rev Mol Cell Biol, 17(7): 451-459. 10.1038/nrm.2016.25 [DOI] [PMC free article] [PubMed] [Google Scholar]
- Jones GT, Bown MJ, Gretarsdottir S, et al. , 2013. A sequence variant associated with sortilin-1 (SORT1) on 1p13.3 is independently associated with abdominal aortic aneurysm. Hum Mol Genet, 22(14): 2941-2947. 10.1093/hmg/ddt141 [DOI] [PMC free article] [PubMed] [Google Scholar]
- Kaluza J, Stackelberg O, Harris HR, et al. , 2019. Anti-inflammatory diet and risk of abdominal aortic aneurysm in two Swedish cohorts. Heart, 105(24): 1876-1883. 10.1136/heartjnl-2019-315031 [DOI] [PubMed] [Google Scholar]
- Kent KC, 2014. Abdominal aortic aneurysms. N Engl J Med, 371(22): 2101-2108. 10.1056/NEJMcp1401430 [DOI] [PubMed] [Google Scholar]
- Kim K, Zakharkin SO, Allison DB, 2010. Expectations, validity, and reality in gene expression profiling. J Clin Epidemiol, 63(9): 950-959. 10.1016/j.jclinepi.2010.02.018 [DOI] [PMC free article] [PubMed] [Google Scholar]
- Knox AJ, Corbett L, Stocks J, et al. , 2001. Human airway smooth muscle cells secrete vascular endothelial growth factor: up-regulation by bradykinin via a protein kinase C and prostanoid-dependent mechanism. FASEB J, 15(13): 2480-2488. 10.1096/fj.01-0256com [DOI] [PubMed] [Google Scholar]
- Leeper NJ, Raiesdana A, Kojima Y, et al. , 2013. Loss of CDKN2B promotes p53-dependent smooth muscle cell apoptosis and aneurysm formation. Arterioscler Thromb Vasc Biol, 33(1): e1-e10. 10.1161/atvbaha.112.300399 [DOI] [PMC free article] [PubMed] [Google Scholar]
- Li XS, Wang ZN, Cajka T, et al. , 2018. Untargeted metabolomics identifies trimethyllysine, a TMAO-producing nutrient precursor, as a predictor of incident cardiovascular disease risk. JCI Insight, 3(6): e99096. 10.1172/jci.insight.99096 [DOI] [PMC free article] [PubMed] [Google Scholar]
- Lindquist Liljeqvist M, Hultgren R, Bergman O, et al. , 2020. Tunica-specific transcriptome of abdominal aortic aneurysm and the effect of intraluminal thrombus, smoking, and diameter growth rate. Arterioscler Thromb Vasc Biol, 40(11): 2700-2713. 10.1161/atvbaha.120.314264 [DOI] [PubMed] [Google Scholar]
- Ma XH, Yao HR, Yang YH, et al. , 2018. miR-195 suppresses abdominal aortic aneurysm through the TNF-α/NF-κB and VEGF/PI3K/Akt pathway. Int J Mol Med, 41(4): 2350-2358. 10.3892/ijmm.2018.3426 [DOI] [PubMed] [Google Scholar]
- Macel M, van Dam NM, Keurentjes JJB, 2010. Metabolomics: the chemistry between ecology and genetics. Mol Ecol Resour, 10(4): 583-593. 10.1111/j.1755-0998.2010.02854.x [DOI] [PubMed] [Google Scholar]
- Moxon JV, Liu DW, Wong G, et al. , 2014. Comparison of the serum lipidome in patients with abdominal aortic aneurysm and peripheral artery disease. Circ Cardiovasc Genet, 7(1): 71-79. 10.1161/CIRCGENETICS.113.000343 [DOI] [PubMed] [Google Scholar]
- Murakami M, Iwai S, Hiratsuka S, et al. , 2006. Signaling of vascular endothelial growth factor receptor-1 tyrosine kinase promotes rheumatoid arthritis through activation of monocytes/macrophages. Blood, 108(6): 1849-1856. 10.1182/blood-2006-04-016030 [DOI] [PubMed] [Google Scholar]
- NASCET (North American Symptomatic Carotid Endarterectomy Trial) collaborators , 1991. Beneficial effect of carotid endarterectomy in symptomatic patients with high-grade carotid stenosis. N Engl J Med, 325(7): 445-453. 10.1056/NEJM199108153250701 [DOI] [PubMed] [Google Scholar]
- Ning XJ, Ding N, Ballew SH, et al. , 2020. Diabetes, its duration, and the long-term risk of abdominal aortic aneurysm: the Atherosclerosis Risk in Communities (ARIC) Study. Atherosclerosis, 313: 137-143. 10.1016/j.atherosclerosis.2020.09.031 [DOI] [PMC free article] [PubMed] [Google Scholar]
- Ofir-Rosenfeld Y, Boggs K, Michael D, et al. , 2008. Mdm2 regulates p53 mRNA translation through inhibitory interactions with ribosomal protein L26. Mol Cell, 32(2): 180-189. 10.1016/j.molcel.2008.08.031 [DOI] [PMC free article] [PubMed] [Google Scholar]
- Palazzuoli A, Gallotta M, Guerrieri G, et al. , 2008. Prevalence of risk factors, coronary and systemic atherosclerosis in abdominal aortic aneurysm: comparison with high cardiovascular risk population. Vasc Health Risk Manag, 4(4): 877-883. 10.2147/vhrm.s1866 [DOI] [PMC free article] [PubMed] [Google Scholar]
- Pearce WH, Shively VP, 2006. Abdominal aortic aneurysm as a complex multifactorial disease: interactions of polymorphisms of inflammatory genes, features of autoimmunity, and current status of MMPs. Ann N Y Acad Sci, 1085(1): 117-132. 10.1196/annals.1383.025 [DOI] [PubMed] [Google Scholar]
- Qureshi MI, Greco M, Vorkas PA, et al. , 2017. Application of metabolic profiling to abdominal aortic aneurysm research. J Proteome Res, 16(7): 2325-2332. 10.1021/acs.jproteome.6b00894 [DOI] [PubMed] [Google Scholar]
- Schrimpe-Rutledge AC, Codreanu SG, Sherrod SD, et al. , 2016. Untargeted metabolomics strategies-challenges and emerging directions. J Am Soc Mass Spectrom, 27(12): 1897-1905. 10.1007/s13361-016-1469-y [DOI] [PMC free article] [PubMed] [Google Scholar]
- Shannon P, Markiel A, Ozier O, et al. , 2003. Cytoscape: a software environment for integrated models of biomolecular interaction networks. Genome Res, 13(11): 2498-2504. 10.1101/gr.1239303 [DOI] [PMC free article] [PubMed] [Google Scholar]
- Sharma R, Ramanathan A, 2020. The aging metabolome-biomarkers to hub metabolites. Proteomics, 20(5-6): 1800407. 10.1002/pmic.201800407 [DOI] [PMC free article] [PubMed] [Google Scholar]
- Spitler KM, Davies BSJ, 2020. Aging and plasma triglyceride metabolism. J Lipid Res, 61(8): 1161-1167. 10.1194/jlr.R120000922 [DOI] [PMC free article] [PubMed] [Google Scholar]
- Subcommittee on Reporting Standards for Arterial Aneurysms, Ad Hoc Committee on Reporting Standards, Society for Vascular Surgery and North American Chapter, et al. , 1991. Suggested standards for reporting on arterial aneurysms. J Vasc Surg, 13(3): 452-458. 10.1067/mva.1991.26737 [DOI] [PubMed] [Google Scholar]
- Takagi M, Absalon MJ, McLure KG, et al. , 2005. Regulation of p53 translation and induction after DNA damage by ribosomal protein L26 and nucleolin. Cell, 123(1): 49-63. 10.1016/j.cell.2005.07.034 [DOI] [PubMed] [Google Scholar]
- Ucuzian AA, Gassman AA, East AT, et al. , 2010. Molecular mediators of angiogenesis. J Burn Care Res, 31(1): 158-175. 10.1097/BCR.0b013e3181c7ed82 [DOI] [PMC free article] [PubMed] [Google Scholar]
- Ufnal M, Zadlo A, Ostaszewski R, 2015. TMAO: a small molecule of great expectations. Nutrition, 31(11-12): 1317-1323. 10.1016/j.nut.2015.05.006 [DOI] [PubMed] [Google Scholar]
- US Preventive Services Task Force , 2019. Screening for abdominal aortic aneurysm: US Preventive Services Task Force Recommendation Statement. JAMA, 322(22): 2211-2218. 10.1001/jama.2019.18928 [DOI] [PubMed] [Google Scholar]
- Ussher JR, Elmariah S, Gerszten RE, et al. , 2016. The emerging role of metabolomics in the diagnosis and prognosis of cardiovascular disease. J Am Coll Cardiol, 68(25): 2850-2870. 10.1016/j.jacc.2016.09.972 [DOI] [PubMed] [Google Scholar]
- van Hove AH, Benoit DSW, 2015. Depot-based delivery systems for pro-angiogenic peptides: a review. Front Bioeng Biotechnol, 3: 102. 10.3389/fbioe.2015.00102 [DOI] [PMC free article] [PubMed] [Google Scholar]
- Wassef M, Baxter BT, Chisholm RL, et al. , 2001. Pathogenesis of abdominal aortic aneurysms: a multidisciplinary research program supported by the National Heart, Lung, and Blood Institute. J Vasc Surg, 34(4): 730-738. 10.1067/mva.2001.116966 [DOI] [PubMed] [Google Scholar]
- Xu BH, Iida Y, Glover KJ, et al. , 2019. Inhibition of VEGF (vascular endothelial growth factor)-A or its receptor activity suppresses experimental aneurysm progression in the aortic elastase infusion model. Arterioscler Thromb Vasc Biol, 39(8): 1652-1666. 10.1161/ATVBAHA.119.312497 [DOI] [PMC free article] [PubMed] [Google Scholar]
- Zampieri M, Sekar K, Zamboni N, et al. , 2017. Frontiers of high-throughput metabolomics. Curr Opin Chem Biol, 36: 15-23. 10.1016/j.cbpa.2016.12.006 [DOI] [PubMed] [Google Scholar]
- Zannas AS, Jia MW, Hafner K, et al. , 2019. Epigenetic upregulation of FKBP5 by aging and stress contributes to NF-κB-driven inflammation and cardiovascular risk. Proc Natl Acad Sci USA, 116(23): 11370-11379. 10.1073/pnas.1816847116 [DOI] [PMC free article] [PubMed] [Google Scholar]
Associated Data
This section collects any data citations, data availability statements, or supplementary materials included in this article.


