

Abstract
Acute lymphoblastic leukemia (ALL) is a hematopoietic malignancy comprised of molecular subtypes largely characterized by aneuploidy or recurring chromosomal rearrangements. Despite extensive information on the ALL transcriptome and methylome, there is limited understanding of the ALL chromatin landscape. We therefore mapped accessible chromatin in 24 primary ALL cell biospecimens comprising three common molecular subtypes (DUX4/ERG, ETV6-RUNX1 and hyperdiploid) from patients treated at St. Jude Children’s Research Hospital. Our findings highlight extensive chromatin reprogramming in ALL, including the identification ALL subtype-specific chromatin landscapes that are additionally modulated by genetic variation. Chromatin accessibility differences between ALL and normal B-cells implicate the activation of B-cell repressed chromatin domains and detail the disruption of normal B-cell development in ALL. Among ALL subtypes, we uncovered roles for basic helix-loop-helix, homeodomain and activator protein 1 transcription factors in promoting subtype-specific chromatin accessibility and distinct gene regulatory networks. In addition to chromatin subtype-specificity, we further identified over 3500 DNA sequence variants that alter the ALL chromatin landscape and contribute to inter-individual variability in chromatin accessibility. Collectively, our data suggest that subtype-specific chromatin landscapes and gene regulatory network impact ALL biology and contribute to transcriptomic differences among ALL subtypes.
INTRODUCTION
Acute lymphoblastic leukemia (ALL) is a heterogeneous hematopoietic malignancy, and it is the most common cancer in children (1). The vast majority (85-90%) of ALL stems from B-lineage precursor cells (B-ALL) (2). B-ALL is further classified into distinct molecular subtypes based on specific malignant drivers, including gene fusions, translocations, complex rearrangements and/or aneuploidy (2). In addition to these pronounced genetic alterations, cooperating mutations in key transcription factor (TF) genes and other genes encoding signaling molecules have been identified and impact malignant transformation (2).
Although investigations of ALL transcriptomes (3, 4) and methylomes (5, 6) have been performed, there is limited understanding of the ALL chromatin landscape, including the extent to which the chromatin environment differs among ALL subtypes or between normal hematopoietic cells and ALL cells. To better understand ALL chromatin structure, we mapped accessible chromatin sites, a marker of active cis-regulatory elements (7), in a panel of 24 primary ALL cell biospecimens from patients treated at St. Jude Children’s Research Hospital using Assay for Transposase Accessible Chromatin followed by next-generation sequencing (ATAC-seq) (8, 9). These primary ALL samples comprised three common molecular subtypes, ETV6-RUNX1, DUX4/ERG and hyperdiploid, that collectively make up 65-70% of childhood standard-risk patients (10). ETV6-RUNX1 ALL is the most commonly diagnosed B-ALL subtype (~25% of ALL patients), and is characterized by a t(12;21)(p13;q22) translocation encoding an ETV6-RUNX1 gene fusion (11). DUX4/ERG ALL is characterized by genetic alterations in DUX4 and ERG genes that comprises ~7% of diagnosed childhood ALL cases (12). In this subtype, DUX4, a homeobox TF (13), becomes deregulated due to complex rearrangements (14). While ETV6-RUNX1 and DUX4/ERG are characterized by more focal genomic alterations, hyperdiploid ALL is a heterogeneous subtype that is characterized by gain of at least 5 chromosomes and is seen in around 20% of ALL patients (15). Consequently, these diverse ALL patient samples allowed us to further assess differences in chromatin landscapes among common molecular subtypes harboring distinct types of malignant driver events: gene fusions, complex translocations and aneuploidy.
We mapped over 150,000 sites of accessible chromatin harboring over 1 million TF footprints in primary ALL cells. To further expand on our findings, we integrated our open chromatin maps with diverse orthogonal genomic datasets obtained from the corresponding patient ALL cell sample. Collectively, our functional genomic profiling demonstrates high diversity in ALL chromatin landscapes among ALL subtypes and across individual patient biospecimens, thereby highlighting the complexity and importance of the epigenome in the regulation of ALL cell biology.
MATERIALS/SUBJECTS AND METHODS
Patient samples
Written informed consent was obtained from all patients or their legal guardians. These samples were collected as part of St. Jude Total Therapy XVI and the use of these samples was approved by the institutional review board at St. Jude Children’s Research Hospital. ATAC-seq and RNA-seq data from patient biospecimens have been deposited to NCBI Gene Expression Omnibus (GSE161501).
Genomic experimentation and functional studies
We performed FAST-ATAC (9) on 10,000 cryopreserved primary ALL cells and 10,000 fresh cells from ALL cell lines. ALL cell line data can be found on the NCBI Gene Expression Omnibus (GSE129066). Total RNA was purified from patient samples using the Norgen Total RNA Purification Kit for RNA-seq. ATAC-seq and RNA-seq next-generation sequencing (NGS) was performed at the Hartwell Center for Bioinformatics and Biotechnology at St. Jude. ChIP-seq was performed as previously described (16). Normal hematopoietic cell ATAC-seq and RNA-seq fastq files (9, 17) were downloaded from NCBI (GSE74912 and GSE118189). Illumina Infinium HumanMethylation450K CpG DNA methylation array data (18) from patient ALL samples were obtained from NCBI (GSE66708). SNP genotyping data from patient ALL samples was obtained from published studies (18). ChromHMM (19, 20) data from GM12878 cell line was downloaded from the UCSC genome browser (https://genome.ucsc.edu/) whereas primary B-cell chromatin ChIP-seq data was downloaded from the Blueprint Epigenome Consortium (https://www.blueprint-epigenome.eu/). More detailed information, including CRISPR/Cas9 genome editing experimentation, is provided in supplemental methods.
Data Analysis
ATAC-seq and RNA-seq NGS reads were mapped to the hg19 reference genome using bowtie2 (21) and ATAC-seq peaks were identified using MACS2 (22). Differentially accessible sites and differentially expressed genes were identified using DESeq2 (23). HINT-ATAC (24) was used to identify TF footprints and TF activity scores. TF gene regulatory networks was generated by Paired Expression and Chromatin Accessibility data (PECA) (25). caQTLs were identified by WASP (26). Pathogenicity scores were determined using Combined Annotation Dependent Depletion (CADD) (27). More detailed information is provided in supplemental methods.
RESULTS
Extensive chromatin reprogramming between ALL cells and normal hematopoietic cells
We performed ATAC-seq (9) on primary ALL cell biospecimens from 24 patients treated at St. Jude to identify regions of accessible chromatin in the ALL genome (Supplemental Table 1). These primary ALL samples were comprised of ETV6-RUNX1 (n=6), DUX4/ERG (n=7) and hyperdiploid (n=11) B-ALL subtypes and we identified 60,516 accessible chromatin sites, on average, in each sample, and 169,423 sites were identified across all samples. We first compared our ALL open chromatin maps to normal hematopoietic cells. For this analysis, we combined our accessible chromatin sites from the ALL genome with accessible chromatin sites from normal hematopoietic cells from published ATAC-seq datasets (9, 17) and performed quantitative analyses using normalized read depth at 306,691 accessible chromatin sites identified across all samples. Unsupervised hierarchical clustering of pair-wise Spearman rank correlations successfully distinguished ALL cells from normal hematopoietic cells, and normal hematopoietic cells were appropriately clustered based on their cell lineage and developmental timepoint (Fig. 1A), whereas principal component analysis (PCA) reflected a directionality mirroring hematopoietic cell differentiation and maturation (Fig. 1A–B). Notably, ALL cell biospecimens clustered between common lymphoid progenitors (CLP) and mature B-cells, accurately delineating the pathophysiology of B-ALL from immature lymphocytes (Fig. 1A–B).
FIGURE 1. Extensive chromatin reprogramming between ALL and normal B-cells.
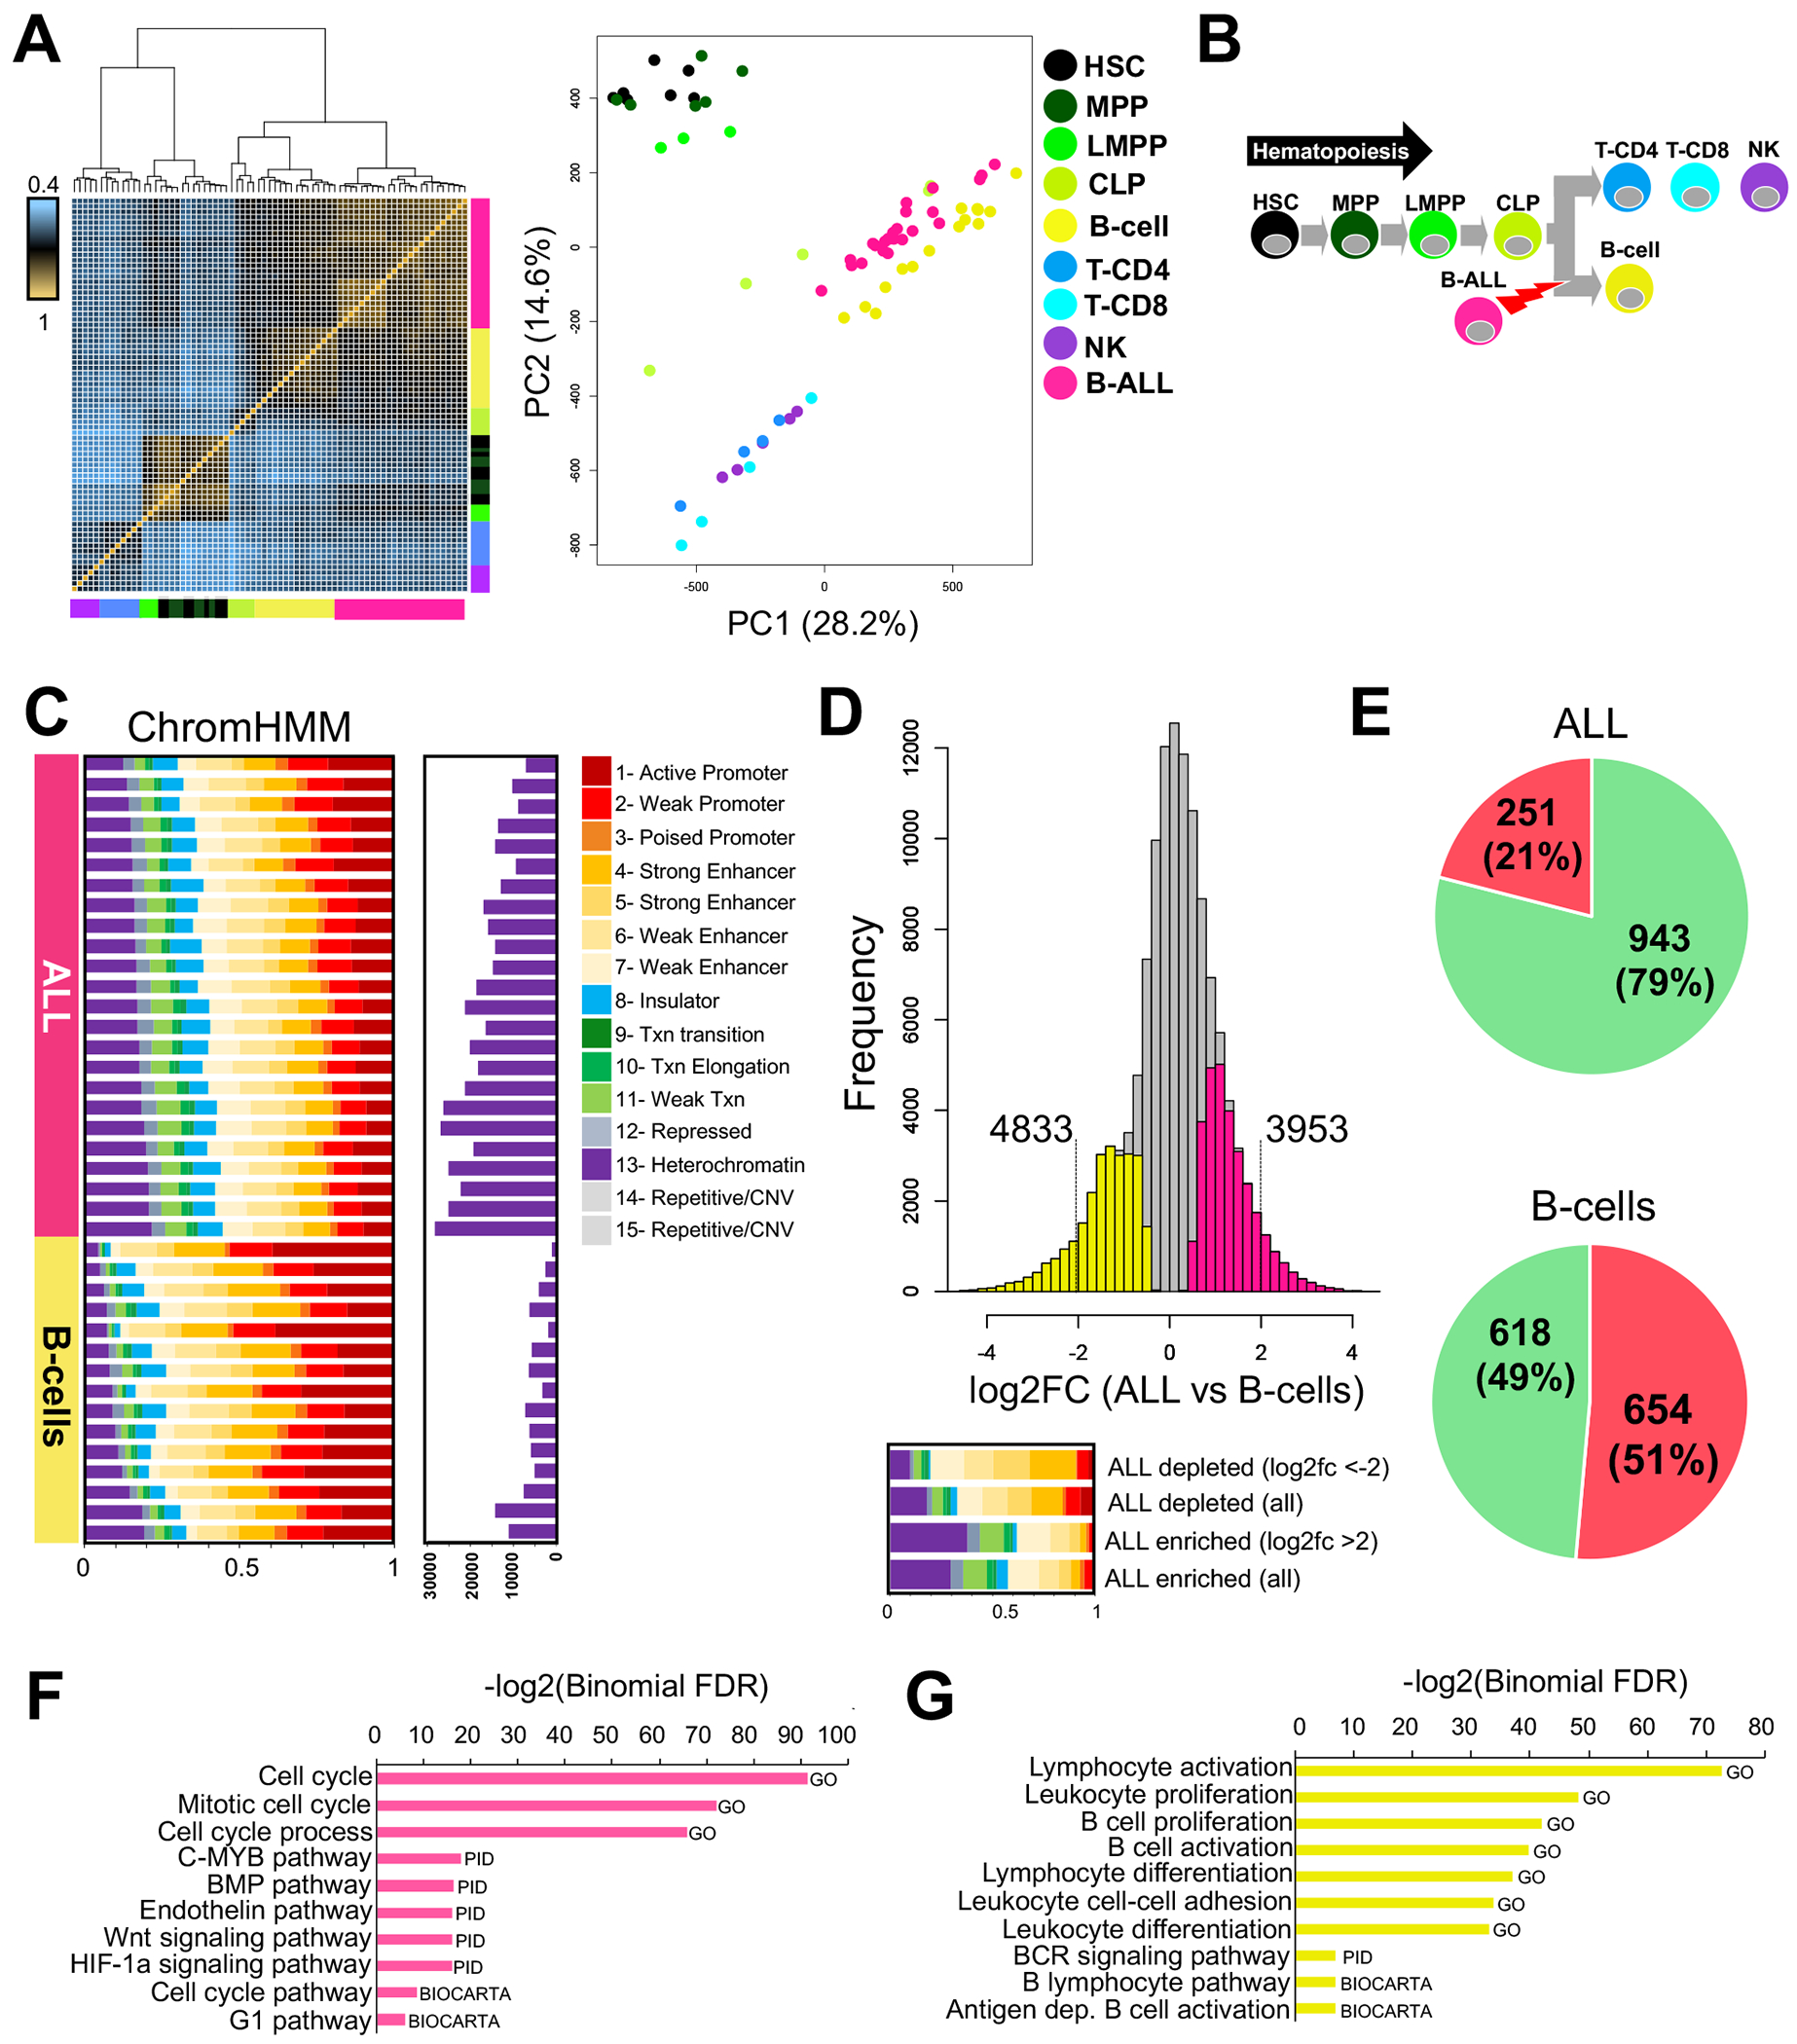
(A) Unsupervised hierarchical clustering heatmap of ALL with normal hematopoietic cells is depicted on the left. PCA plot of normalized read depth at open chromatin sites is shown on the right. HSC=hematopoietic stem cell; MPP=multipotent progenitor cell; LMPP=lymphoid-primed multipotent progenitor cell; CLP=common lymphoid progenitor cell; B-cell=normal B lymphocyte; T-CD4= CD4+ T lymphocyte; T-CD8= CD8+ T lymphocyte; NK=natural killer cell; B-ALL= B-cell acute lymphoblastic leukemia. (B) Schematic of hematopoiesis is shown and includes the developmental stage where B-ALL occurs. (C) Fraction of diverse ChromHMM chromatin states from GM12878 that map to open chromatin sites in ALL (n=24) and normal B-cells (n=15). At the right, the number of open chromatin sites that map to heterochromatin domains in GM12878 is provided. (D) Histogram depicting differentially accessible ATAC-seq sites between ALL cells and normal B-cells. The frequency of log2 fold changes (log2FC) in normalized read depth at the union of all reproducible open chromatin sites in ALL cells and normal B-cells is provided. Sites that are significantly more accessible (FDR<0.01) in ALL (pink) and normal B-cells (yellow) are shown, and the number of sites exhibiting extreme changes (absolute log2FC >2) is provided. Fraction of diverse ChromHMM states at enriched and depleted ALL sites is shown below. (E) Pie charts show the total number and percentage of up- (green) and down- (red) regulated genes associated with extremely accessible sites (absolute log2FC >2) in ALL cells (left) or B-cells (right). Gene set enrichment analysis (GSEA) depicting biological pathways (x-axis) and their significance (y-axis) is provided for differentially expressed genes associated with extremely accessible sites in ALL (F) and normal B-cells (G).
We next accessed chromatin accessibility changes between ALL cells (n=24) and normal B-cells (n=15). Using Chromatin State Segmentation by HMM (ChromHMM) data (19, 20) from the GM12878 B-cell lymphoblastoid cell line that is typically used to model B-cells, we identified striking differences in chromatin state between ALL cells and B-cells (Fig. 1C). Most notably, compared to normal B-cells, a significantly greater fraction of ALL accessible chromatin sites map to heterochromatin (ChromHMM state 13; 0.29 vs 0.14; Wilcoxon p = 2.16×10⁻⁸), weak enhancers (ChromHMM state 7; 0.15 vs 0.08, Wilcoxon p = 3.53×10⁻⁷) and repressed chromatin state (ChromHMM state 12; 0.07 vs 0.03; Wilcoxon p = 1.11×10⁻⁸) in GM12878. Further supporting these observations, consistent patterns in chromatin state were uncovered between ALL cells and normal B-cells when we utilized chromatin data from primary B-cells (Supplemental Fig. 1). Collectively, these data suggest that ALL chromatin reprogramming involves the activation of cis-regulatory elements from B-cell repressed chromatin domains.
We further mapped differentially accessible chromatin sites between ALL cells and normal B-cells. We mapped 55,251 differentially accessible open chromatin sites (FDR<0.01) between ALL cells and B-cells (Fig. 1D). In concordance with chromatin state profiling, a larger fraction of ALL enriched sites mapped to heterochromatin compared to ALL depleted sites (0.59 vs 0.33) in GM12878, and this pattern became even more pronounced for ALL enriched sites exhibiting extreme changes in chromatin accessibility (absolute log2FC >2; 0.68 vs 0.18). Using the Genomic Regions Enrichment of Annotations Tool (GREAT) (28), we identified genes that were associated with sites exhibiting extreme changes in chromatin accessibility between ALL and B-cells (absolute log2FC >2; Fig. 1D). To identify which associated genes were likely targets for these differentially accessible sites, we obtained published RNA-seq gene expression data from normal B-cells (n=15) (9, 17) and performed RNA-seq in a subset of our ALL cell biospecimens that had sufficient genetic material (n=19). Differential expression analysis identified 10,649 genes that exhibited large changes in expression between ALL cells and B-cells (absolute log2FC >2). By comparing these differentially expressed genes to those associated with differentially accessible sites, we mapped 1272 and 1194 candidate target genes in ALL cells and B-cells respectively (Fig. 1E). B-cell accessible sites were equally associated with both up- and down-regulated genes in B-cells (49% versus 51%). By contrast, sites exhibiting substantially stronger accessibility in ALL cells were preferentially associated with genes up-regulated in ALL (79% versus 21% of target genes; chi-square p<2.2×10⁻¹⁶). Consequently, these data suggest that ALL accessible chromatin sites play a predominant role in gene activation. Through Gene Set Enrichment Analysis (GSEA) (29), we further uncovered that repressed genes in ALL cells were involved in leukocyte and lymphocyte biology, whereas genes upregulated in ALL cells were involved in cell cycle control and diverse oncogenic signaling pathways (Fig. 1F–G). Overall, these data suggest that ALL cells harbor widely distinct chromatin landscapes compared to normal hematopoietic cells, and the extensive epigenetic reprogramming of ALL cells promotes the dysregulation of numerous genetic pathways.
Chromatin accessibility discriminates ALL molecular subtypes
We assessed open chromatin landscape differences between molecular subtypes of ALL using accessible chromatin sites that were reproducibly identified in each ALL subtype (Fig. 2A). Across accessible chromatin sites, only 45% were identified in all 3 subtypes, supporting a high degree of open chromatin heterogeneity among ALL subtypes. In concordance with this observation, unsupervised hierarchical clustering of pair-wise Spearman rank correlations successfully identified and grouped patient samples by molecular subtype, as did PCA analysis on normalized read depth (Fig. 2B). Notably, we obtained similar results when we used all open chromatin sites identified in the ALL genome (Supplemental Fig. 2).
FIGURE 2. Open chromatin heterogeneity among ALL molecular subtypes.
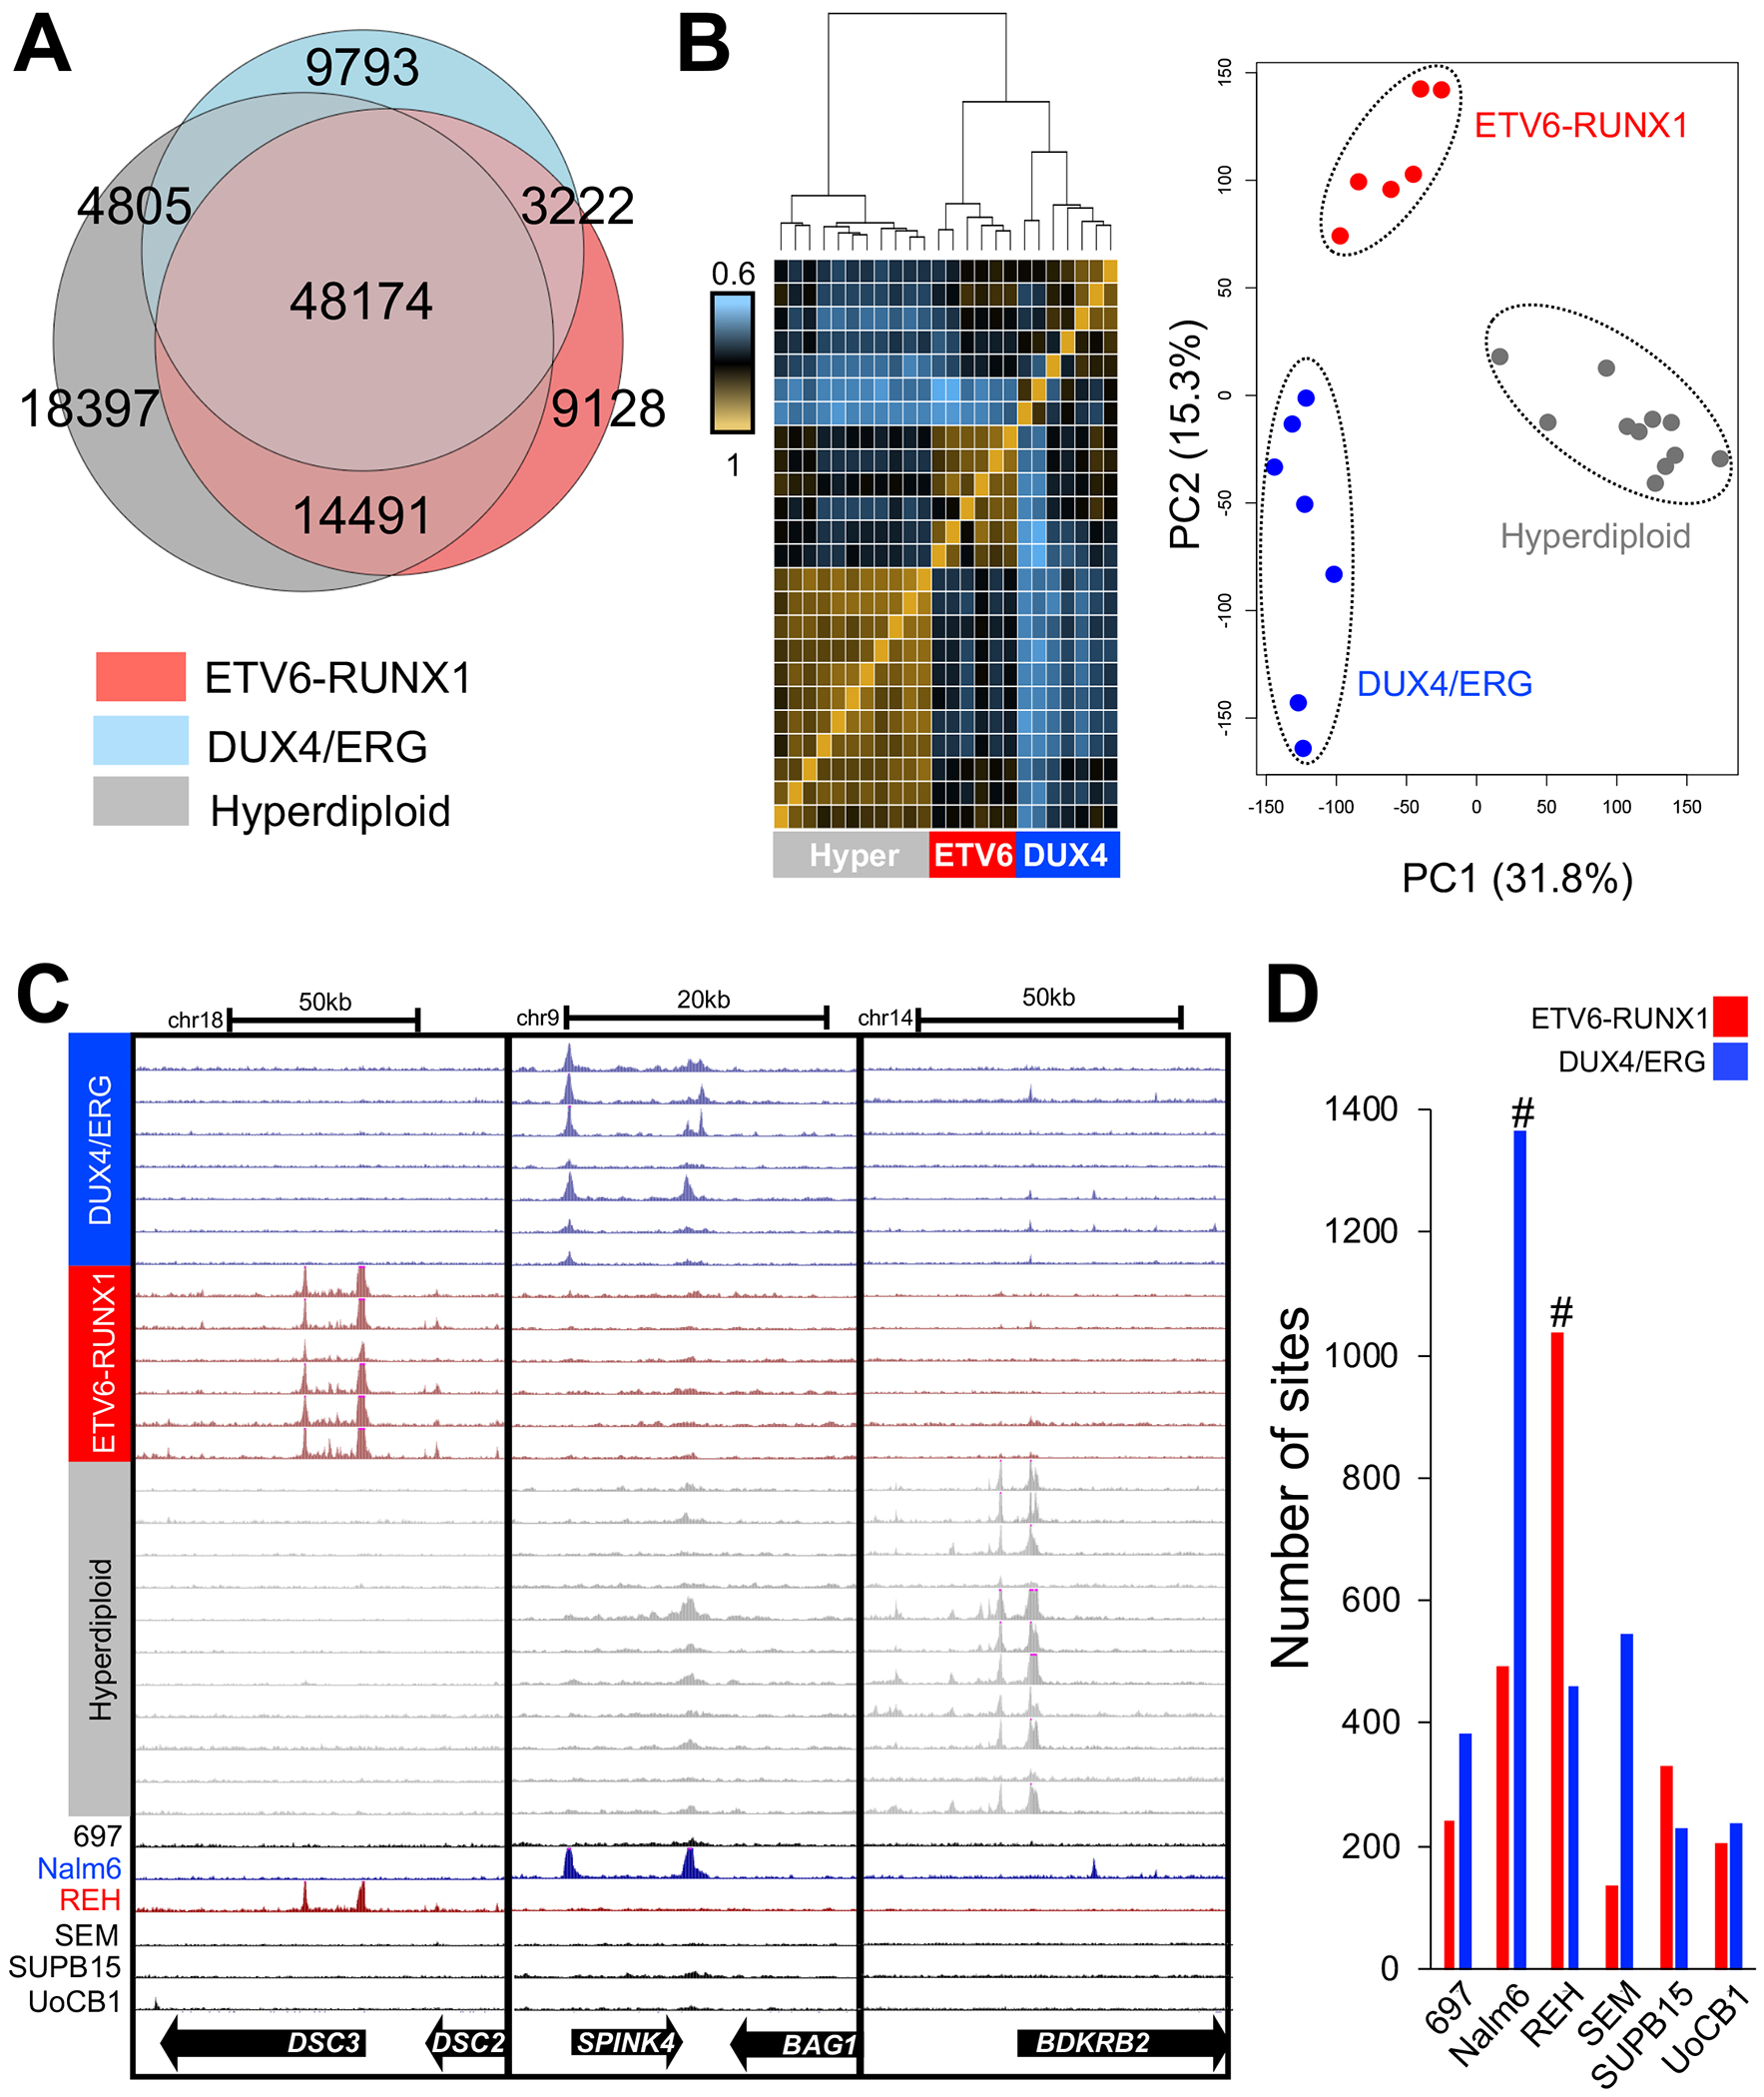
(A) Venn diagrams depict overlap in open chromatin sites among ALL subtypes. (B) Unsupervised hierarchical clustering heatmap of Spearman rank correlations from pair-wise comparisons of normalized open chromatin site read counts between ALL cell samples is depicted on the left. The heatmap denotes the rho value between pair-wise ALL sample comparisons. PCA plot of normalized read depth at open chromatin sites is shown on the right. (C) Examples of genomic loci harboring open chromatin sites exhibiting differences in chromatin accessibility between ALL subtypes. Open chromatin accessibility from human ALL cell lines and locations of genes is provided below. (D) Across a panel of B-ALL cell lines (x-axis), a bar plot delineates the number of ETV6-RUNX1-accessible sites (red) and DUX4/ERG-accessible sites (blue) that exhibited the strongest accessibility in each ALL cell line. Hashtags denote the number of ETV6-RUNX1-accessible sites in REH cells and the number of DUX4/ERG-accessible sites in Nalm6 cells.
To evaluate these observations further, we mapped differentially accessible chromatin sites among the ALL subtypes (Fig. 2C). Integration of our results from all pair-wise analyses between subtypes uncovered 3571, 5891 and 6425 open chromatin sites that exhibited consistently greater accessibility (FDR<0.05) in ETV6-RUNX1, DUX4/ERG and hyperdiploid ALL, respectively, compared to opposing subtypes (hereafter referred to as subtype-accessible sites; Supplemental Tables 2–4). In addition, we mapped 2804, 4740 and 4257 open chromatin sites that exhibited consistently lower accessibility (FDR<0.05) in ETV6-RUNX1, DUX4/ERG and hyperdiploid ALL (hereafter referred to as subtype-depleted sites; Supplemental Tables 5–7). Notably, the vast majority of subtype-accessible sites (>88%) were distal to transcription start sites (>+/−5kb), which is concordant with observations from other cell types that describe promoter-distal cis-regulatory elements as playing a role in lineage-specificity (9, 30).
We next determined if subtype-accessible sites from primary ALL cells exhibited consistent subtype enrichment patterns in a panel of human ALL cell lines (Fig. 2D). We focused our efforts on 6 relevant ALL cell lines representative of diverse B-ALL subtypes that included REH (ETV6-RUNX1), Nalm6 (DUX4/ERG-like), SEM (KMT2A-rearranged), SUPB15 (BCR-ABL), UoCB1 (TCF3-HLF), and 697 (TCF3-PBX1)). Overall, we uncovered that B-ALL cell line open chromatin landscapes predominantly clustered together, underscoring substantial epigenomic differences among primary ALL cells and immortalized ALL cell lines (Supplemental Fig. 3). Nonetheless, we found that 42.5% of ETV6-RUNX1-accessible sites from primary cells exhibited the strongest accessibility in the ETV6-RUNX1 subtype REH cell line, whereas 42.4% of DUX4/ERG-accessible sites from primary cells exhibited the strongest accessibility in the DUX4/ERG-like subtype Nalm6 cell line. By contrast, only 11.5% of ETV6-RUNX1-accessible sites and DUX4/ERG-accessible sites from primary cells, on average, displayed stronger accessibility in non-ETV6-RUNX1 and non-DUX4/ERG cell lines, respectively (number of overlapping sites in corresponding subtype cell lines versus opposing subtype cell lines, Wilcoxon p=0.03). Collectively, these cell line data corroborate our open chromatin accessibility maps derived from primary cells and suggest that our observations of subtype-specificity are translatable to a broader panel of ALL subtypes.
ALL subtypes harbor distinct transcription factor footprints and activities
Regions of accessible chromatin harbor footprints that correspond to TF protein binding events (24). We therefore mapped TF footprints within accessible chromatin sites to identify candidate TFs implicated in ALL subtype biology. We identified 1,107,106 TF footprints across all subtypes (Fig. 3A). In concordance with extensive subtype-specificity in open chromatin landscapes, we uncovered that 64% of TF footprints (709,794) were subtype-specific.
FIGURE 3. Distinct TF footprints and TF activities among ALL molecular subtypes.
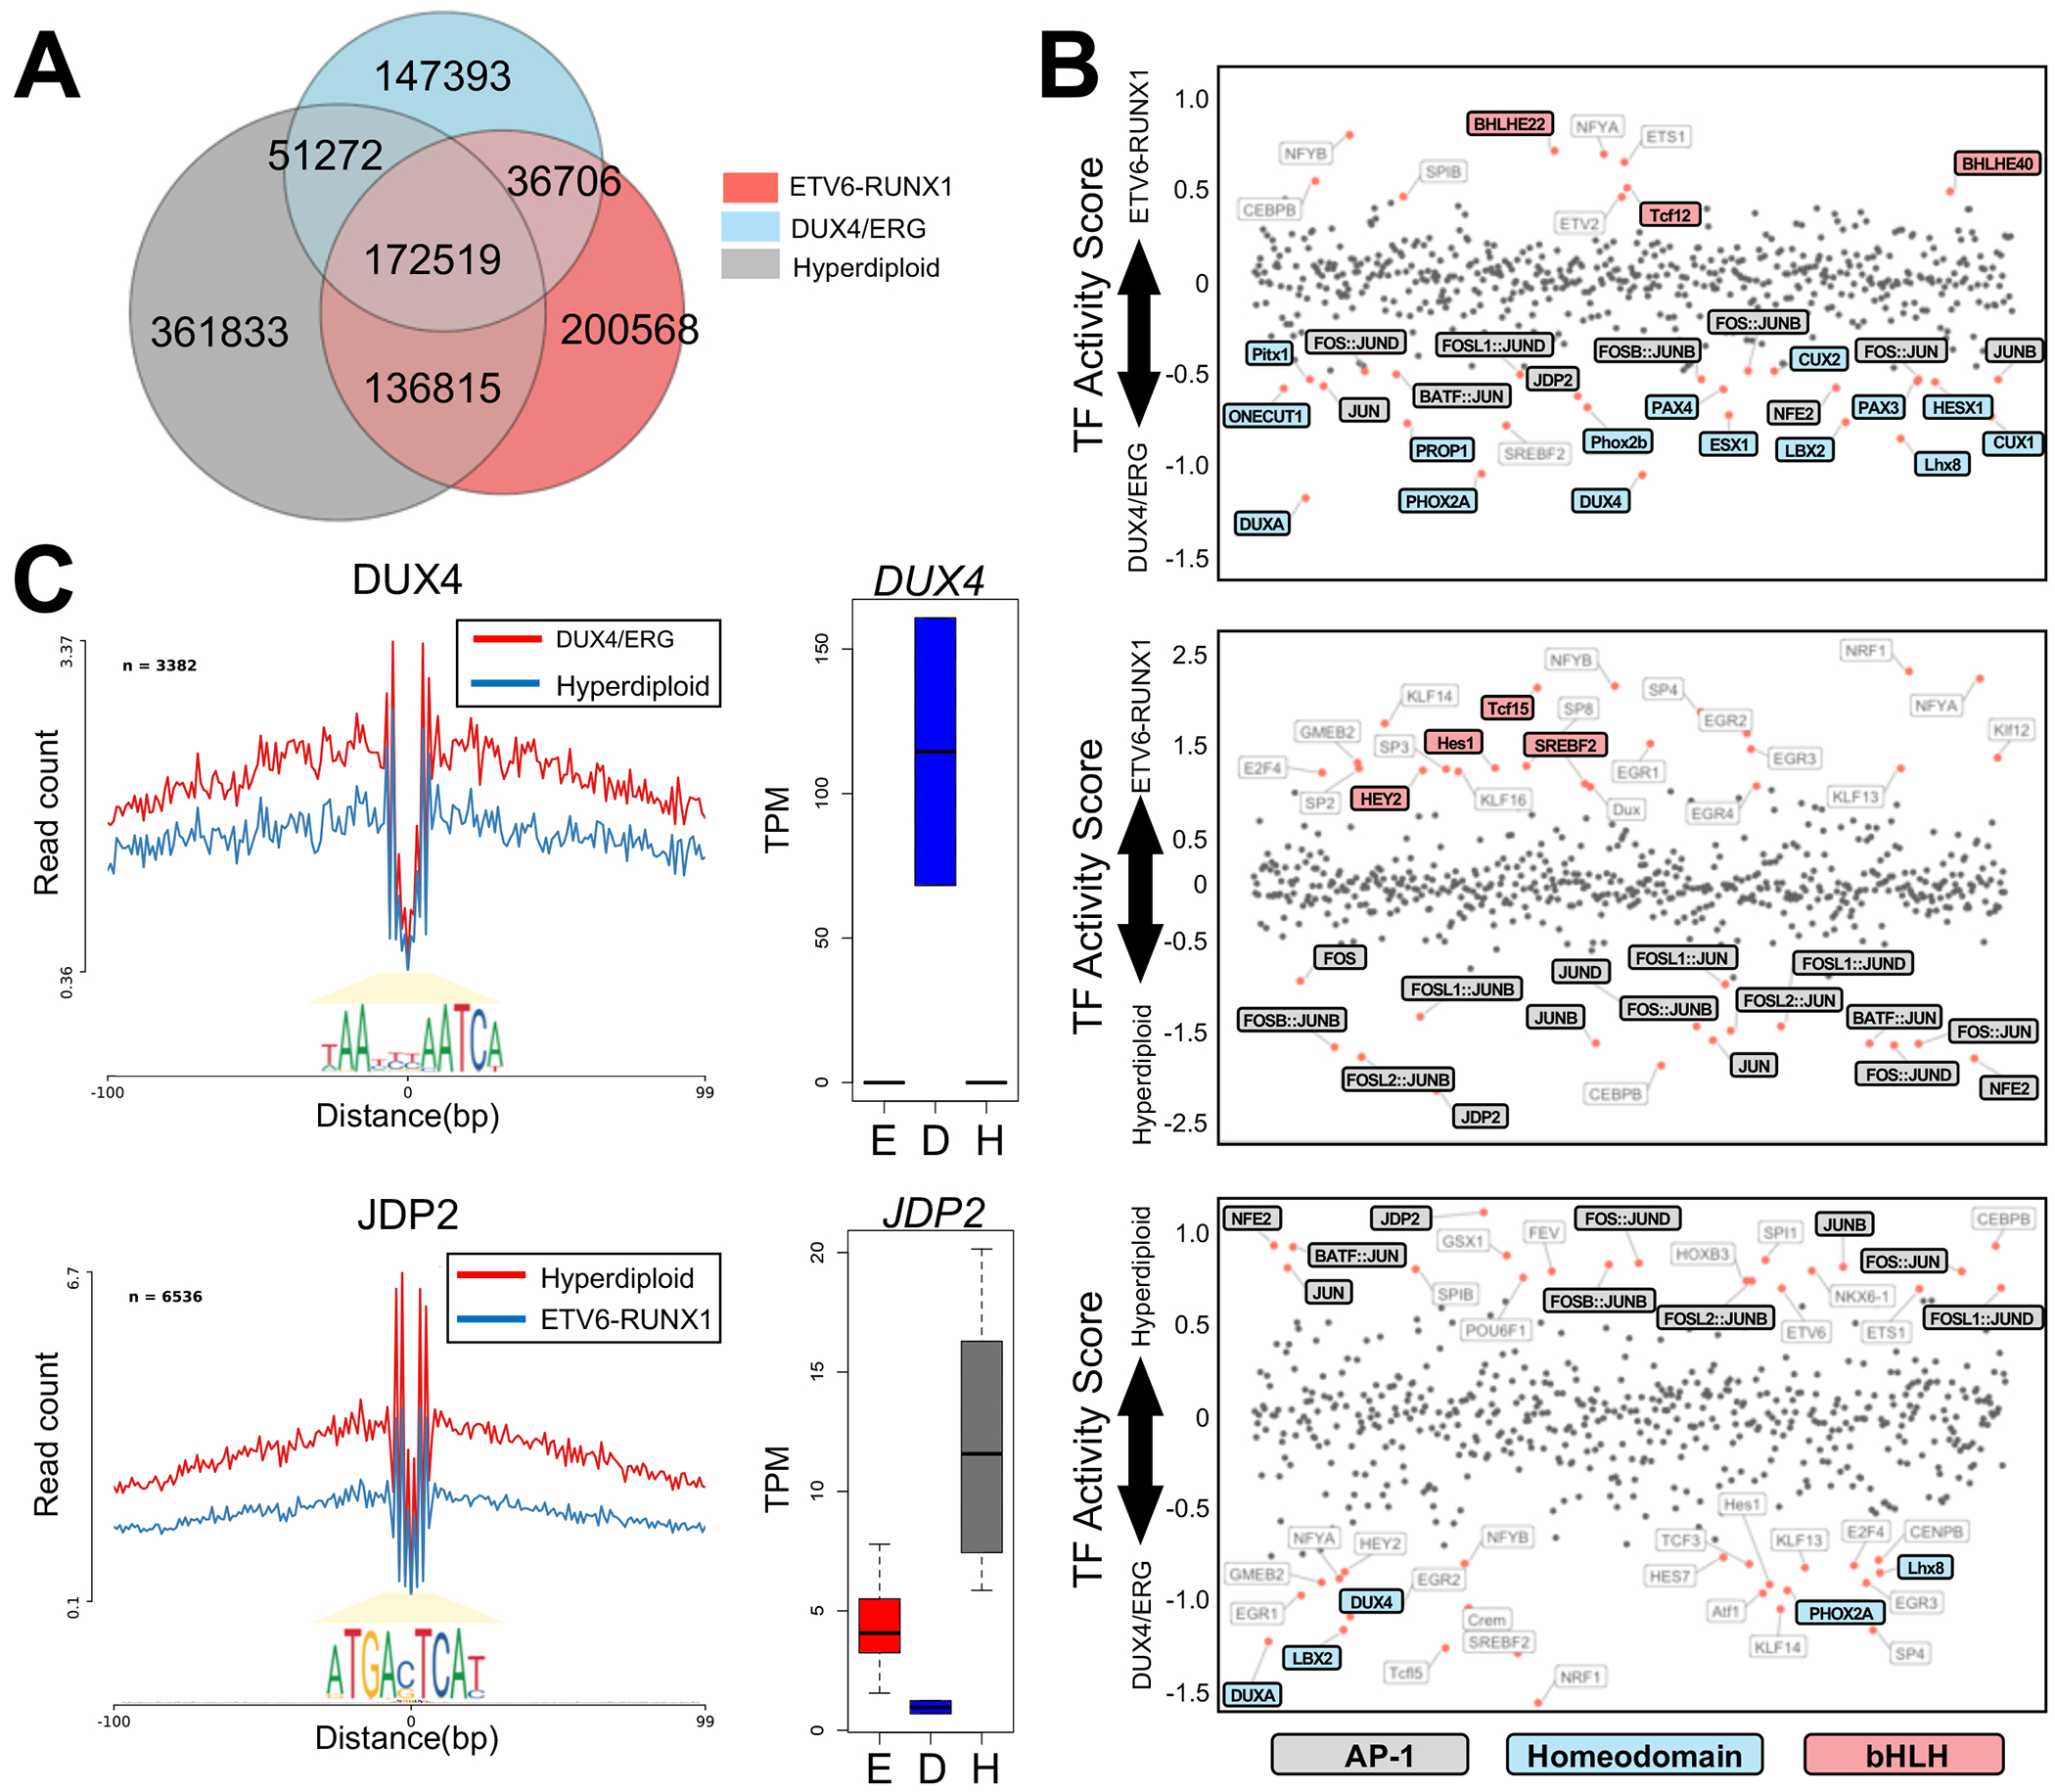
(A) Venn diagrams depict overlap in TF footprints among ALL subtypes. (B) Dot plots show ALL subtype comparisons of TF activity scores (x-axis; p<0.05) at open chromatin sites for all pairwise analyses. Consistently identified TF families are highlighted and their corresponding colors are provided below the plots. (C) Normalized ATAC-seq profiles for homeobox TF DUX4 activity in DUX4/ERG (red) and hyperdiploid (blue) subtypes (top). Normalized ATAC-seq profiles for AP-1 TF JDP2 activity in hyperdiploid (red) and ETV6-RUNX1 (blue) subtypes (bottom). Stronger TF activity is seen for DUX4 in DUX4/ERG subtypes and for JDP2 in hyperdiploid subtypes. At the right, average transcripts per million (TPM) plots for DUX4 and JDP2 TF genes are shown among ALL subtypes (E=ETV6-RUNX1, D=DUX4/ERG, H=Hyperdiploid).
To identify candidate protein factors that drive chromatin differences among subtypes, we evaluated differences in TF protein binding events at sites of accessible chromatin among ALL subtypes. For this analysis, we identified position-weight matrix-predicted canonical TF motifs at footprints and calculated differences in TF activity scores among subtypes (24) (Fig. 3B–C and Supplemental Fig. 4). Intriguingly, we uncovered several significant (p<0.05) and consistent patterns when we compared TF activities among ALL subtypes. We observed that activator protein 1 (AP-1) TFs displayed the weakest binding scores in ETV6-RUNX1 and consistently harbored the strongest binding intensity in hyperdiploid ALL. By contrast, basic helix-loop-helix (bHLH) TFs exhibited consistently stronger binding scores in ETV6-RUNX1 ALL. In DUX4/ERG ALL, we identified consistently stronger binding scores for homeodomain TFs, including DUX4, which is known to be deregulated in this molecular subtype (14, 31). Importantly, overlapping sets of TF footprints were identified when we restricted our analyses to subtype-accessible sites (Supplemental Fig. 5) and we further determined that AP-1, bHLH and homeodomain TF footprints were significantly enriched at hyperdiploid, ETV6-RUNX1 and DUX4/ERG subtype-accessible sites respectively, compared to non-subtype accessible sites (p<5.5×10⁻¹²), highlighting their role in establishing and/or maintaining unique chromatin landscapes among ALL subtypes.
Although multiple TF proteins were identified for each TF family, DNA binding motifs were generally concordant or closely related within TF families. To therefore identify candidate TFs within these TF families, we used transcriptomic data from primary ALL cells to uncover the top over-expressed TF family gene in each subtype. We identified TCFL5, DUX4 and JDP2 as the top over-expressed bHLH, homeodomain and AP-1 TF in ETV6-RUNX1, DUX4/ERG and hyperdiploid ALL respectively (Fig. 3C and Supplemental Fig. 6). Consistent with these observations, DUX4 and JDP2 TF footprints were enriched at DUX4/ERG and hyperdiploid subtype-accessible sites respectively, compared to non-subtype-accessible sites (p<1.8×10⁻⁸). Moreover, DUX4 ChIP-seq experiments in Nalm6 DUX4/ERG-like cells uncovered DUX4 binding to DUX4/ERG subtype-accessible sites, further supporting a role for this homeodomain TF in establishing and/or maintaining DUX4/ERG subtype-accessible chromatin architecture (Supplemental Fig. 7). Overall, these data suggest ALL subtypes utilize distinct TF repertoires that contribute to accessible chromatin differences among subtypes.
Chromatin accessibility is correlated with CpG DNA methylation
Changes in the chromatin landscape are known to be mirrored by DNA methylation at CpG dinucleotides (32–34). The DNA methylomes in 19 of 24 patient samples were available to test the hypothesis that ALL CpG methylation is inversely correlated with ALL open chromatin accessibility. As we predicted, within the same subtype we observed less DNA methylation at subtype-accessible sites compared to DNA methylation from opposing subtypes. We first performed PCA using genome-wide DNA methylation beta-values and found that DNA methylation could not discriminate subtypes as well as open chromatin state (Supplemental Fig. 8). Nonetheless, we subsequently analyzed DNA methylation beta-values at subtype-accessible sites and observed that DNA methylation differed by subtype (ETV6-RUNX1 Wilcoxon p<4.98×10⁻⁶; DUX4/ERG Wilcoxon p<2.2x10⁻¹⁶; Hyperdiploid Wilcoxon p<2.2×10⁻¹⁶; Fig. 4A). Supporting these observations and the identification high-confidence subtype-accessible sites, we found high correlation (rho >0.91; p<0.001) between DNA methylation levels at these CpG sites and DNA methylation from corresponding CpGs in an independent cohort of pediatric ALL cases (35, 36) (Supplemental Fig. 9). Overall, these data highlight coordination across distinct epigenomic levels in the ALL genome.
FIGURE 4. Coordination between multiple levels of epigenetic and transcriptional control.
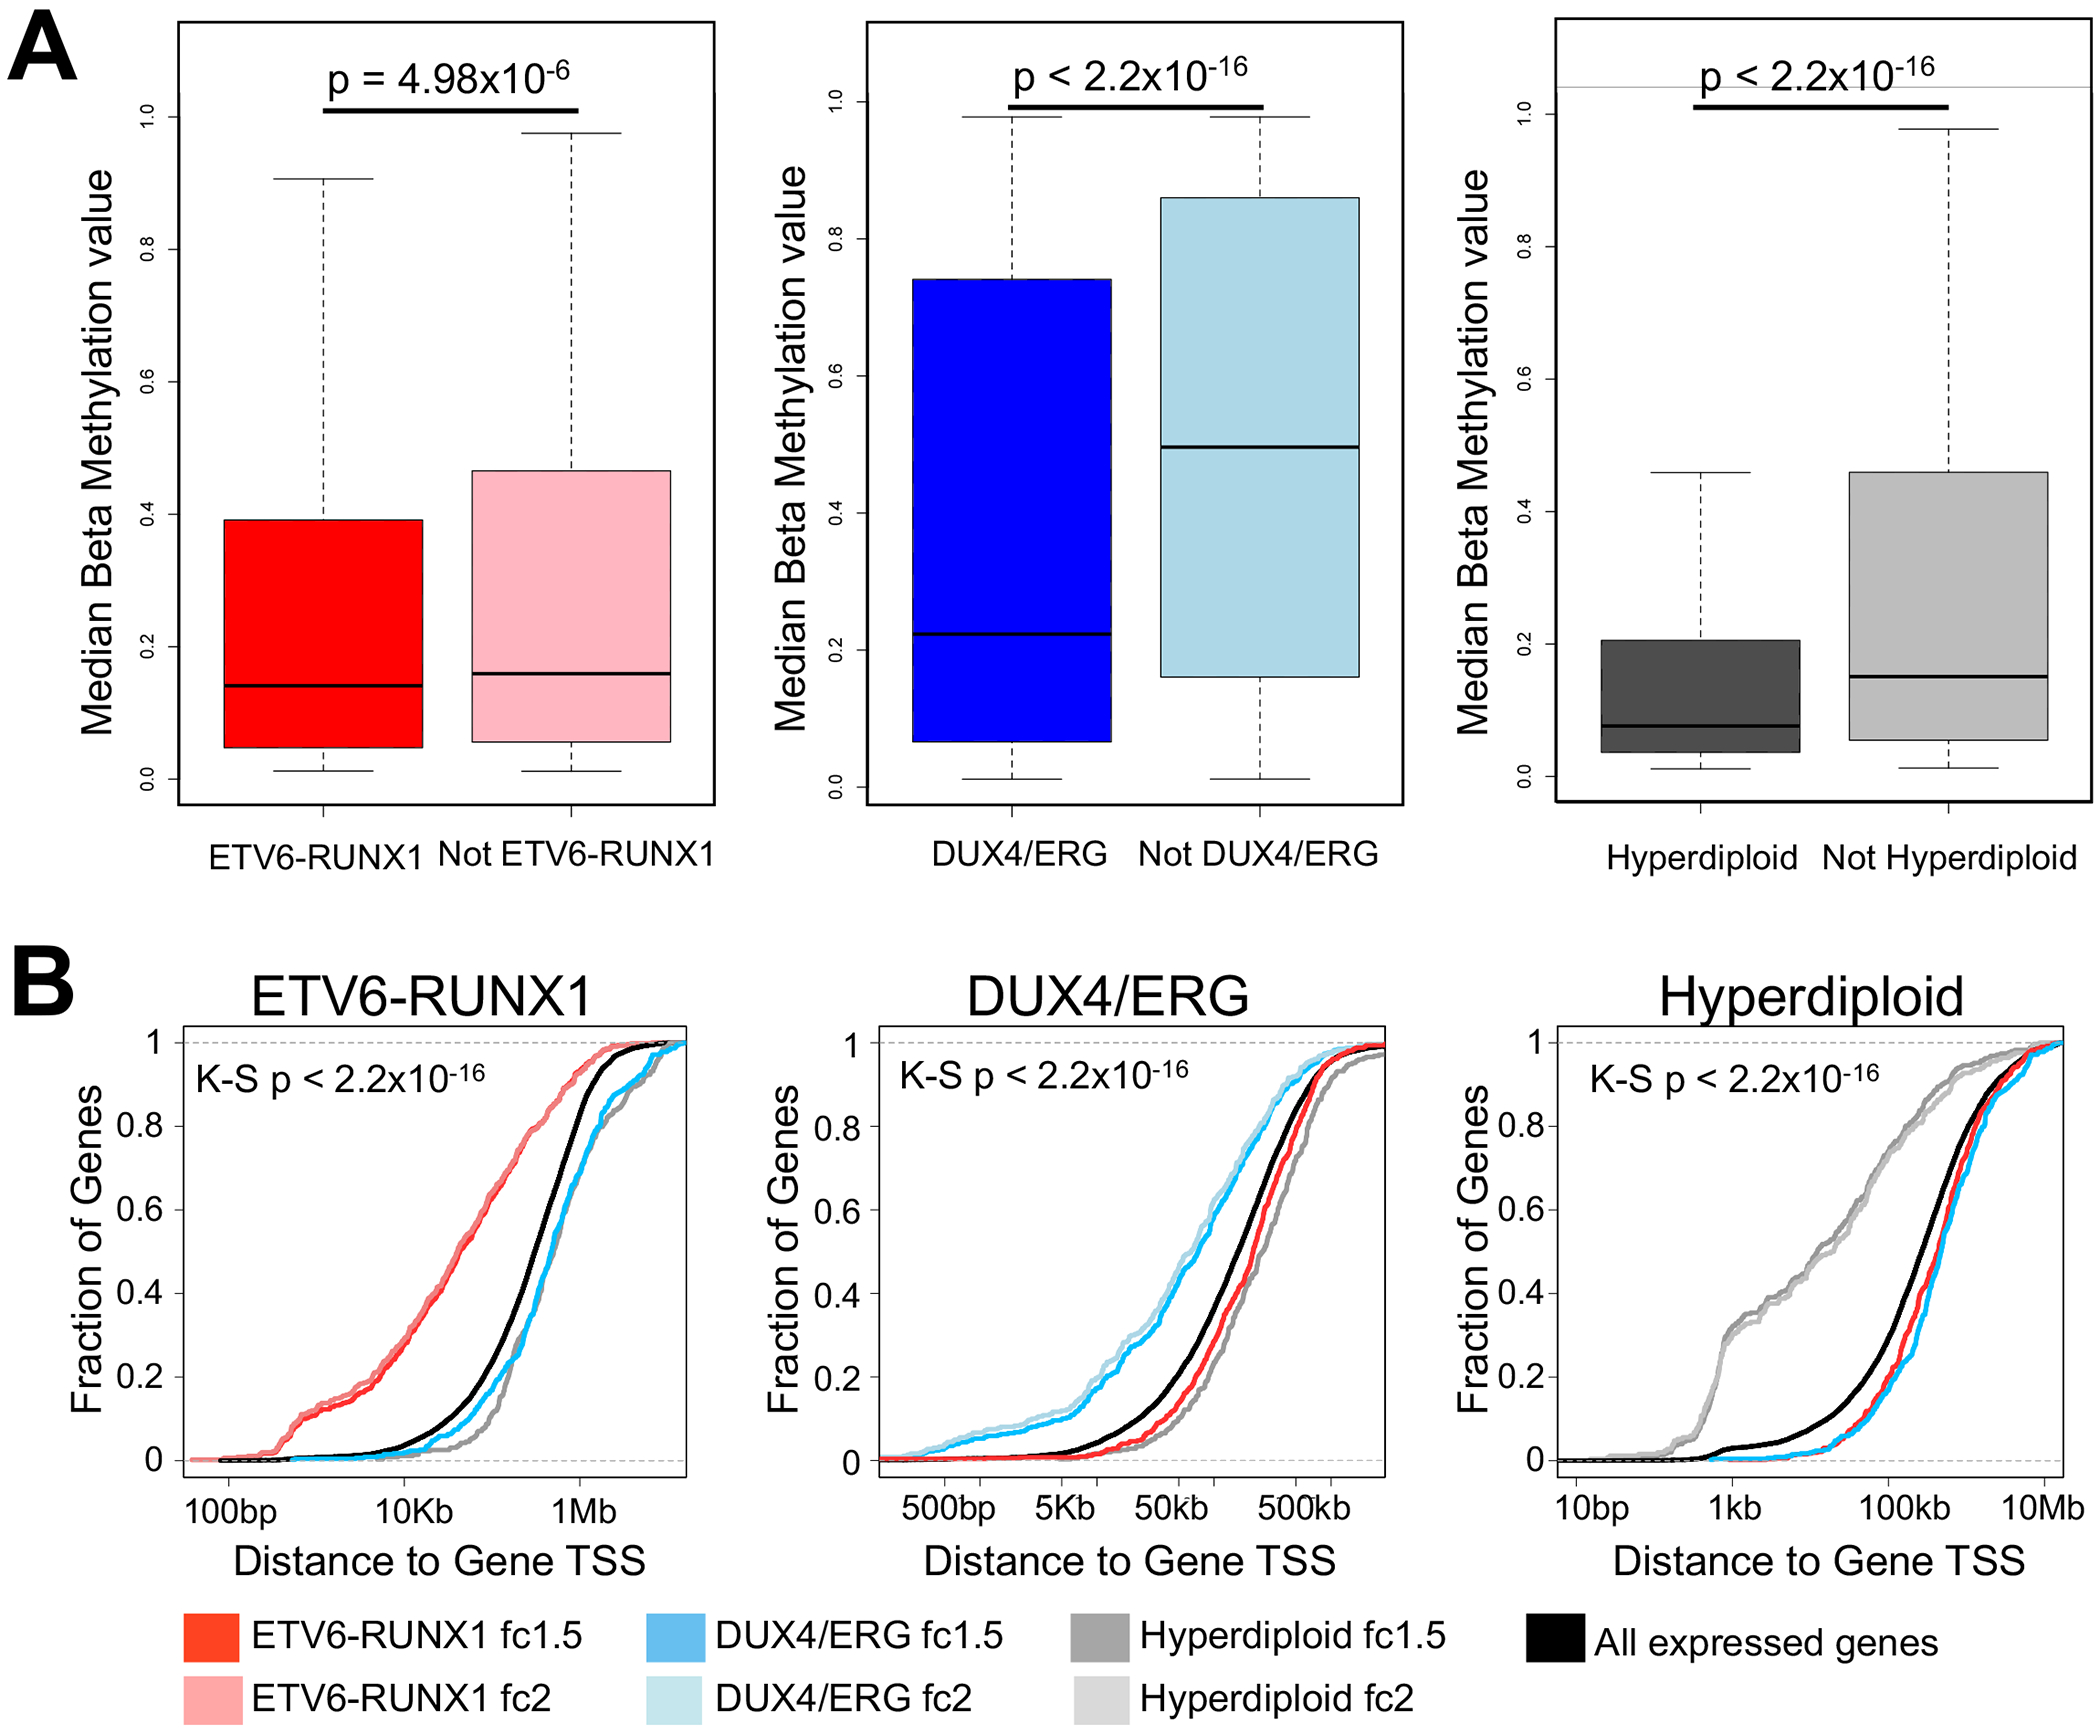
(A) Boxplot of median CpG DNA methylation beta-values at subtype-accessible sites from the same subtype versus median CpG DNA methylation beta-values from opposing subtypes. Wilcoxon rank-sum test p-values are provided. (B) Cumulative distribution functions display the fraction (y-axis) and distance (x-axis) of ALL subtype up-regulated gene transcription start sites to the nearest subtype-accessible site. Data is provided for ETV6-RUNX1-accessible sites, DUX4/ERG-accessible sites and hyperdiploid-accessible sites (left-to-right). For each set of subtype-accessible sites, distances to genes up-regulated >2-fold (fc2) or >1.5-fold (fc1.5) within the same subtype are provided, as well as genes up-regulated >1.5-fold in opposing subtypes. Background distance distributions use transcription start sites of all expressed genes in each subtype. Kolmogorov-Smirnov (K-S) test p-values are provided for each plot for genes up-regulated >2-fold (fc2) or >1.5-fold (fc1.5) within the same subtype.
Subtype-accessible sites are enriched near differentially expressed genes
Open chromatin state is known to impact gene expression (37, 38). We therefore mapped differentially expressed genes (DEGs) among ALL subtypes (n=19) and uncovered 1461, 1395 and 769 genes that were reproducibly up- or down-regulated (FDR<0.05) in ETV6-RUNX1, DUX4/ERG and hyperdiploid ALL (i.e. subtype-specific DEGs). Importantly, our DEG analysis recapitulated results from published findings (39, 40). For instance, we identified subtype-specific up-regulated DEGs in ETV6-RUNX1, such as BEST3 and IGF2BP1 which have been shown to have hypomethylated promoters in ETV6-RUNX1 (39), as well as genes found in previous screens of ETV6-RUNX1 ALL (40), such as BIRC7. RNA-seq transcriptomics also delineated patient samples by ALL subtype to a similar extent as did open chromatin state (Supplemental Fig. 10).
To explore if subtype-accessible sites are potential contributors to differences in gene expression among ALL subtypes, we integrated subtype-accessible sites with subtype-specific DEGs. We identified significant enrichment of subtype-accessible sites near genes up-regulated in each subtype (Kolmogorov-Smirnov test p <2.2x10⁻¹⁶; Fig. 4B). Notably, accessible sites from opposing subtypes did not show an enrichment near up-regulated DEGs, and in all cases exhibited significant depletion compared to all expressed genes (Kolmogorov-Smirnov test p <1.8x10⁻⁴; Fig. 4B). Importantly, similar enrichments were observed when we performed these analyses on subtype-depleted sites and down-regulated DEGs (Supplemental Fig. 11).
We next used CRISPR/Cas9 genome editing to functionally validate the role of subtype-accessible sites in subtype-specific gene expression via targeted knock-out (Supplemental Fig. 12). Using flanking gRNAs in REH cells, we targeted 3 ETV6-RUNX1 subtype-accessible sites at DSC3, KCNN1 and IGF2BP1 gene loci that are up-regulated genes in ETV6-RUNX1 ALL. Importantly, deletion of these open chromatin sites even in a portion of the pools of cells led to significant reduction in expression of these subtype-specific genes. Overall, these data further support a role for subtype-accessible sites in driving distinct transcriptional programs among ALL subtypes.
ALL molecular subtypes harbor unique gene regulatory networks
To further explore a functional link between unique open chromatin landscapes and gene expression signatures among ALL subtypes, we generated gene regulatory network maps in each subtype (25). We identified an average of 385,608 unique network connections in each subtype (i.e. “TF-gene target” interactions). Supporting substantial gene regulatory network subtype-specificity, we uncovered that on average 20.4% of these unique network connections were subtype-specific. To uncover enriched TFs in each network, we identified TFs that had stronger connectivity in each subtype compared to opposing subtypes and ranked them by average difference in target gene connectivity (Fig. 5A and Supplemental Fig. 13). Supporting our TF footprinting results, we uncovered numerous bHLH, homeodomain and AP-1 TFs as top ranked in ETV6-RUNX1, DUX4/ERG and hyperdiploid ALL respectively, including over-expressed TFs TCFL5, DUX4 and JDP2. We further uncovered that on average 15% of top up-regulated DEGs (FDR<0.01) in each subtype were directly connected to these over-expressed TFs, and an additional 45% of up-regulated DEGs were indirectly connected through an intermediate TF (Fig. 5B–C and Supplemental Fig. 14). By contrast, only 5% of up-regulated DEGs from opposing subtypes were connected to these TFs (3-fold enrichment, Wilcoxon p<0.05; 2.8-fold enrichment using up-regulated DEGs at FDR<0.05, Wilcoxon p<0.05). To functionally validate these TF observations, we used CRISPR/Cas9 genome editing to disrupt TCFL5 in REH cells, which led to significant effects on target gene expression and ALL cell biology. (Supplemental Fig. 15).
FIGURE 5. Stronger gene regulatory network connectivity for subtype-specific up-regulated genes.
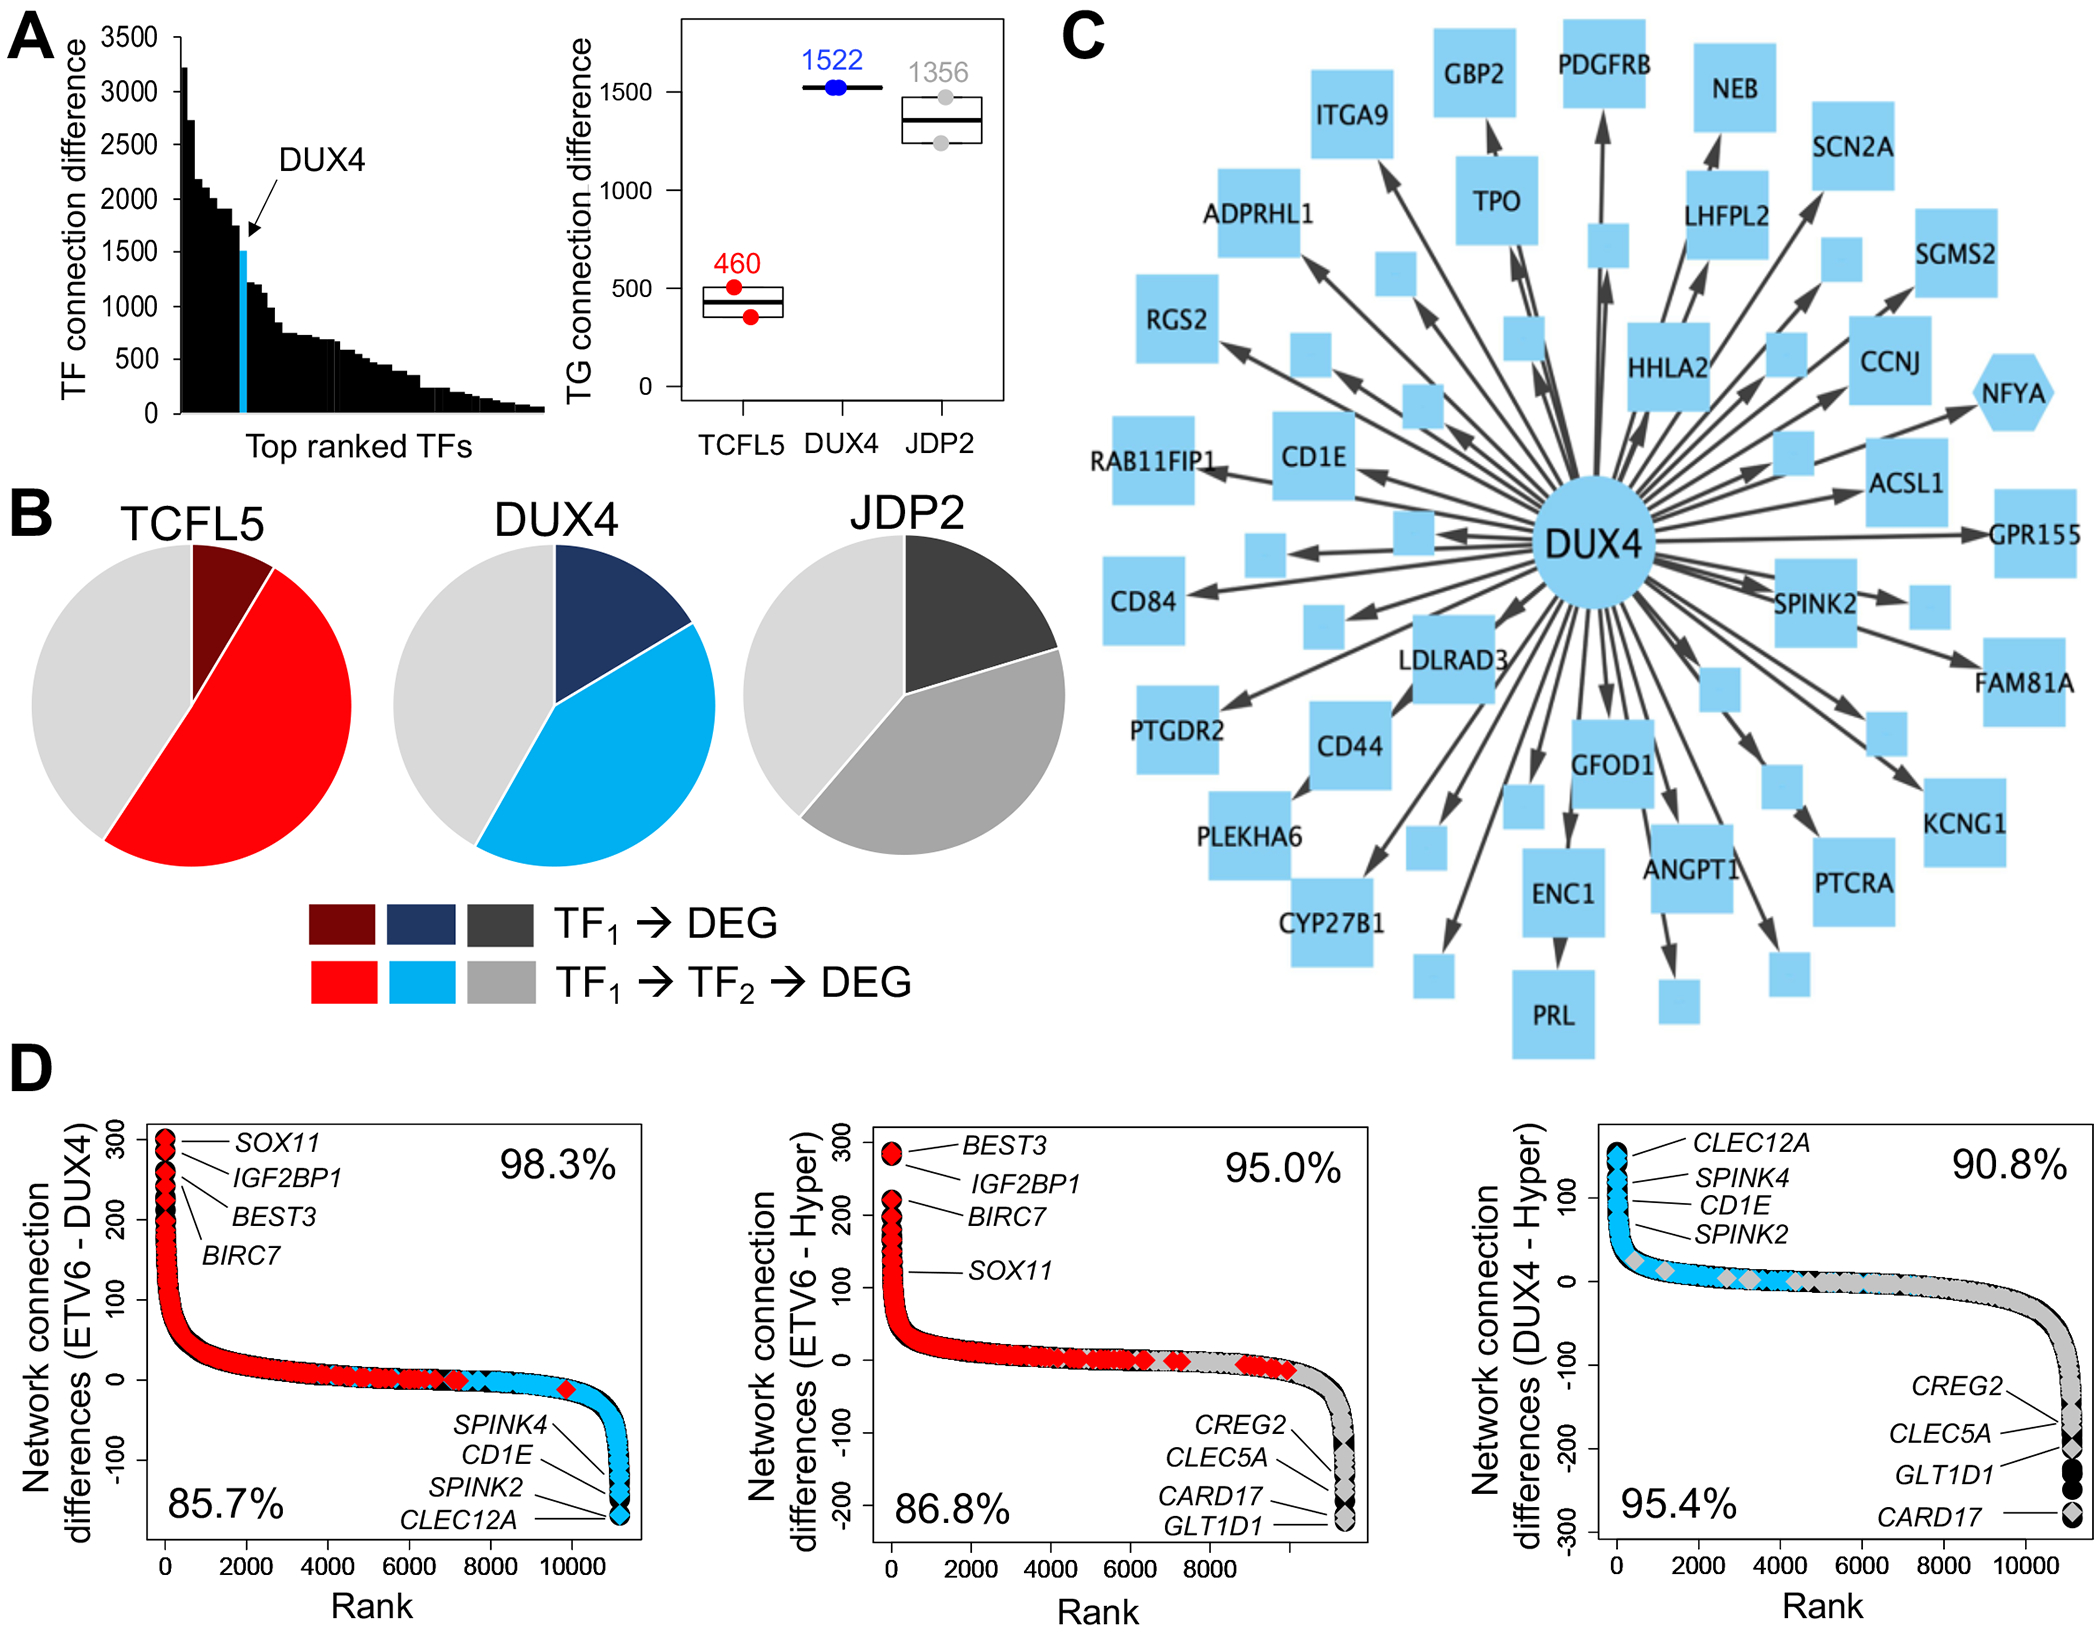
(A) Distribution of top TFs ranked by enrichment in target gene connections in DUX4/ERG ALL. Location of DUX4 (in blue) is denoted in the TF ranking. (B) Pie charts showing the number of subtype-specific up-regulated DEGs connected to TCFL5, DUX4 and JDP2 in ETV6-RUNX1, DUX4/ERG and hyperdiploid ALL. Direct connections are shown in darker hues (red, blue and gray) while secondary/indirect connections through an intermediate TF are shown in lighter hues. Unconnected target genes are shown in light gray in each pie chart. (C) Gene regulatory network map of DUX4 TF connections to target genes that are subtype-specific up-regulated DEGs in DUX4/ERG ALL. Target gene names are provided for DEGs with an average log2 fold change greater than 2. Target genes that also act as TFs are shown as hexagons. (D) Network target gene comparison plots for all pairwise subtype analyses. Network target genes are ranked by differences in connection frequency between subtypes. Colored diamonds represent network target genes that are subtype-specific up-regulated DEGs in each ALL subtype (red= ETV6-RUNX1, blue=DUX4/ERG and gray=hyperdiploid). Network target genes harboring greater connectivity in a subtype were significantly enriched (K-S test p<2.2x10⁻¹⁶) in up-regulated DEGs in the same subtype. Several notable up-regulated DEG network target genes are highlighted. The percentage of subtype-specific up-regulated DEGs that show greater connectivity in the same subtype is also provided (bottom left and upper right).
We also compared the frequency of target gene connections between ALL subtypes to map enriched target genes that exhibit stronger network connectivity in each ALL subtype compared to opposing subtypes. In total, we identified 148 target genes that exhibited consistently stronger network connectivity (>=75 interactions) in a particular ALL subtype compared to opposing subtypes (Supplemental Fig. 16–18; 377 target genes identified using a cutoff of >=50 interactions). Interestingly, our gene regulatory network maps identified genes that we previously uncovered to be subtype-specific up-regulated DEGs in each ALL subtype, such as SOX11, BIRC7 and IGF2BP1 in ETV6-RUNX1 ALL. To determine if subtype-specific up-regulated DEGs harbored significantly greater network connectivity in the same subtype, we performed pair-wise comparisons among ALL subtypes by plotting and ranking connectivity differences for all target genes and subsequently compared these ranked network target genes to the top subtype-specific up-regulated DEGs (FDR<0.01). Strikingly, we observed that subtype-specific up-regulated DEGs were highly enriched in target genes that exhibited stronger connectivity in the same ALL subtype (>85% of subtype-specific up-regulated DEG network target genes; Kolmogorov-Smirnov test p<2.2×10⁻¹⁶; Fig. 5D). Collectively, these data demonstrate that ALL subtypes harbor distinct gene regulatory networks linked to the unique open chromatin landscapes and gene expression signatures observed within ALL molecular subtypes.
DNA sequence variation contributes to inter-individual variability in chromatin accessibility
To better understand elements contributing to inter-individual variation in open chromatin landscapes, we mapped quantitative trait loci (QTL) impacting ALL chromatin accessibility (i.e. chromatin accessibility QTLs or caQTLs) in each subtype. We used single nucleotide polymorphism (SNP) genotyping data from primary ALL cells (n=24) and Web-based Allele-Specific PCR (WASP) (26) to identify caQTLs. We collectively mapped 3555 SNPs (FDR<0.05; 5530 SNPs at FDR<0.1) within ALL open chromatin sites that act as caQTLs (Fig. 6A–B and Supplemental Tables 8–10). Notably, 371 caQTLs were identified in >=2 ALL subtypes (572 caQTLs at FDR<0.1), and in all instances these shared caQTLs exhibited concordant allele-specific effects on chromatin accessibility (Fig. 6C). Consistent results were obtained using caQTLs at FDR<0.1 (Supplemental Fig. 19). Only 25% of caQTLs lie within TF footprints, supporting a role for DNA sequences distal to direct TF binding events in the regulation of local chromatin accessibility. Because noncoding variants have been associated with diverse biological traits through alterations of gene regulation (41–46), we utilized expression quantitative trait loci (eQTL) data in primary ALL cells from published studies (18, 47) and found 348 caQTLs (10% of all caQTLs at FDR<0.05) that additionally acted as cis eQTLs (<1Mb from target gene). Importantly, in over 75% of cases we observed biologically consistent directionality for these variants, meaning caQTL alleles with increased accessibility were associated with higher gene expression, whereas caQTL alleles with decreased accessibility were associated with lower gene expression (Fig. 6D).
FIGURE 6. DNA sequence variation impacts chromatin accessibility and related phenotypes.
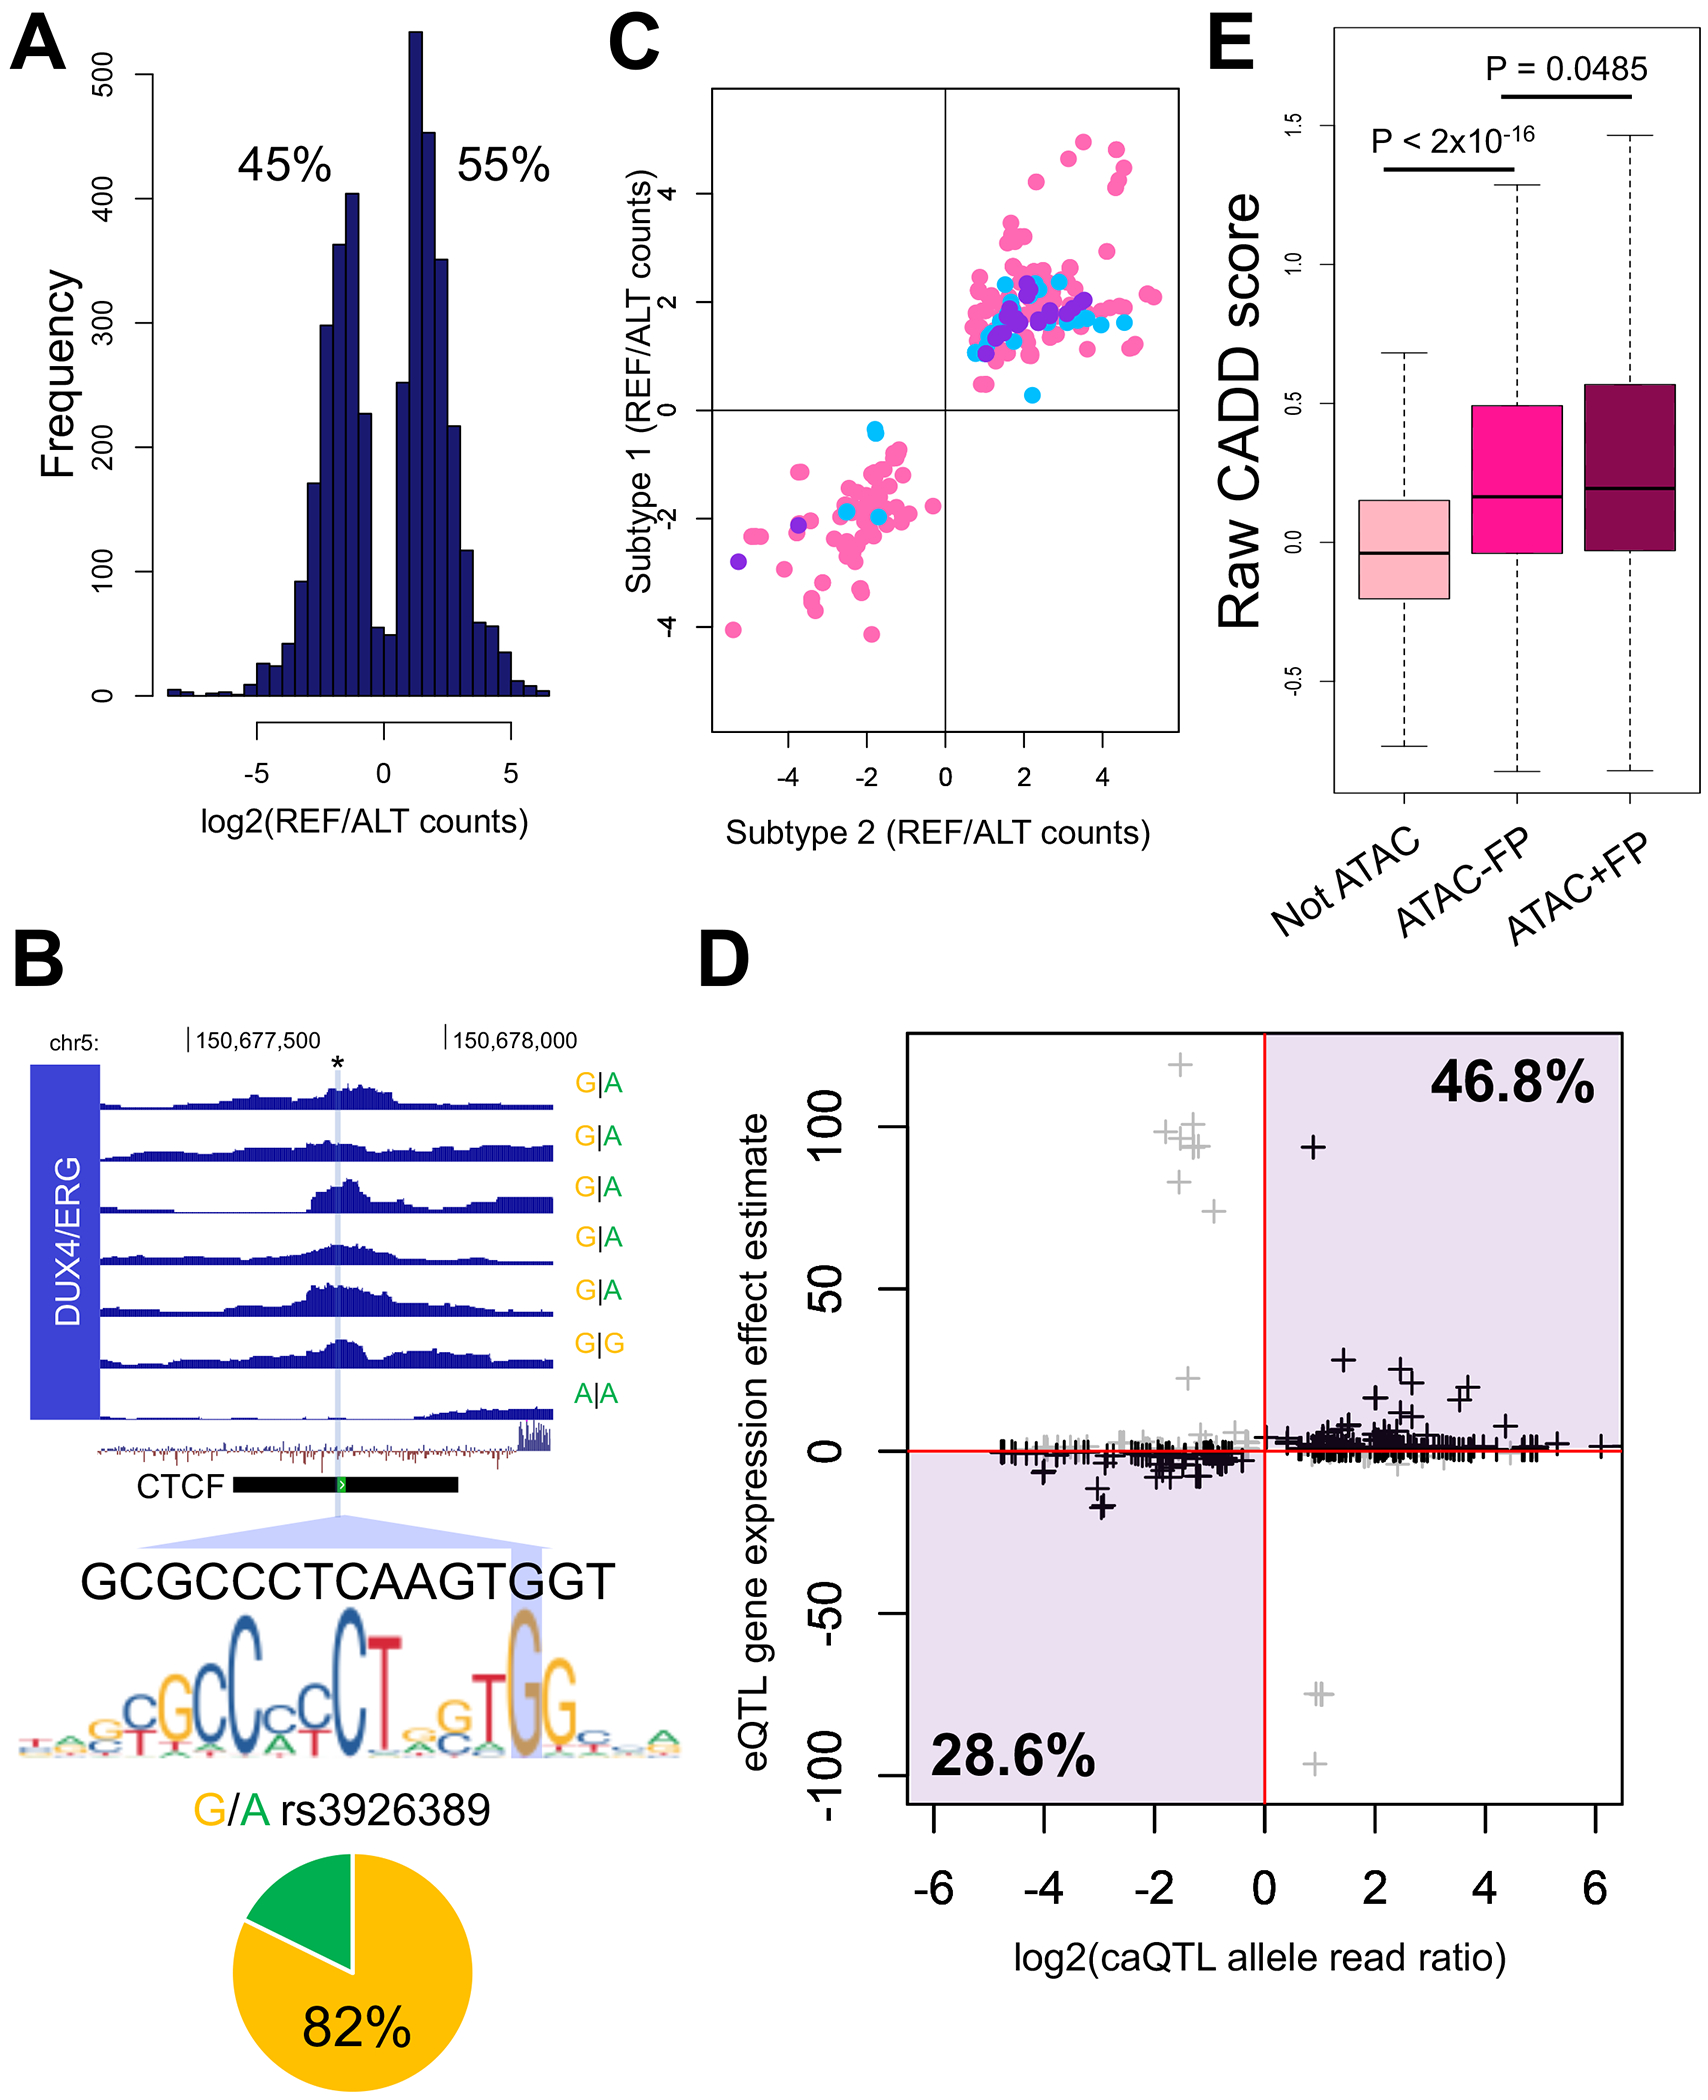
(A) Log distribution of allele-specific accessibility ratios (reference versus alternative allele count) at caQTLs (FDR<0.05) in ALL cell samples (REF=reference, ALT=alternative). (B) Example of caQTL in DUX4/ERG ALL. SNP rs3926389 impacts chromatin accessibility and lies within a footprint spanning the canonical CTCF motif and an ENCODE CTCF ChIP-seq site (shown). In heterozygous ALL cells, 82% of reads map to the reference G allele, which more closely matches the canonical CTCF motif (shown). ATAC-seq enrichment plots, genotypes, sequence conservation and the location of the variant is provided. (C) Comparison of log2 allele-specific accessibility read count ratios (REF/ALT) between overlapping ALL subtype caQTLs (FDR<0.05). Hyperdiploid (X-axis) and ETV6-RUNX1 (Y-axis) overlapping caQTLs are shown in pink, hyperdiploid (X-axis) and DUX4/ERG (Y-axis) overlapping caQTLs are shown in light blue and ETV6-RUNX1 (X-axis) and DUX4/ERG (Y-axis) overlapping caQTLs are shown in purple. (D) Plot comparing caQTL log2 allele-specific accessibility read count ratio versus eQTL gene expression estimates. Over 75% of caQTLs show concordant effects (denoted in black) on chromatin accessibility and gene expression (quadrants highlighted in purple). (E) Box plots show raw CADD scores for diverse sets of noncoding somatic variants. Not ATAC = not in accessible chromatin; ATAC -FP = in accessible chromatin but not TF footprint; ATAC +FP = in accessible chromatin and TF footprint.
Cancer genomes harbor functional somatic variants within noncoding regulatory DNA sequences (48–51). We therefore investigated ALL somatic variants that were identified by the Pediatric Cancer Genome Project (52) (PCGP). We obtained noncoding somatic variant data for ETV6-RUNX1 (n=58), DUX4/ERG (n=25) and hyperdiploid (n=53) ALL patients and mapped variants to accessible chromatin sites. We mapped 1578, 1214 and 250 somatic variants to open chromatin sites in ETV6-RUNX1, DUX4/ERG and hyperdiploid ALL, respectively. We further explored the predicted functional effects for these variants by obtaining their Combined Annotation Dependent Depletion (CADD) pathogenicity scores (27) and uncovered a discernable trend (Fig. 6E); variants mapping to closed chromatin harbored the lowest pathogenicity scores, variants mapping outside of TF footprints but within accessible chromatin harbored higher pathogenicity scores (p<2x10⁻¹⁶, mean difference between closed and open chromatin outside of TF footprints = 0.28 +/−0.01) and variants localizing to TF footprints within accessible chromatin harbored the highest pathogenicity scores (p=0.0485, mean difference between open chromatin outside and within TF footprints = 0.04 +/−0.02). Significant differences in somatic variant pathogenicity scores were also uncovered in each ALL subtype among variants in closed versus open chromatin, and among variants within TF footprints versus outside of TF footprints (Supplemental Fig. 20). Collectively, in addition to pronounced open chromatin heterogeneity among ALL subtypes, these data further indicate that DNA sequence variation contributes to inter-individual differences in ALL chromatin accessibility.
DISCUSSION
To date there has been limited understanding of the ALL chromatin landscape, and the extent of chromatin differences among ALL molecular subtypes has been largely unexplored. By mapping open chromatin sites using ATAC-seq in primary ALL samples from 24 patients, we uncovered extensive differences in the accessible chromatin landscape between ALL and normal hematopoietic cells that mirror the pathophysiology of ALL. Chromatin accessibility differences between ALL cells and normal B-cells involve the activation of B-cell repressed chromatin domains in ALL and further implicate the disruption of lymphocyte development and cell cycle control, and the activation of numerous oncogenic signaling pathways (e.g. BMP, C-MYB, endothelin, HIF-1a and Wnt). Consequently, these observations strongly support leukemic transformation as the primary driver of chromatin differences in ALL cells. However, because dissociation of potential cell-of-origin effects from the effects of leukemic transformation on the ALL chromatin landscape is challenging, we cannot exclude the possibility that a subset of these open chromatin differences are driven by cell-of-origin effects. Notably, C-MYB, HIF-1a and Wnt signaling have been implicated in leukemogenesis, ALL cell survival, chemoresistance and/or patient outcome (53-59), whereas dysregulation of BMP and endothelin signaling has been previously linked to other hematological malignancies (60, 61). Consequently, our results support further investigation of these signaling pathways in ALL.
Our data further demonstrate that open chromatin state can discriminate ALL subtypes. We identified thousands of open chromatin sites that exhibit consistently stronger accessibility within each ALL subtype than opposing subtypes through analyses of differential chromatin accessibility, while our TF footprinting analyses uncovered roles for bHLH, homeodomain and AP-1 TFs in establishing and/or maintaining unique chromatin landscapes among ALL subtypes. We additionally uncovered that subtype-accessible sites show decreased DNA methylation, that they are enriched near DEGs, and that they promote distinct gene regulatory networks among ALL subtypes. CRISPR/Cas9 genome editing and ChIP-seq further validated the gene regulatory effects of subtype-accessible sites and candidate TFs. Overall, these findings support coordination between multiple levels of epigenetic and transcriptional control and highlight the power of combining epigenomics and transcriptomics.
Our study also explored the effects of DNA sequence variation on the ALL open chromatin landscape. We identified thousands of DNA sequence variants that impact local chromatin accessibility, including a subset that associated with neighboring gene expression. We further identified thousands of somatic variants in regions of accessible chromatin and demonstrate that variants within accessible chromatin harbor greater pathogenicity compared to variants in closed chromatin. Overall, our findings support the functional effects of DNA sequence variants on ALL chromatin state and gene regulation and highlight genetic variation as a key contributor to inter-individual variability in ALL open chromatin state.
In conclusion, our results suggest that there are ALL subtype-specific chromatin landscapes that are additionally modulated by genetic variation, and these unique chromatin landscapes in turn contribute to distinct gene regulatory networks and gene expression signatures among ALL subtypes. A better understanding of epigenomic landscapes in diverse ALL subtypes could be used to illuminate novel gene regulatory drivers or to better categorize ALL subtypes. Notably, as diverse molecular subtypes of ALL are associated with distinct prognoses (2, 62), chromatin profiling can be further used to optimize therapies or to exploit novel targets or genetic pathways for the treatment of ALL. The work herein advances our understanding of ALL epigenomic complexity and underscores the integral role of the chromatin landscape in defining ALL cell biology.
Supplementary Material
ACKNOWLEDGEMENTS
We would like to thank the Hartwell Center at St. Jude for ATAC-seq and RNA-seq library preparation and next-generation sequencing, and the Center for Advanced Genome Engineering (CAGE) at St. Jude for CRISPR/Cas9 genome editing in ALL cell lines. We would also like to thank Jeremy Hunt for technical support. This work was supported by the National Cancer Institute (R01CA234490, P30CA021765), the National Institute of General Medical Studies (P50GM115279) and the American Lebanese Syrian Associated Charities (ALSAC).
Footnotes
COMPETING INTERESTS
The authors declare that they have no competing interests.
REFERENCES
- 1.Moriyama T, Relling MV, Yang JJ. Inherited genetic variation in childhood acute lymphoblastic leukemia. Blood. 2015;125(26):3988–95. [DOI] [PMC free article] [PubMed] [Google Scholar]
- 2.Mullighan CG. Molecular genetics of B-precursor acute lymphoblastic leukemia. J Clin Invest. 2012;122(10):3407–15. [DOI] [PMC free article] [PubMed] [Google Scholar]
- 3.Lilljebjorn H, Henningsson R, Hyrenius-Wittsten A, Olsson L, Orsmark-Pietras C, von Palffy S, et al. Identification of ETV6-RUNX1-like and DUX4-rearranged subtypes in paediatric B-cell precursor acute lymphoblastic leukaemia. Nat Commun. 2016;7:11790. [DOI] [PMC free article] [PubMed] [Google Scholar]
- 4.Andersson A, Olofsson T, Lindgren D, Nilsson B, Ritz C, Eden P, et al. Molecular signatures in childhood acute leukemia and their correlations to expression patterns in normal hematopoietic subpopulations. Proc Natl Acad Sci U S A. 2005;102(52):19069–74. [DOI] [PMC free article] [PubMed] [Google Scholar]
- 5.Figueroa ME, Chen SC, Andersson AK, Phillips LA, Li Y, Sotzen J, et al. Integrated genetic and epigenetic analysis of childhood acute lymphoblastic leukemia. J Clin Invest. 2013;123(7):3099–111. [DOI] [PMC free article] [PubMed] [Google Scholar]
- 6.Almamun M, Levinson BT, van Swaay AC, Johnson NT, McKay SD, Arthur GL, et al. Integrated methylome and transcriptome analysis reveals novel regulatory elements in pediatric acute lymphoblastic leukemia. Epigenetics. 2015;10(9):882–90. [DOI] [PMC free article] [PubMed] [Google Scholar]
- 7.Shlyueva D, Stampfel G, Stark A. Transcriptional enhancers: from properties to genome-wide predictions. Nat Rev Genet. 2014;15(4):272–86. [DOI] [PubMed] [Google Scholar]
- 8.Buenrostro JD, Giresi PG, Zaba LC, Chang HY, Greenleaf WJ. Transposition of native chromatin for fast and sensitive epigenomic profiling of open chromatin, DNA-binding proteins and nucleosome position. Nat Methods. 2013;10(12):1213–8. [DOI] [PMC free article] [PubMed] [Google Scholar]
- 9.Corces MR, Buenrostro JD, Wu B, Greenside PG, Chan SM, Koenig JL, et al. Lineage-specific and single-cell chromatin accessibility charts human hematopoiesis and leukemia evolution. Nat Genet. 2016;48(10):1193–203. [DOI] [PMC free article] [PubMed] [Google Scholar]
- 10.Iacobucci I, Mullighan CG. Genetic Basis of Acute Lymphoblastic Leukemia. J Clin Oncol. 2017;35(9):975–83. [DOI] [PMC free article] [PubMed] [Google Scholar]
- 11.Shurtleff SA, Buijs A, Behm FG, Rubnitz JE, Raimondi SC, Hancock ML, et al. TEL/AML1 fusion resulting from a cryptic t(12;21) is the most common genetic lesion in pediatric ALL and defines a subgroup of patients with an excellent prognosis. Leukemia. 1995;9(12):1985–9. [PubMed] [Google Scholar]
- 12.Yeoh EJ, Ross ME, Shurtleff SA, Williams WK, Patel D, Mahfouz R, et al. Classification, subtype discovery, and prediction of outcome in pediatric acute lymphoblastic leukemia by gene expression profiling. Cancer Cell. 2002;1(2):133–43. [DOI] [PubMed] [Google Scholar]
- 13.Gabriels J, Beckers MC, Ding H, De Vriese A, Plaisance S, van der Maarel SM, et al. Nucleotide sequence of the partially deleted D4Z4 locus in a patient with FSHD identifies a putative gene within each 3.3 kb element. Gene. 1999;236(1):25–32. [DOI] [PubMed] [Google Scholar]
- 14.Zhang J, McCastlain K, Yoshihara H, Xu B, Chang Y, Churchman ML, et al. Deregulation of DUX4 and ERG in acute lymphoblastic leukemia. Nat Genet. 2016;48(12):1481–9. [DOI] [PMC free article] [PubMed] [Google Scholar]
- 15.Paulsson K, Forestier E, Lilljebjorn H, Heldrup J, Behrendtz M, Young BD, et al. Genetic landscape of high hyperdiploid childhood acute lymphoblastic leukemia. Proc Natl Acad Sci U S A. 2010;107(50):21719–24. [DOI] [PMC free article] [PubMed] [Google Scholar]
- 16.Savic D, Ramaker RC, Roberts BS, Dean EC, Burwell TC, Meadows SK, et al. Distinct gene regulatory programs define the inhibitory effects of liver X receptors and PPARG on cancer cell proliferation. Genome Med. 2016;8(1):74. [DOI] [PMC free article] [PubMed] [Google Scholar]
- 17.Calderon D, Nguyen MLT, Mezger A, Kathiria A, Muller F, Nguyen V, et al. Landscape of stimulation-responsive chromatin across diverse human immune cells. Nat Genet. 2019;51(10):1494–505. [DOI] [PMC free article] [PubMed] [Google Scholar]
- 18.Paugh SW, Bonten EJ, Savic D, Ramsey LB, Thierfelder WE, Gurung P, et al. NALP3 inflammasome upregulation and CASP1 cleavage of the glucocorticoid receptor cause glucocorticoid resistance in leukemia cells. Nat Genet. 2015;47(6):607–14. [DOI] [PMC free article] [PubMed] [Google Scholar]
- 19.Ernst J, Kellis M. Discovery and characterization of chromatin states for systematic annotation of the human genome. Nature biotechnology. 2010;28(8):817. [DOI] [PMC free article] [PubMed] [Google Scholar]
- 20.Ernst J, Kheradpour P, Mikkelsen TS , Shoresh N, Ward LD, Epstein CB, et al. Mapping and analysis of chromatin state dynamics in nine human cell types. Nature. 2011;473(7345):43. [DOI] [PMC free article] [PubMed] [Google Scholar]
- 21.Langmead B, Salzberg SL. Fast gapped-read alignment with Bowtie 2. Nat Methods. 2012;9(4):357–9. [DOI] [PMC free article] [PubMed] [Google Scholar]
- 22.Zhang Y, Liu T, Meyer CA, Eeckhoute J, Johnson DS, Bernstein BE, et al. Model-based analysis of ChIP-Seq (MACS). Genome Biol. 2008;9(9):R137. [DOI] [PMC free article] [PubMed] [Google Scholar]
- 23.Love MI, Huber W, Anders S. Moderated estimation of fold change and dispersion for RNA-seq data with DESeq2. Genome Biol. 2014;15(12):550. [DOI] [PMC free article] [PubMed] [Google Scholar]
- 24.Li Z, Schulz MH, Look T, Begemann M, Zenke M, Costa IG. Identification of transcription factor binding sites using ATAC-seq. Genome Biol. 2019;20(1):45. [DOI] [PMC free article] [PubMed] [Google Scholar]
- 25.Duren Z, Chen X, Jiang R, Wang Y, Wong WH. Modeling gene regulation from paired expression and chromatin accessibility data. Proc Natl Acad Sci U S A. 2017;114(25):E4914–E23. [DOI] [PMC free article] [PubMed] [Google Scholar]
- 26.van de Geijn B, McVicker G, Gilad Y, Pritchard JK. WASP: allele-specific software for robust molecular quantitative trait locus discovery. Nat Methods. 2015;12(11):1061–3. [DOI] [PMC free article] [PubMed] [Google Scholar]
- 27.Kircher M, Witten DM, Jain P, O’Roak BJ, Cooper GM, Shendure J. A general framework for estimating the relative pathogenicity of human genetic variants. Nat Genet. 2014;46(3):310–5. [DOI] [PMC free article] [PubMed] [Google Scholar]
- 28.McLean CY, Bristor D, Hiller M, Clarke SL, Schaar BT, Lowe CB, et al. GREAT improves functional interpretation of cis-regulatory regions. Nat Biotechnol. 2010;28(5):495–501. [DOI] [PMC free article] [PubMed] [Google Scholar]
- 29.Subramanian A, Tamayo P, Mootha VK, Mukherjee S, Ebert BL, Gillette MA, et al. Gene set enrichment analysis: a knowledge-based approach for interpreting genome-wide expression profiles. Proc Natl Acad Sci U S A. 2005;102(43):15545–50. [DOI] [PMC free article] [PubMed] [Google Scholar]
- 30.Mayran A, Sochodolsky K, Khetchoumian K, Harris J, Gauthier Y, Bemmo A, et al. Pioneer and nonpioneer factor cooperation drives lineage specific chromatin opening. Nat Commun. 2019;10(1):3807. [DOI] [PMC free article] [PubMed] [Google Scholar]
- 31.Tian L, Shao Y, Nance S, Dang J, Xu B, Ma X, et al. Long-read sequencing unveils IGH-DUX4 translocation into the silenced IGH allele in B-cell acute lymphoblastic leukemia. Nat Commun. 2019;10(1):2789. [DOI] [PMC free article] [PubMed] [Google Scholar]
- 32.Schmidl C, Klug M, Boeld TJ, Andreesen R, Hoffmann P, Edinger M, et al. Lineage-specific DNA methylation in T cells correlates with histone methylation and enhancer activity. Genome Res. 2009;19(7): 1165–74. [DOI] [PMC free article] [PubMed] [Google Scholar]
- 33.Lister R, Pelizzola M, Dowen RH, Hawkins RD, Hon G, Tonti-Filippini J, et al. Human DNA methylomes at base resolution show widespread epigenomic differences. Nature. 2009;462(7271):315–22. [DOI] [PMC free article] [PubMed] [Google Scholar]
- 34.Wiench M, John S, Baek S, Johnson TA, Sung MH, Escobar T, et al. DNA methylation status predicts cell type-specific enhancer activity. EMBO J. 2011;30(15):3028–39. [DOI] [PMC free article] [PubMed] [Google Scholar]
- 35.Nordlund J, Backlin CL, Wahlberg P, Busche S, Berglund EC, Eloranta ML, et al. Genome-wide signatures of differential DNA methylation in pediatric acute lymphoblastic leukemia. Genome Biol. 2013;14(9):r105. [DOI] [PMC free article] [PubMed] [Google Scholar]
- 36.Nordlund J, Backlin CL, Zachariadis V, Cavelier L, Dahlberg J, Ofverholm I, et al. DNA methylation-based subtype prediction for pediatric acute lymphoblastic leukemia. Clin Epigenetics. 2015;7:11. [DOI] [PMC free article] [PubMed] [Google Scholar]
- 37.Thurman RE, Rynes E, Humbert R, Vierstra J, Maurano MT, Haugen E, et al. The accessible chromatin landscape of the human genome. Nature. 2012;489(7414):75–82. [DOI] [PMC free article] [PubMed] [Google Scholar]
- 38.Tsompana M, Buck MJ. Chromatin accessibility: a window into the genome. Epigenetics Chromatin. 2014;7(1):33. [DOI] [PMC free article] [PubMed] [Google Scholar]
- 39.Busche S, Ge B, Vidal R, Spinella JF, Saillour V, Richer C, et al. Integration of high-resolution methylome and transcriptome analyses to dissect epigenomic changes in childhood acute lymphoblastic leukemia. Cancer Res. 2013;73(14):4323–36. [DOI] [PubMed] [Google Scholar]
- 40.Neveu B, Spinella JF, Richer C, Lagacé K, Cassart P, Lajoie M, et al. CLIC5: a novel ETV6 target gene in childhood acute lymphoblastic leukemia. Haematologica. 2016;101(12):1534–43. [DOI] [PMC free article] [PubMed] [Google Scholar]
- 41.Consortium GT. The Genotype-Tissue Expression (GTEx) project. Nat Genet. 2013;45(6):580–5. [DOI] [PMC free article] [PubMed] [Google Scholar]
- 42.Manolio TA. Genomewide association studies and assessment of the risk of disease. N Engl J Med. 2010;363(2):166–76. [DOI] [PubMed] [Google Scholar]
- 43.Degner JF, Pai AA, Pique-Regi R, Veyrieras JB, Gaffney DJ, Pickrell JK et al. DNase I sensitivity QTLs are a major determinant of human expression variation. Nature. 2012;482(7385):390–4. [DOI] [PMC free article] [PubMed] [Google Scholar]
- 44.McVicker G, van de Geijn B, Degner JF, Cain CE, Banovich NE, Raj A, et al. Identification of genetic variants that affect histone modifications in human cells. Science. 2013;342(6159):747–9. [DOI] [PMC free article] [PubMed] [Google Scholar]
- 45.Sakabe NJ, Savic D, Nobrega MA. Transcriptional enhancers in development and disease. Genome Biol. 2012;13(1):238. [DOI] [PMC free article] [PubMed] [Google Scholar]
- 46.Engel KL, Mackiewicz M, Hardigan AA, Myers RM, Savic D. Decoding transcriptional enhancers: Evolving from annotation to functional interpretation. Semin Cell Dev Biol. 2016;57:40–50. [DOI] [PMC free article] [PubMed] [Google Scholar]
- 47.Autry RJ, Paugh SW, Carter R, Shi L, Liu J, Ferguson DC, et al. Integrative genomic analyses reveal mechanisms of glucocorticoid resistance in acute lymphoblastic leukemia. Nature Cancer. 2020;1(3):329–44. [DOI] [PMC free article] [PubMed] [Google Scholar]
- 48.Huang FW, Hodis E, Xu MJ, Kryukov GV, Chin L, Garraway LA. Highly recurrent TERT promoter mutations in human melanoma. Science. 2013;339(6122):957–9. [DOI] [PMC free article] [PubMed] [Google Scholar]
- 49.Mansour MR, Abraham BJ, Anders L, Berezovskaya A, Gutierrez A, Durbin AD, et al. Oncogene regulation. An oncogenic super-enhancer formed through somatic mutation of a noncoding intergenic element. Science. 2014;346(6215):1373–7. [DOI] [PMC free article] [PubMed] [Google Scholar]
- 50.Melton C, Reuter JA, Spacek DV, Snyder M. Recurrent somatic mutations in regulatory regions of human cancer genomes. Nat Genet. 2015;47(7):710–6. [DOI] [PMC free article] [PubMed] [Google Scholar]
- 51.Katainen R, Dave K, Pitkanen E, Palin K, Kivioja T, Valimaki N, et al. CTCF/cohesin-binding sites are frequently mutated in cancer. Nat Genet. 2015;47(7):818–21. [DOI] [PubMed] [Google Scholar]
- 52.Downing JR, Wilson RK, Zhang J, Mardis ER, Pui CH, Ding L, et al. The Pediatric Cancer Genome Project. Nat Genet. 2012;44(6):619–22. [DOI] [PMC free article] [PubMed] [Google Scholar]
- 53.Sarvaiya PJ, Schwartz JR, Hernandez CP, Rodriguez PC, Vedeckis WV. Role of c-Myb in the survival of pre B-cell acute lymphoblastic leukemia and leukemogenesis. Am J Hematol. 2012;87(10):969–76. [DOI] [PMC free article] [PubMed] [Google Scholar]
- 54.Frolova O, Samudio I, Benito JM, Jacamo R, Kornblau SM, Markovic A, et al. Regulation of HIF-1alpha signaling and chemoresistance in acute lymphocytic leukemia under hypoxic conditions of the bone marrow microenvironment. Cancer Biol Ther. 2012;13(10):858–70. [DOI] [PMC free article] [PubMed] [Google Scholar]
- 55.Khan NI, Bradstock KF, Bendall LJ. Activation of Wnt/beta-catenin pathway mediates growth and survival in B-cell progenitor acute lymphoblastic leukaemia. Br J Haematol. 2007;138(3):338–48. [DOI] [PubMed] [Google Scholar]
- 56.Thiago LS, Costa ES, Lopes DV , Otazu IB, Nowill AE, Mendes FA, et al. The Wnt signaling pathway regulates Nalm-16 b-cell precursor acute lymphoblastic leukemic cell line survival and etoposide resistance. Biomed Pharmacother. 2010;64(1):63–72. [DOI] [PubMed] [Google Scholar]
- 57.Kuhnl A, Gokbuget N, Kaiser M, Schlee C, Stroux A, Burmeister T, et al. Overexpression of LEF1 predicts unfavorable outcome in adult patients with B-precursor acute lymphoblastic leukemia. Blood. 2011;118(24):6362–7. [DOI] [PubMed] [Google Scholar]
- 58.Gang EJ, Hsieh YT, Pham J, Zhao Y, Nguyen C, Huantes S, et al. Small-molecule inhibition of CBP/catenin interactions eliminates drug-resistant clones in acute lymphoblastic leukemia. Oncogene. 2014;33(17):2169–78. [DOI] [PMC free article] [PubMed] [Google Scholar]
- 59.Hogan LE, Meyer JA, Yang J, Wang J, Wong N, Yang W, et al. Integrated genomic analysis of relapsed childhood acute lymphoblastic leukemia reveals therapeutic strategies. Blood. 2011;118(19):5218–26. [DOI] [PMC free article] [PubMed] [Google Scholar]
- 60.Maffei R, Bulgarelli J, Fiorcari S, Martinelli S, Castelli I, Valenti V, et al. Endothelin-1 promotes survival and chemoresistance in chronic lymphocytic leukemia B cells through ETA receptor. PLoS One. 2014;9(6):e98818. [DOI] [PMC free article] [PubMed] [Google Scholar]
- 61.Zylbersztejn F, Flores-Violante M, Voeltzel T, Nicolini FE, Lefort S, Maguer-Satta V. The BMP pathway: A unique tool to decode the origin and progression of leukemia. Exp Hematol. 2018;61:36–44. [DOI] [PubMed] [Google Scholar]
- 62.Hunger SP, Mullighan CG. Redefining ALL classification: toward detecting high-risk ALL and implementing precision medicine. Blood. 2015;125(26):3977–87. [DOI] [PMC free article] [PubMed] [Google Scholar]
Associated Data
This section collects any data citations, data availability statements, or supplementary materials included in this article.