

Summary
Despite the power of photopharmacology for interrogating signaling proteins, many photopharmacological systems are limited by their efficiency, speed or spectral properties. Here we screen a library of azobenzene photoswitches and identify a urea-substituted “azobenzene-400” core that offers bistable switching between cis and trans with improved kinetics, light sensitivity and a red-shift. We then focus on the metabotropic glutamate receptors (mGluRs), neuromodulatory receptors which are major pharmacological targets. Synthesis of “BGAG12,400”, a photoswitchable orthogonal, remotely-tethered ligand (PORTL), enables highly efficient, rapid optical agonism following conjugation to SNAP-tagged mGluR2 and permits robust optical control of mGluR1 and mGluR5 signaling. We then produce fluorophore-conjugated branched PORTLs to enable dual imaging and manipulation of mGluRs and highlight their power in ex vivo slice and in vivo behavioral experiments in the mouse prefrontal cortex. Finally, we demonstrate the generalizability of our strategy by developing an improved soluble, photoswitchable pore blocker for potassium channels.
Keywords: photopharmacology, azobenzene, G protein-coupled receptor, metabotropic glutamate receptor, potassium channel, PORTL, optogenetics, calcium signaling, working memory, prefrontal cortex, dorsal root ganglia
eTOC blurb
Gutzeit et al. report a chemical screen which reveals a urea-conjugated azobenzene with optimal photoswitching properties. This enables the development and characterization of optimized tethered and freely-diffusible photoswitchable ligands for GPCRs and ion channels, including the rapid manipulation of working memory via mGluR2 photo-activation in vivo in freely moving mice.
Graphical Abstract

Introduction
Photopharmacology has emerged as a methodology that offers great utility for mechanistic studies of signaling molecules (i.e. enzymes, ion channels, receptors) by allowing the function of ligands (i.e. agonists, antagonists, allosteric modulators) to be controlled by light through the incorporation of photoswitchable moieties (Hull et al., 2018; Paoletti et al., 2019). Azobenzene-based photoswitches are the most widely used due to their efficiency, reversibility and repeatability (Beharry and Woolley, 2011) and most photopharmacological compounds reported to date are soluble photochromic ligands (“PCLs”) which can be applied directly to samples to target native proteins with light-dependence. However, tethered photopharmacology, where the light-sensitive ligand is covalently-attached to a modified target protein, offers the highest precision since tethered ligands are not subject to diffusion, cell-type targeting can easily be achieved through genetic encoding of the target protein, and absolute subtype specificity is ensured via attachment chemistry (Leippe et al., 2017). Tethered photopharmacology has been applied to ion channels (Banghart et al., 2004; Izquierdo-Serra et al., 2016; Lemoine et al., 2013; Lester et al., 1980; Levitz et al., 2013; Lin et al., 2015; Sandoz et al., 2012; Tochitsky et al., 2012; Volgraf et al., 2006), G protein-coupled receptors (GPCRs) (Donthamsetti et al., 2017; Levitz et al., 2013), and enzymes (DuBay et al., 2018; Leippe et al., 2020; Tsai et al., 2015) via a variety of attachment chemistries. In the case of photoswitchable, orthogonal remotely-tethered ligands (“PORTLs”) self-labeling tags such as SNAP, CLIP or Halo (Xue et al., 2015) are employed to allow for efficient, highly-orthogonal attachment.
Despite the many advantages of photopharmacology, challenges exist for engineering efficient and user-friendly systems. Photoswitchable moieties are likely to show incomplete photoconversion, insufficient light sensitivity for some applications, require ultraviolet light and are difficult to fine-tune to produce a maximal difference between relaxed and active states of the compound. For these reasons, strategies are needed to overcome these shortcomings.
One receptor family that has been extensively targeted for photopharmacology are the metabotropic glutamate receptors (mGluRs). mGluRs are class C GPCRs that play a variety of neuromodulatory roles in the central and peripheral nervous systems and serve as drug targets for a range of disorders (Nicoletti et al., 2011). Their ubiquitous expression throughout many physiological systems (Ferraguti and Shigemoto, 2006), their rapid and spatially-confined signaling (Reiner and Levitz, 2018), the existence of many receptor subtypes which exist in overlapping expression patterns (Lee et al., 2020b) and the paucity of fully subtype-selective ligands together make mGluRs important targets for photopharmacology (Goudet et al., 2018). Indeed, mGluR2 was the first GPCR to be controlled via tethered photopharmacology, first via attachment to cysteines (Carroll et al., 2015; Levitz et al., 2013) and more recently via self-labeling tags as the original target of PORTLs (Berry et al., 2017; Broichhagen et al., 2015a; Levitz et al., 2017). Recently, we introduced branched PORTLs for mGluRs which incorporate two or four azobenzene-conjugated glutamates to enhance photoswitch efficiency and enable optical control of mGluR2 in freely-moving mice (Acosta-Ruiz et al., 2020). However, many engineering challenges for mGluR tethered photopharmacology still exist, including the need for further improvements to efficiency, light-sensitivity, speed and extension to other subtypes. For example, in the aforementioned recent study (Acosta-Ruiz et al., 2020) we developed a chimera strategy to enable optical control of mGluR5 signaling via incorporation of the mGluR2 ligand binding domain into a full-length mGluR5 construct. However, due to insufficient efficiency this approach has not been amenable to mGluR1, limiting the ability to probe the distinct roles of group I mGluRs (i.e. mGluR1 vs. mGluR5) via tethered photopharmacology.
In this study we sought to tackle the limitations of PORTLs for mGluRs and develop widely applicable strategies. We first design and synthesize a library of azobenzene variants and identify photoswitchable cores that maintain the critical feature of bistability (i.e. the ability to maintain the cis isomer in the dark following illumination) while offering subtle red-shifts, enhanced light sensitivity and improved photoswitching properties. Based on an optimized “Azobenzene-400” core, we then develop an updated family of benzylguanine-azobenzene-glutamate (“BGAG”) PORTLs for mGluRs. BGAG12,400 shows dramatically improved photo-agonism of SNAP-tagged mGluR2 compared to previous PORTLs, including in response to 405 nm light. In addition, BGAG12,400 enables high efficiency, spatiotemporally precise optical control of specific mGluR5 and mGluR1-mediated calcium signaling through a chimera approach. Branched BGAG12,400-based PORTLs further enhance photoswitching properties and enable incorporation of Cy3 or Cy5 fluorophores for dual sensing and manipulation of mGluRs. We demonstrate improved photoactivation of SNAP-mGluR2 via BGAG12,400-Cy5 in acute brain slices and in vivo in mice where targeted mGluR2 activation in the medial prefrontal cortex produces a rapid (~1–2 minutes) effect on working memory. Finally, we demonstrate the generalizability of the Azobenzene-400 core by developing AQ400, a soluble photoswitchable potassium channel pore blocker with improved photoswitch efficiency and kinetics, including with native channels in sensory DRG neurons. Together, this work shows that branching and azobenzene tuning together can enable the optimization of PORTLs and produces a family of tools with widespread applicability for the dissection of neuromodulatory signaling.
Results
Probing modified azobenzene cores to enhance efficiency and sensitivity while maintaining bistability
With the simultaneous goals of exploring the chemical space of substituents to azobenzenes and improving the efficiency and spectral properties of photoswitchable ligands, we set out to screen modified azobenzene cores. In contrast to prior studies which have aimed to dramatically red-shift the absorption spectrum of azobenzenes into the blue, green or red range (Broichhagen et al., 2015b; Kienzler et al., 2013; Mourot et al., 2011; Rullo et al., 2014; Samanta et al., 2013) we hoped to produce modest 10–20 nm red-shifts toward longer wavelengths in order to preserve photoswitch bistability while tweaking light sensitivity and photoswitching properties. Therefore, we aimed to install moieties in the para position on a “naked” azobenzene that displays a small negative Hammett parameter σp, thereby donating electrons into the π-system and inducing a small bathochromic shift. For this reason, we modified an azobenzene scaffold on its 4 position and measured the effect on its extinction coefficient and photoswitching kinetics (Figure 1A). We chose amide 1 as a reference point for comparison as all described PORTLs to date rely on this anchor point. Modifications to the azobenzene included N-methylation of 1 to obtain 2, and circular lactams with ring sizes between 4 to 7 atoms (compounds 3-6). In addition to the installation of a carbamate to produce compound 7, urea scaffolds (σp ~ –0.26) (Hansch, 1991) were screened based on their alkylation pattern to produce compounds 8-12 with different alkylation patterns (Methods Scheme 1). We determined the maximal absorbance wavelengths of our library (Figure 1B; Figure S1A) and their respective extinction coefficients in DMSO. When plotted against each other (Figure 1C), urea 8 and 11 are found in the upper right corner with the desired characteristics of a red-shifted peak and increased absorbance (Figure S1B, C). We assessed photoswitching kinetics of our library (385/500 nm, DMSO), and when plotted versus peak wavelength (Figure 1D; Figure S1D), urea 8 showed the fastest photoswitching, which is shown versus its parent molecule 1 in Figure 1E (for all values see Table 1). Compared to amide 1, urea 8 shows a red-shift in maximal absorbance by 15 nm (375 vs. 360 nm), a ~30% larger extinction coefficient (19,800 vs. 15,300 M−1 cm−1) and a two-fold increase in cis-switching kinetics at saturating light intensities (τ = 4.2 vs. 8.4 seconds) (Figure S1E, F). As such, the simple urea moiety became our candidate for further investigations, especially because compared to other variants with similar desirable properties (i.e. compound 11) it is straightforward for synthesis. Importantly, compound 8 also showed bistability where the cis isomer was maintained in the dark following illumination (Table 1), an important parameter for many biological applications. Based on the red-shift that brings the absorbance peak closer to 400 nm, we term the urea-conjugated azobenzene core “azobenzene-400” and set out to test this modification in the context of a PORTL.
Figure 1: A screen of azobenzene variants reveals red-shifted bistable variants. See also Figure S1.

(A) A screen of azobenzenes (1-12) to improve photoswitching characteristics. Azobenzenes may be switched between their cis- and trans-states by applying orthogonal wavelengths of light, and thermally relax into the stable trans-state in the dark (top). Introduced substitution patterns change the electronic structure of the azobenzene and therefore alter their photophysical properties.
(B) Normalized UV/Vis absorption spectra of compounds 1-12 in DMSO reveals hypso- or bathochromic shifts with respect to 1. Urea 8 (blue) red-shifts the spectra by ~14 nm.
(C) Plot of maximum extinction coefficient versus peak wavelength reveals candidates with red-shift and higher absorbance properties.
(D) Plot of trans to cis switching kinetics under 385 nm illumination versus peak wavelength reveals scaffold 8 with an optimal combination of a clear red-shift, fast switching kinetics, and a simple modification that is amenable to PORTL synthesis.
(E) Representative photoswitching trace showing the change in absorbance in response to 385 and 500 nm light for parent molecule 1 and compound 8. All UV/Vis experiments were conducted with 50 μM of sample in DMSO at room temperature.
Methods Scheme 1: Synthesis of an azobenzene library.

Table 1: Spectral and photophysical properties of azobenzenes 1–12.
Wavelength of maximal absorbance λmax, extinction coefficient ε and cis/trans-isomerization kinetics (τcis/trans) have been assessed by UV/Vis spectroscopy, the latter with 385 and 500 nm of light. τdark is the timescale of the thermal relaxation following occupancy of the maximal cis state and illumination with 600 nm of red light to mimic dark conditions. Relaxation curves have been fitted mono-exponential or linear, dependent on their nature, to assess τdark values in orders of magnitude in seconds. Conditions were 50 μM in DMSO at room temperature.
| Compound | λmax (nm) | ε (M−1 cm−1) | τcis (s) | τtrans (s) | τdark (s) |
|---|---|---|---|---|---|
| 1 | 360 | 15,300 | 8.4 | 31.7 | 106 |
| 2 | 338 | 16,800 | 32.1 | 53.1 | 105 |
| 3 | 366 | 22,100 | 10.5 | 34.5 | 106 |
| 4 | 362 | 18,100 | 9.5 | 37.7 | 106 |
| 5 | 343 | 15,000 | 16.8 | 39.4 | 102 |
| 6 | 346 | 15,100 | 16.1 | 42.0 | 106 |
| 7 | 360 | 17,000 | 7.5 | 30.6 | 106 |
| 8 | 375 | 19,800 | 4.2 | 21.1 | 103 |
| 9 | 372 | 19,100 | 2.2 | 24.4 | 103 |
| 10 | 373 | 11,400 | 5.0 | 27.6 | 102 |
| 11 | 378 | 20,300 | 6.0 | 24.8 | 103 |
| 12 | 359 | 15,400 | 7.9 | 32.4 | 103 |
BGAG12,400 enables near-complete optical control of SNAP-mGluR2
Based on the improved properties of the azobenzene-400 core, we decided to use this scaffold to synthesize a benzylguanine-azobenzene-glutamate (BGAG) PORTL for optical control of SNAP-mGluR2 (Figure 2A). Previous studies have used BGAG12 (Figure 2B), a BGAG variant with a 12-repeat polyethylene-glycol (PEG12) linker between benzylguanine (BG) and the azobenzene core, as a benchmark for evaluating PORTL efficiency (Broichhagen et al., 2015a). As such, BGAG12,400 was synthesized from a known precursor (Levitz et al., 2013; Broichhagen et al., 2015a) (Methods Scheme 2) by reacting the free aniline with phosgene, and trapping the formed isocyanate with an excess of ethylene diamine to create a urea linkage and another free amine for further processing in one-pot. Subsequent installation of the PEG12 chain alongside BG was performed similarly to previous studies(Acosta-Ruiz et al., 2020), including final deprotection steps to produce BGAG12,400 (Figure 2B). We reasoned that any observed red-shift from our library (Figure 1) should persist in BGAG molecules by creating a system with enhanced electron density, with an electron-donating urea and a neutral amide group on the 4 and 4’ position, respectively. Indeed, UV/Vis spectroscopy of BGAG12 or BGAG12,400 in PBS showed a red-shift of ~12 nm and an increased absorbance (ε366 nm (BGAG12) = 21,200 M−1 cm−1; ε378 nm (BGAG12,400) = 25,800 M−1 cm−1) (Figure 2C, D). Both PORTLs showed maximal cis occupancy following 380 nm illumination, but 405 nm illumination produced a larger cis occupancy for BGAG12,400 (Figure S2A–C). In line with this, the photoswitching kinetics of BGAG12 and BGAG12,400 showed that the BGAG12,400 system enabled faster switching in both directions in response to 380 or 500 nm light (Figure S2D–F). However, BGAG12,400 showed faster relaxation under dark conditions compared to BGAG12, although this was still on the order of minutes (τ = 77 s) making BGAG12,400 sufficiently bistable for most biological experiments.
Figure 2: BGAG12,400 enables ultra-efficient optical control of SNAP-mGluR2 with enhanced kinetics. See also Figure 2S.
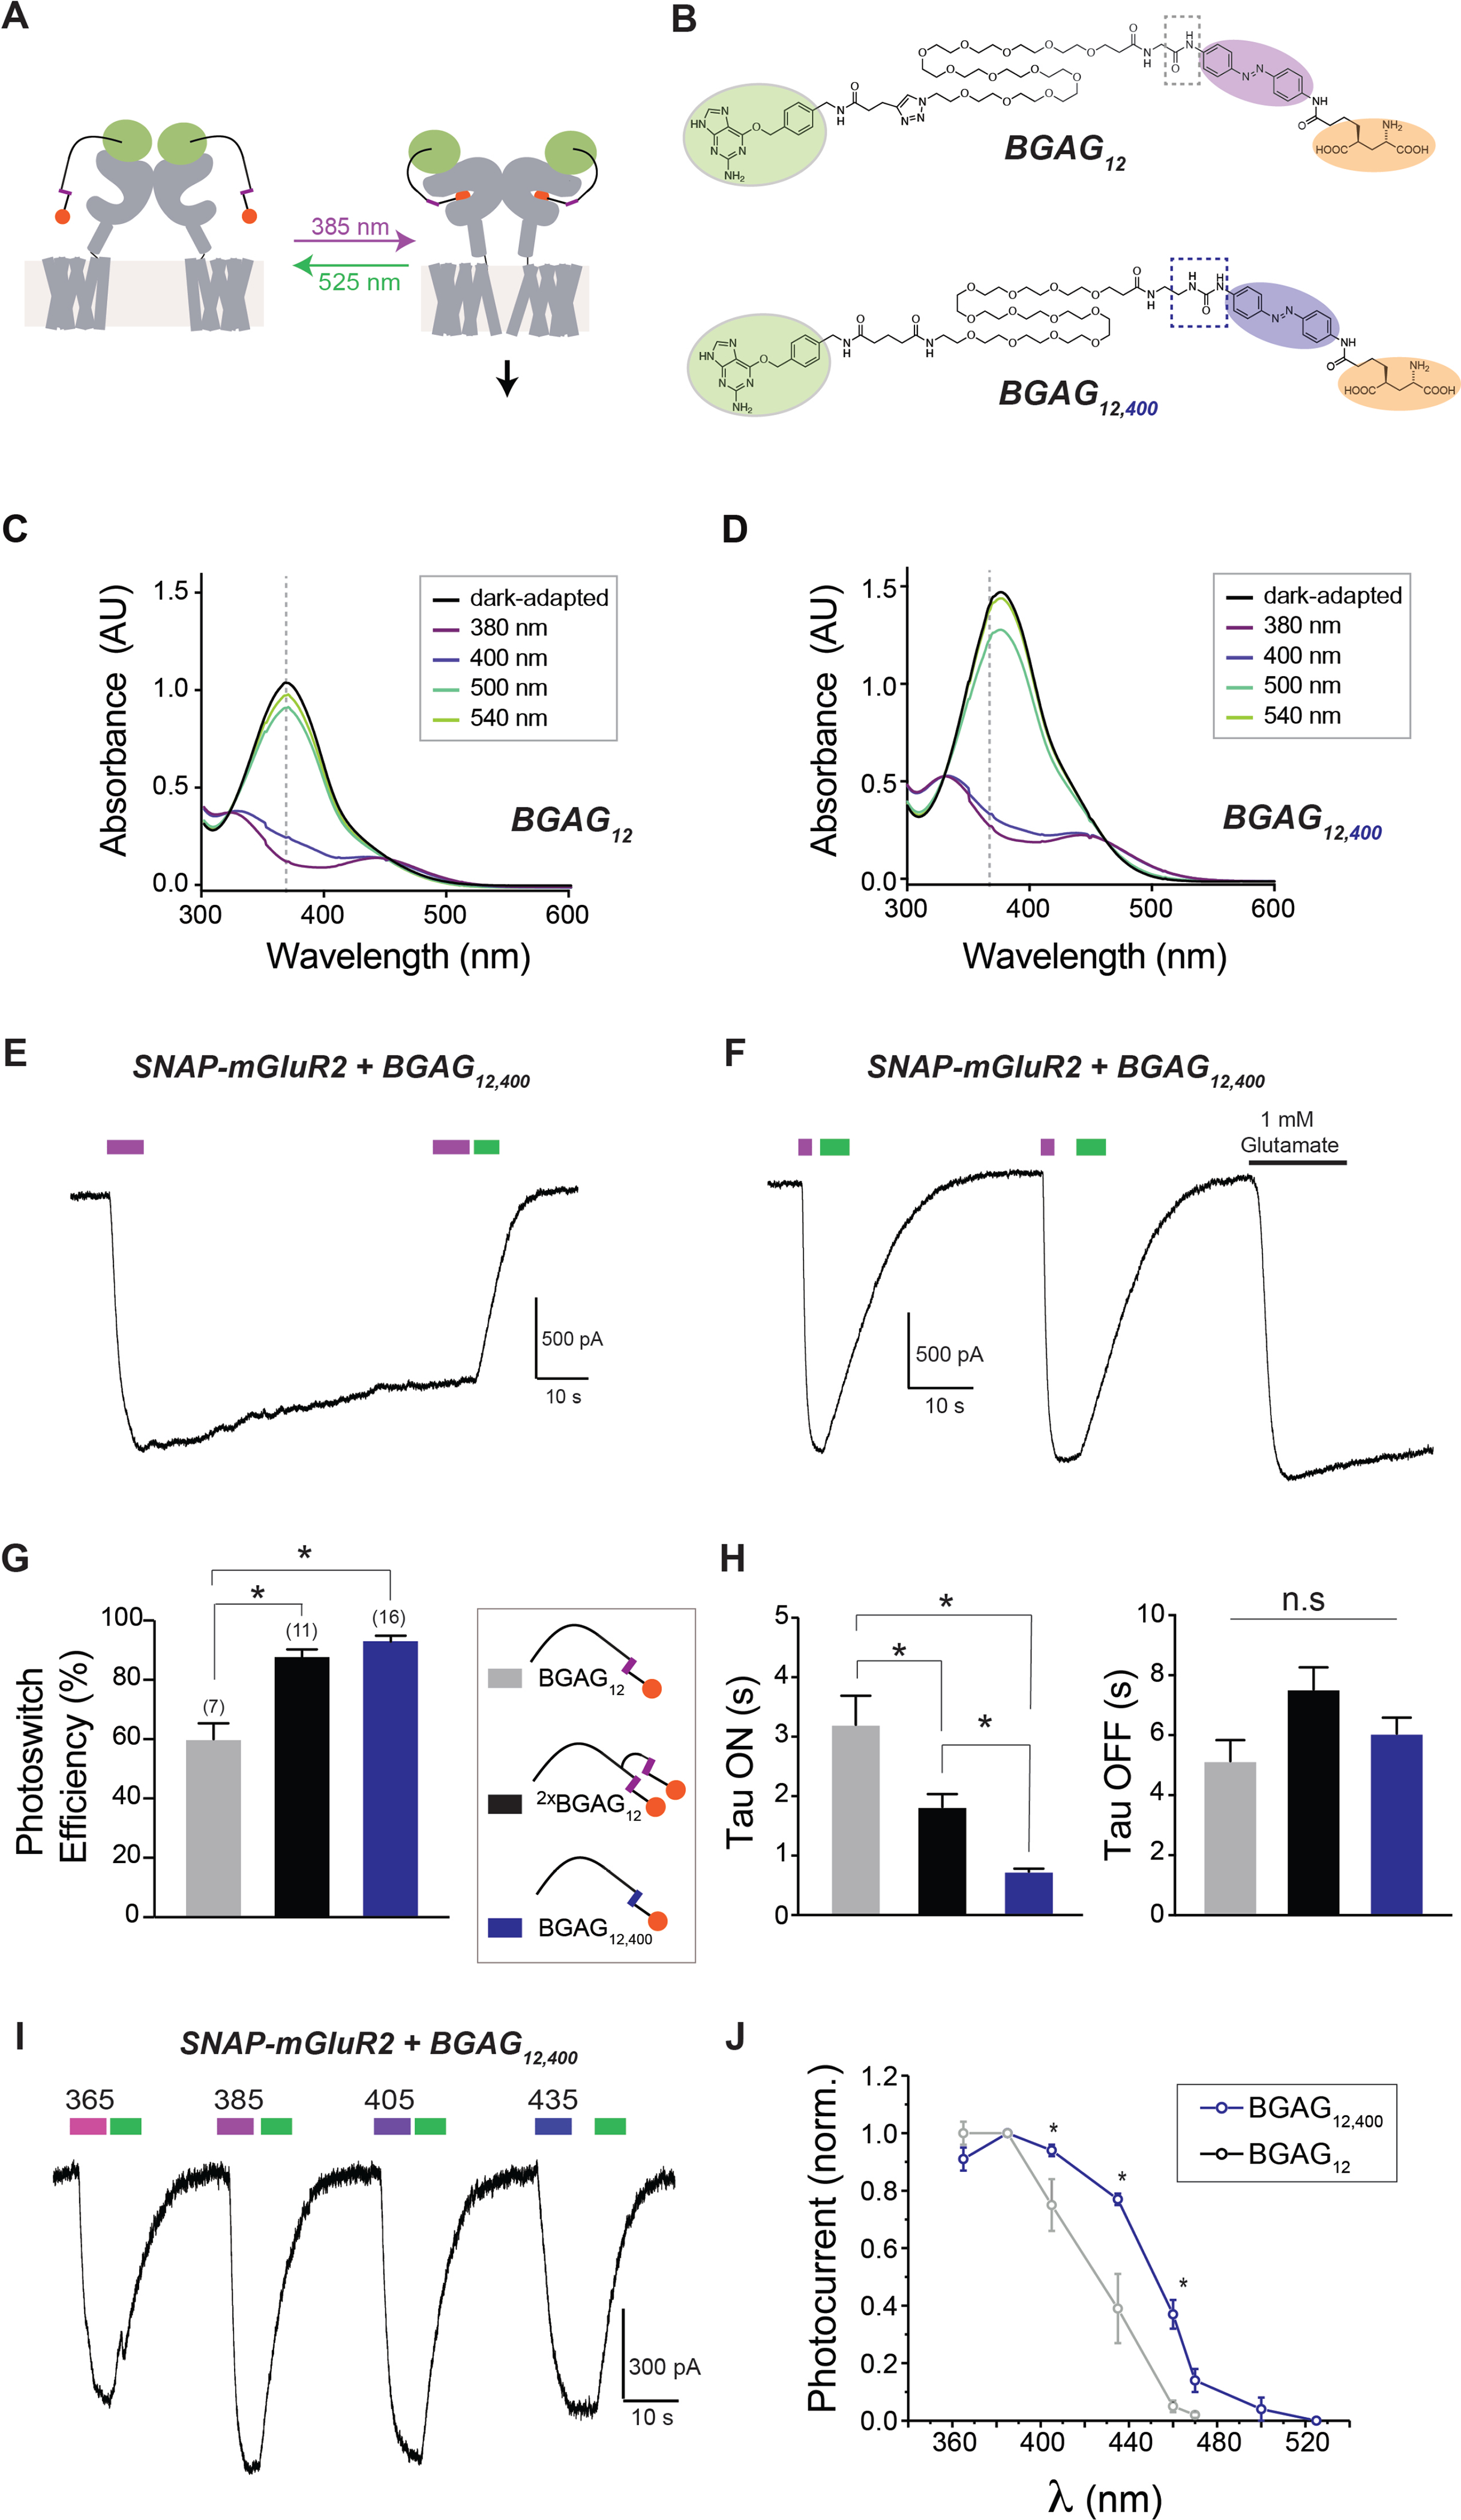
(A) Schematic showing principle of PORTL-mediated optical control of SNAP-mGluR2. Near UV light (~385 nm) typically produces trans to cis photoconversion which leads to agonism via the glutamate moiety (orange ball) which can be reversed by visible (>500 nm) light.
(B) Chemical structures of previously-reported BGAG12 (top), which uses a standard azobenzene core (purple), and BGAG12,400 (bottom), which is based on the azobenzene-400 core (blue).
(C-D) UV/Vis spectroscopy for BGAG12 and BGAG12,400 (50 μM in PBS at room temperature) following illumination with a range of wavelengths (I = 1–2 mW/mm2).
(E) Representative patch clamp trace showing bistable light-induced photo-activation (385 nm light, magenta bar) and photo-deactivation (525 nm, green bar) of SNAP-mGluR2 via BGAG12,400.
(F) Representative trace showing repeated photo-activation of SNAP-mGluR2 via BGAG12,400 followed by application of saturating 1 mM glutamate.
(G) Summary of photoswitch efficiency (photocurrent amplitude/glutamate response) for all three PORTLs tested. * indicates statistical significance (unpaired t-test, p= 0.002 for BGAG12 versus BGAG12,400 and p=0.002 for BGAG12 versus 2xBGAG12). The number of cells tested are shown in parentheses.
(H) Summary of photoswitching kinetics following 385 nm illumination (“ON”) or 525 nm illumination (“OFF”). * indicates statistical significance (unpaired t-test, p= 0.003 for BGAG12 versus BGAG12,400 and p=0.0007 for 2xBGAG12 versus 2xBGAG12,400).
(I-J) BGAG12,400 produces a red-shift in photoactivation as seen in a representative trace of photo-currents in response to various wavelengths of illumination (F) and in a summary graph (G). Notably, BGAG12,400 enables photoactivation with 405 nm light without a decrease in efficiency relative to 385 nm. In (G) all current amplitudes are normalized to the response to 385 nm light. * indicates statistical significance (unpaired t-test between BGAG12 and BGAG12,400, p= 0.05 for 405 nm, p=0.04 for 435 nm and p=0.009 for 460 nm). Error bars show s.e.m.
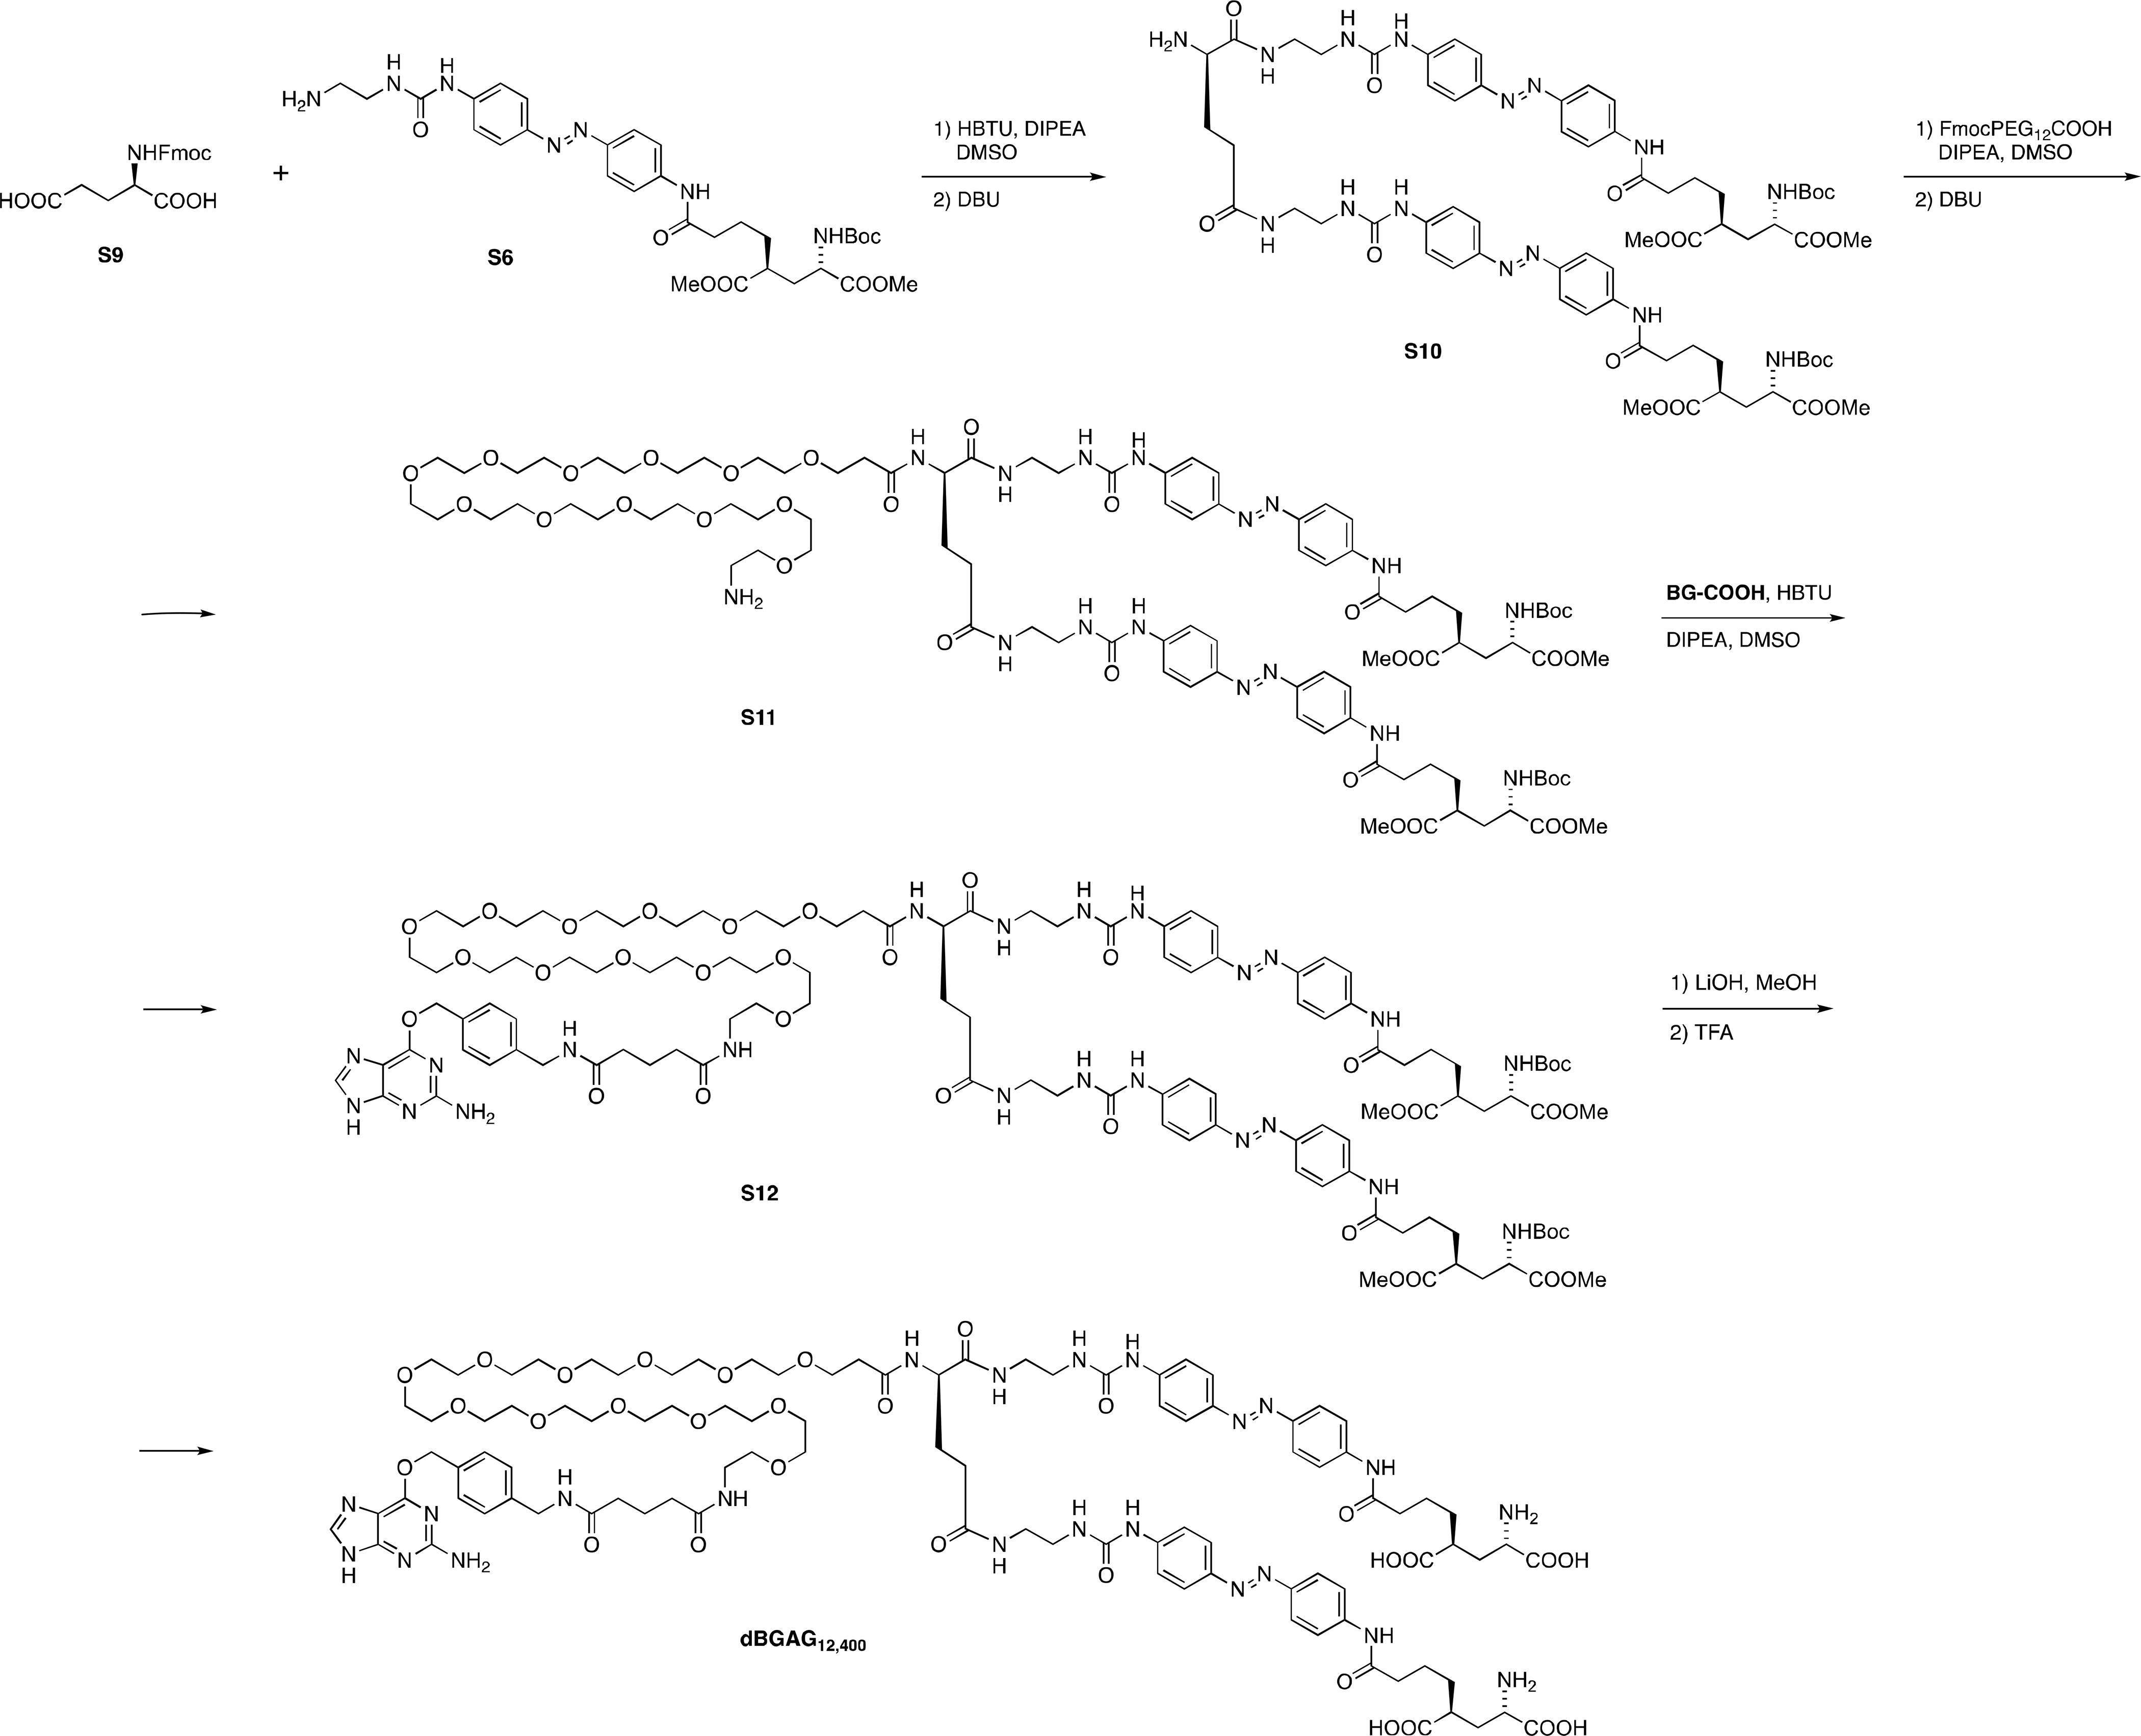
Methods Scheme 2: Synthesis of BGAG12,400.

We next tested the ability of BGAG12,400 to enable optical control of an mGluR in living cells. We turned to N-terminally SNAP-tagged mGluR2 (“SNAP-mGluR2”) which has previously been activated by the cis form of azobenzene-glutamate PORTLs (Figure 2A) (Acosta-Ruiz et al., 2020; Berry et al., 2017; Broichhagen et al., 2015a; Levitz et al., 2017). We decided to test BGAG12,400 and compare it to the original BGAG12 PORTL and its branched variant 2xBGAG12. Using a previously established competition assay we found that BGAG12,400 was able to label surface SNAP-mGluR2 with >90% efficiency in HEK 293T cells (Figure S2G), in line with previous measurements of BGAG12 (Levitz et al., 2017). Following labeling, we performed patch clamp electrophysiology recordings in cells co-expressing G protein-coupled inward rectifier potassium (GIRK) channels, and found that BGAG12,400 produced large, bi-stable inward photocurrents in response to 385 nm illumination that were reversed by 525 nm illumination (Figure 2E). Interestingly, following 385 nm illumination ~60s of dark incubation did not lead to any clear relaxation to the trans state (Figure 2E), indicating that either the proteinaceous environment or binding of the glutamate moiety enhances the stability of the cis isomer in this context. Strikingly, BGAG12,400 photocurrents were nearly as large as currents elicited by saturating (1 mM) glutamate (Figure 2F). When quantified over many cells, the photoswitch efficiency (as defined by the photocurrent amplitude compared to saturating glutamate) of BGAG12,400 was substantially higher than that observed with BGAG12 and comparable to 2xBGAG12 (Figure 2G). Furthermore, BGAG12,400 light responses showed faster ON kinetics compared to both BGAG12 and 2xBGAG12 (Figure 2H). The fact that BGAG12,400 responses were faster than 2xBGAG12 responses despite similar photoswitch efficiency suggests that this effect is due to the photoswitching kinetics of the modified azobenzene-400 core rather than differences in agonist efficacy. The OFF kinetics were similar across all three PORTLs and are likely limited by processes downstream of the receptor (Figure 2H). We also tested the spectral properties of BGAG12,400 photoswitching and found that, compared to BGAG12, there was a clear red shift in the activation spectra (Figure 2I). Substantial photocurrents could be observed into the blue range of the visible spectrum (Figure 2J). Most importantly, 405 nm illumination produced similar BGAG12,400 photocurrents compared to 385 nm indicating that this common laser wavelength is well-suited to applications of this PORTL without the trade-off of decreased efficiency.
BGAG12,400 enables efficient optical control of mGluR5 and mGluR1 signaling
Having successfully enhanced mGluR2 photo-activation with BGAG12,400, we next asked if this PORTL could improve photoswitching of another mGluR system. We first turned to optical control of mGluR5 using a recently established approach based on a chimera between the mGluR2 extracellular domain (ECD) and the mGluR5 transmembrane domain (TMD) and intracellular C-terminal domain (CTD) (Figure 3A) (Acosta-Ruiz et al., 2020). We co-transfected cells with the SNAP-tagged mGluR2-mGluR5 chimera and GCaMP6f to measure Gq-coupled calcium responses. Consistent with our previous study 2xBGAG12 enabled calcium responses to dim (~0.03 mW/mm2) 385 nm light in ~50% of cells that also responded to saturating glutamate, while BGAG12,400 produced light responses in >80% of cells (Figure 3A, B). BGAG12,400 light responses were oscillatory with a similar amplitude and frequency compared to glutamate responses, demonstrating that the PORTL recapitulates the distinct signaling dynamics of mGluR5. Importantly, no light responses were observed in cells that were not labeled with BGAG12,400 (Figure S3A).
Figure 3: BGAG12,400 enables efficient, subcellularly-targeted optical control of group I mGluR signaling. See also Figure S3.

(A) A chimera (left) between SNAP-tagged mGluR2 extracellular domain (grey) and the mGluR5 transmembrane and C-terminal domains (orange). Right, representative trace showing 385 nm light-induced calcium oscillations with similar amplitude and frequency compared to saturating glutamate. Each colored trace shows an individual cell.
(B) Summary bar graph showing the efficiency of photo-activation of SNAP-mGluR2–5 by 2xBGAG12 and BGAG12,400. The number of cells showing light responses divided by the total cells with glutamate responses is shown in parentheses. * indicates statistical significance (unpaired t-test, p=0.036).
(C-D) Photoactivation of mGluR5 signaling with spatially-targeted 405 nm illumination. A representative cell (C) shows a similar oscillatory calcium response following illumination in areas of different sizes. A summary bar graph shows higher efficiency activation by BGAG12,400 compared to 2xBGAG12 at smaller areas. * indicates statistical significance (Pearson’s chi-squared test; p= 0.002 for 0.17 μm2, p= 0.014 for 0.87 μm2).
(E) A chimera between SNAP-mGluR2 and mGluR1 (maroon) enables BGAG12,400-mediated 385 nm light-induced non-oscillatory calcium responses.
(F) Summary bar graph showing the efficiency of photo-activation of SNAP-mGluR2–1 by 2xBGAG12 and BGAG12,400. The number of cells showing light responses divided by the total cells with glutamate responses is shown in parentheses.
(G-H) Photoactivation of mGluR1 signaling with spatially-targeted 405 nm illumination. A representative cell (G) shows a transient calcium response following targeted illumination (purple circle) which spreads to the opposite side of the cell (measured at the grey region of interest). Representative images, top (G), show distinct time points (i, ii, iii, iv) which are indicated in the inset zoom-in trace. Representative trace shows calcium response at the photoactivation site (purple trace) and distal site (black trace). A summary graph (H) showing calcium responses with similar amplitude at the site of photo-activation and at a distal site of the same size.
Error bars show s.e.m.
One of the major advantages of the PORTL system is the precise spatial control enabled by light. We characterized the ability to elicit mGluR5 responses following photo-activation of small subcellular areas using targeted 405 nm laser illumination on a scanning confocal microscope. Based on the increased light-sensitivity, photoswitch efficiency and red-shifted spectra of BGAG12,400, we hypothesized that smaller areas could be used for this PORTL to produce a calcium response compared to 2xBGAG12. We imaged GCaMP6f responses while targeting 405 nm illumination to areas of 0.17, 0.87 and 13.85 μm2. While both PORTLs produced clear calcium responses to photoactivation of the large 13.85 μm2 area, BGAG12,400 produce more reliable responses to smaller areas (Figure 3C, D). For the 0.17 μm2 illumination, which is approximately the size of the dendritic spines where mGluR5 natively functions (Bourne and Harris, 2008; Lujan et al., 1996; Reiner and Levitz, 2018), no responses were observed with 2xBGAG12 while most cells labeled with BGAG12,400 responded with calcium oscillations (Figure 3C, D). Consistent with our previous finding that the size of the receptor activation area determines the probability of eliciting a calcium response but not the frequency of the response, identical calcium oscillation frequencies were observed for all three photoswitch areas (Figure 3C; Figure S3B). Together these results demonstrate that BGAG12,400 provides improved optical control of mGluR5 signaling, particularly for subcellular, spatiotemporally targeted control.
While mGluR5 is a widely-expressed biologically important receptor on its own, it exists within the group I mGluR subfamily with mGluR1. While both receptors share a general similarity in their G protein coupling preference for Gq family proteins and are primarily found post-synaptically, they show many differences in terms of signaling dynamics, interaction partners, expression patterns and disease roles (Lee et al., 2020b; Nicoletti et al., 2011; Pin and Bettler, 2016). For example, unlike mGluR5, mGluR1 does not produce calcium oscillations in response to extended glutamate activation but rather produces slowly-desensitizing responses (Kawabata et al., 1996). Surprisingly, we have previously been unable to successfully apply the mGluR2 ECD chimera strategy to mGluR1. Despite maintaining the ability to respond to glutamate with large calcium transients, both BGAG12 and 2xBGAG12 produced little to no responses to 385 nm light on a SNAP-mGluR2–1 chimera (Figure S3C). We hypothesized that efficient coupling of the mGluR2 ECD and the mGluR1 TMD requires either a higher degree of photo-agonism or different PORTL photophysical properties and wondered if BGAG12,400 could enable photo-activation. Surprisingly, BGAG12,400 enabled robust 385 nm light-induced non-oscillatory calcium responses in ~60% of cells that also showed glutamate responses (Figure 3E). SNAP-mGluR2–1 light responses were rapid, showed comparable amplitudes (84.8 ± 1.1% versus glutamate, n=171 cells) and a similar slow time course (~1–2 min) of desensitization to glutamate responses, and were repeatable over multiple bouts of photo-activation (Figure S3D).
Given the efficient light responses observed with SNAP-mGluR2–1 and the fact that mGluR1, similar to mGluR5, primarily functions in spatially confined subregions of cells, we asked if this system was amenable to targeted photoactivation. We again turned to confocal microscopy and found that 405 nm photoactivation areas as small as 0.87 μm2 produced reliable light responses in 70% of cells (n=10 cells) (Figure 3F). We previously reported that mGluR5-induced calcium oscillations spread across HEK 293 cells with limited attenuation(Acosta-Ruiz et al., 2020). Similarly, we found that cells showed a calcium transient that spread from one side of the cell to the other at ~10–20 μm/s (Figure 3G) and showed a similar amplitude both at the site of initiation and the opposite side of the cell ~15–20 μm away (Figure 3H). Together these data demonstrate a toolset for efficient, spatiotemporally-resolved optical control of characteristic mGluR5 or mGluR1 signaling via BGAG12,400.
Branched BGAG12,400 PORTLs further improve photoswitch efficiency and enable dual manipulation and detection
We next asked if the efficient BGAG12,400 PORTL could be further modified to incorporate branching. We recently showed that PORTL branching can increase photoswitch efficiency, light sensitivity and enable dual imaging and manipulation through the incorporation of fluorophores (Acosta-Ruiz et al., 2020). Our synthetic outline was designed to accommodate a branched version of BGAG12,400, which was realized by using Fmoc-protected D-glutamate as a branching scaffold. Accordingly, PEG chain and BG end group were installed similarly to prior studies to obtain 2xBGAG12,400 (Figure 4A; Figure S4A; Methods Scheme 3) which showed similar spectral properties to BGAG12,400 (Figure S4B). To enable incorporation of a fluorescent dye for direct monitoring of PORTL-labelled cells, we aimed to install Cy3 as a red and Cy5 as a far-red fluorophore (Figure 4A). This was achieved either between the PEG chain and the azobenzene (BGAG12,400-Cy3 and BGAG12,400-Cy5; Figure 4A; Figure S4C, D; Methods Scheme 4) or between the BG and the PEG chain (BGAG12,400-Cy3v2 and BGAG12,400-Cy5v2; Figure 4A; Figure S4E, F; Methods Scheme 5). Successful fusion of the azobenzene and respective dye can be seen by UV/Vis spectroscopy (Figure S4D, F) and is confirmed by mass spectrometry (see SI).
Figure 4: Branched variants of BGAG12,400 enable incorporation of fluorophores while retaining ultra-efficient mGluR2 activation. See also Figure S4.

(A) Schematic showing general design of branched azobenzene-400 PORTLs. See Supplementary Figure 4 for chemical structures.
(B-C) Representative patch clamp GIRK current traces from HEK 293T cells showing efficient photo-activation of SNAP-mGluR2 by BGAG12,400 PORTLs conjugated to Cy5 (B) or Cy3 (C). Insets show images of SNAP-mGluR2 expressing cells labeled with dye-conjugated PORTLs demonstrating clear surface fluorescence.
(D) Summary bar graph showing efficiency of photo-activation of SNAP-mGluR2 by branched BGAG12,400 PORTLs compared to 1 mM glutamate. The number of cells tested are shown in parentheses.
Error bars show s.e.m.
Methods Scheme 3: Synthesis of 2xBGAG12,400.
Methods Scheme 4: Synthesis of BGAG12,400-Cy3 and BGAG12,400-Cy5.

Methods Scheme 5: Synthesis of BGAG12,400-Cy3v2 and BGAG12,400-Cy5v2.

We tested all branched BGAG12,400 PORTLs on SNAP-mGluR2 and observed large 385 nm induced photocurrents with all compounds (Figure 4B–D). 2xBGAG12,400 showed similar efficiency (Figure 4D) compared to BGAG12,400, consistent with the interpretation that there is little room for further improvement beyond BGAG12,400. Incorporation of Cy5 at either position produced photo-activation with the same efficiency as unbranched BGAG12,400 (Figure 4B, D). This is an important improvement over BGAG12-Cy5 where a trade-off between incorporating a fluorophore and photoswitch efficiency had to be made since only one azobenzene-glutamate is included. In addition, Cy3 incorporation into BGAG12,400 did not prevent photo-activation, although BGAG12,400-Cy3v2 showed larger photocurrents than BGAG12,400-Cy3 (Figure 4C, D), suggesting that there may be some interaction between the fluorophore and the azobenzene moiety. We performed fluorescent excitation scans and identified a small band around 385 nm in all compounds that can indeed be excited by 385 or 405 nm light to elicit red and far-red emission of the Cy3 and Cy5 fluorophore, respectively (Figure S4G, H). Due to the closer proximity of the azobenzene to the fluorophore, this crosstalk is expectedly larger for BGAG12,400-Cy3/5 than for BGAG12,400-Cy3/5v2, however, this is of minimal concern as light intensities used in this plate-reader are too low to ensure efficient photoswitching (Richter et al., 2015). Importantly, dye-conjugated PORTLs showed comparable sensitivity to 405 nm illumination (Figure S4I, J) and activation kinetics compared to BGAG12,400 (Figure S4K). Together these results establish optical control and detection of mGluR2 with both Cy3 and Cy5, providing a flexible toolset for a range of applications where receptor visualization is needed (see Discussion). Finally, we confirmed that fluorophore conjugation is also compatible with efficient optical control of group I mGluR signaling via SNAP-mGluR2–5 and can be combined with optical readouts (Figure S4L, M).
BGAG12,400-Cy5 enables efficient ex vivo and in vivo optical control of mGluR2 in mice
Having established the efficiency of Azobenzene-400 PORTLs in cultured cells, we asked if the system would also enhance studies in intact tissue and in vivo in rodents. Notably, a relatively limited number of in vivo demonstrations of tethered photopharmacology in rodents have been reported in the retina (Berry et al., 2017; Caporale et al., 2011) and, more recently, in the brain (Acosta-Ruiz et al., 2020; Davenport et al., 2020; Durand-de Cuttoli et al., 2018; Levitz et al., 2016). We first tested BGAG12,400-Cy5 in acute slices of the medial prefrontal cortex (mPFC), a context where we have previously used branched PORTLs for interrogation of mGluR2-mediated neuromodulation (Acosta-Ruiz et al., 2020). We injected the mPFC of Grm2-Cre mice with an adeno-associated virus (AAV) encoding SNAP-mGluR2. SNAP-mGluR2 expression was Cre-dependent, ensuring that expression was targeted only to mPFC cells that natively express mGluR2, which primarily includes pyramidal neurons in both layer 2/3 and layer 5 (Acosta-Ruiz et al., 2020; Lee et al., 2020a). Following at least 6 weeks of expression we locally injected either BGAG12,400-Cy5 or BGAG12-Cy5, a branched PORTL based on BGAG12, into the mPFC. Following 12–16 hours, acute coronal slices were prepared and patch clamp recordings were made from fluorescently-labeled cells (Figure 5A). The Cy5 fluorophore greatly increases the efficiency of patch clamp experiments by serving as a molecular beacon to guide electrode placement. Fluorescence was observed in slices from mice injected with the SNAP-mGluR2 AAV (Figure 5B), but only a weak background was observed in slices from control mice that did not receive virus (Figure 5B).
Figure 5: Rapid photo-agonism of SNAP-mGluR2 via BGAG12,400-Cy5 ex vivo and in vivo in mouse prefrontal cortex. See also Figure S5.

(A) Schematic of acute slice experiments where 6 weeks following AAV injection BGAG12,400-Cy5 (or BGAG12-Cy5) is injected into the mPFC 12–16 hours prior to acute slice preparation and recording from fluorescent cells.
(B) Representative images of experimental and control acute slice conditions, where mice expressing SNAP-mGluR2 show robust labeling of pyramidal cells in the mPFC with BGAG12,400-Cy5 (left) but control animals without receptor expression only show weak background fluorescence (right) (scale bars = 25 μm).
(C) Representative current clamp traces showing light-induced hyperpolarization (385 nm, magenta bar) and repolarization (525 nm, green bars) in slices labeled with BGAG12-Cy5 (top) or BGAG12,400-Cy5 (bottom).
(D-E) Summary of acute slice experiments where BGAG12,400-Cy5 produced a larger light-induced hyperpolarization (D) and faster on kinetics (E). * indicates statistical significance (unpaired 2-tailed t-test, p=0.02 for amplitude and p=0.00007 for on kinetics compared to BGAG12-Cy5).
(F) Representative spike firing in response to current injections following 525 nm (green) or 385 nm (purple) illumination in a slice labeled with BGAG12,400-Cy5. SNAP-mGluR2 photo-activation reduced the number of spikes across different amplitude current injections ranging from 50 pA (bottom) to 200 pA (top).
(G) Schematic of in vivo experiments where 6 weeks following AAV injection and implant placement, BGAG12,400-Cy5 is infused into the mPFC 12–16 hours prior to behavioral testing. 515 nm illumination is applied for the first 2 minutes of the Y-maze test before the receptor is activated via 385 nm illumination for the remaining 4 minutes.
(H) Summary of Y-maze behavioral analysis. Activation of SNAP-mGluR2 reduced alterations, but no effect is seen in mice that did not receive the SNAP-mGluR2 AAV or BGAG12,400-Cy5. * indicates statistical significance (paired t-test versus first 2 minutes of assay, p=0.0001 for 10 mW/mm2 and p=0.009 for 0.1 mW/mm2).
Error bars show s.e.m.
As expected, 385 nm illumination resulted in a rapid hyperpolarization of neurons that was maintained in the dark and reversed by 525 nm illumination (Figure 5C). However, the amplitude of hyperpolarization was more than twice as large for BGAG12,400-Cy5 compared to BGAG12-Cy5, consistent with the enhanced efficiency of the azobenzene-400 PORTL (Figure 5D). Importantly, no response to light was observed in slices from mice injected with BGAG12,400-Cy5 but not the AAV-SNAP-mGluR2 (n=6 cells) or non-fluorescent cells from slices injected with both BGAG12,400-Cy5 and AAV-SNAP-mGluR2 (n=6 cells). In addition, even at a modest light intensity (~1 mW/mm2), light-induced hyperpolarization was faster for BGAG12,400-Cy5 with an average tau of less than 200 ms (Figure 5E). Both PORTLs enabled re-polarization following 525 nm illumination on the 300 ms time scale (Figure 5C). Notably, this level of control in intact tissue opens up a temporal regime for the study of neuromodulation which has not previously been available with drug perfusion or, even, uncaging where off kinetics are limited by ligand unbinding and diffusion (Reiner et al., 2015). Finally, photo-activation of SNAP-mGluR2 decreased spike firing in response to current injection (Figure 5F), consistent with reports of group II mGluR-mediated control of neuronal excitability in the prefrontal cortex (Chen et al., 2020).
We next asked if the improved properties of BGAG400 PORTLs could be harnessed for in vivo studies of mGluR2. It has previously been shown that systemic treatment with mGluR2/3 agonists impairs performance in working-memory assays (Aultman and Moghaddam, 2001; Schlumberger et al., 2009). However, these experiments were unable to answer an important question: namely, whether mGluR2 agonists influence working memory through acute, local signaling events within the mPFC or through long-lasting effects on synaptic strength and circuit function. We have recently shown that 2xBGAG12-mediated activation of SNAP-mGluR2 in Grm2-positive cells in the mPFC mimics this effect to impair working memory performance in a Y-maze assay (Acosta-Ruiz et al., 2020). Briefly, mice were observed for 5 minutes and those with photo-activated SNAP-mGluR2 showed impaired performance compared to control mice that either didn’t receive the SNAP-mGluR2 AAV or the 2xBGAG12 PORTL (Acosta-Ruiz et al., 2020). However, in these prior experiments we photo-activated SNAP-mGluR2 prior to placement of the mouse in the Y-maze since we were unsure of both the timing of the onset of effect and the ability of 2xBGAG12 to produce sufficiently rapid agonism following optical fiber-based illumination in vivo. We thus sought to take advantage of the improved efficiency and speed of the azobenzene-400 core to test if SNAP-mGluR2 photo-activation can produce rapid effects in the Y-maze assay. We injected Cre-dependent AAV SNAP-mGluR2 into the mPFC of Grm2-Cre mice while also implanting a dual fiber optic-cannula for in vivo optical control (Figure 5G). Infusion of BGAG12,400-Cy5 was performed 12 to 16 hours before behavioral testing to label receptors (Figure S5A). To test if the rapid kinetics of SNAP-mGluR2 activation by this PORTL could produce an immediate effect on working memory performance, mice were placed in the Y-maze test and observed for 2 minutes prior to receptor activation via three 2-second pulses of 385 nm illumination at either 0.1 or 10 mW/mm2 intensity every 2 minutes for 4 minutes (Figure 5G). Control mice received either a Cre-dependent AAV GFP virus and infusion of BGAG12,400-Cy5, or received Cre-dependent AAV-SNAP-mGluR2 but no BGAG12,400-Cy5 infusion. We found that photoactivation of SNAP-mGluR2 by BGAG12,400-Cy5 at 10 mW/mm2 led to a rapid deficit in working memory performance that was observable within 2 minutes and further worsened as the receptor remained active over the duration of the assay (4 minutes) (Figure 5H; Figure S5B). While activation at 0.1 mW/mm2 inhibited performance less drastically, the percent correct alternations were also reduced after 4 minutes of activation (Figure 5H), suggesting that this dim illumination is suitable for in vivo PORTL studies, especially when longer observation windows are used. Importantly, both receptor-only and PORTL-only controls showed no deficits in Y-maze performance (Figure 5H), and all groups showed a similar number of arm entries throughout the test (Figure S5C, D).
Together these results indicate that activation of SNAP-mGluR2 in the mPFC via the improved BGAG12,400-Cy5 PORTL can produce rapid behavioral effects on a shorter time scale and with a lower light intensity in vivo than previously reported. The rapid onset and high efficiency of BGAG12,400-Cy5 allowed us to find that targeted SNAP-mGluR2 activation in the subset of cortical neurons that natively express mGluR2 produces rapid deficits in the Y-maze. Not only does this experiment reproduce the effects seen with global treatment with mGluR2/3 agonists (Aultman and Moghaddam, 2001; Schlumberger et al., 2009) but, along with our previous finding that the behavioral deficit is reversible (Acosta-Ruiz et al., 2020), it indicates that mGluR2-mediated control of working memory proceeds through acute, local signaling events within the mPFC without the need for long-lasting effects on synaptic strength or circuit-level changes. More generally, these results demonstrate the ability of PORTL-based strategies to enable studies of the effects of GPCR activation in discrete brain regions and cell types during freely-moving behaviors.
Generalizability of azobenzene-400 core: enhanced efficiency of potassium channel photopharmacology
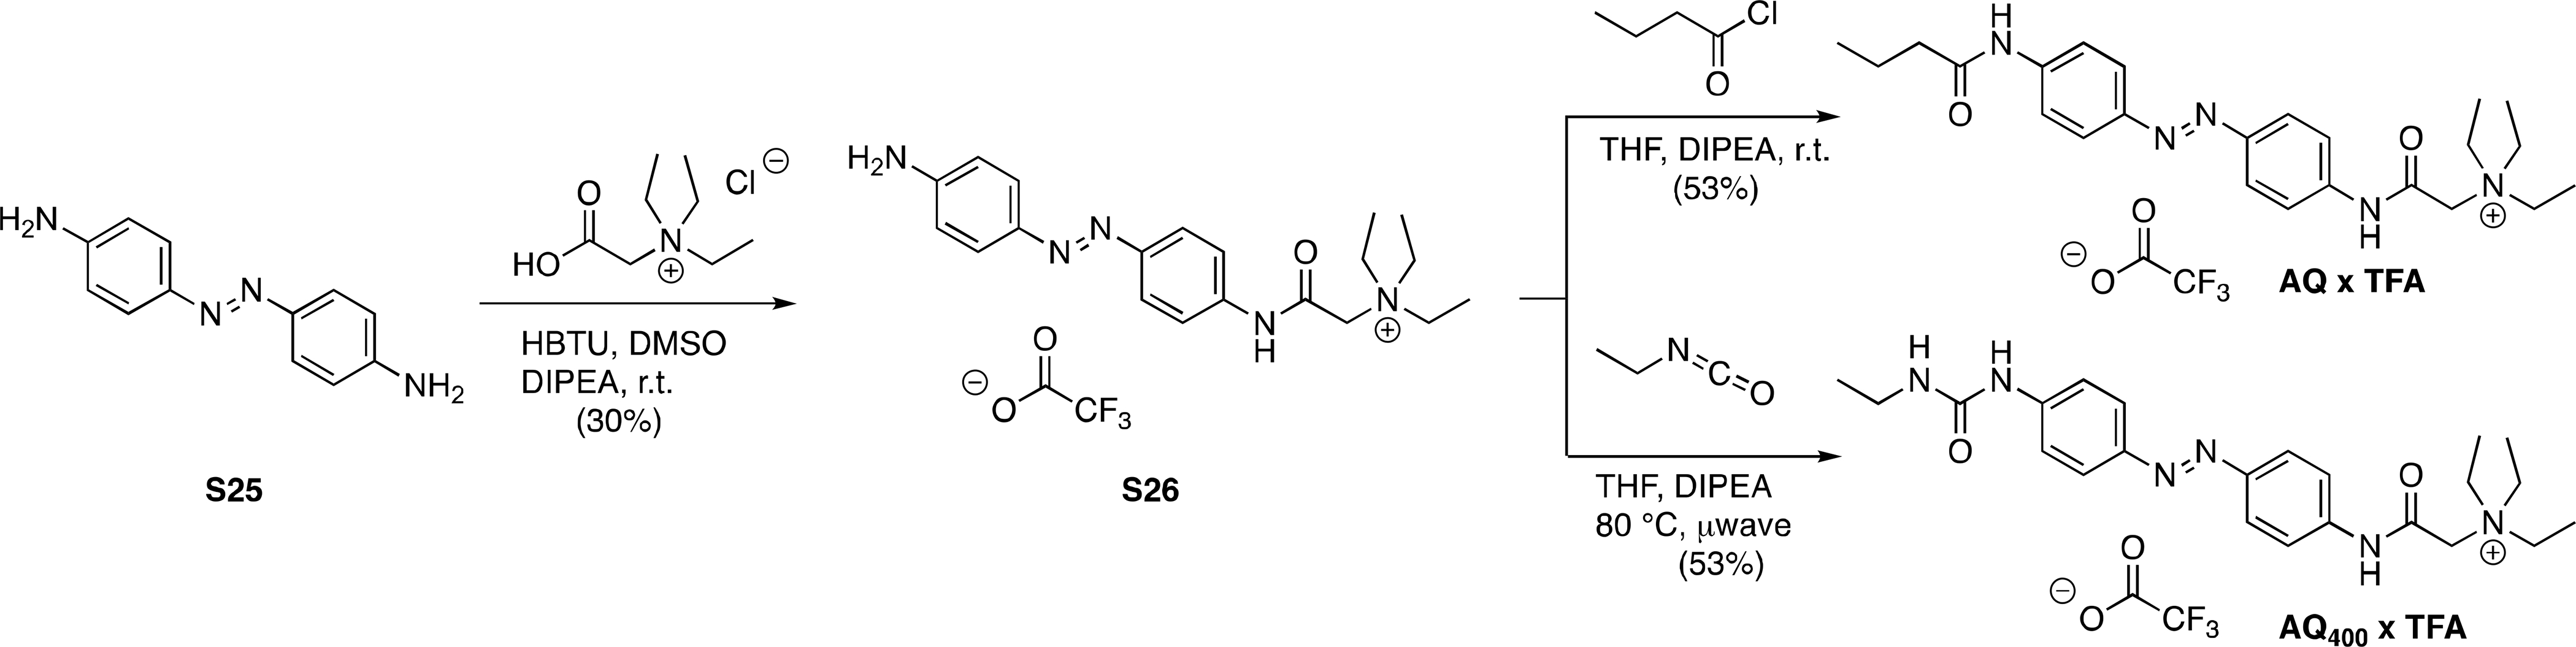
Having found that the azobenzene-400 core enhances the efficiency and kinetics of mGluR-targeting PORTLs across biological systems (Figure 2–5), we asked if these improvements can be generalized to other photopharmacological tools. We turned to photochromic ligands (PCLs) which work as soluble ligands whose function can be controlled by toggling between relaxed trans and excited cis states(Broichhagen et al., 2015c). One major advantage of PCLs is that they can be used to target native proteins without the need for genetic manipulations (Hull et al., 2018; Paoletti et al., 2019). We focused on a well-established family of PCLs based on the voltage-gated potassium channel (Kv) pore blocker, tetraethyl ammonium (TEA). TEA can bind and block ion conduction either at an external binding site or at the internal entrance to the selectivity filter (Armstrong, 1971; Choi et al., 1993; Heginbotham and MacKinnon, 1992). Endowment of TEA with an azobenzene has been shown to produce a family of intracellular light-sensitive pore blockers of Kv channels that can be used in a variety of contexts, including optical control of nociception and vision restoration (Banghart et al., 2009; Fehrentz et al., 2012; Fortin et al., 2008; Laprell et al., 2017; Mourot et al., 2012; Polosukhina et al., 2012; Tochitsky et al., 2014). A simple version of this compound bearing an aliphatic tail (Banghart et al., 2009) is here referred to as AQ (azobenzene-quaternary ammonium) (Figure 6A). We synthesized both AQ and a version based on the azobenzene-400 core, termed AQ400 (Figure 6A; Methods Scheme 6) commencing with 4,4’-azodianiline which was peptide-coupled to betaine to produce a common precursor for AQ and AQ400. Reacting the remaining aniline with butyryl chloride or ethyl isocyanate yielded AQ and AQ400, respectively. Both compounds produced expected absorbance spectra (Figure S6A, B), and as anticipated AQ400 showed a red-shift of ~11 nm and an increase in absorbance in PBS (ε360 nm (AQ) = 19,800 M−1 cm−1; ε371 nm (AQ400) = 23,400 M−1 cm−1). AQ400 also showed enhanced photoswitching kinetics compared to AQ (Figure S6C–E) and accelerated thermal relaxation that was still on the minute time scale (τ = 43 s). We also recorded 1H NMR spectra in the dark and under illumination of both AQs in D2O, and found that AQ400 outperforms AQ with higher cis content under 385 nm (91.9 vs. 89.8%) and 405 nm (85.3 vs. 75.5%) light, and higher trans content under 525 nm (92.8 vs. 84.6%) light (Figure S6F).
Figure 6: The Azobenzene-400 core enhances efficiency of potassium channel photopharmacology. See also Figure S6.

(A) Chemical structures (top) of a voltage-gated potassium channel (Kv) pore blocker bearing a quaternary ammonium (orange) and an azobenzene (purple) and schematic (bottom) showing principle of optical control of a Kv channel by AQ or AQ400.
(B-C) Representative HEK 293T whole-cell patch clamp electrophysiology traces showing AQ-mediated (B) or AQ400-mediated (C) photo-blocking of Kv1.1 by 505 nm illumination (green) and photo-unblocking by 385 nm illumination (magenta).
(D) Summary bar graph of efficiency of optical control of Kv1.1 for AQ versus AQ400. *** indicates statistical significance (unpaired t-test, p<0.001). Error bars show s.e.m.
(E-F) AQ400 shows enhanced kinetics of Kv1.1 photo-block as observed in representative whole-cell patch clamp traces (E) and summary bar graphs for channel blocking and unblocking (F). * indicates statistical significance (unpaired t-test, p<0.001 for τBlock and p<0.05 for τUnblock). Data was assessed by analyzing the first ten blocking events per cell. Error bars show s.e.m.
(G-H) AQ400 shows enhanced photocurrents in mouse DRG neurons compared to AQ. Whole-cell patch-clamp traces obtained at −40 mV (G) reveal a larger light-gated current (ΔI (I380nm-I505nm)) for AQ400 (H). * indicates statistical significance (t-test, p<0.05). The numbers of cells tested are shown in parentheses. Error bars show s.e.m.
(I) Representative traces (left) of action potential (AP) firing following 25 pA current injection under illumination with 380 nm (magenta) or 505 nm (green) light in DRG neurons treated with 100 μM AQ400. Right, summary bar graph showing reduced AP firing in 380 nm light in data from n=6 cells. * indicates statistical significance (t-test, p<0.05). Error bars show s.e.m.
Methods Scheme 6: Synthesis of AQ and AQ400.
We tested both PCLs delivered intracellularly via the patch pipette in HEK 293T cells transfected with Kv1.1, a shaker-type Kv channel. As shown in Figure 6B and 6C, alternating illumination between 500 nm and 380 nm reversibly blocks and unblocks the current elicited at −20 mV, for both compounds but the efficiency of block was higher for AQ400 than AQ (97.8 ± 5.0% vs. 68.7 ± 3.6% block efficiency; Figure 6D) at 100 μM. As expected with a quaternary ammonium pore-blocker (Zhou et al., 2001), AQ and AQ400 were also capable of light-dependent block of voltage-dependent slow inactivation (Figure S6G). Since AQ is a blocker that merely needs to bind a defined pore-lining site, the kinetics of block and unblock of the current may be a relatively direct reflection of the kinetics of photoconversion between cis and trans states, although unbinding from the pore may also contribute to this timing. Detailed analysis of the kinetics of the light responses demonstrate markedly accelerated block (τon = 37 ± 4 ms vs. 229 ± 44 ms) and unblock (τoff = 25 ± 7 ms vs. 58 ± 9 ms) by AQ400 compared to AQ (Figure 6E, F).
To validate AQ400 as a tool to provide optical control of native potassium channels and their physiological effects, we investigated the light responses to AQ and AQ400 in small and medium-sized dorsal root ganglia (DRG) neurons. We first characterized the photocurrent generated by the intracellular application of 100 μM of either compound and found that alternating illumination between 500 nm and 380 nm led to a rapid, reversible and reproducible photocurrent for both compounds (Figure 6G), with a voltage-sensitivity consistent with specific blockade of potassium conductance (Figure S6H). As was observed in HEK 293T cells, at −40 mV, the AQ400-induced photocurrent was significantly larger (~3-fold increase) (Figure 6H). Furthermore, the blocking and unblocking kinetics observed were accelerated for AQ400 (τBlock = 126 ± 17 ms vs. 245 ± 52 ms and τUnblock = 26 ± 4 ms vs. 130 ± 13 ms) (Figure S6I). These results indicate that in a native context, AQ400 presents similar advantages to the ones observed in vitro. We also tested the ability of AQ400 to modify action potential firing in response to current injection where we found 380 nm light illumination substantially reduced neuronal excitability (Figure 6J) and that this reduced excitability can be maintained in the dark for extended periods due to the bistability of the photoswitch (Figure S6J).
Together these results indicate that replacement of the azobenzene core by azobenzene-400 enhances the efficiency and speed of photoswitchable pore block and indicates that the azobenzene tuning strategy reported here is broadly applicable across modes of photopharmacology.
Discussion
Optical manipulation is a powerful, emerging approach for dissecting the cellular and circuit-level mechanisms of membrane signaling proteins, especially GPCRs (Abreu and Levitz, 2020; Spangler and Bruchas, 2017). Among the numerous approaches to optical manipulation that have been reported, tethered photopharmacology offers a particularly precise means of targeting specific proteins with spatial, temporal and genetic precision. Here we expand this toolset by fine-tuning the photoswitchable azobenzene core of a PORTL to produce optical control of signaling by mGluR2, mGluR5 and mGluR1 with the highest efficiency reported to date and straightforward application in tissue and in vivo. We show that the azobenzene-400 core can enable maximal trans to cis photo-activation at 385 nm with almost no drop in efficiency at 405 nm, where tissue penetration is optimal and laser lines are widely available. Critically, we show that the azobenzene-400 core is of broad use since it also enhances optical control of potassium channels via an azobenzene-quaternary ammonium (AQ) PCL. As demonstrated in DRG neurons, AQ400 offers a powerful means of optically controlling native potassium channels through delivery via a patch-pipette, a potentially powerful strategy for spatiotemporal analysis of channel contributions to excitability, dendritic integration or axon conduction. It’s worth noting that AQ-based tethered compounds have been reported for a range of potassium channels (Banghart et al., 2004; Fortin et al., 2011; Sandoz et al., 2012), suggesting that incorporation of azobenzene-400 is likely to be able to enhance this broad family of tools. Furthermore, other existing tethered photoswitchable compounds, including those for ionotropic glutamate receptors (Volgraf et al., 2006), P2X receptor (Lemoine et al., 2013), dopamine receptors (Donthamsetti et al., 2017), GABAA receptors (Lin et al., 2015), MEK (Tsai et al., 2015) and carbonic anhydrase II (DuBay et al., 2018), should also accommodate the reported azobenzene modification and would be expected to show improved performance. In addition, photopharmacological compounds that target intracellular sites may benefit from the azobenzene-400 core to become more efficient under 405 nm of light, including recently reported photoswitchable microtubule inhibitors (Muller-Deku et al., 2020) or PHOTACs (Reynders et al., 2020).
A major question emerging from this work is: how does the urea substitution improve photoswitching of azobenzene-400 compounds? The initial decision to replace the amide linkage stemmed from the goal of red-shifting the absorption spectra of BGAG12 (as has previously been done with modification to the azobenzene 4’-position (Broichhagen et al., 2015b; Kienzler et al., 2013; Mourot et al., 2011)) and the desire to design compounds with available precursors. Notably, red-shifting azobenzene photoswitching wavelengths into the visible with long thermal half-lives has previously been obtained by using tetra ortho-fluoro (Bleger et al., 2012), tetra ortho-chloro (Rullo et al., 2014), or tetra ortho-methoxy azobenzenes (Samanta et al., 2013). Here, based on Hammett constants for tuning azobenzenes (Runtsch et al., 2015), we aimed to install a chemical moiety that exhibits a negative Hammett parameter (Hansch, 1991) in the para-position to induce a subtle change (cf. amide: σp = 0.00). Importantly, our approach does not substantially alter the geometry or size of the photoswitch moiety, limiting the chance of steric issues that disrupt binding to targets. By synthesizing a small library to explore this on the azobenzene scaffold, we found N’-alkylated urea (σp = −0.26) to serve our needs by producing a much smaller shift than previously reported with mono- (σp = −0.70) and bis-alkylated amines (σp = −0.61) which produce larger red-shifts (~60 nm) and lack bistability (Broichhagen et al., 2015b; Broichhagen et al., 2014; Kienzler et al., 2013; Mourot et al., 2011; Stawski et al., 2012). We initially determined extinction coefficients and measured photoswitching kinetics in DMSO to decide on the most promising congener before producing PORTLs (i.e. BGAG400) and PCLs (i.e. AQ400). However, the increased light absorbance and photoswitching kinetics alone likely do not explain the enhanced light-induced effects seen with these compounds. We thus assessed the % cis and % trans in the maximum photostationary states for AQ and AQ400 by 1H NMR and found a higher cis occupancy under 385 and 405 nm and higher trans occupancy under 525 nm light for AQ400 over AQ (Fig. S6F). It is reasonable to speculate that the combination of increased maximal cis and trans occupancy, increased extinction coefficient and accelerated kinetics, are able to explain the enhanced efficiency of photoswitching for both BGAG12,400 PORTLs and the AQ400 PCL but further photophysical characterization is required. To further understand the enhanced switching efficiency, we determined quantum yields (Φ) for photoswitches (Stranius and Borjesson, 2017) 1 and 8, as well as AQ and AQ400 (Table S1 and Figure PA1–8 in the Supplementary Information). In brief, Φtrans-to-cis values were slightly higher for amide scaffolds, while Φcis-to-trans values were substantially higher for the urea congeners. Increased ON kinetics are, thus, likely due to the increase in extinction coefficient (i.e. light absorption), especially under low light intensities, while the enhanced OFF kinetics may be explained by enhanced Φcis-to-trans.
It’s worth mentioning that two previous studies used a urea-amide-conjugated azobenzene for a tethered ligand for a nicotinic acetylcholine receptor (Tochitsky et al., 2012) and a photochromic negative allosteric modulator for mGluR5 (Gomez-Santacana et al., 2017), but comparisons to a bis-amide linkage were not performed. Supporting our findings in a different photophysical system, the Raines laboratory has investigated the use of amide versus urea moieties for the development of fluorogenic dyes and found that the cross-conjugated urea on a rhodamine scaffold leads to a small 3 nm red-shift, and a substantial three-fold increase in brightness over its amide counterpart (Lavis et al., 2006). Importantly, modification to the azobenzene core also has the potential to alter the pharmacological properties of the PORTL by introducing stabilizing or de-stabilizing interactions between the PORTL and the target protein, especially given the close proximity between the azobenzene core and the pharmacophore. Such interactions may contribute to the enhanced photoswitching seen with BGAG12,400, including the case of the mGluR2–1 chimera where a particularly striking improvement compared to BGAG12 or 2xBGAG12 is observed, but future work will be needed to elucidate the structural basis of interactions between these photopharmacological ligands and their targets.
To date the biggest challenges in producing useful photopharmacological tools has been the initial design of a light-sensitive pharmacophore and, in the case of tethered photopharmacology, the installation of a parent pharmacophore into a tethered context in a way that maximizes photoswitch efficiency. In the case of azobenzene-glutamate compounds, previous work has thoroughly established that 4’ substituted glutamate with a short linker to the azobenzene is well-tolerated (Levitz et al., 2013), providing a scaffold for optimization. In this and other recent studies we have produced a set of strategies for optimizing PORTL photoswitching following the identification of a photoswitchable core. This includes optimization of PORTL length (Broichhagen et al., 2015a; Levitz et al., 2017), optimization of the choice and location of self-labeling tags (Acosta-Ruiz et al., 2020), introduction of variable numbers of branches at different branch points (Acosta-Ruiz et al., 2020) and, in this study, azobenzene tuning. It’s worth noting that the parent PCL to BGAG, AG12 shows very modest photo-agonism of mGluR2 (<20% versus 1 mM glutamate) at 0.1 mM concentration (Broichhagen et al., 2015a), but the aforementioned modifications enable PORTLs with near complete optical control. This indicates that only modestly effective PCLs can be harnessed to produce powerful PORTLs through both an increase in local concentration and further PORTL optimization. Notably, even after many previous rounds of optimization, we find in this study that further mGluR PORTL design space is available to explore. Given the nearly unlimited chemical possibilities to introduce or remove functional groups to alter photoswitching properties, linker lengths and identity, and glutamate derivatization, we foresee further prospects for the continued enhancement of mGluR-targeting PORTL molecules. More generally, future work across membrane protein targets and pharmacological modes (i.e. antagonists and allosteric modulators) will be needed to further establish an engineering pipeline for developing PORTLs and to produce a broader toolset beyond mGluRs.
Finally, it is worth considering precisely what types of experiments can be done to harness the power of efficient PORTLs for membrane receptors. We have clustered the types of experiments that can be done into 5 non-mutually exclusive classes: (i) The high temporal resolution of PORTLs can be used for detailed studies of the kinetics of receptor activation and de-activation and associated downstream signaling timescales. (ii) The ability to target light enables subcellular confinement of receptor activation to probe signal spreading dynamics within cells. (iii) Since PORTLs use full-length receptors, incorporation of receptor variants or mutations can be used to study the role of specific residues, domains or post-translational modifications in a physiological context without the need for genetic modifications. (iv) Dye-conjugated PORTLs can enable dual control and imaging of receptor populations to understand the relationship between receptor activation and localization, including receptor mobility on the cell surface or trafficking to different intracellular compartment. (v) Targeting of activation (or antagonism) of specific receptor subtypes in intact tissue or in vivo to probe the role of specific receptor subpopulations in physiological processes, including behavior. Importantly, strategies are emerging for targeting native receptors with PORTLs (Donthamsetti et al., 2019; Farrants et al., 2018) which should enhance the power of such experiments while motivating further PORTL engineering. Together, the further iterative optimization and expansion of the PORTL toolset described here, combined with thoughtful application should enable this technique to greatly contribute to our understanding of membrane protein signaling in biology.
Significance
Photopharmacology describes the implementation of molecular photoswitches to endow light sensitivity to small molecule drugs (i.e. agonists, antagonists, allosteric modulators) to manipulate biological function. Classically, azobenzenes have served as photoswitchable scaffolds that are reversibly toggled between trans and cis states with UV and green light, respectively. To overcome the need of toxic UV light and the limitations of slow and incomplete photoconversion, we fine-tuned the structure of azobenzenes via incorporation of a urea moiety. By tethering glutamate-based versions of these modified azobenzene switches to neuromodulatory metabotropic glutamate receptors (mGluRs), we enable highly efficient, rapid control of receptor signaling with brief exposures to non-toxic light. We explore this system across the family of mGluRs and show the generalizability of this approach by expanding to photoswitchable pore blockers of voltage-gated potassium ion channels. We showcase the ability of this family of tethered photoswitchable ligands to control receptor and channel function in cultured neurons and ex vivo in brain slices. Finally, we find that targeted photoactivation of mGluR2 in a subset of neurons of the medial prefrontal cortex enables acute manipulation of working memory in freely moving mice. We anticipate the engineering principles and tools reported in this study to contribute to ongoing attempts to unravel the complex interplay between molecular and systems-level neural function to enable a better understanding of the role of specific signaling proteins in health and disease.
STAR Methods
Resource Availability
Lead Contact
Further information and requests for resources and reagents should be directed to and will be fulfilled by the lead contacts, Johannes Broichhagen (broichhagen@fmp-berlin.de) or Joshua Levitz (jtl2003@med.cornell.edu).
Materials Availability
The availability of Compounds 1–12 and all BGAGs generated in this manuscript is subject to approval of use and distribution by lead contacts, Johannes Broichhagen (broichhagen@fmp-berlin.de) or Joshua Levitz (jtl2003@med.cornell.edu).
Data and Code Availability
The published article includes all datasets/code generated or analyzed during this study.
Experimental Model and Subject Details
HEK 293T cells (authenticated by Bio-Synthesis, Inc. and tested negative for mycoplasma using a kit from Molecular Probes) were cultured in DMEM medium (Gibco) supplemented with 5% fetal bovine serum (FBS) and 1% penicillin/streptomycin (Gibco). Cells were maintained in humidified incubator with 5% CO2 at 37 °C.
Mice were housed at the animal facilities of Université Cote d’Azur or Weill Cornell Medicine and were maintained on a 12 h light/dark cycle with constant temperature (23–24°C), humidity (45%–50%), and food and water ad libitum. All animal use procedures were performed in accordance with Weill Cornell Medicine Institution Animal Care & Use Committee (IACUC) guidelines under approved protocol (2017–0023) at Weill Cornell Medicine or conducted according to national and international guidelines that have been approved by the local ethical committee (CIEPAL NCE) at Université Cote d’Azur.
For DRG cultures, Dorsal Root Ganglion tissues were collected from C57BL/6J adult (>P30) female mice and treated with a mix of 2 mg/ml collagenase type II, 5 mg/ml dispase and 5 mM CaCl2 for ~20 minutes twice.
For behavior experiments, male adult postnatal weeks 8–12 Grm-Cre animals from Mutant Mouse Resource & Research Center (MMRRC) under strain name STOCK Tg (Grm2-cre) MR90Gsat/Mmucd and stock number 034611-UCD were used.
Method Details
Chemistry
Schemes for chemical synthesis including numbering are outlined in Methods Schemes 1–4. Solvents for chromatography and reactions were purchased dry over molecular sieves or in HPLC grade. Unless otherwise stated, all other reagents were used without further purification from commercial sources. Abbreviations: Boc: tert-butoxycarbonyl; DIPEA: N,N-diisopropylethylamine; DBU: 1,8-diazabicyclo[5.4.0]undec-7-ene; DCM: dichloromethane; DMF: N,N-dimethylformamide; DMSO: dimethylsulfoxide; FA: formic acid; Fmoc: fluorenylmethyloxycarbonyl; HBTU: (2-(1H-benzotriazol-1-yl)-1,1,3,3-tetramethyluronium hexafluorophosphate; TFA: trifluoroacetic acid; THF: tetrahydrofuran, TSTU: N,N,N′,N′-Tetramethyl-O-(N-succinimidyl)uronium tetrafluoroborate.
Chromatography including high resolution mass spectrometry
LC-MS was performed on i) a Shimadzu MS2020 connected to a Nexera UHPLC system equipped with a Waters ACQUITY UPLC BEH C18 (1.7 μm, 50 × 2.1 mm). Buffer A: 0.1% FA in H2O Buffer B: acetonitrile. The typical gradient was from 10% B for 0.5 min → gradient to 90% B over 4.5 min → 90% B for 0.5 min → gradient to 99% B over 0.5 min with 1 mL/min flow, or ii) an Agilent 1260 Infinity II LC System equipped with Agilent SB-C18 column (1.8 μm, 2.1 × 50 mm). Buffer A: 0.1% FA in H2O Buffer B: 0.1% FA acetonitrile. The typical gradient was from 10% B for 0.5 min → gradient to 95% B over 5 min → 95% B for 0.5 min → gradient to 99% B over 1 min with 0.8 mL/min flow. Retention times (tR) are given in minutes (min).
Preparative RP-HPLC was performed on a Waters e2695 system equipped with a 2998 PDA detector for product collection (at 220, 280, 370 or 460 nm) on a Supelco Ascentis® C18 HPLC Column (5 μm, 250 × 21.2 mm). Buffer A: 0.1% TFA in H2O Buffer B: acetonitrile. The typical gradient was from 10% B for 5 min → gradient to 90% B over 45 min → 90% B for 5 min → gradient to 99% B over 5 min with 8 mL/min flow.
High resolution mass spectrometry was performed using a Bruker maXis II ETD hyphenated with a Shimadzu Nexera system. The instruments were controlled via Brukers otofControl 4.1 and Hystar 4.1 SR2 (4.1.31.1) software. The acquisition rate was set to 3 Hz and the following source parameters were used for positive mode electrospray ionization: End plate offset = 500 V; capillary voltage = 3800 V; nebulizer gas pressure = 45 psi; dry gas flow = 10 L/min; dry temperature = 250 °C. Transfer, quadrupole and collision cell settings are mass range dependent and were fine-adjusted with consideration of the respective analyte’s molecular weight. For internal calibration sodium format clusters were used. Samples were desalted via fast liquid chromatography. A Supelco Titan™ C18 UHPLC Column, 1.9 μm, 80 Å pore size, 20 × 2.1 mm and a 2 min gradient from 10 to 98% aqueous MeCN with 0.1% FA (H2O: Carl Roth GmbH + Co. KG ROTISOLV® Ultra LC-MS; MeCN: Merck KGaA LiChrosolv® Acetonitrile hypergrade for LC-MS; FA - Merck KGaA LiChropur® Formic acid 98%−100% for LC-MS) was used for separation. Sample dilution in 10% aqueous ACN (hyper grade) and injection volumes were chosen dependent of the analyte’s ionization efficiency. Hence, on-column loadings resulted between 0.25–5.0 ng. Automated internal re-calibration and data analysis of the recorded spectra were performed with Bruker’s DataAnalysis 4.4 SR1 software.
NMR Spectroscopy
NMR spectra were recorded in deuterated solvents on a Bruker AVANCE III HD 400 equipped with a CryoProbe or on a Bruker AV-III spectrometer (600 MHz) using either a cryogenically cooled 5 mm TCI-triple resonance probe equipped with one-axis self-shielded gradients and calibrated to residual solvent peaks (1H/13C in ppm): DMSO-d6 (2.50/39.52), acetone-d6 (2.05/29.84), CDCl3 (7.26/77.0), D2O (4.70). Multiplicities are abbreviated as follows: s = singlet, d = doublet, t = triplet, q = quartet, p = pentet, h = hexet, br = broad, m = multiplet. Coupling constants J are reported in Hz. Spectra are reported based on appearance, not on theoretical multiplicities derived from structural information.
Chemical Synthesis
General procedure A for Buchwald-Hartwig cross coupling:
A flame-dried Schlenk flask was charged with (E)-1-(4-iodophenyl)-2-phenyldiazene (3) (1.0 equiv.), Pd XPhos G2 (0.1 equiv.), Cs2CO3 (2.4 equiv.), and the corresponding nitrogen-containing coupling partner (1.2 equiv.) dissolved in dry 1,4-dioxanes (144 equiv.) under an argon atmosphere. The reaction mixture was heated to reflux over night, before all volatiles were removed in vacuo, and the resulting residue subjected to either FCC or HPLC purification.
General procedure B for peptide coupling:
A 4 mL vial was charged with 1.0 equiv. of acid and 1.0 equiv. of amine dissolved in DMSO (1 mL / 10 mg) and 4.0 equiv. of DIPEA before 1.1 equiv. of HBTU was added in one portion (for amounts <1 mg of HBTU, stock solutions were prepared). Upon complete conversion according to LCMS (usually ~3 h), 4.0 equiv. of HOAc and 10 vol% water was added to the reaction mixture and the solution was subjected to RP-HPLC. Reaction scales were <100 nmol.
General procedure C for peptide coupling and Fmoc deprotection:
A 4 mL vial was charged with 1.0 equiv. amine dissolved in DMSO (1 mL / 10 mg) and 4.0 equiv. DIPEA. The acid (1.2 equiv.) and HBTU (1.2 equiv.) were added in one portion and the reaction mixture was allowed to stir at r.t. Upon complete conversion according to LCMS (usually ~3 h), 5 vol% of DBU was added and the reaction mixture was stirred for additional 10 minutes, before it was quenched by addition of 10 vol% HOAc and subjected to RP-HPLC. Reaction scales were <100 nmol.
General procedure D for ester saponification and Boc deprotection:
A 15 mL falcon tube was charged with protected compound and MeOH/1 M LiOH (1/1) was added and the resulting suspension was allowed to incubate for 45 min before it was quenched with glacial HOAc (5 vol% of the reaction volume under which the reaction clarified) and subjected to RP-HPLC. The freeze-dried product was put on ice and pre-cooled (4 °C) TFA was added neat. The reaction mixture was vortexed to ensure homogeneity and put back on ice for 15 min before all volatiles were removed under a gentle stream of nitrogen. The residue was taken up in DMF/water (9/1) and subjected to RP-HPLC. Reaction scales were <100 nmol.
NOTE: Azobenzene containing reaction mixtures turned deep red upon addition of TFA.
NOTE: It is feasible to cryo-freeze the ester cleaved product in liquid nitrogen with subsequent lyophilization and reuptake of the residue in neat TFA at 0 °C for quicker synthesis, however, we observed more side products which were not further characterized according to LCMS.
(E)-1-(4-Iodophenyl)-2-phenyldiazene (S3):
A round bottom flask was charged with 2.05 g (9.35 mmol, 1.0 equiv.) of 4-iodoaniline (S1) and 1.00 g (9.35 mmol, 1.0 equiv.) of nitrosobenzene (S2) dissolved in 100 mL DCM and 10 mL HOAc. The green reaction mixture was stirred for 24 h, turning to a dark brown solution, before it was quenched by addition of sat. aq. NaHCO3 and extracted with DCM (3 × 200 mL). The combined organic layers were washed with water and brine, dried over MgSO4, concentrated in vacuo, and the resulting solution subjected to FCC (DCM/hexanes = 1/5) to obtain 1.25 g (4.06 mmol) of the desired compound and an orange powder in 43% yield. Single crystals could be obtained by recrystallization from acetone.
1H NMR (400 MHz, acetone-d6): δ [ppm] = 8.00 (d, J = 8.6 Hz, 2H), 7.94 (dd, J = 7.7, 2.0 Hz, 2H), 7.73 (d, J = 8.6 Hz, 2H), 7.65–7.54 (m, 3H).
13C NMR (101 MHz, acetone-d6) δ [ppm] = 153.3, 152.9, 139.5, 132.5, 130.3, 125.3, 123.7, 98.3.
HRMS (ESI): calc. for C12H9IN2 [M+H]+: 308.9883, found: 308.9883.
(E)-N-(4-(Phenyldiazenyl)phenyl)acetamide (1):
A round bottom flask was charged with 200 mg (1.01 mmol, 1.0 equiv.) of 4-phenylazoaniline (4) dissolved in 10 mL THF and 430 μL DIPEA and cooled to 0 °C. 579 μL of AcCl was added dropwise and the reaction mixture was allowed to warm to r.t. for 1 h before it was quenched by addition of 0.6 mL MeOH and subjected to FCC (CHCl3/acetone = 4/1) to obtain 200 mg (836 μmol) of the desired compound as an orange solid in 82% yield.
1H NMR (400 MHz, acetone-d6): δ [ppm] = 9.47 (s, 1H), 7.97–7.84 (m, 6H), 7.59–7.49 (m, 3H), 2.14 (d, J = 2.4 Hz, 3H).
13C NMR (101 MHz, acetone-d6) δ [ppm] = 169.3, 153.6, 149.1, 143.5, 131.6, 130.1, 124.6, 123.4, 120.0, 119.9, 24.4.
HRMS (ESI): calc. for C14H14N3O [M+H]+: 240.1131, found: 240.1132.
ε360 nm (DMSO) = 15,300 M−1 cm−1
(E)-N-Methyl-N-(4-(phenyldiazenyl)phenyl)acetamide (2):
A Schlenk flask was charged with 20.1 mg (502 μmol, 1.2 equiv.) of NaH (60% in mineral oil) and 10 mL dry DMF and cooled to 0 °C. After 15 minutes of stirring, 100 mg (418 μmol, 1.0 equiv.) of azobenzene 1 dissolved in dry DMF was added dropwise, followed by dropwise addition of MeI (64.8 mg, 28 μL, 460 μmol 1.1 equiv.). The reaction mixture was allowed to warm to r.t. for 1 h before it was quenched by addition of aq. sat. NH4Cl solution and subjected to RP-HPLC to obtain 102 mg (403 μmol) of the desired compound as an orange solid in 96% yield.
1H NMR (400 MHz, DMSO-d6) δ [ppm] = 7.95–7.88 (m, 4H), 7.64–7.55 (m, 5H), 3.24 (s, 3H), 1.93 (s, 3H).
13C NMR (101 MHz, DMSO-d6): δ [ppm] = 169.1, 151.9, 150.2, 146.9, 131.7, 129.5, 127.7, 123.5, 122.6, 36.7, 22.5.
HRMS (ESI): calc. for C15H16N3O [M+H]+: 254.1288, found: 254.1288.
ε338 nm (DMSO) = 16,800 M−1 cm−1
(E)-1-(4-(Phenyldiazenyl)phenyl)azetidin-2-one (3):
Compound 3 was prepared according to general procedure A with 50.0 mg (162 μmol) of S3. HPLC purification. Yield: 41%; 16.3 mg.
1H NMR (400 MHz, DMSO-d6) δ [ppm] = 7.95 (d, J = 8.8 Hz, 2H), 7.87–7.85 (m, 2H), 7.59–7.53 (m, 5H), 3.73 (t, J = 4.6 Hz, 2H), 3.15 (t, J = 4.6 Hz, 2H).
13C NMR (101 MHz, DMSO-d6): δ [ppm] = 165.2, 152.0, 147.6, 141.1, 131.1, 129.4, 124.2, 122.4, 116.4, 38.4, 36.2.
HRMS (ESI): calc. for C15H14N3O [M+H]+: 252.1131, found: 252.1132.
ε366 nm (DMSO) = 22,100 M−1 cm−1
(E)-1-(4-(Phenyldiazenyl)phenyl)pyrrolidin-2-one (4):
Compound 4 was prepared according to general procedure A with 27.3 mg (89 μmol) of S3. HPLC purification. Yield: 43%; 10.1 mg.
1H NMR (400 MHz, DMSO-d6): δ [ppm] = 7.95–7.86 (m, 6H), 7.61–7.55 (m, 3H), 3.92 (t, J = 7.0 Hz, 2H), 2.67 (t, J = 8.1 Hz, 2H), 2.10 (p, J = 7.6 Hz, 2H).
13C NMR (101 MHz, DMSO-d6): δ [ppm] = 174.5, 152.0, 144.6, 142.4, 131.2, 129.5, 123.3, 122.4, 119.3, 48.1, 32.5, 17.3.
HRMS (ESI): calc. for C16H16N3O [M+H]+: 266.1288, found: 266.1287.
ε362 nm (DMSO) = 18,100 M−1 cm−1
(E)-1-(4-(Phenyldiazenyl)phenyl)piperidin-2-one (5):
Compound 5 was prepared according to general procedure A with 50.0 mg (162 μmol) of S3. FCC purification (gradient: 10–90% DCM in hexanes). Yield: 90%; 40.7 mg.
1H NMR (400 MHz, CDCl3) δ [ppm] = 7.96–7.90 (m, 4H), 7.54–7.43 (m, 5H), 3.71 (d, J = 6.5 Hz, 2H), 2.61 (s, 2H), 2.00–1.97 (m, 4H).
13C NMR (101 MHz, CDCl3): δ [ppm] = 170.1, 152.6, 150.6, 145.6, 131.0, 129.1, 126.4, 123.6, 122.9, 51.4, 33.0, 23.5, 21.4.
HRMS (ESI): calc. for C17H18N3O [M+H]+: 280.1444. found: 280.1443.
ε343 nm (DMSO) = 15,000 M−1 cm−1
(E)-1-(4-(Phenyldiazenyl)phenyl)azepan-2-one (6):
Compound 6 was prepared according to general procedure A with 50.0 mg (162 μmol) of S3. HPLC purification. Yield: 33%, 15.7 mg.
1H NMR (400 MHz, DMSO-d6) δ [ppm] = 7.91–7.87 (m, 4H), 7.63–7.54 (m, 3H), 7.46 (d, J = 8.7 Hz, 2H), 3.84–3.82 (m, 2H), 2.67–2.64 (m, 2H), 1.78–1.70 (m, 6H).
13C NMR (101 MHz, DMSO-d6): δ [ppm] = 174.6, 151.9, 149.2, 147.2, 131.5, 129.5, 126.8, 122.9, 122.5, 51.8, 37.1, 28.9, 28.4, 23.0.
HRMS (ESI): calc. for C18H20N3O [M+H]+: 294.1601, found: 294.1603.
ε346 nm (DMSO) = 15,100 M−1 cm−1
Methyl (E)-(4-(phenyldiazenyl)phenyl)carbamate (7):
A round bottom flask was charged with 270 mg (1.37 mmol, 1.0 equiv.) of 4-phenylazoaniline (S4) dissolved in 10 mL DCM and 562 μL DIPEA (2.2 equiv.) and cooled to 0 °C. 1 mL of phosgene (1.4 M in toluene, 1.1 equiv.) was added dropwise (the reaction mixture turning deep red upon formation of the isocyanate) and was allowed to warm to r.t. for 1 h before half of the solution’s volume (the other half, see compound 8) was transferred into a round bottom flask containing 20 mL MeOH and 562 μL DIPEA. The reaction mixture was heated to 70 °C for 2 h, before all volatiles were removed in vacuo and the crude subjected to FCC (gradient MeOH/DCM = 0/100 → 0.5/100) to obtain 148 mg (580 μmol) of the desired compound as an orange solid in 85% yield.
1H NMR (400 MHz, DMSO-d6): δ [ppm] = 10.09 (s, 1H), 7.89–7.83 (m, 4H), 7.70–7.68 (m, 2H), 7.60–7.51 (m, 3H), 3.71 (s, 3H).
13C NMR (101 MHz, DMSO-d6): δ [ppm] = 153.9, 152.1, 147.1, 142.5, 130.9, 129.4, 123.8, 122.3, 118.2, 51.9.
HRMS (ESI): calc. for C14H14N3O2 [M+H]+: 256.1081, found: 256.1081.
ε360 nm (DMSO) = 17,000 M−1 cm−1
(E)-1-Methyl-3-(4-(phenyldiazenyl)phenyl)urea (8):
The other half of the isocyanate containing solution from compound preparation 7 was transferred into a round bottom flask containing 100 mg (1.49 mmol, 2.2 equiv.) MeNH2 x HCl suspended in 20 mL THF and 562 μL DIPEA. The reaction mixture was heated to 70 °C for 2 h, before all volatiles were removed in vacuo and the crude subjected to FCC (gradient MeOH/DCM = 0/100 → 2/100) to obtain 150 mg (590 μmol) of the desired compound as an orange solid in 86% yield.
1H NMR (400 MHz, DMSO-d6): δ [ppm] = 8.99 (s, 1H), 7.84–7.81 (m, 4H), 7.62 (d, J = 8.9 Hz, 2H), 7.56 (t, J = 7.4 Hz, 2H), 7.54–7.46 (m, 1H), 6.18 (q, J = 4.6 Hz, 1H), 2.67 (d, J = 4.6 Hz, 3H).
13C NMR (101 MHz, DMSO-d6): δ [ppm] = 155.4, 152.1, 146.1, 144.2, 130.6, 129.4, 123.9, 122.2, 117.5, 26.3.
HRMS (ESI): calc. for C14H14N4O [M+H]+: 255.1240, found: 255.1240.
ε375 nm (DMSO) = 19,800 M−1 cm−1
(E)-1,1-Dimethyl-3-(4-(phenyldiazenyl)phenyl)urea (9):
Compound 9 was prepared according to general procedure A with 50.0 mg (162 μmol) of S3. HPLC purification. Yield: 86%; 37.5 mg.
1H NMR (400 MHz, DMSO-d6) δ [ppm] = 8.70 (s, 1H), 7.84–7.81 (m, 4H), 7.73 (d, J = 9.0 Hz, 2H), 7.59–7.51 (m, 3H), 2.96 (s, 6H).
13C NMR (101 MHz, DMSO-d6): δ [ppm] = 155.3, 152.1, 146.4, 144.4, 130.7, 129.4, 123.4, 122.2, 119.2, 36.3.
HRMS (ESI): calc. for C12H12N3 [M-Me2NCO+2H]+: 198.1026, found: 198.1025.
ε372 nm (DMSO) = 19,100 M−1 cm−1
(E)-1,1,3-Trimethyl-3-(4-(phenyldiazenyl)phenyl)urea (10):
Compound 10 was prepared according to general procedure A with 27.8 mg (90 μmol) of S3. HPLC purification. Yield: 24%; 6.1 mg.
1H NMR (400 MHz, acetone-d6): δ [ppm] = 7.89–7.84 (m, 4H), 7.60–7.53 (m, 3H), 7.22 (d, J = 8.9 Hz, 2H), 3.24 (s, 3H), 2.80 (s, 6H).
13C NMR (101 MHz, acetone-d6): δ [ppm] = 161.6, 153.6, 150.5, 148.5, 131.6, 130.1, 125.0, 123.3, 121.7, 38.2, 37.7.
HRMS (ESI): calc. for C16H19N4O [M+H]+: 283.1553, found: 283.1551.
ε373 nm (DMSO) = 11,400 M−1 cm−1
(E)-1-Methyl-3-(4-(phenyldiazenyl)phenyl)imidazolidin-2-one (11):
Compound 11 was prepared according to general procedure A with 50.0 mg (162 μmol) of S3. HPLC purification. Yield: 77%; 34.9 mg.
1H NMR (400 MHz, DMSO-d6) δ [ppm] = 7.90 (d, J = 9.1 Hz, 2H), 7.87–7.83 (m, 2H), 7.80 (d, J = 9.1 Hz, 2H), 7.59–7.54 (m, 3H), 3.91–3.87 (m, 2H), 3.54–3.48 (m, 2H), 2.81 (s, 3H).
13C NMR (101 MHz, DMSO-d6): δ [ppm] = 157.0, 152.1, 146.2, 143.9, 130.8, 129.4, 123.6, 122.2, 116.6, 43.2, 41.9, 30.8.
HRMS (ESI): calc. for C16H17N4O [M+H]+: 281.1397, found: 281.1395.
ε378 nm (DMSO) = 20,300 M−1 cm−1
(E)-1-Methyl-3-(4-(phenyldiazenyl)phenyl)imidazolidin-2-one (12):
Compound 12 was prepared according to general procedure A with 50.0 mg (162 μmol) of S3. HPLC purification. Yield: 44%; 20.7 mg.
1H NMR (400 MHz, DMSO-d6) δ [ppm] = 7.90–7.86 (m, 4H), 7.62–7.53 (m, 3H), 7.48 (d, J = 8.8 Hz, 2H), 6.47 (q, J = 4.5 Hz, 1H), 3.24 (s, 3H), 2.62 (d, J = 4.3 Hz, 3H).
13C NMR (101 MHz, DMSO-d6): δ [ppm] = 157.0, 152.0, 148.3, 147.5, 131.2, 129.5, 125.5, 123.2, 122.4, 36.6, 27.4.
HRMS (ESI): calc. for C15H17N4NaO [M+H]+: 291.1216, found: 291.1218.
ε359 nm (DMSO) = 15,400 M−1 cm−1
Dimethyl (2S,4S)-2-(4-((4-((E)-(4-(3-(2-aminoethyl)ureido)phenyl)diazenyl)phenyl)amino)-4-oxo-butyl)-4-((tert-butoxycarbonyl)amino)pentanedioate (S6):
A flame-dried 250 mL Schlenk flask under an argon atmosphere was charged with 500 mg (0.87 mmol, 1.0 equiv.) of dimethyl (2S,4S)-2-(4-((4-((E)-(4-aminophenyl)diazenyl)phenyl)amino)-4-oxobutyl)-4-((tert-butoxycarbonyl)amino)pentanedioate (S5) (Broichhagen et al., 2015a), before addition of 100 mL dry THF and 317 μL DIPEA (1.82 mmol, 2.1 equiv.). The reaction mixture was vigorously stirred and cooled to 0 °C in an ice-bath and 680 μL of phosgene (1.4 M in toluene; 0.95 mmol, 1.1 equiv.) was added dropwise. The yellow solution turned red upon stirring for 15 min and was transferred into an addition funnel to be added dropwise to a solution of ethylene diamine (1.0 mL, 900 mg, 15 mmol, 17.2 equiv.) in 100 mL dry THF at 0 °C. Upon complete addition, the ice bath was removed and the reaction mixture was allowed to stir for 5 min before it was quenched by addition of glacial HOAc (2.0 mL). The reaction mixture was concentrated in vacuo not exceeding 30 °C and 2 mL of DMF were added. The crude was subjected to RP-HPLC to obtain 350 mg (0.46 mmol) of the desired compound (TFA salt) as a deep red powder in 53% yield.
1H NMR (400 MHz, DMSO-d6): δ [ppm] = 10.20 (s, 1H), 9.27 (s, 1H), 7.94–7.70 (m, 9H), 7.63 (d, J = 9.0 Hz, 2H), 7.25 (d, J = 8.2 Hz, 1H), 6.64 (t, J = 5.8 Hz, 1H), 4.01 (td, J = 8.7, 5.7 Hz, 1H), 3.61 (s, 6H), 3.35 (q, J = 6.0 Hz, 2H), 2.92 (q, J = 5.9 Hz, 2H), 2.45 (t, J = 6.2 Hz, 1H), 2.40–2.30 (m, 2H), 1.95–1.79 (m, 2H), 1.64–1.48 (m, 4H), 1.37 (s, 9H).
HRMS (ESI): calc. for C31H44N7O8 [M+H]+: 642.3246, found: 642.3248.
(2S,4S)-2-(4-((4-((E)-(4-(3-(1-Amino-39-oxo-3,6,9,12,15,18,21,24,27,30,33,36-dodecaoxa-40-azadotetracontan-42-yl)ureido)phenyl)diazenyl)phenyl)amino)-4-oxobutyl)-4-((tert-butoxycarbonyl)amino)pentanedioic acid (S7):
S7 was prepared according to general procedure C.
Acid: FmocPEG12COOH; amine S6.
HRMS (ESI): calc. for C56H94N8O21 [M+2H]2+: 607.3261, found: 607.3260.
(2S,4S)-2-(4-((4-((E)-(4-(3-(1-(4-(((2-Amino-9H-purin-6-yl)oxy)methyl)phenyl)-3,7,47-trioxo-11,14,17,20,23,26,29,32,35,38,41,44-dodecaoxa-2,8,48-triazapentacontan-50-yl)ureido)-phenyl)diazenyl)phenyl)amino)-4-oxobutyl)-4-((tert-butoxycarbonyl)amino)pentanedioic acid (S8)
S8 was prepared according to general procedure B.
Acid: BG-COOH; amine S7.
HRMS (ESI): calc. for C76H116N14O24 [M+2H]2+: 804.4138, found: 804.4134.
(2S,4S)-2-(4-((4-((E)-(4-(3-(1-(4-(((2-Amino-9H-purin-6-yl)oxy)methyl)phenyl)-3,7,47-trioxo-11,14,17,20,23,26,29,32,35,38,41,44-dodecaoxa-2,8,48-triazapentacontan-50-yl)ureido)-phenyl)-diazenyl)phenyl)amino)-4-oxobutyl)-4-((tert-butoxycarbonyl)amino)pentanedioic acid (BGAG12,400):
BGAG12,400 was prepared according to general procedure D from compound S8.
HRMS (ESI): calc. for C74H112N14O24 [M+2H]2+: 790.3981, found: 790.3980; ester cleaved intermediate.
HRMS (ESI): calc. for C69H105N14O22 [M+3H]3+: 493.9170, found: 493.9178, BGAG12,400.
Tetramethyl 4,4’-(((((1E,1’E)-((((S)-7-amino-6,10-dioxo-2,5,11,14-tetraazapentadecanedioyl)-bis-(azanediyl))bis(4,1-phenylene))bis(diazene-2,1-diyl))bis(4,1-phenylene))bis(azanediyl))bis(4-oxobutane-4,1-diyl))(2S,2’S,4S,4’S)-bis(2-((tert-butoxycarbonyl)amino)pentanedioate) (S10):
S10 was prepared according to general procedure C, with 3.0 equiv of HBTU and 3.0 equiv. of S6.
Acid: S9
HRMS (ESI): calc. for C82H103N15O20 [M+2H]2+: 808.8746, found: 808.8733; Fmoc protected intermediate.
HRMS (ESI): calc. for C62H85N15O16 [M–Boc+2H]2+: 647.8144, found: 647.8135; S10.
Tetramethyl 4,4’-(((((1E,1’E)-((((S)-7-(1-amino-3,6,9,12,15,18,21,24,27,30,33,36-dodecaoxa-nona-triacontan-39-amido)-6,10-dioxo-2,5,11,14-tetraazapentadecanedioyl)bis-(azanediyl))bis(4,1-phenylene))bis(diazene-2,1-diyl))bis(4,1-phenylene))bis(azanediyl))-bis(4-oxobutane-4,1-diyl))(2S,2’S,4S,4’S)-bis(2-((tert-butoxycarbonyl)amino)-pentanedioate) (S11):
S11 was prepared according to general procedure C at 50 °C.
Acid: FmocPEG12COOH; amine S10.
HRMS (ESI): calc. for C109H156N16O33 [M+2H]2+: 1109.0520, found: 1109.0513; Fmoc protected intermediate.
HRMS (ESI): calc. for C94H146N16O31 [M+2H]2+: 998.0180, found: 998.0150; S10. Compound S12:
Tetramethyl 4,4’-(((((1E,1’E)-((((S)-7-(1-(4-(((2-amino-9H-purin-6-yl)oxy)methyl)phenyl)-3,7-dioxo-11,14,17,20,23,26,29,32,35,38,41,44-dodecaoxa-2,8-diazaheptatetracontan-47-amido)-6,10-dioxo-2,5,11,14-tetraazapentadecanedioyl)bis(azanediyl))bis(4,1-phenylene))bis(diazene-2,1-diyl))bis(4,1-phenylene))bis(azanediyl))bis(4-oxobutane-4,1-diyl))(2S,2’S,4S,4’S)-bis(2-((tert-butoxycarbonyl)amino)pentanedioate) (S12):
S12 was prepared according to general procedure B.
Acid: BG-COOH; amine S11.
HRMS (ESI): calc. for C112H164N22O34 [M+2H]2+: 1181.0900, found: 1181.0876.
(2S,2’S,4S,4’S)-4,4’-(((((1E,1’E)-((((S)-7-(1-(4-(((2-Amino-9H-purin-6-yl)oxy)methyl)phenyl)-3,7-dioxo-11,14,17,20,23,26,29,32,35,38,41,44-dodecaoxa-2,8-diazaheptatetracontan-47-amido)-6,10-dioxo-2,5,11,14-tetraazapentadecanedioyl)bis(azanediyl))bis(4,1-phenylene))bis(diazene-2,1-diyl))bis(4,1-phenylene))bis(azanediyl))bis(4-oxobutane-4,1-diyl))bis(2-aminopentanedioic acid) (2xBGAG12,400):
2xBGAG12,400 was prepared according to general procedure D from compound S12.
HRMS (ESI): calc. for C108H156N22O34 [M+2H]2+: 1153.0587, found: 1153.0575; ester cleaved intermediate.
HRMS (ESI): calc. for C98H142N22O30 [M+4H]4+: 527.0067, found: 527.0063; 2xBGAG12,400.
1-(6-(((S)-5-((((9H-Fluoren-9-yl)methoxy)carbonyl)amino)-5-carboxypentyl)amino)-6-oxohexyl)-3,3-dimethyl-2-((E)-3-((Z)-1,3,3-trimethylindolin-2-ylidene)prop-1-en-1-yl)-3H-indol-1-ium (S13):
Compound S13 was prepared as reported previously(Acosta-Ruiz et al., 2020). A round bottom flask was charged with 50.0 mg (109 μmol, 1.0 equiv.) of 1-(5-carboxypentyl)-3,3-dimethyl-2-((E)-3-((Z)-1,3,3-trimethylindolin-2-ylidene)prop-1-en-1-yl)-3H-indol-1-ium (Ueno et al., 2011) which was dissolved in 2.1 mL DMSO and 72 μL DIPEA. TSTU (32.9 mg, 109 μmol, 1.0 equiv.) was added in one portion and the mixture was incubated for 30 min before 53.1 mg (131 μmol, 1.2 equiv.) of Fmoc-Lys-OH hydrochloride (Aldrich, #17290) was added in one portion. The reaction mixture was incubated for another hour before it was quenched by addition of 72 μL HOAc and subjected to RP-HPLC to obtain 49.0 mg (60.0 μmol) of the desired product as a red powder after lyophilization in 56% yield.
HRMS (ESI): calc. for C51H59N4O5 [M]+: 807.4480, found: 807.4488.
1-(6-(((S)-5-((((9H-Fluoren-9-yl)methoxy)carbonyl)amino)-5-carboxypentyl)amino)-6-oxohexyl)-3,3-dimethyl-2-((1E,3E)-5-((Z)-1,3,3-trimethylindolin-2-ylidene)penta-1,3-dien-1-yl)-3H-indol-1-ium (S14): Compound S14 was prepared as reported previously(Acosta-Ruiz et al., 2020). A round bottom flask was charged with 35.0 mg (72.4 μmol, 1.0 equiv.) of 1-(5-carboxypentyl)-3,3-dimethyl-2-((1E,3E)-5-((Z)-1,3,3-trimethylindolin-2-ylidene)penta-1,3-dien-1-yl)-3H-indol-1-ium (Ueno et al., 2011) which was dissolved in 1.5 mL DMSO and 50 μL DIPEA. TSTU (21.8 mg, 72.4 μmol, 1.0 equiv.) was added in one portion and the mixture was incubated for 30 min before 32.0 mg (86.8 μmol, 1.2 equiv.) of Fmoc-Lys-OH hydrochloride (Aldrich, #17290) was added in one portion. The reaction mixture was incubated for another hour before it was quenched by addition of 50 μL HOAc and subjected to RP-HPLC to obtain 26 mg (32.2 μmol) of the desired product as a blue powder after lyophilization in 45% yield.
HRMS (ESI): calc. for C53H61N4O5 [M]+: 833.4636, found: 833.4639.
1-(6-(((S)-5-Amino-6-((2-(3-(4-((E)-(4-((5S,7S)-7-((tert-butoxycarbonyl)amino)-8-methoxy-5-(methoxycarbonyl)-8-oxooctanamido)phenyl)diazenyl)phenyl)ureido)ethyl)amino)-6-oxohexyl)-amino)-6-oxohexyl)-3,3-dimethyl-2-((E)-3-((Z)-1,3,3-trimethylindolin-2-ylidene)prop-1-en-1-yl)-3H-indol-1-ium (S15):
S15 was prepared according to general procedure C.
Acid: S13; amine S6.
HRMS (ESI): calc. for C84H103N11O12 [M+H–Boc]2+: 665.8548, found: 665.8544; Fmoc protected intermediate.
HRMS (ESI): calc. for C67H91N11O10 [M+H]2+: 604.8470, found: 604.8466; 27.
1-((S)-1-Amino-41-((2-(3-(4-((E)-(4-((5S,7S)-7-((tert-butoxycarbonyl)amino)-8-methoxy-5-(methoxycarbonyl)-8-oxooctanamido)phenyl)diazenyl)phenyl)ureido)ethyl)carbamoyl)-39,47-dioxo-3,6,9,12,15,18,21,24,27,30,33,36-dodecaoxa-40,46-diazadopentacontan-52-yl)-3,3-dimethyl-2-((E)-3-((Z)-1,3,3-trimethylindolin-2-ylidene)prop-1-en-1-yl)-3H-indol-1-ium (S17):
S17 was prepared according to general procedure C.
Acid: FmocNHPEG12COOH; amine S15.
HRMS (ESI): calc. for C109H154N12O25 [M+H]2+: 1016.0584, found: 1016.0581; Fmoc protected intermediate.
HRMS (ESI): calc. for C94H144N12O23 [M+H]2+: 905.0244, found: 905.0243.
1-((S)-1-(4-(((2-Amino-9H-purin-6-yl)oxy)methyl)phenyl)-49-((2-(3-(4-((E)-(4-((5S,7S)-7-((tert-butoxycarbonyl)amino)-8-methoxy-5-(methoxycarbonyl)-8-oxooctanamido)phenyl)diazenyl)-phenyl)ureido)ethyl)carbamoyl)-3,7,47,55-tetraoxo-11,14,17,20,23,26,29,32,35,38,41,44-dodecaoxa-2,8,48,54-tetraazahexacontan-60-yl)-3,3-dimethyl-2-((E)-3-((Z)-1,3,3-trimethylindolin-2-ylidene)prop-1-en-1-yl)-3H-indol-1-ium (S19):
S19 was prepared according to general procedure B.
Acid: BG-COOH; amine S17.
HRMS (ESI): calc. for C112H163N18O26 [M+2H]3+: 725.7333, found: 725.7329.
1-((S)-49-((2-(3-(4-((E)-(4-((5S,7S)-7-Amino-5,7-dicarboxyheptanamido)phenyl)diazenyl)phenyl)-ureido)ethyl)carbamoyl)-1-(4-(((2-amino-9H-purin-6-yl)oxy)methyl)phenyl)-3,7,47,55-tetraoxo-11,14,17,20,23,26,29,32,35,38,41,44-dodecaoxa-2,8,48,54-tetraazahexacontan-60-yl)-3,3-dimethyl-2-((E)-3-((Z)-1,3,3-trimethylindolin-2-ylidene)prop-1-en-1-yl)-3H-indol-1-ium (BGAG12,400-Cy3):
BGAG12,400-Cy3 was prepared according to general procedure D from compound S19.
HRMS (ESI): calc. for C110H159N18O26 [M+H]2+: 1074.0807, found: 1074.0810; ester cleaved intermediate.
HRMS (ESI): calc. for C105H150N18O24 [M+2H]3+: 683.0388, found: 683.0385; BGAG12,400-Cy3.
1-(6-(((S)-5-Amino-6-((2-(3-(4-((E)-(4-((5S,7S)-7-((tert-butoxycarbonyl)amino)-8-methoxy-5-(methoxycarbonyl)-8-oxooctanamido)phenyl)diazenyl)phenyl)ureido)ethyl)amino)-6-oxohexyl)-amino)-6-oxohexyl)-3,3-dimethyl-2-((1E,3E)-5-((Z)-1,3,3-trimethylindolin-2-ylidene)penta-1,3-dien-1-yl)-3H-indol-1-ium (S16):
S16 was prepared according to general procedure C.
Acid: S14; amine S6.
HRMS (ESI): calc. for C84H103N11O12 [M+H]2+: 728.8888, found: 728.8878; Fmoc protected intermediate.
HRMS (ESI): calc. for C69H93N11O10 [M+H]2+: 617.8548, found: 617.8548; S16.
1-((S)-1-Amino-41-((2-(3-(4-((E)-(4-((5S,7S)-7-((tert-butoxycarbonyl)amino)-8-methoxy-5-(methoxycarbonyl)-8-oxooctanamido)phenyl)diazenyl)phenyl)ureido)ethyl)carbamoyl)-39,47-dioxo-3,6,9,12,15,18,21,24,27,30,33,36-dodecaoxa-40,46-diazadopentacontan-52-yl)-3,3-dimethyl-2-((1E,3E)-5-((Z)-1,3,3-trimethylindolin-2-ylidene)penta-1,3-dien-1-yl)-3H-indol-1-ium (S18):
S18 was prepared according to general procedure C.
Acid: FmocNHPEG12COOH; amine S16.
HRMS (ESI): calc. for C111H156N12O25 [M+H]2+: 1029.0663, found: 1029.0645; Fmoc protected intermediate.
HRMS (ESI): calc. for C96H146N12O23 [M+H]2+: 918.0322, found: 918.0317; S18.
1-((S)-1-(4-(((2-Amino-9H-purin-6-yl)oxy)methyl)phenyl)-49-((2-(3-(4-((E)-(4-((5S,7S)-7-((tert-butoxycarbonyl)amino)-8-methoxy-5-(methoxycarbonyl)-8-oxooctanamido)-phenyl)diazenyl)-phenyl)ureido)ethyl)carbamoyl)-3,7,47,55-tetraoxo-11,14,17,20,23,26,29,32,35,38,41,44-dodecaoxa-2,8,48,54-tetraazahexacontan-60-yl)-3,3-dimethyl-2-((1E,3E)-5-((Z)-1,3,3-trimethylindolin-2-ylidene)penta-1,3-dien-1-yl)-3H-indol-1-ium (S20):
S20 was prepared according to general procedure B.
Acid: BG-COOH; amine S18.
HRMS (ESI): calc. for C114H165N18O26 [M+2H]3+: 734.4052, found: 734.4050.
1-((S)-49-((2-(3-(4-((E)-(4-((5S,7S)-7-Amino-5,7-dicarboxyheptanamido)phenyl)diazenyl)phenyl)-ureido)ethyl)carbamoyl)-1-(4-(((2-amino-9H-purin-6-yl)oxy)methyl)phenyl)-3,7,47,55-tetraoxo-11,14,17,20,23,26,29,32,35,38,41,44-dodecaoxa-2,8,48,54-tetraazahexacontan-60-yl)-3,3-dimethyl-2-((1E,3E)-5-((Z)-1,3,3-trimethylindolin-2-ylidene)penta-1,3-dien-1-yl)-3H-indol-1-ium (BGAG12,400-Cy5):
BGAG12,400-Cy5 was prepared according to general procedure D from compound S20.
HRMS (ESI): calc. for C112H161N18O26 [M+2H]3+: 725.0615, found: 725.0613; ester cleaved intermediate.
HRMS (ESI): calc. for C107H152N18O24 [M+2H]3+: 691.3747, found: 691.3755; BGAG12,400-Cy5.
1-((S)-47-Amino-1-((4-((E)-(4-((5S,7S)-7-((tert-butoxycarbonyl)amino)-8-methoxy-5-(methoxycarbonyl)-8-oxooctanamido)phenyl)diazenyl)phenyl)amino)-1,6,46,53-tetraoxo-9,12,15,18,21,24,27,30,33,36,39,42-dodecaoxa-2,5,45,52-tetraazaoctapentacontan-58-yl)-3,3-dimethyl-2-((E)-3-((Z)-1,3,3-trimethylindolin-2-ylidene)prop-1-en-1-yl)-3H-indol-1-ium (S21):
S21 was prepared according to general procedure C.
Acid: S13; amine S7.
HRMS (ESI): calc. for C94H144N12O23 [M+H]2+: 905.0244, found: 905.0422.
1-((S)-47-(5-((4-(((2-Amino-9H-purin-6-yl)oxy)methyl)benzyl)amino)-5-oxopentanamido)-1-((4-((E)-(4-((5S,7S)-7-((tert-butoxycarbonyl)amino)-8-methoxy-5-(methoxycarbonyl)-8-oxooctanamido)phenyl)diazenyl)phenyl)amino)-1,6,46,53-tetraoxo-9,12,15,18,21,24,27,30,33,36,39,42-dodecaoxa-2,5,45,52-tetraazaoctapentacontan-58-yl)-3,3-dimethyl-2-((E)-3-((Z)-1,3,3-trimethylindolin-2-ylidene)prop-1-en-1-yl)-3H-indol-1-ium (S23):
S23 was prepared according to general procedure B.
Acid: BG-COOH; amine S21.
HRMS (ESI): calc. for C112H163N18O26 [M+2H]3+: 725.7333, found: 725.7326.
1-((S)-1-((4-((E)-(4-((5S,7S)-7-Amino-5,7-dicarboxyheptanamido)phenyl)diazenyl)phenyl)amino)-47-(5-((4-(((2-amino-9H-purin-6-yl)oxy)methyl)benzyl)amino)-5-oxopentanamido)-1,6,46,53-tetraoxo-9,12,15,18,21,24,27,30,33,36,39,42-dodecaoxa-2,5,45,52-tetraazaoctapentacontan-58-yl)-3,3-dimethyl-2-((E)-3-((Z)-1,3,3-trimethylindolin-2-ylidene)prop-1-en-1-yl)-3H-indol-1-ium (BGAG12,400–Cy3 v2):
BGAG12,400–Cy3 was prepared according to general procedure D from compound S23.
HRMS (ESI): calc. for C110H159N18O26 [M+2H]3+: 716.3896, found: 716.3895; ester cleaved intermediate.
HRMS (ESI): calc. for C105H151N18O24 [M+2H]3+: 683.0388, found: 683.0385; BGAG12,400–Cy3.
1-((S)-47-Amino-1-((4-((E)-(4-((5S,7S)-7-((tert-butoxycarbonyl)amino)-8-methoxy-5-(methoxycarbonyl)-8-oxooctanamido)phenyl)diazenyl)phenyl)amino)-1,6,46,53-tetraoxo-9,12,15,18,21,24,27,30,33,36,39,42-dodecaoxa-2,5,45,52-tetraazaoctapentacontan-58-yl)-3,3-dimethyl-2-((1E,3E)-5-((Z)-1,3,3-trimethylindolin-2-ylidene)penta-1,3-dien-1-yl)-3H-indol-1-ium (S22):
S22 was prepared according to general procedure C.
Acid: S14; amine S7.
HRMS (ESI): calc. for C96H146N12O23 [M+H]2+: 918.0322, found: 918.0320.
1-((S)-47-(5-((4-(((2-Amino-9H-purin-6-yl)oxy)methyl)benzyl)amino)-5-oxopentanamido)-1-((4-((E)-(4-((5S,7S)-7-((tert-butoxycarbonyl)amino)-8-methoxy-5-(methoxycarbonyl)-8-oxooctan-amido)phenyl)diazenyl)phenyl)amino)-1,6,46,53-tetraoxo-9,12,15,18,21,24,27,30,33,36,39,42-dodecaoxa-2,5,45,52-tetraazaoctapentacontan-58-yl)-3,3-dimethyl-2-((1E,3E)-5-((Z)-1,3,3-trimethylindolin-2-ylidene)penta-1,3-dien-1-yl)-3H-indol-1-ium (S24):
S24 was prepared according to general procedure B.
Acid: BG-COOH; amine S22.
HRMS (ESI): calc. for C114H165N18O26 [M+2H]3+: 734.4052, found: 734.4047.
1-((S)-1-((4-((E)-(4-((5S,7S)-7-Amino-5,7-dicarboxyheptanamido)phenyl)diazenyl)phenyl)amino)-47-(5-((4-(((2-amino-9H-purin-6-yl)oxy)methyl)benzyl)amino)-5-oxopentanamido)-1,6,46,53-tetraoxo-9,12,15,18,21,24,27,30,33,36,39,42-dodecaoxa-2,5,45,52-tetraazaoctapentacontan-58-yl)-3,3-dimethyl-2-((1E,3E)-5-((Z)-1,3,3-trimethylindolin-2-ylidene)penta-1,3-dien-1-yl)-3H-indol-1-ium (BGAG12,400–Cy5 v2):
BGAG12,400–Cy5 v2 was prepared according to general procedure D from compound S24.
HRMS (ESI): calc. for C112H161N18O26 [M+2H]3+: 725.0615, found: 725.0613; ester cleaved intermediate.
HRMS (ESI): calc. for C107H153N18O24 [M+2H]3+: 691.7106, found: 691.7099; BGAG12,400–Cy5 v2.
(E)-2-((4-((4-Aminophenyl)diazenyl)phenyl)amino)-N,N,N-triethyl-2-oxoethan-1-aminium (x TFA) (S26):
A round bottom flask was charged with 240 mg (1.13 mmol, 1.1 equiv.) of 4,4’-diamino azobenzene (S25), 200 mg (1.02 mmol, 1.0 equiv.) N-(carboxymethyl)-N,N-diethylethanaminium chloride (Banghart et al., 2009) dissolved in 4 mL DMSO and 500 μL DIPEA. To the vigorously stirred solution, 425 mg (1.13 mmol, 1.1 equiv.) HBTU was added in one portion and the reaction mixture was stirred at r.t. o.n. before it was quenched by addition of 500 μL HOAc and 500 μL H2O and subjected to RP-HPLC purification to obtain 145 mg (0.31 mmol) of the desired product in 30% yield. The final compound was soluble up to 20 mg/mL in D2O.
1H NMR (400 MHz, D2O): δ [ppm] = 7.74 (d, J = 8.8 Hz, 2H), 7.69 (d, J = 9.0 Hz, 2H), 7.57–7.38 (m, 2H), 7.25 (d, J = 8.9 Hz, 2H), 4.02 (s, 2H), 3.50 (q, J = 7.2 Hz, 6H), 1.26 (t, J = 7.2 Hz, 9H).
13C NMR (101 MHz, D2O): δ [ppm] = 162.91 (q, J = 35.3 Hz), 162.64, 148.78, 147.99, 139.33, 138.78, 125.13, 123.10, 121.64, 121.61, 116.32 (q, J = 291.9 Hz), 56.41, 54.64, 6.93.
HRMS (ESI): calc. for C20H28N5O [M]+: 354.2288, found: 354.2288.
(E)-2-((4-((4-Butyramidophenyl)diazenyl)phenyl)amino)-N,N,N-triethyl-2-oxoethan-1-aminium (x TFA) (AQ):
A flame-dried 250 mL Schlenk flask under an argon atmosphere was charged with 50 mg (107 μmol, 1.0 equiv.) of S26, before addition of 10 mL dry THF and 37 μL DIPEA (214 μmol, 2.0 equiv.). The reaction mixture was vigorously stirred and cooled to 0 °C in an ice-bath and 16.7 μL of butyryl chloride (161 μmol, 1.5 equiv.) was added. Upon addition, the ice bath was removed and the reaction mixture was allowed to stir for 45 min while warming to r.t., before it was quenched by addition of glacial HOAc (0.1 mL). The reaction mixture was concentrated in vacuo and subjected to RP-HPLC to obtain 30.3 mg (57.2 μmol) of the desired compound (TFA salt) as a highly hygroscopic, orange powder in 53% yield. The final compound was soluble up to 10 mg/mL in D2O.
1H NMR (400 MHz, D2O): δ [ppm] = 7.88–7.64 (m, 4H), 7.60–7.54 (m, 4H), 4.07 (s, 2H), 3.57 (q, J = 7.2 Hz, 6H), 2.32 (t, J = 7.4 Hz, 2H), 1.64 (q, J = 7.4 Hz, 2H), 1.33 (t, J = 7.2 Hz, 9H), 0.93 (t, J = 7.4 Hz, 3H).
13C NMR (101 MHz, D2O): δ [ppm] = 175.8, 162.5, 149.1, 148.4, 140.3, 138.8, 123.6, 123.5, 121.5, 121.2, 56.4, 54.7, 38.5, 18.9, 12.8, 7.0.
HRMS (ESI): calc. for C24H34N5O2 [M]+: 424.2707, found: 424.2704.
ε360 nm (PBS) = 19,800 M−1 cm−1
(E)-N,N,N-Triethyl-2-((4-((4-(3-ethylureido)phenyl)diazenyl)phenyl)amino)-2-oxoethan-1-aminium chloride (x TFA) (AQ400):
A microwave vial was charged with 50 mg (107 μmol, 1.0 equiv.) of S26, before addition of 5 mL dry THF and 37 μL DIPEA (214 μmol, 2.0 equiv.) and 350 μL (4.42 mmol, 41 equiv.) ethyl isocyanate. The reaction mixture was vigorously stirred at 80 °C under microwave irradiation for 5 h, before it was quenched by addition of glacial HOAc (0.1 mL). The reaction mixture was concentrated in vacuo and subjected to RP-HPLC to obtain 30.0 mg (56.5 μmol) of the desired compound (TFA salt) as a hygroscopic, orange powder in 53% yield. The final compound was soluble up to 10 mg/mL in D2O.
1H NMR (400 MHz, D2O): δ [ppm] = 7.90–7.64 (m, 4H), 7.58 (d, J = 8.9 Hz, 2H), 7.43 (d, J = 9.0 Hz, 2H), 4.06 (s, 2H), 3.57 (q, J = 7.2 Hz, 6H), 3.18 (q, J = 7.3 Hz, 2H), 1.34 (t, J = 7.2 Hz, 9H), 1.11 (t, J = 7.2 Hz, 3H).
13C NMR (101 MHz, D2O): δ [ppm] = 161.9, 157.3, 151.1, 147.6, 142.3, 138.5, 123.8, 123.3, 121.5, 119.5, 56.4, 54.7, 34.8, 14.3, 7.0.
HRMS (ESI): calc. for C23H33N6O2 [M]+: 425.2660, found: 425.2659.
ε371 nm (PBS) = 23,400 M−1 cm−1
UV/Vis Spectroscopy
UV/Vis spectroscopy was performed on either: i) a JASCO V-770 UV/Vis/NIR Spectrophotometer (PbS-version) with a PAC-743 Peltierthermo 6/8 sample switching unit and a Julabo F-250 cooling system, using a Hellma quartz glass cuvettes (10 mm pathlength) and light for switching was delivered by a TILL Polychrome V coupled to a fiber optic (light intensities~ 1–2 mW/cm2); or ii) a NanoDrop 2000c using a Hellma quartz glass cuvettes (10 mm pathlength) and light for switching was delivered by a CoolLED pE-4000 (intensities used: I385 nm = 0.459 mW/mm2; I405 nm = 0.798 mW/mm2; P500 nm = 8.20 mW/mm2; P525 nm = 4.95 mW/mm2). Full spectra were acquired either in the dark or under appropriate illumination, and kinetic traces were recorded at one wavelength under annotated illumination. Results were exported and plotted in GraphPad Prism 8 and kinetic traces were fitted monoexponentially using IgorPro or GraphPad Prism 8 and plotted in GraphPad Prism 8. For the determination of extinction coefficients, see Supplementary Information.
Photostationary state measurements via NMR
Photostationary state measurements were made via 1H nuclear magnetic resonance (NMR) based on previous studies(Banghart and Trauner, 2013). AQ and AQ400 were dissolved in deuterated PBS (obtained by lyophilization of 5 mL PBS and reconstitution with 5 mL D2O) at a concentration of 100 μM and transferred to an NMR tube. Prior to measurement, the NMR tube was warmed with a heat gun to approx. 80 °C and allowed to cool to r.t. in the dark (~3 min) to ensure a 100% trans population. A custom-build fibre optic cable with an etched end surface (Dorn et al., 2012) was coupled to a CoolLED pE-4000 (powers used: P385 nm = 101 mW; P405 nm = 188 mW; P500 nm = 58 mW; P525 nm = 35 mW), inserted into the photoswitch solution and the tube was carefully lowered into the magnet. 1H NMR spectra were acquired on a Bruker AV-III spectrometer (600 MHz) using either a cryogenically cooled 5 mm TCI-triple resonance probe equipped with one-axis self-shielded gradients. 90° pulses were determined for every sample, while delay time was set to d1 = 18 seconds with a total of 16 scans. Spectra were phase and baseline corrected, and integrated aromatic peaks served to calculate the photostationary state of AQ and AQ400 in the dark, and under illumination of 385, 405, 500 or 525 nm.
Fluorescence spectroscopy in vitro
For measurements of fluorophore conjugated PORTLs (Figure S4) Compounds were dissolved in activity buffer (containing in mM: NaCl 50, HEPES 50, pH = 7.3, 0.1% BSA) to a final concentration of 200 nM and were transferred into Greiner black flat bottom 96 well plates and excitation and emission profiles were recorded on a TECAN INFINITE M PLEX plate reader. Experiments were run in quadruplicate. Data normalization, integration and plotting was performed in GraphPad Prism 8.
Quantum yield measurements
Quantum yields were acquired according to a published procedure (Stranius and Borjesson, 2017) on a Lambda 950 spectrophotometer (PerkinElmer), which is outlined in the Supplementary Information.
Molecular Cloning, Cell Culture, and Gene Expression
Experiments were performed using previously described N-terminally SNAP- or CLIP-tagged rat or human mGluR(Doumazane et al., 2011) or mGluR chimeras(Acosta-Ruiz et al., 2020) and GIRK1-F137S(Vivaudou et al., 1997). The chimeric SNAP-mGluR2-mGluR1 construct was made via Gibson assembly using the extracellular domain of SNAP-tagged rat mGluR2 (K23 to E559) and rat mGluR1 transmembrane domain and C-terminal domain (Y585 to STOP).
HEK 293T cells were plated at low density on poly-L-lysine coated coverslips (18 mm) and transfected the following day using Lipofectamine 2000 (Thermo Fisher). 24–48 hrs after transfection, cells were used for electrophysiology or imaging experiments. As previously described (25), for SNAP-mGluR2 electrophysiology experiments each coverslip received SNAP-mGluR2, GIRK1-F137S and tdTomato as a transfection marker. For calcium imaging experiments, each coverslip received the receptor of interest plus GCaMP6f(Chen et al., 2013). For potassium channel experiments, cells were co-transfected with Kv1.1(Lesage et al., 1992) and eYFP using the calcium phosphate method with a total amount 3.6 μg of DNA and a ratio of 5:1.
For DRG cultures, Dorsal Root Ganglion tissues were collected from female mice and treated with a mix of 2 mg/ml collagenase type II, 5 mg/ml Dispase and 5 mM CaCl2 for ~ 20 minutes twice. Neurons were dissociated by triturating through needles of 21G and 26G then seeded on poly-lysine and laminin coated coverslips. The NeuroBasal A-based culture medium contained 1x B27, 2 mM L-glutamine, 100 ng/ml NGF, 10 ng/ml NT3, 2 ng/ml GDNF, 10 ng/ml BDNF, 30 ng/ml Retinoic acid and a mix Penitrem A/Streptomycin.
HEK 293T and DRG Electrophysiology
Whole cell patch clamp recordings from HEK 293T cells expressing SNAP-mGluR2 were performed as previously described (Acosta-Ruiz et al., 2020). Briefly, voltage clamp recordings at −60 mV were performed in a high potassium (120 mM) solution to enable large inward currents upon receptor activation. Cells were incubated with 1–10 μM of PORTL for 45–60 min at 37 °C in the appropriate extracellular recording solution. Labeling efficiency was determined as previously described25. Illumination was applied to the entire field of view using a CoolLED pE-4000 through a 40× objective. Light intensity in the sample plane was 1–2 mW/mm2. pClamp software was used for data acquisition, control of illumination and data analysis.
Whole cell patch clamp recordings from HEK 293T cells expressing Kv1.1 were performed using glass pipettes of resistance between 3 and 6 MΩ filled with intracellular solution containing (in mM): 155 KCl, 5 EGTA, 3 MgCl2, 10 HEPES, pH 7.3. The extracellular bath solution contained (in mM): 150 NaCl, 5 KCl, 2 CaCl2 and 10 HEPES. Cells were voltage clamped using a MultiClamp700B (Molecular Devices) amplifier in the whole cell mode. The holding potential was set to −80 mV and stepped to −20 mV to elucidate K+ currents. Illumination was controlled using a Lambda DG4 high speed wavelength switcher (Sutter) with 380 nm and 500 nm filters through a 40× objective. Light intensity in the sample plane was 10–20 mW/mm2. pClamp software was used for data acquisition, control of illumination and data analysis.
Whole cell patch clamp recordings from small-diameter (<25 μm) DRG neurons were performed in extracellular solution containing (in mM): 140 NaCl, 5 KCl, 1 MgCl2, 2 CaCl2, 10 HEPES, 10 glucose, pH 7.4 with NaOH. Glass pipettes were pulled with a resistance < 5 MΩ and filled with intracellular solution containing (in mM): 155 KCl, 5 EGTA, 3 MgCl2, 10 HEPES, pH 7.3 with KOH. Neurons were patch clamped using an Axopatch 200B (Molecular Devices) amplifier in the whole cell mode. Series resistance (< 10 MΩ) was not compensated. Signals were filtered at 10 kHz and digitized at 20 kHz. After establishing whole-cell access, membrane capacitance was determined with amplifier circuitry. The amplifier was then switched to current-clamp mode to measure resting membrane potential (Vrest). Neurons were excluded from analysis if the Vrest was higher than −40 mV. To test neuronal excitability, neurons were held at Vrest and injected with 1 s depolarizing 25 pA currents in steps.
Calcium Imaging
HEK 293T cells were imaged with a 20x objection on an inverted microscope (Olympus IX-73) at room temperature in extracellular solution containing (in mM): 135 NaCl, 5.4 KCl, 10 HEPES, 2 CaCl2, 1 MgCl2, pH = 7.4 with continuous perfusion. Calcium indicator GCaMP6f was excited using a 488 nm laser at 0.5 Hz with a 100 ms exposure time. For photoactivation, a 500 ms flash of 385 nm light from a CoolLED pE-4000 or of UV light from a CoolLED pE-300 ultra was applied just after each frame. Time lapse movies were recorded with an scMOS camera (Hamamatsu ORCA-Flash4v3.0). Experiments using spatial light targeting were done on a Zeiss LSM880 scanning confocal microscope using ZEN Black software with a 63x objective, a 488 nm laser for imaging and a 405 nm laser for photoactivation. Photoactivation was performed by scanning a 405 nm laser at 100% power in a defined region for 40 iterations between each imaging frame. Image analysis was performed using ZEN (Zeiss) and ImageJ (Fiji) (Schindelin et al., 2012) and calculations of oscillation frequency and Ca2+ wave velocity were performed as previously described (Acosta-Ruiz et al., 2020).
Viral Expression and in vivo PORTL labeling
Experiments were conducted as previously described (Acosta-Ruiz et al., 2020). Briefly, male Grm2-Cre heterozygous mice were injected at p60 in the mPFC (AP + 1.85, ML +/− 0.35, DV −2.2, −1.8) with 500–1,000 nL per hemisphere of either AAV9-EF1a-FLEX-SNAP-mGluR2-WPRE-hGH or AAV9-CAG-FLEX-GFP (Oh et al., 2014) using a Kopf stereotaxic and World Precision Instruments microinjection syringe pump with a 10 μL syringe and 33g blunt needle. All imaging and slice experiments were performed at least 6 weeks after viral injection.
For behavioral experiments, custom Dual opto-fluid cannulas with interchangeable injectors (Doric Lenses) were implanted to target bilateral mPFC (cannula: AP +1.85, ML +/−0.35, DV −1.5, fiberoptic: AP +1.85, ML +/−0.35, DV −1.8) and adhered to the scull using C & B Metabond (Parkell). Prior to behavioral tests, both experimental and control mice were anesthetized using isoflurane and dual opto-cannula plugs were replaced with 100 μm inner diameter micro-injectors. 10 μM BGAG12,400-Cy5 was infused through micro-injectors at 100 nl per minute for a total of 1000 nL per hemisphere using polyethylene tubing connected to a Harvard Apparatus (Harvard Biosciences, Inc.) 11 Elite dual syringe infusion pump and 10 μl Hamilton Company syringes. Micro-injectors were then replaced with optical fibers with 200 μm diameter and 0.22 numerical aperture (NA).
Acute Brain Slice Electrophysiology
Slice preparation was performed as previously described (Acosta-Ruiz et al., 2020), with the following modifications. Briefly, 12–16 hours following microinfusions of 10 μM BGAG12-Cy5 or BGAG12,400-Cy5 in the medial prefrontal cortex (mPFC), mice were deeply anesthetized with isoflurane and perfused with ice-cold NMDG-HEPES aCFS (in mM): 93 NMDG, 2.5 KCl, 1.2 NaH2PO4, 30 NaHCO3, 20 HEPES, 25 Glucose, 5 sodium ascorbate, 2 thiourea, 3 sodium pyruvate, 10 MgSO4, 0.5 CaCl2. 300 μm coronal slices of the mPFC were collected in the same solution and kept for 30 min at 34 °C, followed by at least 45 minutes at room temperature in a modified HEPES aCSF containing (in mM): 92 NaCl, 2.5 KCl, 1.2 NaH2PO4, 30 NaHCO3, 20 HEPES, 25 Glucose, 5 sodium ascorbate, 2 thiourea, 3 sodium pyruvate, 2 MgSO4, 2 CaCl2. Solutions were pH-corrected to 7.4, 300–310 mOsm and were continuously bubbled with 95% O2/5% CO2
Recordings were performed at 29–31 °C in a standard oxygenated aCSF containing (in mM): 124 NaCl, 2.5 KCl, 1.2 NaH2PO4, 24 NaHCO3, 5 HEPES, 12.5 Glucose, 1.3 MgSO4, 2.5 CaCl2. Whole-cell patch-clamp recordings were performed on a computer-controlled amplifier (MultiClamp 700B Axon Instruments, Foster City, CA) and acquired with an Axoscope 1550B (Axon Instruments) at a sampling rate of 10 kHz in current clamp and 500 Hz for current-evoked firing. For current clamp experiments, pipettes of 3–7 MΩ resistance were filled with a solution containing (in mM): 130 K-Gluconate, 4 KCl, 10 HEPES, 0.3 EGTA, 10 Na2-phosphocreatine, 4 Mg-ATP, 0.3 Na2-GTP, 13.4 Biocytin, pH 7.35, 280–290 mOsm.
For both visualizing of Cy5 fluorescence and photoswitching, we used a CoolLED pE-400 coupled to the microscope and filtered through an Olympus U-MF2 filter cube with a 635 BrightLine Beamsplitter and 692/40 emission filter. Light intensity for photoswitching at the sample was 1–2 mW/mm2 and light stimulation protocols were automated using pClamp. All data was analyzed in Clampfit and Prism (Graphpad Software, Inc.).
Y-Maze Behavior
All behavior was performed 6 to 10 weeks after virus injection and 12 to 16 hours after BGAG12,400-Cy5 injection. Experiments were conducted as previously described (Acosta-Ruiz et al., 2020). Briefly, dual fiberoptic cannulas were connected to a dual fiberoptic patchcord (200 μm diameter per cord, Doric) to a fiberoptic rotary joint (Doric) and then attached to a mono fiberoptic patch chord (400 μm, Doric) connected to a 4 Channel LED Driver (LEDD_4) and a 12V Fan Power Adaptor (FPA). The LED unit was manipulated via Doric Neuroscience studio software (DORIC STUDIO V5.3.3.6). During light stimulation, 3 2-second pulses of 385 nm or 515 nm light were delivered in triplicate with a 2-second interval, followed by a delay interval of 108 seconds and repeated continuously until the paradigm was completed. The light stimulation protocol was immediately started when mice entered the maze. Mice received 2 minutes of 515 nm light followed by 4 minutes of 385 nm light. Mice were tracked using SMART software (Harvard Apparatus) and the number of spontaneous alterations were counted for 6 minutes.
Quantification and Statistical Analysis
Statistical analysis was performed using Microsoft Excel, SigmaPlot (Systat Software Inc.), GraphPad (GraphPad Software Inc.) for all in vitro experiments, HEK293T and rodent physiology and behavior. Individual statistical methods are indicated in the figure legends. Statistical significance is indicated in the text and figure legends as *p < 0.05, **p < 0.01 and ***p < 0.001. No additional methods beyond the statistical tests stated in the text and figured legends were used to determine whether the data met assumptions of the statistical approach.
Supplementary Material
KEY RESOURCES TABLE.
| REAGENT or RESOURCE | SOURCE | IDENTIFIER |
|---|---|---|
| Bacterial and Virus Strains | ||
| AAV9-EF1a-FLEX-SNAPmGluR2-WPRE-hGH | Acosta-Ruiz et al. 2020 | N/A |
| AAV9-pCAG-FLEX-EGFP-WPRE | Oh et al. 2014 | Addgene Cat#51502-AAV9 |
| Chemicals, Peptides, and Recombinant Proteins | ||
| DIPEA | Roth | Cat#4105.1 |
| DBU | Roth | Cat#6869.1 |
| DMF | Roth | Cat#5921.1 |
| DMSO | Roth | Cat#7029.1 |
| Formic acid | Merck | Cat#5.33002.0050 |
| TFA | Acros TCI |
Cat#139721000 Cat#T0431 |
| TSTU | Roth | Cat#2130.2 |
| HBTU | Roth | Cat#2132.3 |
| MeCN | VWR | Cat#83640.320 |
| (((9H-Fluoren-9-yl)methoxy)carbonyl-D-glutamic acid | ChemCruz | Cat#sc-485525 |
| Fmoc-Lys-Cy3 | Acosta-Ruiz et al. 2020 | N/A |
| Fmoc-Lys-Cy5 | Acosta-Ruiz et al. 2020 | N/A |
| THF | VWR | Cat#457071000 |
| XPhos Pd G2 | Aldrich | Cat#741825-1g |
| Cs2CO3 | Roth | Cat#6873.2 |
| 4-iodoaniline | Aldrich | Cat#129364-25g |
| nitrosobenzene | Aldrich | Cat#N24609-10g |
| acetyl chloride | Aldrich | Cat#114189-25g |
| NaH, 60% in mineral oil | Aldrich | Cat#452912-100g |
| methyl iodide | Aldrich | Cat#67692-100mL |
| 2-azetidinone CAS: 930-21-2 | Acros | Cat#930212-1g |
| 2-pyrrolidinone CAS: 616-45-5 | TCI | Cat#616455-25g |
| delta-valerolactam CAS: 675-20-7 | TCI | Cat#675207-25g |
| epsilon-caprolactam CAS: 105-60-2 | TCI | Cat#105602-25g |
| phosgene, 15% | Aldrich | Cat#748684-100mL |
| methylamine hydrochloride CAS: 593-51-1 | Aldrich | Cat#593511-100g |
| 1,1-dimethylurea CAS: 598-94-7 | Acros | Cat#598947-5g |
| 1,1,3-trimethylurea CAS: 632-14-4 | Alfa Aesar | Cat#632144-1g |
| 1-methyl-2-imidaolidinone CAS: 694-32-6 | Acros | Cat#694326-500mg |
| 1,3-dimethylurea CAS: 96-31-1 | TCI | Cat#96311-25g |
| ethylene diamine | Roth | Cat#4218.1 |
| FmocNHPEG12COOH | broadpharm | Cat#BP-21632 |
| BG-COOH | Levitz et al. 2017 | N/A |
| BGAG12,400 | this study | N/A |
| 2xBGAG12,400 | this study | N/A |
| BGAG12,400-Cy3 | this study | N/A |
| BGAG12,400-Cy5 | this study | N/A |
| BGAG12,400-Cy3 v2 | this study | N/A |
| BGAG12,400-Cy5 v2 | this study | N/A |
| BGAG12-Cy5 | Acosta-Ruiz et al. 2020 | N/A |
| 2xBGAG12 | Acosta-Ruiz et al. 2020 | N/A |
| BGAG12 | Broichhagen et al. 2015 | N/A |
| 4,4’-diamino azobenzene | Acros | Cat#ACRO401580250 |
| butyryl chloride | Aldrich | Cat#236349-50g |
| ethyl isocyanate | Aldrich | Cat#E33300-5g |
| NaCl | MilliporeSigma™ | Cat#S5886-1KG |
| HEPES | MilliporeSigma™ | Cat#H4034-500G |
| Na+ ascorbate | MilliporeSigma™ | Cat#A7631-100G |
| Thiourea | MilliporeSigma™ | Cat#T8656-100G |
| Na+ pyruvate | MilliporeSigma™ | Cat#P2256-100G |
| CaCl2.2H2O | MilliporeSigma™ | Cat#C3881-500G |
| NMDG | MilliporeSigma™ | Cat#M2004-1KG |
| K-Gluconate | MilliporeSigma™ | Cat#PHR1130-1G |
| phosphocreatine-Na2 | MilliporeSigma™ | Cat#P7936-1G |
| MgATP | MilliporeSigma™ | Cat#A9187-500MG |
| Na2- GTP | MilliporeSigma™ | Cat#G8877-25MG |
| biocytin | MilliporeSigma™ | Cat#B4261-250MG |
| SNAP-Surface Alexa Fluor 546 | New England Biolabs | Cat#S9132S |
| Lipofectamine 2000 | Invitrogen | Cat#11668027 |
| Trypsin | Sigma-Aldrich | Cat# T1763 |
| DMEM/F12 | Sigma-Aldrich | Cat# 6421 |
| DMEM | Gibco | Cat# 41965-039 |
| FBS | Dutscher | Cat# S1900-500 |
| Penicillin-Streptomycin | Gibco | Cat# 15140-122 |
| Trypsin-EDTA | Gibco | Cat# 25300-054 |
| Glutamine | Gibco | Cat# 25030-081 |
| Dexamethasone | Sigma-Aldrich | Cat# D4902 |
| HEPES | Gibco | Cat# 15630-080 |
| Experimental Models: Cell Lines | ||
| HEK 293T Cells | American Type Culture Collection (ATCC) | Cat#CRL-3216; Cat#CR-11268 |
| Experimental Models: Organisms/Strains | ||
| Mouse: STOCK Tg(Grm2-cre)MR90Gsat/Mmucd Mus musculus | Mutant Mouse Resource & Research Center | MMRRC Cat# 034611-UCD |
| Oligonucleotides | ||
| Primer SNAP-mGluR2-mGluR1 Fwd1: TCTTCCACCCTGTAAAGATCCCACACTCCTGCC | This paper | N/A |
| Primer SNAP-mGluR2-mGluR1 Rev1: GCTCCACTCAAGATACTCCTGAGGCAGCTCAAAG | This paper | N/A |
| Primer SNAP-mGluR2-mGluR1 Fwd2: GAGCTGCCTCAGGAGTATCTTGAGTGGAGCAACATC | This paper | N/A |
| Primer SNAP-mGluR2-mGluR1 Rev2: AGGAGTGTGGGATCTTTACAGGGTGGAAGAGCTTTG | This paper | N/A |
| Recombinant DNA | ||
| SNAP-mGluR2 | Doumazane et al., 2011 | N/A |
| GIRK1-F137S | Vivaudou et al., 1997 | N/A |
| SNAP-mGluR2-mGluR5 | Acosta-Ruiz et al. 2020 | N/A |
| SNAP-mGluR2-mGluR1 | This paper | N/A |
| CMV-GCaMP6f | Chen et al., 2013 | Addgene Cat#40755 |
| pCIKv1.1 | Lesage et al., 1992 | N/A |
| Software and Algorithms | ||
| Fiji/ImageJ, v1.8 | Schindelin et al., 2012 | https://imagej.nih.gov/ij/ |
| Prism | GraphPad | https://graphpad.com |
| Clampex | Molecular Devices | https://www.moleculardevices.com |
| Clampfit | Molecular Devices | https://www.moleculardevices.com |
| Origin | Origin Lab Corporation | https://www.originlab.com/, RRID:SCR_002815 |
| Microsoft Excel | Microsoft Office | https://products.office.com/en-us/excel |
| Doric Neuroscience Studio | Doric Lenses | http://doriclenses.com/life-sciences/software/955-doric-neuroscience-studio.html |
| SMART Video Tracking System | Harvard Apparatus | https://www.harvardapparatus.com/smart-video-tracking-system.html |
| SigmaPlot | Systat Software, inc. | https://systatsoftware.com/products/sigmaplot/ |
| Other | ||
| CoolLED pE4000 | CoolLED | https://www.coolled.com/products/pe-4000/ |
| Doric Combined LEDs: 4-LED Model | Doric | LEDC4_385/465/515/625 |
Highlights.
Azobenzene tuning for red-shift and enhanced sensitivity, efficiency and speed
Improved photoswitches enable ultra-efficient control of GPCRs and ion channels
Acute modulation of working memory via mGluR2 photo-activation in the mouse mPFC
Acknowledgements
The authors thank Cornelia Ulrich and Sebastian Fabritz for mass spectrometry, Kai Johnsson (all MPIMR) for constant support, Corentin Charbonnier for in vitro measurements and Peter Schmieder for NMR (both FMP). J.L. is supported by an R35 grant (R35 GM124731) from NIGMS and the Rohr Family Research Scholar Award. C.L. is supported by grants from NIMH, the One Mind Institute, the Rita Allen Foundation, and the Klingenstein-Simons Foundation Fund. V.A.G. is supported by an NIH F31 pre-doctoral training grant (1 F31 MH123130-01A1). G.S. is supported by the Fondation pour la Recherche Medicale (FRM DEQ20170336753), the Agence Nationale pour la Recherche (ANR-17-CE18-0001 and ANR-17-ERC2-0023; ANR-11-LABX-0015-01) and SH is supported by Ville de Nice and UCA (Université Côte d’Azur).
Footnotes
Declaration of Interests
J.B. is a consultant for Vedere Bio II, Inc. and J.B. and J.L. are co-inventors on a filed provisional patent application on branched PORTLs.
Publisher's Disclaimer: This is a PDF file of an unedited manuscript that has been accepted for publication. As a service to our customers we are providing this early version of the manuscript. The manuscript will undergo copyediting, typesetting, and review of the resulting proof before it is published in its final form. Please note that during the production process errors may be discovered which could affect the content, and all legal disclaimers that apply to the journal pertain.
References
- Abreu N, and Levitz J (2020). Optogenetic Techniques for Manipulating and Sensing G Protein-Coupled Receptor Signaling. Methods Mol Biol 2173, 21–51. [DOI] [PMC free article] [PubMed] [Google Scholar]
- Acosta-Ruiz A, Gutzeit VA, Skelly MJ, Meadows S, Lee J, Parekh P, Orr AG, Liston C, Pleil KE, Broichhagen J, et al. (2020). Branched Photoswitchable Tethered Ligands Enable Ultra-efficient Optical Control and Detection of G Protein-Coupled Receptors In Vivo. Neuron 105, 446–463 e413. [DOI] [PMC free article] [PubMed] [Google Scholar]
- Armstrong CM (1971). Interaction of tetraethylammonium ion derivatives with the potassium channels of giant axons. J Gen Physiol 58, 413–437. [DOI] [PMC free article] [PubMed] [Google Scholar]
- Aultman JM, and Moghaddam B (2001). Distinct contributions of glutamate and dopamine receptors to temporal aspects of rodent working memory using a clinically relevant task. Psychopharmacology (Berl) 153, 353–364. [DOI] [PubMed] [Google Scholar]
- Banghart M, Borges K, Isacoff E, Trauner D, and Kramer RH (2004). Light-activated ion channels for remote control of neuronal firing. Nat Neurosci 7, 1381–1386. [DOI] [PMC free article] [PubMed] [Google Scholar]
- Banghart MR, Mourot A, Fortin DL, Yao JZ, Kramer RH, and Trauner D (2009). Photochromic blockers of voltage-gated potassium channels. Angew Chem Int Ed Engl 48, 9097–9101. [DOI] [PMC free article] [PubMed] [Google Scholar]
- Banghart MR, and Trauner D (2013). A 1H NMR assay for measuring the photostationary States of photoswitchable ligands. Methods Mol Biol 995, 107–120. [DOI] [PubMed] [Google Scholar]
- Beharry AA, and Woolley GA (2011). Azobenzene photoswitches for biomolecules. Chem Soc Rev 40, 4422–4437. [DOI] [PubMed] [Google Scholar]
- Berry MH, Holt A, Levitz J, Broichhagen J, Gaub BM, Visel M, Stanley C, Aghi K, Kim YJ, Cao K, et al. (2017). Restoration of patterned vision with an engineered photoactivatable G protein-coupled receptor. Nat Commun 8, 1862. [DOI] [PMC free article] [PubMed] [Google Scholar]
- Bleger D, Schwarz J, Brouwer AM, and Hecht S (2012). o-Fluoroazobenzenes as readily synthesized photoswitches offering nearly quantitative two-way isomerization with visible light. J Am Chem Soc 134, 20597–20600. [DOI] [PubMed] [Google Scholar]
- Bourne JN, and Harris KM (2008). Balancing structure and function at hippocampal dendritic spines. Annu Rev Neurosci 31, 47–67. [DOI] [PMC free article] [PubMed] [Google Scholar]
- Broichhagen J, Damijonaitis A, Levitz J, Sokol KR, Leippe P, Konrad D, Isacoff EY, and Trauner D (2015a). Orthogonal Optical Control of a G Protein-Coupled Receptor with a SNAP-Tethered Photochromic Ligand. ACS Cent Sci 1, 383–393. [DOI] [PMC free article] [PubMed] [Google Scholar]
- Broichhagen J, Frank JA, Johnston NR, Mitchell RK, Smid K, Marchetti P, Bugliani M, Rutter GA, Trauner D, and Hodson DJ (2015b). A red-shifted photochromic sulfonylurea for the remote control of pancreatic beta cell function. Chem Commun (Camb) 51, 6018–6021. [DOI] [PMC free article] [PubMed] [Google Scholar]
- Broichhagen J, Frank JA, and Trauner D (2015c). A roadmap to success in photopharmacology. Acc Chem Res 48, 1947–1960. [DOI] [PubMed] [Google Scholar]
- Broichhagen J, Schonberger M, Cork SC, Frank JA, Marchetti P, Bugliani M, Shapiro AM, Trapp S, Rutter GA, Hodson DJ, et al. (2014). Optical control of insulin release using a photoswitchable sulfonylurea. Nat Commun 5, 5116. [DOI] [PMC free article] [PubMed] [Google Scholar]
- Caporale N, Kolstad KD, Lee T, Tochitsky I, Dalkara D, Trauner D, Kramer R, Dan Y, Isacoff EY, and Flannery JG (2011). LiGluR restores visual responses in rodent models of inherited blindness. Mol Ther 19, 1212–1219. [DOI] [PMC free article] [PubMed] [Google Scholar]
- Carroll EC, Berlin S, Levitz J, Kienzler MA, Yuan Z, Madsen D, Larsen DS, and Isacoff EY (2015). Two-photon brightness of azobenzene photoswitches designed for glutamate receptor optogenetics. Proc Natl Acad Sci U S A 112, E776–785. [DOI] [PMC free article] [PubMed] [Google Scholar]
- Chen S, Kadakia F, and Davidson S (2020). Group II metabotropic glutamate receptor expressing neurons in anterior cingulate cortex become sensitized after inflammatory and neuropathic pain. Mol Pain 16, 1744806920915339. [DOI] [PMC free article] [PubMed] [Google Scholar]
- Chen TW, Wardill TJ, Sun Y, Pulver SR, Renninger SL, Baohan A, Schreiter ER, Kerr RA, Orger MB, Jayaraman V, et al. (2013). Ultrasensitive fluorescent proteins for imaging neuronal activity. Nature 499, 295–300. [DOI] [PMC free article] [PubMed] [Google Scholar]
- Choi KL, Mossman C, Aube J, and Yellen G (1993). The internal quaternary ammonium receptor site of Shaker potassium channels. Neuron 10, 533–541. [DOI] [PubMed] [Google Scholar]
- Davenport CM, Rajappa R, Katchan L, Taylor CR, Tsai MC, Smith CM, de Jong JW, Arnold DB, Lammel S, and Kramer RH (2020). Relocation of an Extrasynaptic GABAA Receptor to Inhibitory Synapses Freezes Excitatory Synaptic Strength and Preserves Memory. Neuron. [DOI] [PMC free article] [PubMed] [Google Scholar]
- Donthamsetti PC, Broichhagen J, Vyklicky V, Stanley C, Fu Z, Visel M, Levitz JL, Javitch JA, Trauner D, and Isacoff EY (2019). Genetically Targeted Optical Control of an Endogenous G Protein-Coupled Receptor. J Am Chem Soc 141, 11522–11530. [DOI] [PMC free article] [PubMed] [Google Scholar]
- Donthamsetti PC, Winter N, Schonberger M, Levitz J, Stanley C, Javitch JA, Isacoff EY, and Trauner D (2017). Optical Control of Dopamine Receptors Using a Photoswitchable Tethered Inverse Agonist. J Am Chem Soc 139, 18522–18535. [DOI] [PMC free article] [PubMed] [Google Scholar]
- Dorn M, Jurk M, and Schmieder P (2012). Blue news update: BODIPY-GTP binds to the blue-light receptor YtvA while GTP does not. PLoS One 7, e29201. [DOI] [PMC free article] [PubMed] [Google Scholar]
- Doumazane E, Scholler P, Zwier JM, Trinquet E, Rondard P, and Pin JP (2011). A new approach to analyze cell surface protein complexes reveals specific heterodimeric metabotropic glutamate receptors. FASEB J 25, 66–77. [DOI] [PubMed] [Google Scholar]
- DuBay KH, Iwan K, Osorio-Planes L, Geissler PL, Groll M, Trauner D, and Broichhagen J (2018). A Predictive Approach for the Optical Control of Carbonic Anhydrase II Activity. ACS Chem Biol 13, 793–800. [DOI] [PubMed] [Google Scholar]
- Durand-de Cuttoli R, Mondoloni S, Marti F, Lemoine D, Nguyen C, Naude J, d’Izarny-Gargas T, Pons S, Maskos U, Trauner D, et al. (2018). Manipulating midbrain dopamine neurons and rewardrelated behaviors with light-controllable nicotinic acetylcholine receptors. Elife 7. [DOI] [PMC free article] [PubMed] [Google Scholar]
- Farrants H, Gutzeit VA, Acosta-Ruiz A, Trauner D, Johnsson K, Levitz J, and Broichhagen J (2018). SNAP-Tagged Nanobodies Enable Reversible Optical Control of a G Protein-Coupled Receptor via a Remotely Tethered Photoswitchable Ligand. ACS Chem Biol 13, 2682–2688. [DOI] [PMC free article] [PubMed] [Google Scholar]
- Fehrentz T, Kuttruff CA, Huber FM, Kienzler MA, Mayer P, and Trauner D (2012). Exploring the pharmacology and action spectra of photochromic open-channel blockers. Chembiochem 13, 1746–1749. [DOI] [PubMed] [Google Scholar]
- Ferraguti F, and Shigemoto R (2006). Metabotropic glutamate receptors. Cell Tissue Res 326, 483–504. [DOI] [PubMed] [Google Scholar]
- Fortin DL, Banghart MR, Dunn TW, Borges K, Wagenaar DA, Gaudry Q, Karakossian MH, Otis TS, Kristan WB, Trauner D, et al. (2008). Photochemical control of endogenous ion channels and cellular excitability. Nat Methods 5, 331–338. [DOI] [PMC free article] [PubMed] [Google Scholar]
- Fortin DL, Dunn TW, Fedorchak A, Allen D, Montpetit R, Banghart MR, Trauner D, Adelman JP, and Kramer RH (2011). Optogenetic photochemical control of designer K+ channels in mammalian neurons. J Neurophysiol 106, 488–496. [DOI] [PMC free article] [PubMed] [Google Scholar]
- Gomez-Santacana X, Pittolo S, Rovira X, Lopez M, Zussy C, Dalton JA, Faucherre A, Jopling C, Pin JP, Ciruela F, et al. (2017). Illuminating Phenylazopyridines To Photoswitch Metabotropic Glutamate Receptors: From the Flask to the Animals. ACS Cent Sci 3, 81–91. [DOI] [PMC free article] [PubMed] [Google Scholar]
- Goudet C, Rovira X, and Llebaria A (2018). Shedding light on metabotropic glutamate receptors using optogenetics and photopharmacology. Curr Opin Pharmacol 38, 8–15. [DOI] [PubMed] [Google Scholar]
- Hansch C, Leo A, R.W. (1991). A survey of Hammett substituent constants and resonance and field parameters. Chem Rev 91, 165–95. [Google Scholar]
- Heginbotham L, and MacKinnon R (1992). The aromatic binding site for tetraethylammonium ion on potassium channels. Neuron 8, 483–491. [DOI] [PubMed] [Google Scholar]
- Hull K, Morstein J, and Trauner D (2018). In Vivo Photopharmacology. Chem Rev 118, 10710–10747. [DOI] [PubMed] [Google Scholar]
- Izquierdo-Serra M, Bautista-Barrufet A, Trapero A, Garrido-Charles A, Diaz-Tahoces A, Camarero N, Pittolo S, Valbuena S, Perez-Jimenez A, Gay M, et al. (2016). Optical control of endogenous receptors and cellular excitability using targeted covalent photoswitches. Nat Commun 7, 12221. [DOI] [PMC free article] [PubMed] [Google Scholar]
- Kawabata S, Tsutsumi R, Kohara A, Yamaguchi T, Nakanishi S, and Okada M (1996). Control of calcium oscillations by phosphorylation of metabotropic glutamate receptors. Nature 383, 89–92. [DOI] [PubMed] [Google Scholar]
- Kienzler MA, Reiner A, Trautman E, Yoo S, Trauner D, and Isacoff EY (2013). A red-shifted, fast-relaxing azobenzene photoswitch for visible light control of an ionotropic glutamate receptor. J Am Chem Soc 135, 17683–17686. [DOI] [PMC free article] [PubMed] [Google Scholar]
- Laprell L, Tochitsky I, Kaur K, Manookin MB, Stein M, Barber DM, Schon C, Michalakis S, Biel M, Kramer RH, et al. (2017). Photopharmacological control of bipolar cells restores visual function in blind mice. J Clin Invest 127, 2598–2611. [DOI] [PMC free article] [PubMed] [Google Scholar]
- Lavis LD, Chao TY, and Raines RT (2006). Fluorogenic label for biomolecular imaging. ACS Chem Biol 1, 252–260. [DOI] [PMC free article] [PubMed] [Google Scholar]
- Lee J, Munguba H, Gutzeit VA, Singh DR, Kristt M, Dittman JS, and Levitz J (2020a). Defining the Homo- and Heterodimerization Propensities of Metabotropic Glutamate Receptors. Cell Rep 31, 107605. [DOI] [PMC free article] [PubMed] [Google Scholar]
- Lee J, Munguba H, Gutzeit VA, Singh DR, Kristt M, Dittman JS, and Levitz J (2020b). Defining the Homo- and Heterodimerization Propensities of Metabotropic Glutamate Receptors. Cell Rep 31, 107891. [DOI] [PMC free article] [PubMed] [Google Scholar]
- Leippe P, Broichhagen J, Cailliau K, Mougel A, Morel M, Dissous C, Trauner D, and Vicogne J (2020). Transformation of Receptor Tyrosine Kinases into Glutamate Receptors and Photoreceptors. Angew Chem Int Ed Engl 59, 6720–6723. [DOI] [PubMed] [Google Scholar]
- Leippe P, Koehler Leman J, and Trauner D (2017). Specificity and Speed: Tethered Photopharmacology. Biochemistry 56, 5214–5220. [DOI] [PubMed] [Google Scholar]
- Lemoine D, Habermacher C, Martz A, Mery PF, Bouquier N, Diverchy F, Taly A, Rassendren F, Specht A, and Grutter T (2013). Optical control of an ion channel gate. Proc Natl Acad Sci U S A 110, 20813–20818. [DOI] [PMC free article] [PubMed] [Google Scholar]
- Lesage F, Attali B, Lazdunski M, and Barhanin J (1992). Developmental expression of voltage-sensitive K+ channels in mouse skeletal muscle and C2C12 cells. FEBS Lett 310, 162–166. [DOI] [PubMed] [Google Scholar]
- Lester HA, Krouse ME, Nass MM, Wassermann NH, and Erlanger BF (1980). A covalently bound photoisomerizable agonist: comparison with reversibly bound agonists at Electrophorus electroplaques. J Gen Physiol 75, 207–232. [DOI] [PMC free article] [PubMed] [Google Scholar]
- Levitz J, Broichhagen J, Leippe P, Konrad D, Trauner D, and Isacoff EY (2017). Dual optical control and mechanistic insights into photoswitchable group II and III metabotropic glutamate receptors. Proc Natl Acad Sci U S A 114, E3546–E3554. [DOI] [PMC free article] [PubMed] [Google Scholar]
- Levitz J, Pantoja C, Gaub B, Janovjak H, Reiner A, Hoagland A, Schoppik D, Kane B, Stawski P, Schier AF, et al. (2013). Optical control of metabotropic glutamate receptors. Nat Neurosci 16, 507–516. [DOI] [PMC free article] [PubMed] [Google Scholar]
- Levitz J, Popescu AT, Reiner A, and Isacoff EY (2016). A Toolkit for Orthogonal and in vivo Optical Manipulation of Ionotropic Glutamate Receptors. Front Mol Neurosci 9, 2. [DOI] [PMC free article] [PubMed] [Google Scholar]
- Lin WC, Tsai MC, Davenport CM, Smith CM, Veit J, Wilson NM, Adesnik H, and Kramer RH (2015). A Comprehensive Optogenetic Pharmacology Toolkit for In Vivo Control of GABA(A) Receptors and Synaptic Inhibition. Neuron 88, 879–891. [DOI] [PMC free article] [PubMed] [Google Scholar]
- Lujan R, Nusser Z, Roberts JD, Shigemoto R, and Somogyi P (1996). Perisynaptic location of metabotropic glutamate receptors mGluR1 and mGluR5 on dendrites and dendritic spines in the rat hippocampus. Eur J Neurosci 8, 1488–1500. [DOI] [PubMed] [Google Scholar]
- Mourot A, Fehrentz T, Le Feuvre Y, Smith CM, Herold C, Dalkara D, Nagy F, Trauner D, and Kramer RH (2012). Rapid optical control of nociception with an ion-channel photoswitch. Nat Methods 9, 396–402. [DOI] [PMC free article] [PubMed] [Google Scholar]
- Mourot A, Kienzler MA, Banghart MR, Fehrentz T, Huber FM, Stein M, Kramer RH, and Trauner D (2011). Tuning photochromic ion channel blockers. ACS Chem Neurosci 2, 536–543. [DOI] [PMC free article] [PubMed] [Google Scholar]
- Muller-Deku A, Meiring JCM, Loy K, Kraus Y, Heise C, Bingham R, Jansen KI, Qu X, Bartolini F, Kapitein LC, et al. (2020). Photoswitchable paclitaxel-based microtubule stabilisers allow optical control over the microtubule cytoskeleton. Nat Commun 11, 4640. [DOI] [PMC free article] [PubMed] [Google Scholar]
- Nicoletti F, Bockaert J, Collingridge GL, Conn PJ, Ferraguti F, Schoepp DD, Wroblewski JT, and Pin JP (2011). Metabotropic glutamate receptors: from the workbench to the bedside. Neuropharmacology 60, 1017–1041. [DOI] [PMC free article] [PubMed] [Google Scholar]
- Oh SW, Harris JA, Ng L, Winslow B, Cain N, Mihalas S, Wang Q, Lau C, Kuan L, Henry AM, et al. (2014). A mesoscale connectome of the mouse brain. Nature 508, 207–214. [DOI] [PMC free article] [PubMed] [Google Scholar]
- Paoletti P, Ellis-Davies GCR, and Mourot A (2019). Optical control of neuronal ion channels and receptors. Nat Rev Neurosci 20, 514–532. [DOI] [PMC free article] [PubMed] [Google Scholar]
- Pin JP, and Bettler B (2016). Organization and functions of mGlu and GABAB receptor complexes. Nature 540, 60–68. [DOI] [PubMed] [Google Scholar]
- Polosukhina A, Litt J, Tochitsky I, Nemargut J, Sychev Y, De Kouchkovsky I, Huang T, Borges K, Trauner D, Van Gelder RN, et al. (2012). Photochemical restoration of visual responses in blind mice. Neuron 75, 271–282. [DOI] [PMC free article] [PubMed] [Google Scholar]
- Reiner A, and Levitz J (2018). Glutamatergic Signaling in the Central Nervous System: Ionotropic and Metabotropic Receptors in Concert. Neuron 98, 1080–1098. [DOI] [PMC free article] [PubMed] [Google Scholar]
- Reiner A, Levitz J, and Isacoff EY (2015). Controlling ionotropic and metabotropic glutamate receptors with light: principles and potential. Curr Opin Pharmacol 20, 135–143. [DOI] [PMC free article] [PubMed] [Google Scholar]
- Reynders M, Matsuura BS, Berouti M, Simoneschi D, Marzio A, Pagano M, and Trauner D (2020). PHOTACs enable optical control of protein degradation. Sci Adv 6, eaay5064. [DOI] [PMC free article] [PubMed] [Google Scholar]
- Richter F, Scheib US, Mehlhorn J, Schubert R, Wietek J, Gernetzki O, Hegemann P, Mathes T, and Moglich A (2015). Upgrading a microplate reader for photobiology and all-optical experiments. Photochem Photobiol Sci 14, 270–279. [DOI] [PubMed] [Google Scholar]
- Rullo A, Reiner A, Reiter A, Trauner D, Isacoff EY, and Woolley GA (2014). Long wavelength optical control of glutamate receptor ion channels using a tetra-ortho-substituted azobenzene derivative. Chem Commun (Camb) 50, 14613–14615. [DOI] [PubMed] [Google Scholar]
- Runtsch LS, Barber DM, Mayer P, Groll M, Trauner D, and Broichhagen J (2015). Azobenzene-based inhibitors of human carbonic anhydrase II. Beilstein J Org Chem 11, 1129–1135. [DOI] [PMC free article] [PubMed] [Google Scholar]
- Samanta S, Babalhavaeji A, Dong MX, and Woolley GA (2013). Photoswitching of ortho-substituted azonium ions by red light in whole blood. Angew Chem Int Ed Engl 52, 14127–14130. [DOI] [PMC free article] [PubMed] [Google Scholar]
- Sandoz G, Levitz J, Kramer RH, and Isacoff EY (2012). Optical control of endogenous proteins with a photoswitchable conditional subunit reveals a role for TREK1 in GABA(B) signaling. Neuron 74, 1005–1014. [DOI] [PMC free article] [PubMed] [Google Scholar]
- Schindelin J, Arganda-Carreras I, Frise E, Kaynig V, Longair M, Pietzsch T, Preibisch S, Rueden C, Saalfeld S, Schmid B, et al. (2012). Fiji: an open-source platform for biological-image analysis. Nat Methods 9, 676–682. [DOI] [PMC free article] [PubMed] [Google Scholar]
- Schlumberger C, Schafer D, Barberi C, More L, Nagel J, Pietraszek M, Schmidt WJ, and Danysz W (2009). Effects of a metabotropic glutamate receptor group II agonist LY354740 in animal models of positive schizophrenia symptoms and cognition. Behav Pharmacol 20, 56–66. [DOI] [PubMed] [Google Scholar]
- Spangler SM, and Bruchas MR (2017). Optogenetic approaches for dissecting neuromodulation and GPCR signaling in neural circuits. Curr Opin Pharmacol 32, 56–70. [DOI] [PMC free article] [PubMed] [Google Scholar]
- Stawski P, Sumser M, and Trauner D (2012). A photochromic agonist of AMPA receptors. Angew Chem Int Ed Engl 51, 5748–5751. [DOI] [PubMed] [Google Scholar]
- Stranius K, and Borjesson K (2017). Determining the Photoisomerization Quantum Yield of Photoswitchable Molecules in Solution and in the Solid State. Sci Rep 7, 41145. [DOI] [PMC free article] [PubMed] [Google Scholar]
- Tochitsky I, Banghart MR, Mourot A, Yao JZ, Gaub B, Kramer RH, and Trauner D (2012). Optochemical control of genetically engineered neuronal nicotinic acetylcholine receptors. Nat Chem 4, 105–111. [DOI] [PMC free article] [PubMed] [Google Scholar]
- Tochitsky I, Polosukhina A, Degtyar VE, Gallerani N, Smith CM, Friedman A, Van Gelder RN, Trauner D, Kaufer D, and Kramer RH (2014). Restoring visual function to blind mice with a photoswitch that exploits electrophysiological remodeling of retinal ganglion cells. Neuron 81, 800–813. [DOI] [PMC free article] [PubMed] [Google Scholar]
- Tsai YH, Essig S, James JR, Lang K, and Chin JW (2015). Selective, rapid and optically switchable regulation of protein function in live mammalian cells. Nat Chem 7, 554–561. [DOI] [PMC free article] [PubMed] [Google Scholar]
- Ueno Y, Jose J, Loudet A, Perez-Bolivar C, Anzenbacher P Jr., and Burgess K (2011). Encapsulated energy-transfer cassettes with extremely well resolved fluorescent outputs. J Am Chem Soc 133, 51–55. [DOI] [PMC free article] [PubMed] [Google Scholar]
- Vivaudou M, Chan KW, Sui JL, Jan LY, Reuveny E, and Logothetis DE (1997). Probing the G-protein regulation of GIRK1 and GIRK4, the two subunits of the KACh channel, using functional homomeric mutants. J Biol Chem 272, 31553–31560. [DOI] [PubMed] [Google Scholar]
- Volgraf M, Gorostiza P, Numano R, Kramer RH, Isacoff EY, and Trauner D (2006). Allosteric control of an ionotropic glutamate receptor with an optical switch. Nat Chem Biol 2, 47–52. [DOI] [PMC free article] [PubMed] [Google Scholar]
- Xue L, Karpenko IA, Hiblot J, and Johnsson K (2015). Imaging and manipulating proteins in live cells through covalent labeling. Nat Chem Biol 11, 917–923. [DOI] [PubMed] [Google Scholar]
Associated Data
This section collects any data citations, data availability statements, or supplementary materials included in this article.
Supplementary Materials
Data Availability Statement
The published article includes all datasets/code generated or analyzed during this study.