Abstract
The October 30, 2020 Earthquake caused unexpectedly significant damage in İzmir considering its distance to the city. This paper evaluates the recorded ground motions, summarizes the performance of structures affected from the earthquake with emphasis on the reasons of damage. A detailed damage assessment was carried out by the Earthquake Engineering Research Center of Middle East Technical University to compile data on the damage of RC and masonry buildings. It was observed that majority of the damage was concentrated in the Bayraklı district due to its peculiar soil properties where many 7–10 story mid-rise RC buildings suffered heavy damage and collapse. The level of amplified ground motions combined with deficiencies of apparently non-code compliant buildings exacerbated the damage. The main reasons of damage were mainly attributed to the presence of soft stories, lack of proper detailing, poor construction quality, presence of heavy overhangs, and hence significant lack of code-compliance in essence. The influence of infill walls on seismic performance of deficient and inadequate buildings was clearly seen in this earthquake. This paper also discusses seismic code requirements in effect and their influence on the observed building performance. The recorded ground motions were compared with the code spectra to evaluate the performance of the buildings. The code response spectra were found to be well above the recorded ground motion spectra at the sites where significant damage was observed.
Keywords: Earthquake damage, Samos earthquake, Site effects, RC building deficiencies, Turkish seismic codes
Introduction
An earthquake of Mw = 6.9 (reported as Mw = 6.6 according to AFAD, Turkey) hit the offshores of Samos island and caused significant damage in İzmir which is located approximately 75 km’s from the epicenter. Given the distance of the affected area to the epicenter, an unexpected level of damage was observed in İzmir city center, especially in the Bayraklı district where 12 buildings suffered immediate collapse and many experienced heavy damage. Survey teams from Earthquake Engineering Research Center (EERC) of Middle East Technical University (METU) were deployed to the field in order to carry out a detailed damage assessment focusing mainly at the Bayraklı district (METU 2020). Structural damage (flexural and shear cracking, rebar buckling, rebar fracture and concrete crushing) on RC members and non-structural infill wall damages (in-plane damage in the form of frame-wall separation, diagonal cracking, corner crushing and out-of-plane failure) were assessed by visual inspection both from the street and entering the basement or the ground floor of the damaged buildings. In the meantime, the damage assessors pre-trained by the Ministry of Environment and Urbanization (MEU) carried out global building damage assessments according to the methodologies developed by Ilki et al. (2020) and Boduroglu et al. (2013). The damage assessors (mostly civil engineers and architects serving for Ministry of Environment and Urbanization, and other public institutions) have been trained through an online education system in terms of seismic damage assessment before the earthquake. A few face-to-face training sessions have also been conducted in İzmir. Both online and face-to-face trainings were organized and coordinated by the Ministry of Environment and Urbanization. It is important to note here that the buildings for which inquiries are made were assessed by the government appointed assessors. It is also worth to mention that the pre-training of damage assessors was very useful, because the COVID-19 pandemic posed difficulties for the trainings right after the earthquake.
Turkey is located in a seismically active region where devastating earthquakes occur rather frequently. In the last 20 years many earthquakes (1999 Kocaeli and Düzce earthquakes, 2003 Bingöl earthquake, 2011 Van earthquake, 2020 Elazığ-Sivrice earthquake) hit the country resulting in significant loss of lives and property. Numerous field studies were carried out to elaborate on types of damage, reasons of damage emphasizing on code compliance and typical mistakes made (Scawthorn 2000; Sucuoğlu and Yilmaz 2001; Doğangün 2004; İnel et al. 2008; Sezen et al. 2003; METU 2011; Tapan et al. 2013; Sayin et al. 2014; Korkmaz 2015; Bayraktar et al. 2016; Oyguc and Oyguc 2017). The observations made from these earthquakes revealed that the main reasons for damage in especially RC structures in Turkey can be summarized as poor material and workmanship quality, poor detailing, inadequate inspection, lack of code compliance, and architectural features such as soft story/weak story, irregularities, overhangs etc.
Damage assessment studies after earthquakes provide invaluable data to evaluate the seismic performance of buildings (Yakut et al. 2005, 2006; Yakut 2004; Tezcan 2011; Spence et al. 2003), to check the efficiency and sufficiency of code criteria and to identify the reasons of the building characteristics leading to poor performance (Sucuoglu et al. 2007). Although, codes and guidelines are employed to build earthquake resistant buildings, earthquakes provide a natural laboratory to assess our design criteria. Samos earthquake has some specific characteristics in this regard. The detailed EERC/METU damage assessment studies provide examples of deficiencies observed in RC buildings leading to member and building damages.
The reasons of poor building performance are discussed with emphasis on more common attributes in İzmir. Firstly, a district based damage distribution revealing also damage statistics of buildings is presented. Then, performance of reinforced concrete buildings, being the predominant construction type in İzmir, is discussed in detail. Additionally, earthquake performance of some masonry buildings located in the city center as well as sub-urban areas is also highlighted. Besides building structures, performance of bridges is also discussed briefly.
The ground motions recorded in different parts of İzmir were analyzed and compared with the elastic design spectra given in the codes in order to understand the level of forces the buildings have experienced. So, all the codes that were in affect during the construction of the damaged buildings are reviewed and evaluated.
Evaluation of recorded strong ground motions
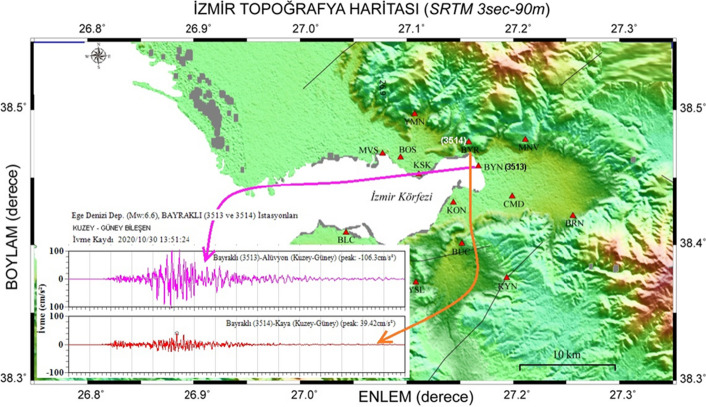
Strong motions from the earthquake were recorded by several stations operated by AFAD and KOERI, which are shown on the topographical map of İzmir bay area in Fig. 1, which also shows the close-up view of the ground motion stations in the most severely stricken region.
Fig. 1.
Topographical relief map of Izmir Bay, locations of strong motion stations and NS components of ground motions recorded at the BYN 3513 and BYR 3514 stations (Courtesy of Ulubey Çeken, AFAD)
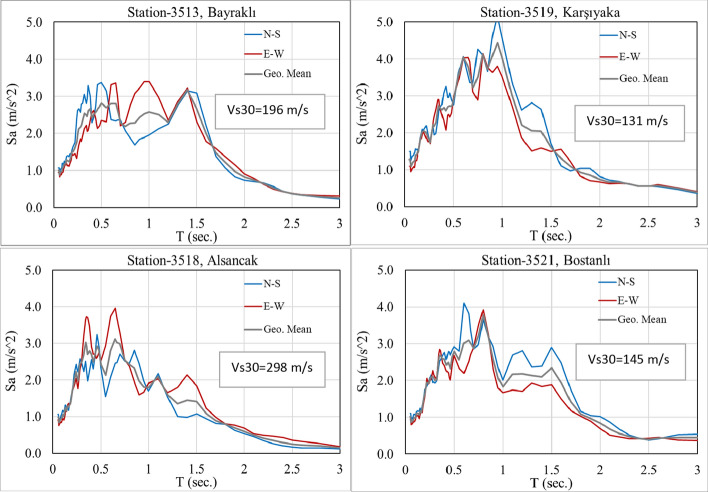
Basic properties of the five selected stations and peak recorded ground motion values are presented in Table 1. Epicentral distances of all five stations are quite similar. BYR 3514 is on a stiff site, at the edge of an outcrop (Yamanlar Hill), while all other stations are located on soft alluvial soil deposits. The response spectra of recorded ground motions from all four strong motion stations on soft soils are shown in Fig. 2.
Table 1.
Properties of the strong motion stations and the peak recorded values
| Location | Station code | VS30 (m/s) | Repi (km) | PGA (cm/s2) | PGV (cm/s) |
|---|---|---|---|---|---|
| Bayraklı | BYN 3513 | 196 | 72.0 | 106.3 | 17.1 |
| Bayraklı | BYR 3514 | 836 | 73.4 | 39.4 | 4.2 |
| Alsancak | KON 3518 | 298 | 68.4 | 106.1 | 11.3 |
| Karsıyaka | KSK 3519 | 131 | 69.2 | 150.1 | 22.5 |
| Bostanlı | BOS 3521 | 145 | 69.6 | 110.8 | 16.2 |
Fig. 2.
Response spectra of the recorded ground motions at stations 3513, 3518, 3519 and 3521, all on soft soil sites
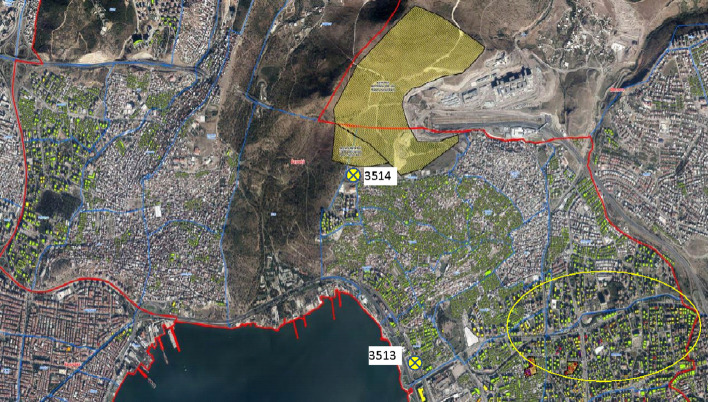
A satellite photo of the Northern shore of the inner bay is shown in Fig. 3, which includes stations 3513 and 3514. The regions of heavily damaged buildings are enveloped with a yellow ellipse, where the red spots are indicating the collapsed building blocks. Yellow and green spots in the photo mark heavily and moderately damaged buildings, respectively. Station 3513, marked in yellow, is very close to the region of heavy damage.
Fig. 3.
Satellite view of Izmir Bay, and the region of heaviest damage
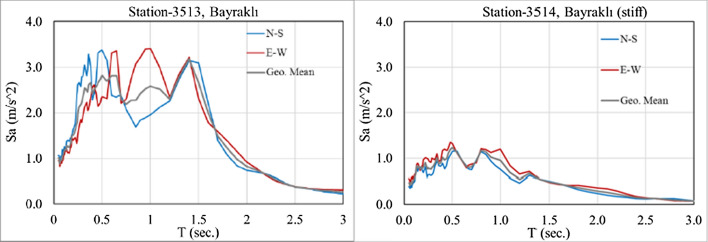
Station 3514, shown in Fig. 3, is the only stiff soil station among the five stations given in Table 1. Since it is very close to Station 3513, we compare the ground motions from these two stations recorded during the main shock. The NS components of the horizontal ground motions are compared in Fig. 1. Response spectra of both horizontal components and their geometric mean are presented in Fig. 4. It is evident that the site properties played a strong influence on the intensity of ground motions recorded by these two stations. Soft soil deposits amplified spectral response accelerations almost three times on average compared to the stiff soil site over the period range of 0.5 to 1.5 s. However, it should be considered that this amplification may be less under stronger ground shaking due to nonlinear site and soil response.
Fig. 4.
Response spectra of the recorded ground motions in stations 3514 and 3513
Damage statistics and damage distribution in Izmir
İzmir is the third largest city of Turkey with a population around 4 million. According to data disseminated by the Turkish Statistical Institute (TSI), the population of buildings in İzmir is around 670,000 (including only the buildings with legal permits) by the end of 2018 (METU 2020; Cetin et al. 2020). Almost 69 percent of the buildings are made of reinforced concrete, and masonry buildings constitute about 30% of the entire inventory. Among all buildings, 89 percent are used for residential purposes. A further classification of RC buildings in İzmir according to the year of construction and the number of stories is presented in Fig. 5. As alluded to among the RC buildings, 73% are low rise (1–3 stories), 25.1% are mid-rise (4–8 stories) and around 2% have 9 stories or more. Nearly 50 percent of the RC buildings in İzmir appear to be constructed between 1980–2000, and presumably according to the 1975 earthquake code as will be discussed in detail in the following sections. Since the global damage assessment results of MEU are updated and reported continuously at different periods, the results released on November 20, 2020 are presented in Table 2. District based damage statistics including all building types are provided for six damage categories; collapsed, urgent demolition, severe, moderate, slight damage and no damage. Buildings classified as Urgent Demolition indicate the ones that were identified as very dangerous and should be demolished. These results show that a total of 8037 buildings suffered different levels of damage, and 666 of them had severe damage, collapsed or classified as to be urgently demolished. This has indicated that nearly 1.2% of the buildings experienced damage in İzmir, assuming that the buildings that were not examined were free of damage. Heavy damage seems to concentrate in the Bayraklı district where 166 buildings experienced severe or higher damage. Bornova, Konak and Karsıyaka are the other districts which suffered relatively significant damage. These districts are among the most densely populated central areas of İzmir.
Fig. 5.
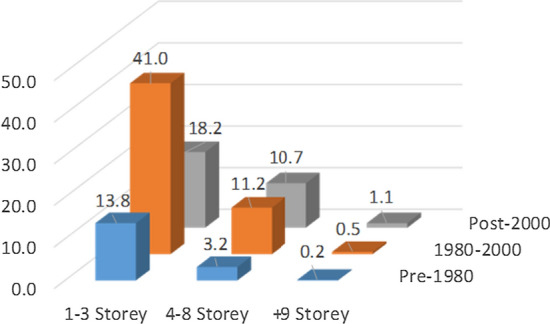
RC Building classification according to the age and the number of stories
Table 2.
Damage assessment results of MEU as of 20 November 2020
| Number of buildings | ||||||||
|---|---|---|---|---|---|---|---|---|
| District | Collapsed | Urgent demolition | Severe | Moderate | Slight damage | No damage | Total # of assessment | Total # of urgent + severe + collapsed |
| Bornova | 7 | 2 | 59 | 72 | 894 | 55,612 | 56,646 | 68 |
| Bayraklı | 9 | 30 | 127 | 170 | 1372 | 29,785 | 31,493 | 166 |
| Seferihisar | 2 | 0 | 23 | 33 | 235 | 6805 | 7098 | 25 |
| Aliağa | 2 | 0 | 11 | 20 | 107 | 1629 | 1769 | 13 |
| Buca | 1 | 1 | 28 | 49 | 428 | 9588 | 10,095 | 30 |
| Karabağlar | 2 | 1 | 21 | 33 | 345 | 4766 | 5168 | 24 |
| Karşıyaka | 6 | 0 | 25 | 105 | 1239 | 15,512 | 16,887 | 31 |
| Kemalpaşa | 0 | 0 | 10 | 2 | 42 | 1134 | 1188 | 10 |
| Konak | 3 | 1 | 40 | 55 | 642 | 5504 | 6245 | 44 |
| Menderes | 1 | 0 | 23 | 29 | 192 | 1745 | 1990 | 24 |
| Other | 17 | 0 | 214 | 120 | 1187 | 18,004 | 19,542 | 231 |
| Total | 50 | 35 | 581 | 688 | 6683 | 150,084 | 158,121 | 666 |
The distribution of building damage in terms of construction year and number of stories is quite important since it provides data regarding the code the buildings are designed against and their general dynamic properties indicating the level of dynamic forces they have experienced. The distribution of damage against construction year and number of stories is provided in Fig. 6 for the buildings that information was available. As evidenced in Fig. 6a, a remarkable portion of damaged buildings seem to be constructed during 1990–2000. The structural damages in the buildings constructed after 2010 are significantly less.
Fig. 6.
Building damage distribution; a per building age, b per number of stories
The height-wise distribution of damage indicates that mainly buildings up to 10 stories suffered significant damage, no buildings with more than 10 stories were assigned heavy damage. Nevertheless, quite a large number of such buildings were slightly damaged, most of which are deemed to stem from damage to non-structural infill walls. It is interesting to note that 558 buildings with three stories or less have also been assessed as heavily damaged by the inspectors. However, these buildings are relatively old, poorly constructed, poorly maintained, and located in suburban areas which were previously selected to conduct urban transformation projects, hence they were vacated. Structural systems of most of these buildings are composed of irregular masonry walls and there are only few reinforced concrete buildings among them.
Observed performance of RC buildings
The reconnaissance surveys performed by EERC teams right after the earthquake focused mainly on RC buildings constituting the major portion of the building stock in İzmir. As discussed previously, RC building damages were mostly concentrated in Bayraklı. The 7–10 story buildings that were constructed during 1990–1994 collapsed or sustained heavy damage. As discussed previously, examination of ground motion records shows that the spectral acceleration measured on the soft soils in Bayraklı was around 0.35 g in the period range of 0.6–1.5 s. According to the current Turkish Seismic Hazard Map, these values are close to spectral accelerations corresponding to the ground motion level of a service-level earthquake (72-year return period). They approximately correspond to 30–40 percent of the design-level earthquake ground motion (with 475-year return period). Accordingly, it can be interpreted that the collapses and heavy damages observed at these mid-rise RC buildings were due to major structural inadequacies. The most common types of damages observed in RC buildings can be characterized as soft/weak story damage, damage at infill walls, damage due to heavy overhangs, damage in columns and corrosion induced damage. The most common type of damage observed in the newer RC buildings (Constructed after 2000) is mostly in the form of non-structural infill wall damage.Details of all these cases and likely reasons behind them are discussed next.
Damage due to soft/weak story
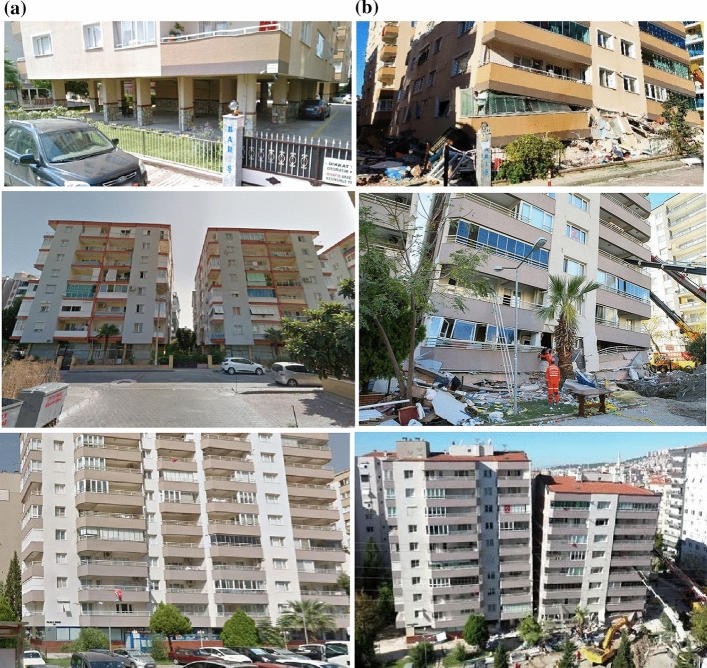
A number of buildings suffered severe damage or partial collapse at their first stories due to the presence of soft story (Fig. 7). A typical feature of the buildings in Turkish city centers is the presence of commercial space at the ground levels. In order to create wider space, infill walls are generally removed in these stories where the seismic demands are maximum. In addition, poor beam-column connections and the presence of weak columns are the key reasons for the development of soft-story mechanisms. The conditions of some example buildings with soft story feature are shown on the left column of Fig. 7 before the earthquake, their performance after the earthquake is shown on the right column of the figure. Due to the soft/weak stories, building collapses occur partially in the ground floor in some cases, whereas total collapse was observed in some other buildings. This is a very common type of failure frequently observed in many recent earthquakes [Elazığ 2020; Van 2011 (METU 2011); Bingöl 2003; İzmit 1999 (Scawthorn et al. 2000)]. The soft story feature does not always imply poor performance but it is clearly a damage exacerbating feature of deficient RC buildings in Turkey.
Fig. 7.
Failure due to soft/weak story. a Before the earthquake (left), b after the earthquake (right)
Damage in infill walls
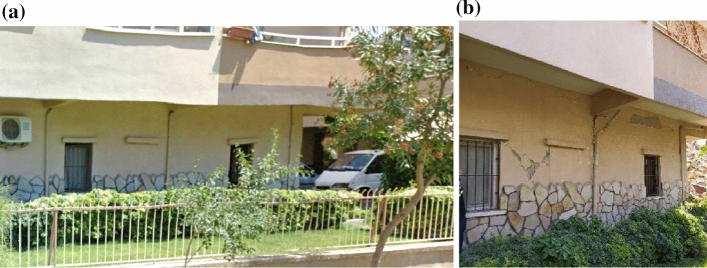
The most widely observed damage in RC buildings of Turkey is infill wall damage, and İzmir has not been an exception. The most common infill material is hollow-core clay bricks in the İzmir Region. Infill wall damage consisted of interface cracking at frame-boundary interfaces, diagonal cracking, and crushing (Fig. 8). The structural benefits and harms of the infill walls were similar to those observed in previous earthquakes (METU 2011; Bayraktar et al. 2015). In some buildings, the infill walls appeared to stiffen the building and reduce the lateral deformation demands. One of the very important examples exhibiting the significance of infill walls in saving a building that had inadequate lateral strength is shown in Fig. 8 where performance of one of the buildings in an eight-story apartment complex comprising of four buildings is shown. In the building shown in Fig. 8, there were extensive infill walls in the first story which prevented soft story formation. In the other three buildings, this floor had no infill walls at all (Fig. 7, top row). Three of the buildings without infill walls were either heavily damaged or collapsed, resulting in nine fatalities. The one with the masonry infill walls in the first story, on the other hand, experienced moderate infill wall damage without any significant structural damage (Fig. 9). This can be viewed as a striking example of the “unintended” benefit of infill walls contributing to lateral stiffness, strength, and axial capacity.
Fig. 8.
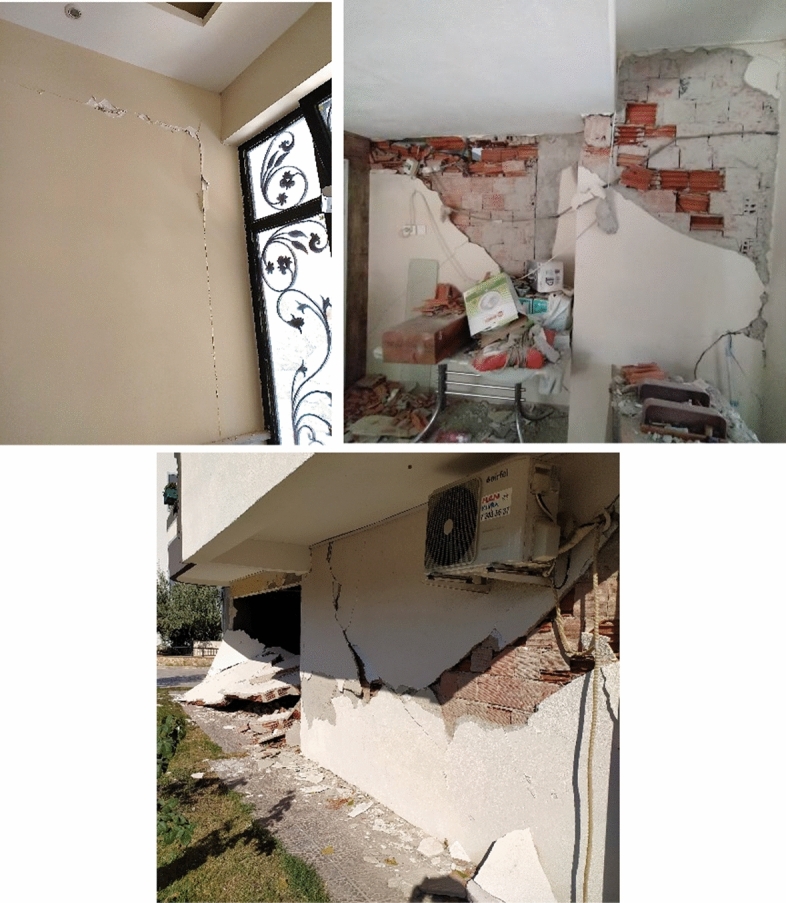
Types of Infill wall damages observed in İzmir
Fig. 9.
Contribution of infill walls. a Before the earthquake (left), b after the earthquake (right)
Damage due to heavy overhangs
The footprint area of buildings and the upper floor plan areas are significantly different in some of the buildings due to the presence of overhangs. These cantilever overhangs can be excessive, at the order of few meters, and prematurely crack under the weight of the exterior walls carried by the overhangs. Figure 10 shows wall cracking, and severe damage at the corners of heavy overhangs. Damage in heavy overhangs is not only limited to the partition walls, but also exist in the structural system. Flexural and shear cracks (residual crack widths above 1 mm) were observed in the structural members connected to these overhangs (Fig. 10). It is interesting to note that such localized damage in the overhangs resulted in unrepairable damage due to residual lateral and vertical deformations reaching substantial cantilever tip settlement; hence these buildings could not be re-occupied. The damage observed in overhangs, cantilever connections and ground floor columns in some buildings did not directly lead to structural collapse, but prevented re-occupation, hence leading to demolition. The effect of these overhangs on the continuity of frames and lateral load path needs to be considered as part of the design. It is also noteworthy that except the most recent one (TBEC 2018), previous Turkish seismic codes did not require consideration of vertical ground motion for such overhangs.
Fig. 10.
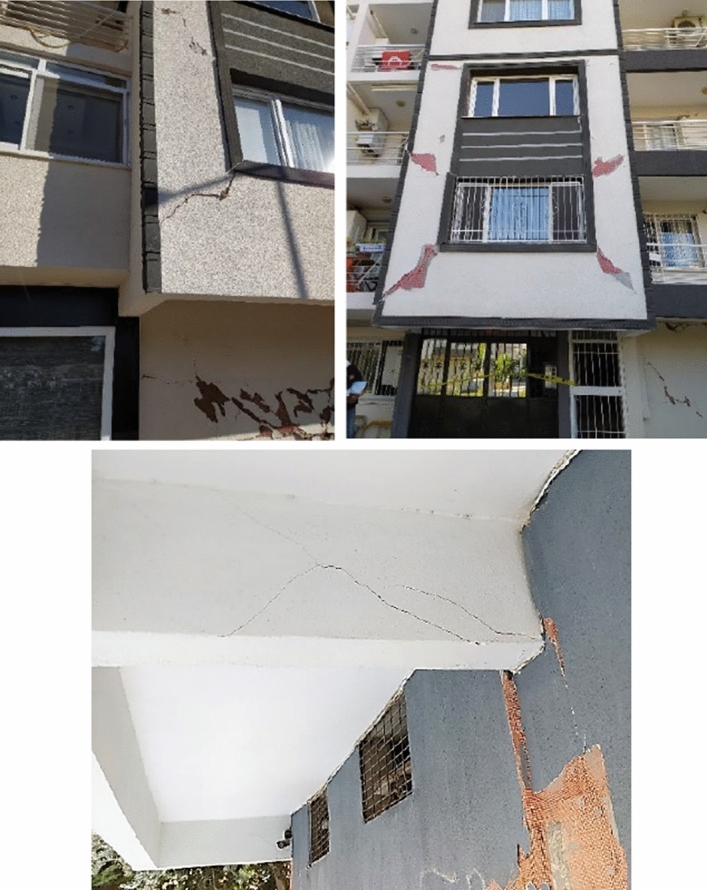
Damage in overhangs
Column damages
Significant structural damage was observed in the columns of heavily damaged buildings. The observed damage patterns were mainly concrete spalling, shear cracking, and buckling of longitudinal reinforcement in the heavily damaged buildings (Fig. 11). It is well-known that these damage types are associated with detailing deficiencies such as insufficient transverse ties, use of plain bars, absence of 135-degree hooks, and low concrete compressive strength. Inadequate confinement leading to spalling and buckling of longitudinal reinforcement, poor concrete quality and inadequate tie reinforcement leading to shear failure of columns and damage due to improper joint detailing are illustrated in Fig. 11. One of two identical buildings shown in Fig. 11 (bottom row) collapsed at its lower two stories, whereas the other building had almost no damage as observed from a street survey. However, assessment of this building from inside revealed heavy shear damage and significant corrosion in columns (Fig. 11). This observation clearly shows that damage assessment based on examination without entering the building may lead to misleading results.
Fig. 11.
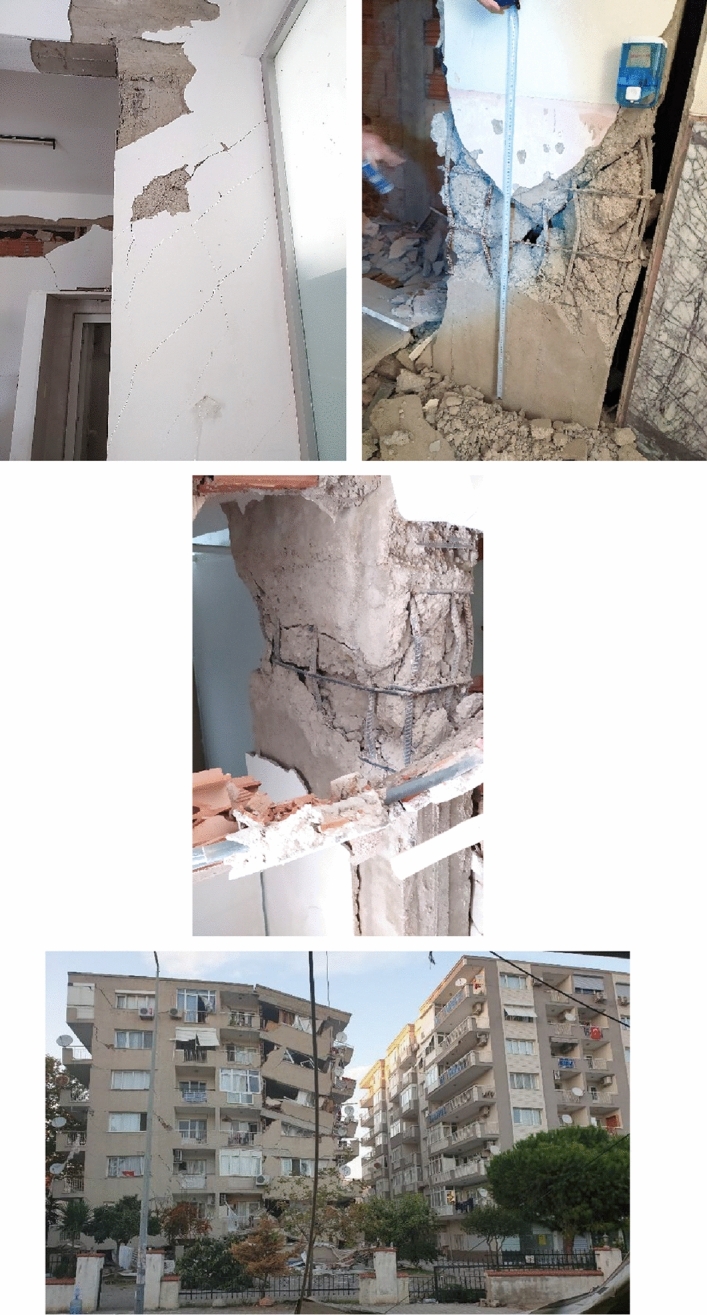
Damage in the columns of two heavily damaged buildings
Corrosion induced damage
Our investigations revealed that corrosion in reinforcement is a widespread problem in İzmir due to high humidity levels (Fig. 12). Excessive corrosion was especially observed at the bottom of columns in the basement or ground floors. Loss in the cross-sectional area of reinforcement due to corrosion was significant in some instances, reaching the ratios of 25–65%. In certain cases, the earthquake appeared to have triggered spalling in columns that made the corrosion visible whereas in most other cases the level of corrosion was so high that it was clearly seen in the buildings that had no structural damage. The critical problems associated with corrosion in the building columns are reduced moment and shear capacities due to loss of bond strength, and concrete spalling leading to premature rebar buckling. Hence, addressing problems related to corrosion detection and protection remains critical for seismic risk reduction in regions with high water table level.
Fig. 12.
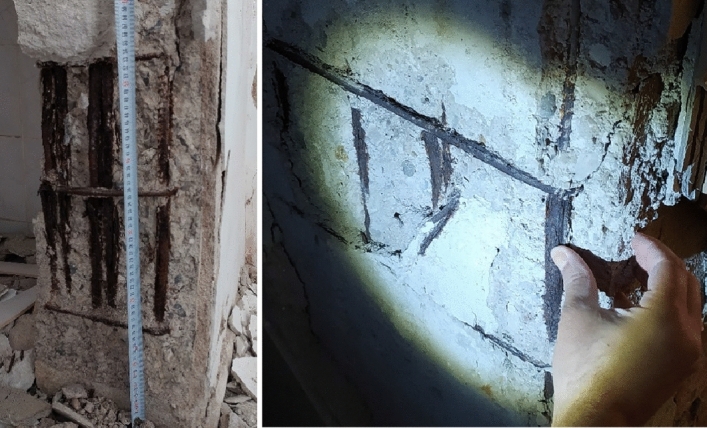
Corrosion induced damages
Structural system deficiencies
The damage examples discussed above were mainly observed in buildings constructed in the 1990’s, before the enforcement of the modern seismic code, TEC 1997 (CSCDA 1997). Public and government awareness increased after the Kocaeli and Düzce Earthquakes (1999) leading to construction quality and control. However, extensive non-structural damage was observed in some of the recently constructed office buildings that were designed according to the code. Although insignificant structural damage was observed the widespread non-structural damage was apparent, one important example being a recently constructed commercial center pointing out some noteworthy design mistakes. Figure 13 shows a 10-story commercial center with a shear wall core and a large opening in the center of the podium slab. All offices are located around the opening. Although no damage was observed in the core shear wall, heavy shear cracks were observed in the infill walls. It is surprising to see such heavy infill wall damage in a recently constructed building under an earthquake ground motion with intensity well below the design earthquake level. It is believed that due to the lack of diaphragm action, the core wall was unable to limit the inter-story drifts. It appears that improper modeling due to lack of rigid diaphragm action and poor design led to excessive drift of office areas, and the infill walls around offices suffered heavy damage. This observation emphasizes the importance of considering slab discontinuity and developing proper load transfer mechanisms to the shear walls. Several other examples of such behavior were observed in the city.
Fig. 13.
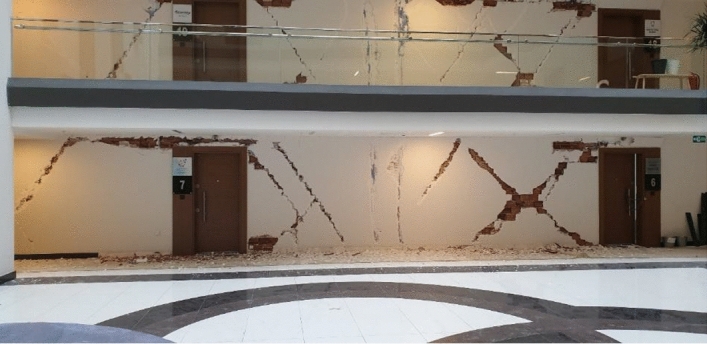
Non-structural damage in infill walls due to large openings in the slab
Observed performance of masonry buildings
Although few masonry buildings exist in city centers, approximately one third of the building stock in İzmir consists of older low-rise masonry buildings. Observations after the earthquake showed that except for two regions, damage to masonry structures were limited. Konak district of İzmir and Kösedere village in Karaburun peninsula are the two locations where damage to masonry buildings was more significant.
Damage in Konak district
Konak is the central district of Izmir with a long historical existence. There are many masonry structures in this region, most of which are registered as historical heritage. Although the performance of these structures were generally satisfactory, some have suffered structural damage. The elastic acceleration response spectra obtained from the ground motion recorded close to Konak is given in Fig. 2 (Station 3518, Alsancak). The maximum spectral accelerations reached at the typical period ranges of the masonry structures are in the range of 0.1–0.4 g.
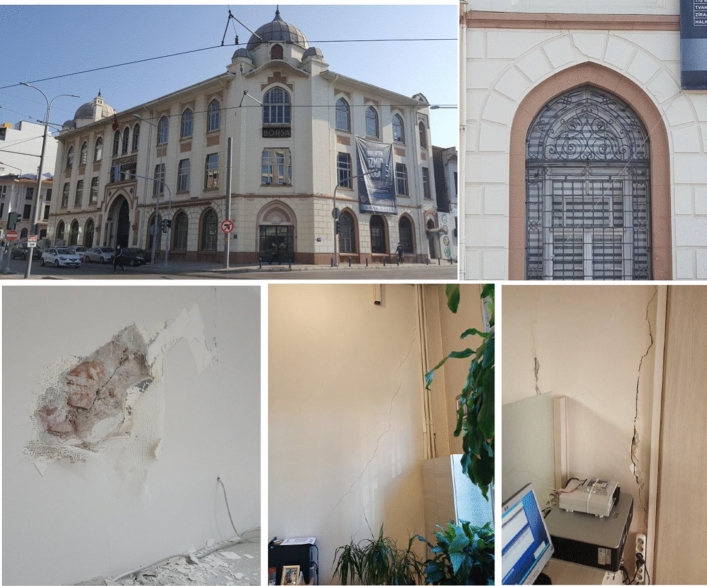
In general, previously renovated historical structures exhibited adequate performance but a few suffered damage. Some early twentieth century structures and historical mosques belong to this class. The İzmir Commerce Building which had a basement and three floors built in1920’s, sustained damage. It is originally constructed as a mixed masonry and reinforced concrete structure. The exterior façade of the building was built with stone-brick mix masonry walls, and the internal spaces were supported with RC frames. Later in its history, internal partial stories were added to the system with structural steel framing. An overview of the building and the damage it experienced from inside and outside are presented in Fig. 14 (Alkan 2020). The building suffered both structural and non-structural damage. Diagonal and vertical cracks in the walls imply that the capacity of these walls was exceeded. It is reported that the disruption of the original frame due to the partial stories added by dividing the stories with high headspace inside the building is the main cause of damage.
Fig. 14.
İzmir commerce building: general view and observed damages
Damage in Kösedere villages
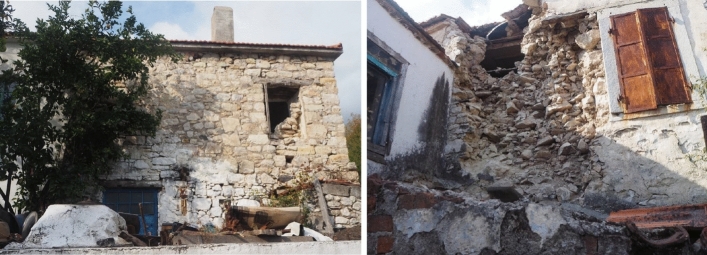
Most of the masonry building damages were concentrated in Kösedere, approximately 75 km away from the epicenter (Fig. 15). Forty masonry buildings suffered structural damage. These are 60–80 years old traditional, rubble stone masonry structures. Typically, lime mortar was used for the walls, most with plaster on both sides. Almost all the structures have two stories with wooden floors and roof trusses. The floor and the roof framing of the structures were observed to be weak, and the perimeter walls of the buildings provided the main resistance. It should be noted that the neighboring villages with very similar construction type and quality did not suffer comparable damage. There existed either none or very few damaged masonry structures in the rest of the peninsula. A typical example of this construction and the observed damage are shown in Fig. 16. The collapsed walls had thicknesses varying from 40 to 60 cm. In general, wall damage was observed as separation at the wall-to-wall connections (Fig. 16a), cracks in wall bodies (Fig. 17b), and at the window/door openings (Fig. 17c). Due to cracking, the structures were on the verge of losing the box behavior, which is the key mechanism to provide the out-of-plane stability of masonry walls and overall lateral structural strength.
Fig. 15.
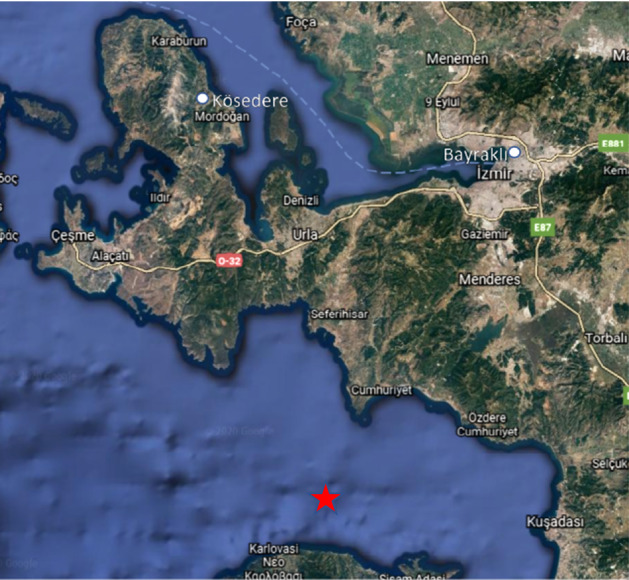
Location of Kösedere Village
Fig. 16.
Typical masonry wall in Kösedere and example of a collapsed wall
Fig. 17.
Typical wall damages. a Separation at wall-to-wall connection, b cracking in the body of a wall, c Cracking at door opening
Performance of bridges
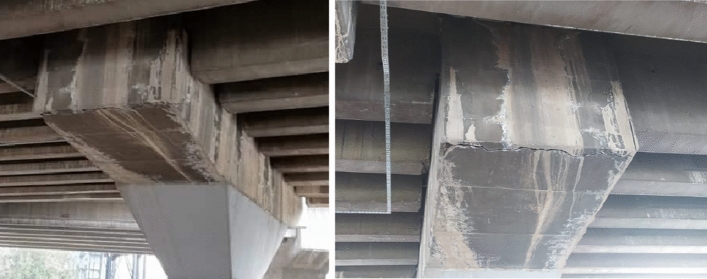
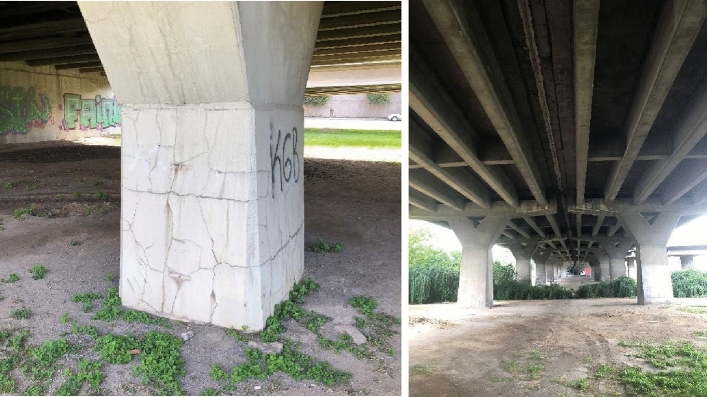
In addition to buildings, bridges in İzmir were also assessed by METU/EERC teams to investigate their response to the earthquake. The bridges located along Mürselpaşa—Zafer Payzın highway line, shown in Fig. 18, were investigated in detail. All the visited bridges are also marked in Fig. 18. As alluded before, the investigated bridges are approximately 75 km away from the earthquake epicenter. They were observed to perform satisfactorily. These analyzed bridges are in the close vicinity of the Bayraklı region and close to the seismic recording station 3513. Most likely, they have been subjected to spectral accelerations around 0.3 g at their corresponding vibration periods. No permanent movement has been observed in the superstructure beams and supports. The bending and shear capacities of the bridge columns and foundations were exceeded and no visible cracks were observed due to the earthquake. There were no settlements on the foundations mostly located on soft soil. No movement was observed at the bridge expansion joints. No loss of function such as rupture or fracture was observed in non-structural bridge elements (precast panels, pedestrian railings, lighting poles, etc.). The earthquake performances of longitudinal joints between twin bridges were also satisfactory, and some small concrete pieces not more than 2–3 cm fell on the ground only at some local zones. After the examination of the superstructure and infrastructure of the bridges, no earthquake-related damage was detected. Bridges were available for use right after the earthquake. As a result, it was determined that bridges that performed successfully during the earthquake were serviceable without a need of emergency intervention (Fig. 19).
Fig. 18.
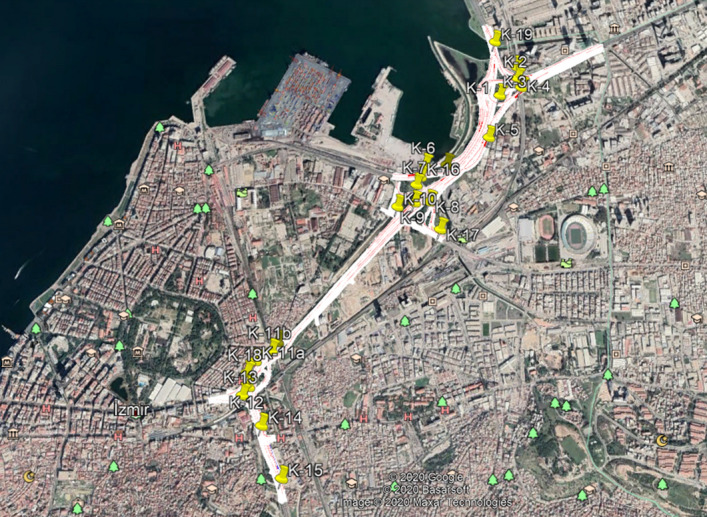
The highway line selected and bridges assessed
Fig. 19.
A typical before-and-after earthquake photo (December 2019 and November 2020)
A structural modal analysis has been performed on two segments of bridges, one curved and the other straight. The vibration periods of curved bridge along the transverse and longitudinal axes are found as 0.65 and 0.85 s, respectively, those for the straight bridge are 1.25 and 1.55 (Fig. 20). These analyzed bridges are in the close vicinity of the Bayraklı region and close to the seismic recording station 3513. Most likely, they have been subjected to spectral accelerations around 0.3 g at their corresponding vibration periods.
Fig. 20.
Modeled sample bridges in Bayraklı: a curved bridge and, a straight bridge
In some of the bridges, cracks, not due to the strong motion, were observed. Most of the cracks are pre-existing ones and were caused by rainwater and are ASR (Alkali-Silica Reaction) cracks, which are the result of a chemical reaction that occurred years ago in the bridge elements. No further opening of the cracks was observed after the earthquake (Fig. 21).
Fig. 21.
ASR based cracks (non-seismic) and general view
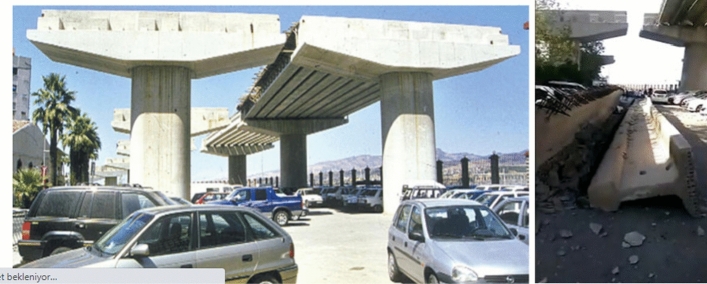
One case of bridge failure due to the earthquake was observed in an incomplete and abandoned bridge. The bridge girders, which were started to be built 20 years ago and discontinued because of a route change, fell during the earthquake because their lateral stability was not sufficient for the last 20 years (Fig. 22).
Fig. 22.
An incomplete bridge construction 20 years ago without providing a lateral girder stability at the site (10 years ago and now)
Implications of strong ground motions, site effects and seismic codes on the performance of buildings
The fact that significant damage was observed in especially several mid-rise RC buildings, despite their far distance to the epicenter, calls for detailed evaluation of recorded ground motions and code design spectra used for the design of these buildings as well as the likely effects of site properties. For this reason, the recorded ground motions are compared with the code design spectra considering the local site conditions and dynamic properties of the buildings. In an effort to explain the scattered distribution of damage and variation of the damage with respect to the building height and age, further evaluation of damage patterns and distributions in conjunction with the spectra of recorded ground motions and design spectra are performed.
Review of Turkish seismic codes
The history of seismic design codes dates back to the 1940s, after which many revisions and updates were published. As alluded to in the previous sections, most of the heavily damaged buildings were designed using recommendations given in the 1975 code, i.e. Code for Structures to be Constructed in Disaster Areas (CSCDA 1975). The buildings constructed after 1997 and 2007 were designed according to the 1997 code (CSCDA 1997), or the 2007 code, Code for Buildings to be Constructed in Seismic Areas (CBCSA 2007), respectively. Few buildings are encountered in the region that were designed according to the 2019 code, Turkish Building Earthquake Code (TBEC 2018). We briefly summarize here the requirements of the 1975 code and highlight major changes introduced thereafter.
In CSCDA (1975), response modification factors were not provided explicitly, and the inelastic spectrum was directly specified for the design of structures. The dimensionless spectrum shape was described by the following equation;
| 1 |
where T is the fundamental period of the structure in s and T0 is the predominant period of soil in s. The average values suggested for T0 range from 0.25 s (stiff soil, Vs > 700 m/s) up to 0.80 s (soft soil, Vs < 200 m/s). The 1975 code employs an equivalent static lateral load procedure for calculating internal forces, which relies on the base shear force calculated as
| 2 |
here, W is the weight, C is the seismic coefficient, C0 is the seismic zone coefficient representing earthquake zones, K represents the type of structural system and I is the building importance factor. Seismic zone dependence is imposed through C0 for four earthquake zones according to the seismic hazard map published in 1972 (MPWS 1972). It is noteworthy to mention that K varies for ductile systems (as ductile and non-ductile) and structural systems (as RC frame, RC dual, Steel, Masonry, etc.) between 0.6 and 1.5, hence it serves as a relative measure of ductility between different building systems and ductility levels. A lower K is assigned to more ductile systems. There is no direct use of any force reduction factor in order to convert an elastic spectrum to the inelastic spectrum. Therefore, one should be careful about interpreting the CSCDA (1975) design spectrum.
The 1975 code can be viewed as a sufficient code for its time, incorporating some general ductile design requirements for RC structures including confinement zones, reinforcement detailing, minimum reinforcement and size requirements for all structural members. Our past experience has indicated that, in general, the buildings designed and constructed according to the 1975 code performed satisfactorily after the earthquakes.
After approximately 22 years, the Turkish seismic design code was updated with significant changes in 1997, including more stringent requirements for ductile design and detailing, incorporating irregularities in more detail, including capacity design concepts, and using a more rational seismic hazard map displaying effective peak ground acceleration (A0). The elastic code spectrum amplitude (Sae(T)) was described based on A0, specified for four seismic zones by using the following equation.
| 3 |
S(T) in Eq. 3 denotes the shape of the spectrum as shown in Fig. 23. The influence of soil on the spectrum is reflected through the changes in corner periods (TA, TB) given for four different soil types. In softer soil types both a shift in TA and a wider range for TA-TB (i.e. wider constant acceleration region) are introduced with no direct amplitude amplification of the spectrum shape. An inelastic spectrum obtained by dividing the elastic spectrum with the earthquake force reduction coefficient (Ra(T)) is used in the seismic design of structures. In addition to equivalent static lateral load analysis, mode superposition and response history analyses were also included in the CSCDA (1997).
Fig. 23.
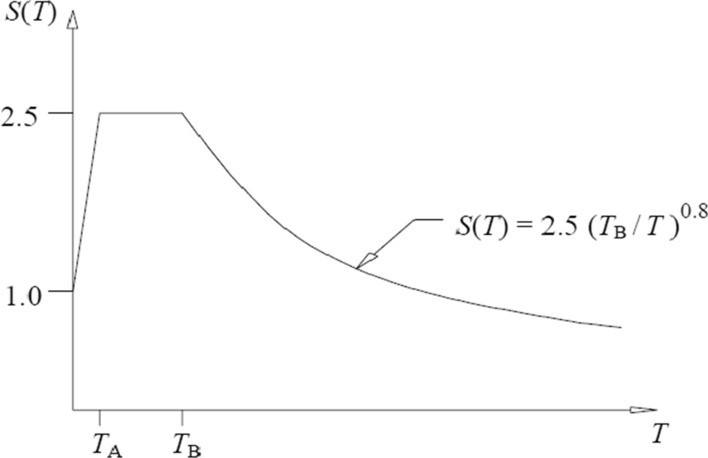
The shape of design spectrum in the 1997 and 2007 Seismic Codes
The 2007 Code retained all contents of the 1997 Code with the addition of a new chapter for the seismic assessment and rehabilitation of existing buildings. The most recent and current code that has been promulgated in 2019 (TBEC 2018) includes almost similar general design principles of the previous code, but also included some new sections focusing on different structures (tall buildings, seismically isolated buildings, light steel buildings, wood buildings etc.). The 2019 code also introduced performance-based design approach in addition to the force-based design by using nonlinear analysis methods. One of the major changes introduced in this code is the definition of design spectrum. It is a uniform hazard spectrum that is based on a new and rational seismic hazard map, which provides spectral amplitudes (SS and S1) at different return periods for a reference rock soil class in geographical coordinate basis. The soil amplification in the code is similar to the NEHRP approach that modifies spectral amplitudes using amplification coefficients given for different soil types to obtain the design spectral amplitudes (SDS, SD1). The horizontal design spectrum is shown in Fig. 24.
Fig. 24.
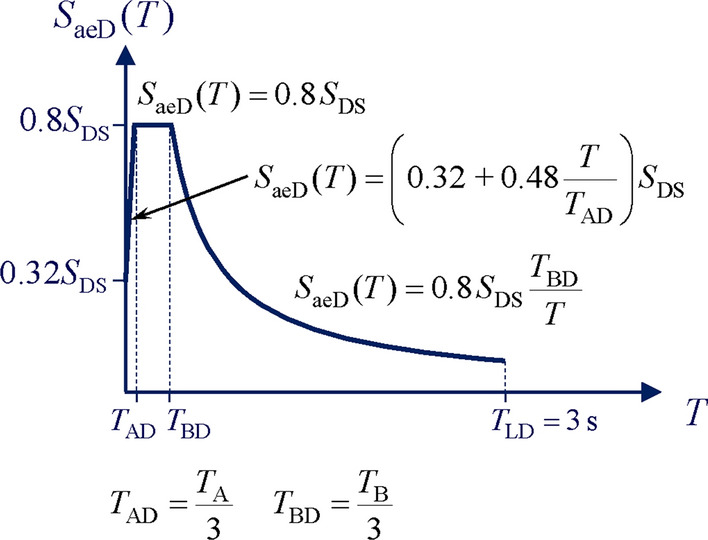
Design response spectrum defined in TBEC 2019
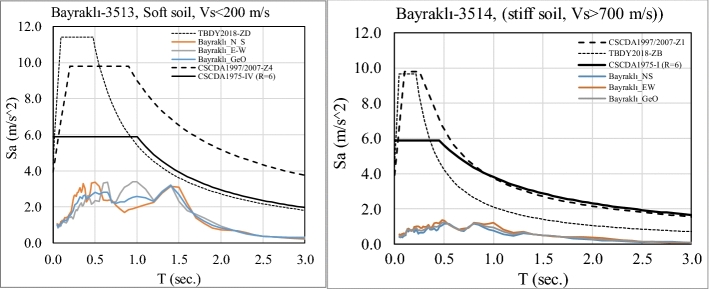
The elastic response spectra of all four codes are compared for soft and stiff soil sites of Bayraklı station in Fig. 25. The 1975 code spectra are converted to elastic spectra by assuming a moderate ductility level. Although there is no explicitly specified R factor in the 1975 code, the requirements given for detailing, reinforcement and sizes imply an inherent R factor in the buildings designed per the code. Thus, a value of R = 6 that corresponds to moderate ductility defined in the recent codes is assumed to be reasonable. The relative ductility factor K is taken as 1.0. Figure 24 reveals clearly that corner periods of TBEC 2019 are smaller than the other codes implying that it is less conservative in the period range of 0.6–1.5 s as compared to the 1997 and 2007 codes.
Fig. 25.
Comparisons of code design spectra and the spectra of recorded ground motions in stations 3514 and 3513
Figure 25 also displays the spectra of recorded ground motions at Bayraklı. As mentioned before, all code spectra are above the recorded values, even in the 0.6–1.5 s period range where significant amplification is observed. The shorter period regions (T < 0. 5 s) fall significantly below the design spectra. This is understandable, because the seismic waves from the October 30 earthquake arrive from 70 km distance, and high frequency components in seismic waves were filtered out along this long travel path. Long period waves however retain their energy and dominate the response spectra, both at the stiff and soft soil recording sites. In fairness, it is not consistent to compare the response spectra from a single recorded event and the design spectra obtained by PSHA in the seismic hazard map. Seismic hazard maps account for all causative faults shown in the area in estimating spectral design accelerations at these stations. The faults closer to the strong motion stations will perhaps produce seismic waves that are richer in high frequencies, which will eventually increase the spectral response accelerations at shorter periods. Nevertheless, the two sets of spectra displayed in Fig. 25 clearly reveal that the medium period structures with the fundamental period range of 0.5–1.5 s (approximately 7–12 story RC buildings) are affected more heavily compared to similar buildings on stiff soil sites. This observation has been ratified by the associated building damages, although the observed spectral accelerations were less than half of the spectral design accelerations. If seismic strengths of buildings in the region are uniform over stiff and soil sites, which seems likely, amplified ground accelerations on soft soil sites played a major role in the localization of building damages shown in Fig. 25. The details of the collapsed or heavily damaged buildings are not available to determine adequately the ductility demands. However, considering that the buildings that have collapsed are mainly 7–10 stories having periods of nearly 1.0–1.5 s, approximate concrete strength of 10 MPa, the columns have an average cross-section area of 0.18 m2 and an average tributary loading area of about 11 m2 with 1 ton/m2 gravity load on floors, and they have experienced spectral acceleration in order of 0.3 g, the maximum drift demands can approximately be computed as 0.8–1.4%. This demand corresponds to ductility of 3–6, that is believed to be much higher than the capacity considering the high axial load ratio and inadequate lateral confinement of these buildings.
Although soft soil sites along the margins of İzmir bay were subjected to higher intensity ground motions during the October 30 earthquake than in inland areas, this does not solely explain the non-uniform distribution of damage across the region. All of the four stations on soft soil sites are located at regions of densely populated buildings. Spectral intensities experienced are quite similar for buildings of 5–10 stories, which dominate the RC building stock. However, heavy damage is only observed in the Bayraklı region. There are damages observed also in Karşıyaka, Bostanlı and Alsancak, but to a much lesser extent. The damage level dispersion can be explained by the differences in the quality of building stock to some extent. The distribution of damage in these regions in connection with the structural quality of buildings as well as the local site effects requires further investigation. But the information gathered on urban development reveal that Bayraklı region has developed much later compared to the other regions, and the region served to settle the surging population in İzmir after 1980’s. Substantial damage despite seismic demands lower than the requirements of the 1975 seismic code indicates that design of these buildings in Bayraklı were not code-conforming, leading to inadequate seismic force capacity. Damage observations presented before reveal that seismic detailing required by the 1975 Turkish Earthquake Code (in effect from 1975 to 1997) was not properly implemented. This area was developed during a period of intensive migration from small rural settlements to large urban centers.
Turkish seismic design codes appear to define design force levels and other requirements that would suffice for earthquake resistant design as revealed by the past earthquakes including the October 30, 2020 earthquake. The 1997, 2007 and 2019 Codes include the most recent knowhow, up-to-date approaches, advanced methods and requirements of modern seismic design codes. Despite its limited coverage of ductility, irregularity, detailing and capacity design principles, the buildings designed and constructed properly according to the 1975 code are expected to sustain survive without collapse during this event despite much smaller seismic design forces.
A pronounced effect of the 30 October earthquake is the significant damage in Bayraklı, some 70 km’s away from the epicenter. There is consensus that this is due to site amplification at mid-to-long periods. However, the amplified ground motion acceleration levels observed are still lower than the design values.
This implies that not only soil amplification, but also some major drawbacks and deficiencies of the buildings played an important role in the poor building performance. The observed site spectrum compared to the design spectra indicates that for the mid-to-long period range, the code spectrum shape may be improper and unconservative for such sites.
The spectral ordinates obtained for station 3513 (soft soil) are divided with the ones determined for 3514 (rock) to obtain the soil amplification coefficients, which are compared in Fig. 26. This figure clearly shows that the code amplifications are below the measured amplification levels in Bayraklı. Therefore, site-specific response spectra for such areas have to be considered and necessary modifications in the current code should be undertaken. Aside from this exception, TBEC (2018) appears to address the requirements for earthquake resistant building design adequately.
Fig. 26.
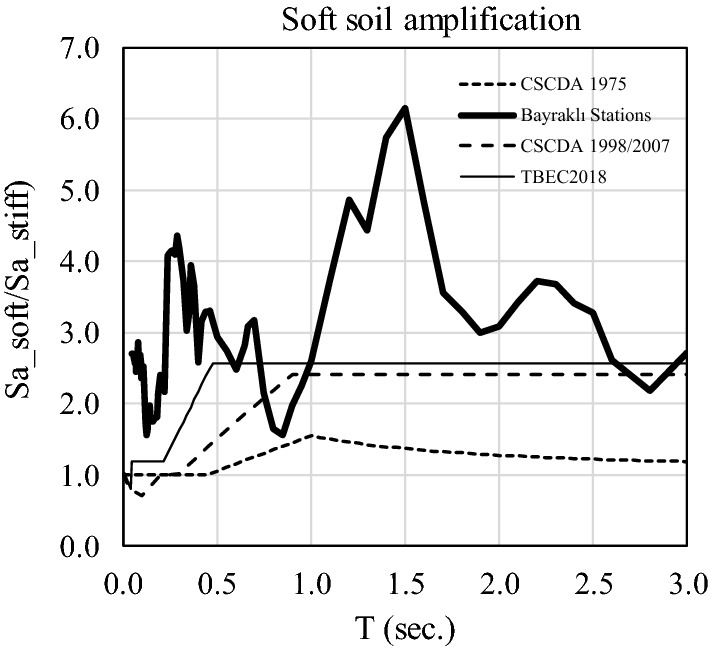
Soft-to-stiff soil amplifications based on Bayraklı Stations
Conclusions
Earthquake reconnaissance studies are quite important as they reveal invaluable data from earthquakes that naturally reveal validity of seismic design principals, attributes that negatively influence the performance, improper and inadequate applications of design codes and the degree of code compliance, damage attributes that are not addressed in the codes as well as ways to improve the design criteria in the codes. Although, similar attributes and patterns of damage are observed after earthquakes, each earthquake highlights some aspects more pointing some specific problems. The most important aspect of İzmir earthquake is the amplified ground motions at soft sites located more than 70 km from the epicenter. It also emphasized the non-uniform distribution of damage among similar buildings despite similar levels of ground motions. This paper discussed the peculiarities of İzmir earthquake investigating performance of buildings and bridges through field damage assessments, and examination of ground motions focusing on site effects. The following conclusions are believed to highlight all important aspects of İzmir earthquake influencing performance of buildings.
The strong motion accelerations measured in the center of İzmir after the earthquake are generally very low due to its distance to the epicenter. However, a clear amplification due to low frequency content of the ground motion was observed especially in soft soil sites like Bayraklı, where site effects appear to have a strong influence in long period amplifications. The relatively high spectral accelerations, recorded at the mid-to-long period (0.6–1.5 s) range due to soil amplification, are well below the design basis values. Soil amplification resulted in collapse and heavy damage on inadequately designed and/or constructed 7–10 story reinforced concrete buildings in Bayraklı.
The buildings with presence of soft/weak stories at ground floors were observed to have suffered collapse or heavy damage due to inadequate design and deficiencies. Being a widespread type of damage, presence of soft/weak story was once again found to be one of the most critical attributes leading to collapse of deficient buildings.
Infill wall damage observed in many buildings resulted in significant property loss and played an essential role in the earthquake aftermath psychology of people. Even if no structural damage was observed, it caused a perception of excessive damage to the buildings.
It was observed that the examination of buildings from street might lead to misleading assessment of damage, so the decision on damage state should be made based on assessment form inside as well.
Infill walls that do not suffer out-of-plane failure may have a beneficial contribution to the vertical and lateral load-carrying capacity of deficient buildings, reducing the drift demands and thus preventing the collapse of buildings under small and medium-size earthquakes.
Inadequate stiffness and strength of slabs and tie-beams, which transfer the lateral loads to shear walls, led to high drift demands in some buildings, resulting in a concentration of damage in non-structural members.
In most of the damaged buildings, it was observed that a regular structural system and continuous frame system required for a proper earthquake load transfer, was not established.
Excessive corrosion was observed in the bottom ends of columns located at the basement and ground floors of the examined buildings in Bayraklı, İzmir. Corrosion levels accelerate the loss of bond, cover spalling and reduce deformation capacity of RC columns.
Local overhang-column connection and ground floor column damage observed at the cantilevers of 7–10 story buildings are so high that the retrofit and re-occupation of the buildings were deemed impossible.
The damage observed are due to inadequacies and deficiencies present in the buildings; the fact that the levels of ground motions measured are less than the design levels is a clear indication of this phenomenon. Therefore, this earthquake should not be considered as the design level earthquake. Consequently, the impression that the buildings suffering no damage have adequate seismic capacity would be quite misleading.
Masonry structures in İzmir, fortunately, did not collapse during the October 30th earthquake. But there exist many structures with heavy damage. Considering the level of earthquake demand, it could be said that the damaged structures do not provide the safety levels needed by the current seismic regulation. Therefore, the earthquake could be viewed as an indicator of the weakest structures. The lesson learnt by the earthquake should be taken seriously, and these structures should be strengthened to provide safety in future events.
Thus, in the design of multi-story buildings in Bayraklı and similar regions, site amplification should be taken into account in the design of mid-rise buildings.
No seismic induced damage has been observed on bridges under service, even though the bridges have some prior deterioration due to the ASR problems developed over the last 30 years. Similar observations have also been made after recent major earthquakes in Turkey, even for the very old bridges, most probably not designed for seismic events. The flexible supports between the superstructure and substructure levels are believed to facilitate this successful seismic performance. Bridge construction in Turkey is usually under strict supervision of the governmental agencies, which also contributed to obtain this satisfactory level of performance.
Footnotes
Publisher's Note
Springer Nature remains neutral with regard to jurisdictional claims in published maps and institutional affiliations.
References
- Alkan D (2020) İzmir Ticaret Odası Gözlemsel İnceleme Raporu, Aralık, İzmir, Turkey
- Bayraktar A, Altunisik AC, Türker T, Karadeniz H, Erdogdu S, Angin Z, Özsahin TS. Structural performance evaluation of 90 RC buildings collapsed during the 2011 Van Turkey, Earthquakes. J Perform Constr Facil. 2015;29(6):04014177. doi: 10.1061/(ASCE)CF.1943-5509.0000524. [DOI] [Google Scholar]
- Bayraktar A, Altunısık AC, Muvafık M. Field investigation of the performance of masonry buildings during the October 23 and November 9, 2011 Van earthquakes in Turkey. ASCE J Perform Constr Facil. 2016;30(2):04014209. doi: 10.1061/(ASCE)CF.1943-5509.0000383. [DOI] [Google Scholar]
- Boduroglu H, Ozdemir P, Binbir E, Ilki A (2013) Seismic damage assessment methodology developed for Turkish Compulsory Insurance System, In: The 9th annual conference of the international institute of infrastructure renewal and reconstruction, Brisbane
- CBCEA . Code for buildings constructed in earthquake areas. Ankara: Ministry of Public Works and Settlement; 2007. [Google Scholar]
- Cetin KO, Mylonakis G, Sextos A, Stewart JP (Editors) (2020) Seismological and Engineering Effects of the M 7.0 Samos Island (Aegean Sea) Earthquake, Hellenic Association of Earthquake Engineering: Report 2020/02, Earthquake Engineering Association of Turkey, Earthquake Foundation of Turkey, Earthquake Engineering Research Institute (USA), Geotechnical Extreme Events Reconnaissance Association: Report GEER-069, https://doi.10.18118/G6H088, December
- CSCDA . Code for structures constructed in disaster areas. Ankara: Ministry of Public Works and Settlement; 1975. [Google Scholar]
- CSCDA . Code for structures constructed in disaster areas. Ankara: Ministry of Public Works and Settlement; 1997. [Google Scholar]
- Dogangün A. Performance of reinforced concrete buildings during the May 1, 2003 Bingöl earthquake in Turkey. Eng Struct. 2004;26(6):841–856. doi: 10.1016/j.engstruct.2004.02.005. [DOI] [Google Scholar]
- Ilki A, Halici O, Kupcu E, Comert M, Demir C (2020) Modifications on seismic damage assessment system of TCIP based on reparability. In: 17th world conference on earthquake engineering, 17WCEE, Sendai, Japan
- Inel M, Ozmen HB, Bilgin H. Re-evaluation of building damage during recent earthquakes in Turkey. Eng Struct. 2008;30(2):412–427. doi: 10.1016/j.engstruct.2007.04.012. [DOI] [Google Scholar]
- Korkmaz SZ. Observations on the Van Earthquake and Structural Failures. ASCE J Perform Constr Facil. 2015;29(1):04014033. doi: 10.1061/(ASCE)CF.1943-5509.0000456. [DOI] [Google Scholar]
- METU (2011) The 23 October 2011 Mw 7.2 Van earthquake seismic and structural damage field observations (in Turkish), Middle East Technical University Earthquake Engineering Research Center, Report # METU/EERC 2011–04, http://www.eerc.metu.edu.tr/sites/default/files/Van_ODTU_DMAM_Rapor.pdf
- METU (2020) The Samos (İzmir-Seferihisar Offshore) Earthquake [30 October 2020 Mw=6.6] Field Observations On Seismic and Structural Damage, Earthquake Engineering Research Center, Middle East Technical University, Report No: METU/EERC 2020–03, November
- MPWS (1972) Earthquake Zone Map, Ministry of Public Works and Settlement, Published by Law No. 7/5551 on 23.12.1972
- Oyguc R, Oyguc E. 2011 Van earthquakes: lessons from damaged masonry structures. ASCE J Perform Constr Facil. 2017;31(5):04017062. doi: 10.1061/(ASCE)CF.1943-5509.0001057. [DOI] [Google Scholar]
- Sayin E, Yon B, Calayir Y, Gor M. Construction failures of masonry and adobe buildings during the 2011 Van earthquakes in Turkey. ASCE Struct Eng Mech. 2014;51(3):503–518. doi: 10.12989/sem.2014.51.3.503. [DOI] [Google Scholar]
- Scawthorn C (2000) The Marmara, Turkey earthquake of August 17, 1999: Reconnaissance report, Multidisciplinary Center for Earthquake Engineering Research (MCEER); Buffalo, New York; U.S. 190 p., Technical Report MCEER, 00–0001, March
- Sezen H, Whittaker AS, Elwood KJ, Mosalam KM. Performance of reinforced concrete buildings during the August 17, 1999 Kocaeli, Turkey earthquake, and seismic design and construction practice in Turkey. Eng Struct. 2003;25(1):103–114. doi: 10.1016/S0141-0296(02)00121-9. [DOI] [Google Scholar]
- Spence R, Bommer J, Del Re D, Bird J, Aydinoğlu N, Tabuchi S. Comparing loss estimation with observed damage: a study of the 1999 Kocaeli earthquake in Turkey. Bull Earthq Eng. 2003;1:83–113. doi: 10.1023/A:1024857427292. [DOI] [Google Scholar]
- Sucuoglu H, Yilmaz T. Duzce, Turkey: A City Hit by two major earthquakes in 1999 within three months. Seismol Res Lett. 2001;72(6):679–689. doi: 10.1785/gssrl.72.6.679. [DOI] [Google Scholar]
- Sucuoglu H, Yazgan U, Yakut A. A screening procedure for seismic risk assessment in urban building stocks. Earthq Spectra. 2007;23(2):441–458. doi: 10.1193/1.2720931. [DOI] [Google Scholar]
- Tapan M, Comert M, Demir C, Sayan Y, Orakcal K, Ilki A. Failures of structures during the October 23, 2011 Tabanlı (Van) and November 9, 2011 Edremit (Van) earthquakes in Turkey. Eng Fail Anal. 2013;34:606–628. doi: 10.1016/j.engfailanal.2013.02.013. [DOI] [Google Scholar]
- TBEC (2018) Turkish Building Earthquake Code, Disaster and Emergency Management Presidency, Ankara, Turkey
- Tezcan SS, Bal IE, Gülay FG. P25 scoring method for the collapse vulnerability assessment of R/C buildings. J Chin Inst Eng. 2011;34(6):769–781. doi: 10.1080/02533839.2011.591548. [DOI] [Google Scholar]
- Yakut A. Preliminary seismic performance assessment procedure for existing RC buildings. Eng Struct. 2004;26(10):1447–1461. doi: 10.1016/j.engstruct.2004.05.011. [DOI] [Google Scholar]
- Yakut A, Gulkan P, Bakir S, Yilmaz MT. Re-examination of damage distribution in Adapazari: structural considerations. Eng Struct. 2005;27(7):990–1001. doi: 10.1016/j.engstruct.2005.02.001. [DOI] [Google Scholar]
- Yakut A, Ozcebe G, Yucemen MS. Seismic vulnerability assessment using regional empirical data. Earthq Eng Struct Dyn. 2006;35(10):1187–1202. doi: 10.1002/eqe.572. [DOI] [Google Scholar]


