Abstract
Objective
To validate the 8th edition of the American Joint Committee on Cancer (AJCC) staging system for pancreatic ductal adenocarcinoma (PDAC) in a Chinese cohort of radically resected patients and to develop a refined staging system for PDAC.
Methods
Data were collected from the China Pancreas Data Center (CPDC) for patients with resected PDAC in 2016 and 2017, and cancer-specific survival (CSS) was evaluated using the Kaplan-Meier method and log-rank test. Univariate and multivariate analyses based on Cox regression were performed to identify prognostic factors. The recursive partitioning analysis (RPA), Kaplan-Meier method, and log-rank test were performed on the training dataset to generate a proposed modification for the 8th TNM staging system utilizing the preoperative carbohydrate antigen (CA)19-9 level. Validation was performed for both staging systems in the validation cohort.
Results
A total of 1,676 PDAC patients were retrieved, and the median CSS was significantly different between the 8th TNM groupings, with no significant difference in survival between stage IB and IIA. The analysis of T and N stages demonstrated a better prognostic value in the N category. Multivariate analysis showed that the preoperative serum CA19-9 level was the strongest prognostic indicator among all the independent risk factors. All patients with CA19-9 >500 U/mL had similar survival, and we proposed a new staging system by combining IB and IIA and stratifying all patients with high CA19-9 into stage III. The modified staging system had a better performance for predicting CSS than the 8th AJCC staging scheme.
Conclusions
The 8th AJCC staging system for PDAC is suitable for a Chinese cohort of resected patients, and the N category has a better prognostic value than the T category. Our modified staging system has superior accuracy in predicting survival than the 8th AJCC TNM staging system.
Keywords: CA19-9, cancer-specific survival, CPDC, pancreatic ductal adenocarcinoma, prognosis, TNM staging
Introduction
Despite advances in multimodality treatment, pancreatic ductal adenocarcinoma (PDAC) remains one of the most lethal malignancies, with a 5-year survival rate of less than 8%, and it is expected to be the second greatest cause of cancer-related death in 2030 (1,2). Surgical resection remains the only potential cure for PDAC, but only 20% of PDAC patients are eligible for surgical operation, and postoperative long-term survival can be achieved in only 20% of patients undergoing successful resection and adjuvant therapy (3,4).
The poor survival of PDAC patients requires the development of an accurate staging system to guide treatment and predict prognosis. The American Joint Committee on Cancer (AJCC) TNM staging system is the most widely used indicator for such purposes, and it is based on three factors: tumor size and extension (T), lymph node metastasis (N), and distant metastasis (M). In 2016, the AJCC released the 8th TNM staging system for PDAC. Since then, several studies have validated the predictive value of this system in clinical use and proposed modifications for the AJCC 8th edition staging system (5-14). However, most of these studies are based on Western cohorts, and whether the modified staging system is suitable for the Chinese population remains unclear.
Therefore, this study aimed to validate the AJCC 8th staging system for PDAC using a cohort from the China Pancreas Data Center (CPDC) and to propose a modification for the 8th TNM staging system by incorporating the preoperative level of CA19-9.
Materials and methods
Patients and data source
A multicenter web-based registry called the CPDC was initiated by the Chinese Society of Surgery and became the first multidisciplinary and specialized oncology big data center in China. Data in CPDC were collected from 90 tertiary hospitals in 31 provinces across China, and these hospitals represent the top hospitals in pancreatic disease diagnosis and treatment in China. The CPDC started data collection in 2016, and patients were followed up and registered yearly by participating hospitals. Data used in this study were retrieved from the CPDC database. This study was approved by the Institutional Review Board of Peking Union Medical College Hospital (PUMCH). The requirement of informed consent was waived because of the retrospective nature of this study. The inclusion criteria were as follows: 1) pathologically confirmed PDAC; 2) underwent curative intent surgical resection in 2016 and 2017; and 3) had complete clinicopathological and follow-up information. The exclusion criteria were as follows: 1) neoadjuvant treatment or 2) death within 30 d of surgery.
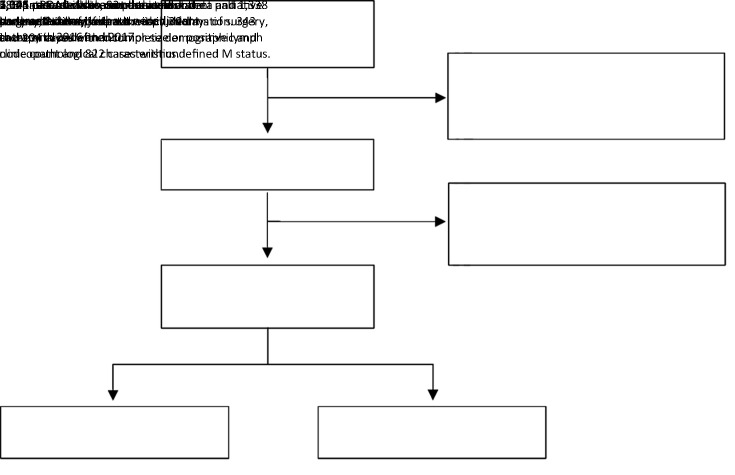
A total of 1,676 PDAC patients who met the criteria above were finally included. The detailed enrollment procedure is shown in Figure 1. The following data were retrieved for each patient: sex, age (year), body mass index (BMI, kg/m2), differentiation grade, preoperative serum total bilirubin (TBIL, μmol/L), preoperative serum carbohydrate antigen 19-9 (CA19-9, U/mL), preoperative serum carcinoembryonic antigen (CEA, ng/mL), surgical approach, tumor size (cm), T stage, tumor site, the number of positive lymph nodes (LNs positive), the number of examined lymph nodes (LNs examined), resection margin status, follow-up time, and survival information. The 8th edition N stage was derived from the number of positive lymph nodes. Resection margin status was defined as R0 if no cancer cells were found within 0 mm of the resection margin microscopically and R1 if cancer cells were visible microscopically within the resection margin. No M1 or R2 resection disease was found in the final cohort.
Figure 1.
Flow chart of PDAC patients included in this study. PDAC, pancreatic ductal adenocarcinoma.
Statistical analysis
The primary outcome was cancer-specific survival (CSS), which was calculated from the date of surgery to the date of death or the last follow-up date. Continuous variables are presented as the medians and interquartile ranges (IQRs), while categorical variables are presented as frequencies. Survival curves were calculated using the Kaplan-Meier method, and the differences in survival between groups were evaluated by the log-rank test. The cutoff points of continuous variables for survival were determined and validated using X-tile software (Yale University, New Haven, CT, USA). Univariate and multivariate analyses were performed and hazard ratios (HRs) and 95% confidence interval (95% CI) were determined by a Cox proportional hazards regression model to identify independent prognostic factors. Then, the data were randomly divided into training and validation sets at a 2:1 ratio. To develop a refined staging system that incorporated CA19-9 together with the 8th AJCC stage, recursive partitioning analysis (RPA) combined with the Kaplan-Meier method and log-rank test was performed to derive new stages in the training set. The predictive performance of the modified staging system was measured by the concordance probability estimate (CPE), concordance index (C-index) and decision curve analysis (DCA), with a CPE and C-index larger than 0.5 indicating good prediction abilities. All statistical analyses were performed using R version 3.6.1 (The R Foundation for Statistical Computing, Vienna, Austria) and X-tile software. A two-sided P-value of <0.05 was considered statistically significant.
Results
Baseline characteristics
A total of 1,676 patients with complete clinical and survival data from the CPDC database were retrieved, and their baseline demographic and clinicopathological characteristics are shown in Table 1. The median age was 63.00 (IQR, 56.00−68.00) years, and 1,018 (60.7%) patients were male. While 535 (31.9%) patients had cancer located at the body and tail of the pancreas, 1,141 (68.1%) patients had pancreatic head cancer. The median tumor size was 3.00 (IQR, 2.50−4.00) cm. The median values of CEA and CA19-9 were 3.26 (IQR, 2.00−5.61) ng/mL and 158.95 (IQR, 39.27−519.68) U/mL, respectively. The median number of LNs examined was 10.00 (IQR, 5.00−16.00). The median follow-up period and the median CSS for all 1,676 patients were 23 months and 24 months, respectively.
Table 1. Baseline demographic and clinicopathological characteristics (N=1,676).
| Characteristics | n (%) |
| IQR, interquartile range; BMI, body mass index; TBIL, total bilirubin; CA19-9, carbohydrate antigen 19-9; CEA, carcinoembryonic antigen; LN, lymph node. | |
| Gender | |
| Female | 658 (39.3) |
| Male | 1,018 (60.7) |
| Age (year) [median (IQR)] | 63.00 (56.00, 68.00) |
| BMI (kg/m2) [median (IQR)] | 22.41 (20.45, 24.22) |
| TBIL (μmol/L) [median (IQR)] | 19.50 (11.00, 112.60) |
| CA19-9 (U/mL) [median (IQR)] | 158.95 (39.27, 519.68) |
| CEA (ng/mL) [median (IQR)] | 3.26 (2.00, 5.61) |
| Tumor size (cm) [median (IQR)] | 3.00 (2.50, 4.00) |
| Site of tumor | |
| Body and tail of pancreas | 535 (31.9) |
| Head of pancreas | 1,141 (68.1) |
| Differentiation | |
| I | 74 (4.4) |
| II | 792 (47.3) |
| III | 807 (48.2) |
| IV | 3 (0.2) |
| LNs positive [median (IQR)] | 0 (0, 1.00) |
| LNs examined [median (IQR)] | 10.00 (5.00, 16.00) |
| Margin | |
| R0 | 1,502 (89.6) |
| R1 | 174 (10.4) |
| Adjuvant therapy | |
| No | 945 (56.4) |
| Yes | 731 (43.6) |
Evaluation of AJCC stage classification for CSS
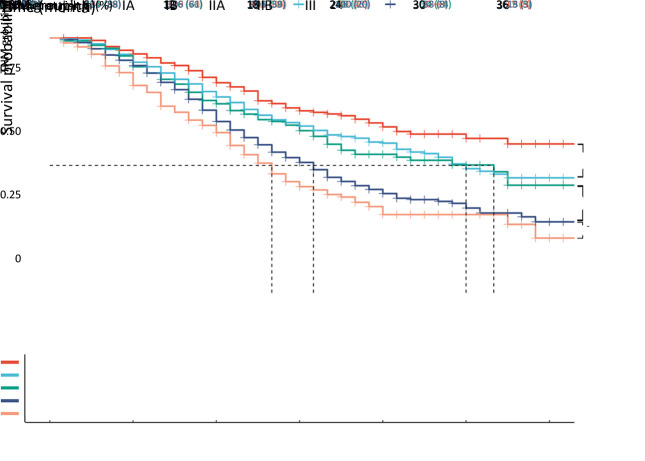
Table 2 shows the detailed stage classification which stratified patients according to the AJCC 8th staging system. Stage IA was found in 210 (12.5%) patients, stage IB in 477 (28.5%) patients, stage IIA in 176 (10.5%) patients, stage IIB in 498 (29.7%) patients, and stage III in 315 (18.8%) patients. Due to the short follow-up period, the median CSS for IA patients was not shown, and the median CSS calculated using the Kaplan-Meier method was as follows: stage IB, 30 months; stage IIA, 32 months; stage IIB, 19 months; and stage III, 16 months. Kaplan-Meier survival curves are shown in Figure 2 with a significant difference in prognosis among different stages (log-rank P<0.001). When comparing CSS between each two stages, a significant difference between each group was found, except for that between stage IB and IIA, with a log-rank P-value of 0.030 between IB and IA, 0.400 between IIA and IB, 0.008 between IIB and IIA, and 0.027 between III and IIB.
Table 2. Staging and median CSS of PDAC patients based on the AJCC 8th staging system (N=1,676).
| Classifications | n (%) | Median CSS (month) | 95% CI |
| CSS, cancer specific survival; PDAC, pancreatic ductal adenocarcinoma; AJCC, American Joint Committee on Cancer; 95% CI, 95% confidence interval; NA, not available. | |||
| TNM grouping | |||
| IA | 210 (12.5) | NA | NA |
| IB | 477 (28.5) | 30 | 27−NA |
| IIA | 176 (10.5) | 32 | 21−NA |
| IIB | 498 (29.7) | 19 | 17−21 |
| III | 315 (18.8) | 16 | 14−17 |
| T stage (N0) | |||
| T1 | 210 (12.5) | NA | NA |
| T2 | 477 (28.5) | 30 | 27−NA |
| T3 | 176 (10.5) | 32 | 21−NA |
| T4 | 96 (5.7) | 17 | 15−24 |
| T stage | |||
| T1 | 317 (18.9) | 35 | 26−NA |
| T2 | 861 (51.4) | 24 | 21−28 |
| T3 | 300 (17.9) | 21 | 19−32 |
| T4 | 198 (11.8) | 16 | 15−20 |
| N stage | |||
| N0 | 959 (57.2) | 32 | 28−39 |
| N1 | 575 (34.3) | 19 | 17−20 |
| N2 | 142 (8.5) | 14 | 11−17 |
Figure 2.
Comparison of CSS among different stages according to the AJCC 8th TNM system (P<0.001). CSS, cancer-specific survival; AJCC, American Joint Committee on Cancer.
Prognostic values of T and N staging for CSS
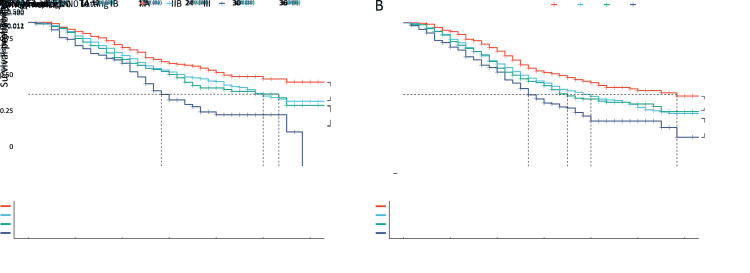
Of all 1,676 patients with curative resection, 959 (57.2%) patients had no lymph node metastasis. According to the 8th edition, under the N0 setting, there were 210 (12.5%) patients with T1, 477 (28.5%) patients with T2, 176 (10.5%) patients with T3, and 96 (5.7%) patients with T4 cancer. The median CSS for T2, T3, and T4 patients was 30, 32, and 17 months, respectively (Table 2). The log-rank test for the survival of each T category showed significant differences between T1 and T2 and T3 and T4 but not between T2 and T3 (Figure 3A). The same trend was found when T stage was analyzed without N0 setting (Figure 3B), and CSS for overall T stage was 35 months for T1, 24 months for T2, 21 months for T3, and 16 months for T4. The log-rank P-value was 0.002 between T1 and T2, 0.590 between T2 and T3, and 0.011 between T3 and T4.
Figure 3.
Prognostic values of T staging for CSS. (A) CSS for T stage in 959 patients with curative resection for node-negative pancreatic cancer (P<0.001); (B) CSS for overall T stage (P<0.001). T stage was defined by the AJCC 8th TNM staging system. CSS, cancer-specific survival; AJCC, American Joint Committee on Cancer.
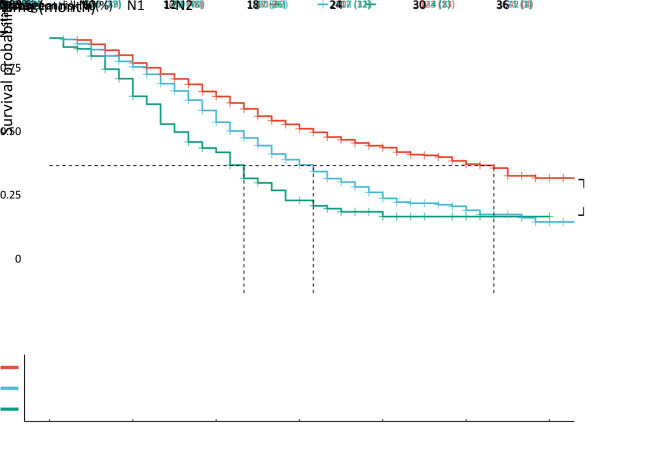
A total of 717 (42.8%) patients had node-positive disease, with 575 (34.3%) and 142 (8.5%) patients classified as N1 and N2, respectively. The N classification in the 8th TNM staging system was discriminative for the entire cohort (Figure 4, P<0.001), with a median CSS of 32 months for N0 tumors, 19 months for N1 tumors, and 13 months for N2 tumors.
Figure 4.
Prognostic values of N staging for CSS in patients who underwent curative resection with N stage PDAC defined by the AJCC 8th TNM staging system (P<0.001). CSS, cancer-specific survival; PDAC, pancreatic ductal adenocarcinoma; AJCC, American Joint Committee on Cancer.
Prognostic indicators for resected PDAC patients
Cox regressional univariate analysis showed that older age (>65 years, HR=1.22; 95% CI: 1.05−1.40, P=0.007), higher preoperative TBIL (>128.29 μmol/L, HR=1.50; 95% CI: 1.29−1.76, P<0.001), higher preoperative serum CA19-9 (>500 U/mL, HR=1.64; 95% CI: 1.41−1.91, P<0.001), higher preoperative serum CEA (>2.98 ng/mL, HR=1.45; 95% CI: 1.25−1.67, P<0.001), pancreatic head cancers (HR=1.23; 95% CI: 1.05−1.43, P=0.009), advanced differentiation (HR=1.67; 95% CI: 1.47−1.90, P<0.001), T stage (HR=1.22; 95% CI: 1.13−1.31, P<0.001), N stage (HR=1.53; 95% CI: 1.38−1.69, P<0.001), and R1 resection margin (HR=1.67; 95% CI: 1.36−2.03, P<0.001) were associated with worse survival, while larger BMI (>19 kg/m2, HR=1.33; 95% CI: 1.10−1.62, P=0.004) and adjuvant therapy (HR=1.34; 95% CI: 1.16−1.55, P<0.001) were considered protective factors. Multivariate analysis showed that significant predictors of mortality were higher preoperative serum TBIL (>128.29 μmol/L, HR=1.32, 95% CI: 1.11−1.56; P=0.002), higher preoperative serum CA19-9 (>500 U/mL, HR=1.40, 95% CI: 1.20−1.64; P<0.001), higher preoperative serum CEA (>2.98 ng/mL, HR=1.18, 95% CI: 1.01−1.37; P=0.032), advanced differentiation (HR=1.64, 95% CI: 1.44−1.86; P<0.001), T stage (HR=1.16, 95% CI: 1.07−1.26; P<0.001), N stage (HR=1.40, 95% CI: 1.26−1.56; P<0.001), and R1 resection margin (HR=1.69, 95% CI: 1.38−2.09; P<0.001), while adjuvant therapy (HR=0.64, 95% CI: 0.56−0.75; P<0.001) was a factor associated with improved prognosis. Notably, preoperative serum CA19-9 was the strongest prognostic indicator among all preoperative factors, with an HR of 1.40 (Table 3).
Table 3. Cox regressional univariate and multivariate analysis of CSS in resected PDAC patients.
| Variables | No. of patients (N=1,676) [n (%)] | Univariate analysis | Multivariate analysis | |||
| P | P | HR | 95% CI | |||
| CSS, cancer specific survival; PDAC, pancreatic ductal adenocarcinoma; BMI, body mass index; TBIL, total bilirubin; CA19-9, carbohydrate antigen 19-9; CEA, carcinoembryonic antigen; LN, lymph node; HR, hazard ratio; 95% CI, 95% confidence interval. | ||||||
| Age (year) | 0.007 | 0.102 | 1.13 | 0.98−1.30 | ||
| ≤65 | 1,060 (63.2) | |||||
| >65 | 616 (36.8) | |||||
| BMI (kg/m2) | 0.004 | 0.054 | 0.83 | 0.68−1.00 | ||
| ≤19 | 221 (13.2) | |||||
| >19 | 1,455 (86.8) | |||||
| TBIL (μmol/L) | <0.001 | 0.002 | 1.32 | 1.11−1.56 | ||
| ≤128.29 | 1,300 (77.6) | |||||
| >128.29 | 376 (22.4) | |||||
| CA19-9 (U/mL) | <0.001 | <0.001 | 1.40 | 1.20−1.64 | ||
| ≤500 | 1,244 (74.2) | |||||
| >500 | 432 (25.8) | |||||
| CEA (ng/mL) | <0.001 | 0.032 | 1.18 | 1.01−1.37 | ||
| ≤2.98 | 747 (44.6) | |||||
| >2.98 | 929 (55.4) | |||||
| Site of tumor | 0.009 | 0.169 | 1.13 | 0.95−1.34 | ||
| Body/tail of pancreas | 535 (31.9) | |||||
| Head of pancreas | 1,141 (68.1) | |||||
| Differentiation | <0.001 | <0.001 | 1.64 | 1.44−1.86 | ||
| Well | 74 (4.4) | |||||
| Moderate | 792 (47.3) | |||||
| Poor | 807 (48.2) | |||||
| Undifferentiated | 3 (0.2) | |||||
| T stage | <0.001 | <0.001 | 1.16 | 1.07−1.26 | ||
| T1 | 317 (18.9) | |||||
| T2 | 861 (51.4) | |||||
| T3 | 300 (17.9) | |||||
| T4 | 198 (11.8) | |||||
| N stage | <0.001 | <0.001 | 1.40 | 1.26−1.56 | ||
| N0 | 959 (57.2) | |||||
| N1 | 575 (34.3) | |||||
| N2 | 142 (8.5) | |||||
| Margin | <0.001 | <0.001 | 1.69 | 1.38−2.09 | ||
| R0 | 1,502 (89.6) | |||||
| R1 | 174 (10.4) | |||||
| Adjuvant therapy | <0.001 | <0.001 | 0.64 | 0.56−0.75 | ||
| No | 945 (56.4) | |||||
| Yes | 731 (43.6) | |||||
Modification of the 8th AJCC staging system based on preoperative CA19-9
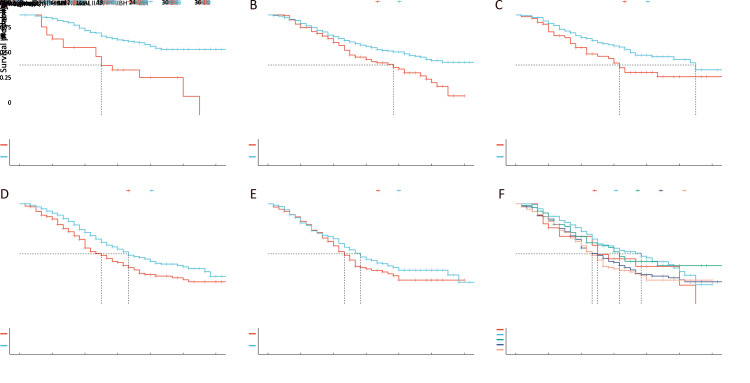
Because the preoperative serum CA19-9 value was a strong predictor for CSS in PDAC, we identified 500 U/mL as the cutoff point for the preoperative level of CA19-9. In the entire cohort, 1,244 patients had preoperative CA19-9 ≤500 U/mL, while 432 patients had preoperative CA19-9 >500 U/mL. With this cutoff point, each TNM stage was divided into two subgroups: “H” for CA19-9 >500 U/mL and “L” for CA19-9 ≤500 U/mL, and 10 subgroups were obtained as follows: IAH, IAL, IBH, IBL, IIAH, IIAL, IIBH, IIBL, IIIH and IIIL. A significant difference in survival was found between the two subgroups within each TNM stage, except for that between IIIH and IIIL ( Figure 5A−E). However, CSS was not significantly different between all “H” subgroups (Figure 5F, P=0.063).
Figure 5.
Survival difference stratified by CA19-9 level. (A−E) Survival was significantly different between the “H” and “L” subgroups within each TNM stage, except for that between IIIH and IIIL; (F) Survival was not significantly different between all the “H” subgroups.
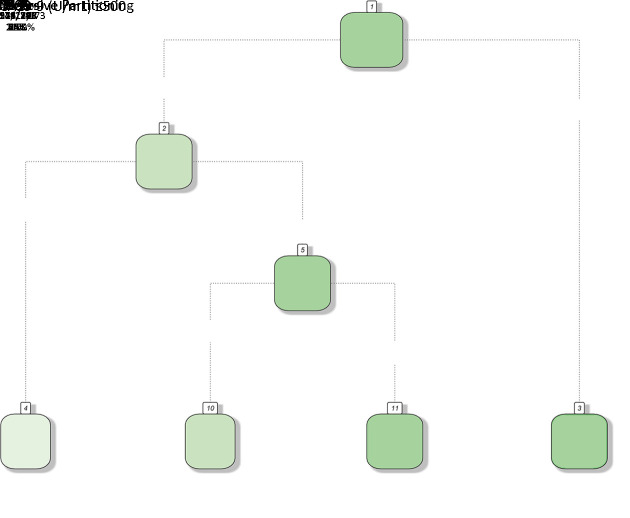
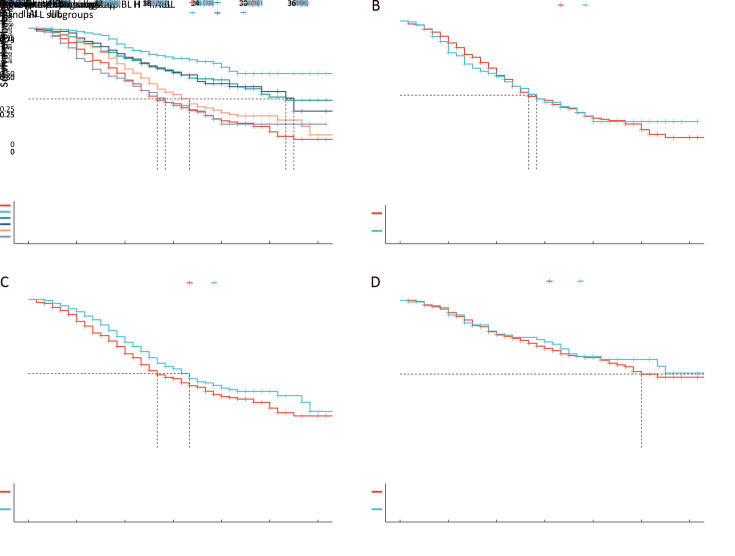
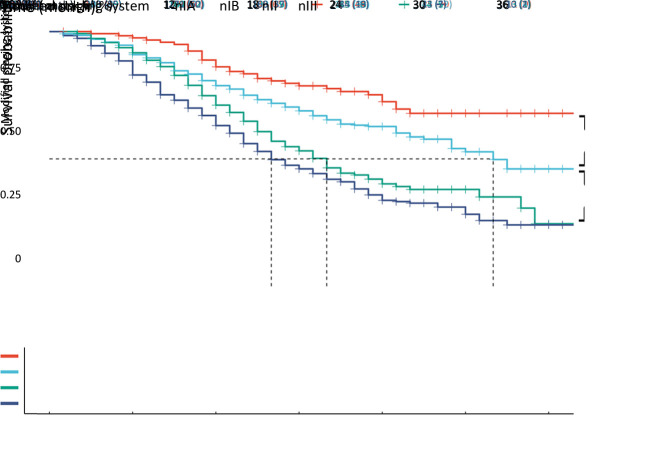
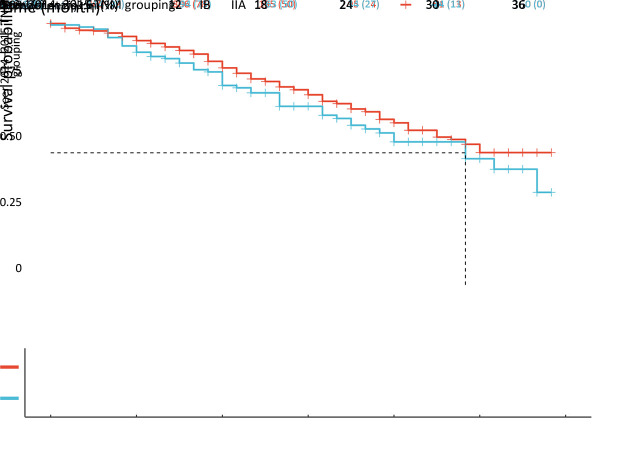
Next, the entire cohort was randomly divided into training and validation sets at a 2:1 ratio. The baseline characteristics of the two cohorts are shown in Supplementary Table S1. RPA of the training set showed that all “H” subgroups could be assembled into one stage (Supplementary FigureS1), which was named the H group, and the survival curve of the H group was similar to that of subgroup IIIL, with P=0.980 in the training set (Figure6A,B). However, the survival difference between H stage and subgroup IIBL was statistically significant (P=0.035, Figure6C), and no significant difference was found between IBL and IIAL (Figure6D). Therefore, we named IAL “nIA”, combined IBL and IIAL into one stage named “nIB”, renamed IIBL “nII”, and then merged the H stage with IIIL to form a new stage, “nIII” (Figure7).
Table S1. Baseline demographic and clinicopathological characteristics of training and validation cohort.
| Characteristics | Training (N=1,171) [n (%)] | Validation (N=505) [n (%)] | P |
| BMI, body mass index; IQR, interquartile range; TBIL, total bilirubin; CA19-9, carbohydrate antigen 19-9; CEA, carcinoembryonic antigen; LN, lymph node. | |||
| Gender | 0.644 | ||
| Female | 455 (38.9) | 203 (40.2) | |
| Male | 716 (61.1) | 302 (59.8) | |
| Age (year) [median (IQR)] | 63.00 (56.00, 69.00) | 62.00 (55.00, 67.00) | 0.090 |
| BMI (kg/m2) [median (IQR)] | 22.43 (20.53, 24.22) | 22.34 (20.28, 24.22) | 0.883 |
| TBIL (μmol/L) [median (IQR)] | 19.90 (11.30, 109.30) | 18.10 (10.30, 116.09) | 0.470 |
| CA19-9 (U/mL) (median [IQR]) | 158.40 (38.89, 503.00) | 160.00 (41.00, 563.20) | 0.853 |
| CEA (ng/mL) [median (IQR)] | 3.24 (2.01, 5.65) | 3.30 (1.92, 5.59) | 0.985 |
| Tumor size (cm) [median (IQR)] | 3.00 (2.50, 4.00) | 3.00 (2.50, 4.00) | 0.843 |
| Site of tumor | 0.624 | ||
| Body and tail of pancreas | 369 (31.5) | 166 (32.9) | |
| Head of pancreas | 802 (68.5) | 339 (67.1) | |
| Differentiation | 0.641 | ||
| Well | 53 (4.5) | 21 (4.2) | |
| Moderate | 557 (47.6) | 235 (46.5) | |
| Poor | 558 (47.7) | 249 (49.3) | |
| Undifferentiated | 3 (0.3) | 0 (0) | |
| LNs positive [median (IQR)] | 0 (0, 1.00) | 0 (0, 1.00) | 0.751 |
| LNs examined [median (IQR)] | 10.00 (5.00, 16.00) | 10.00 (5.00, 16.00) | 0.771 |
| TNM | 0.621 | ||
| IA | 140 (12.0) | 70 (13.9) | |
| IB | 329 (28.1) | 148 (29.3) | |
| IIA | 130 (11.1) | 46 (9.1) | |
| IIB | 350 (29.9) | 148 (29.3) | |
| III | 222 (19.0) | 93 (18.4) | |
| T stage | 0.710 | ||
| T1 | 213 (18.2) | 104 (20.6) | |
| T2 | 606 (51.8) | 255 (50.5) | |
| T3 | 213 (18.2) | 87 (17.2) | |
| T4 | 139 (11.9) | 59 (11.7) | |
| N stage | 0.653 | ||
| N0 | 666 (56.9) | 293 (58.0) | |
| N1 | 401 (34.2) | 174 (34.5) | |
| N2 | 104 (8.9) | 38 (7.5) | |
| Margin | 0.035 | ||
| R0 | 1,062 (90.7) | 440 (87.1) | |
| R1 | 109 (9.3) | 65 (12.9) | |
| Adjuvant therapy | 0.810 | ||
| No | 663 (56.6) | 282 (55.8) | |
| Yes | 508 (43.4) | 223 (44.2) | |
Figure S1.
RPA showed that all “H” subgroups could be assembled into one stage. RPA, recursive partitioning analysis; CA19-9, carbohydrate antigen 19-9.
Figure 6.
Modification of the AJCC 8th TNM staging system for PADC. (A,B) After combining all the “H” subgroups into one stage, the survival curve of the new H stage was similar to that of subgroup IIIL, and no significant difference in CSS was found between IBL and IIAL in training set (P=0.980); (C) Survival difference between H stage and subgroup IIBL was statistically significant (P=0.035); (D) No significant difference was found between IBL and IIAL (P=0.760). AJCC, American Joint Committee on Cancer; PDAC, pancreatic ductal adenocarcinoma.
Figure 7.
Difference in survival in training set according to the 8th modified TNM staging system (P<0.001).
Validation of modified staging system
The modified staging system was then validated with the CPE in the validation set against the original 8th TNM staging system. Our new staging system achieved a CPE of 0.590, which was superior to that of the 8th AJCC staging system (CPE, 0.575).
The accuracy of both staging systems was examined in the validation cohort. For the modified staging system, the C-indexes for 1-, 2-, and 3-year CSS were 0.576 (95% CI: 0.520−0.632), 0.615 (95% CI: 0.555−0.674) and 0.815 (95% CI: 0.722−0.909), respectively. For the AJCC 8th staging system, these values were 0.554 (95% CI: 0.497−0.611), 0.601 (95% CI: 0.541−0.660) and 0.742 (95% CI: 0.622−0.862), respectively (Table 4, Supplementary Figure S2). Then, the difference in the C-index between the two staging systems at 1, 2, and 3 years was examined separately. Our modified system exhibited a higher C-index at all time points, and statistical significance was found at 3 years of CSS in the validation cohort.
Table 4. Comparison of C-index between our modified staging system and the AJCC 8th TNM staging system at 1-, 2-, 3-year in validation cohort.
| CSS | Modified | the AJCC 8th | P | |||
| C-index | 95% CI | C-index | 95% CI | |||
| AJCC, American Joint Committee on Cancer; CSS, cancer specific survival; 95% CI, 95% confidence interval. | ||||||
| 1-year | 0.576 | 0.520−0.632 | 0.554 | 0.497−0.611 | 0.698 | |
| 2-year | 0.615 | 0.555−0.674 | 0.601 | 0.541−0.660 | 0.886 | |
| 3-year | 0.815 | 0.722−0.909 | 0.742 | 0.622−0.862 | 0.005 | |
Figure S2.
ROC curves for our modified staging system and the AJCC 8th TNM staging system at 1, 2, and 3 years. ROC, receiver operator characteristic; AJCC, American Joint Committee on Cancer.
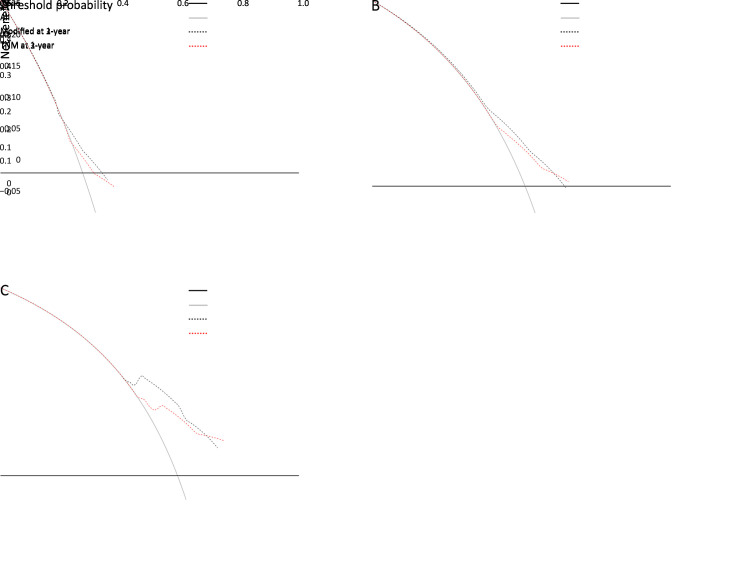
DCA was also performed. Although the two systems exhibited comparable predictive power for predicting 1- and 2-year CSS, the modified staging scheme had slightly better accuracy than the original TNM system, and it yielded preferable net benefit along with a wider range of threshold probability for predicting 3-year survival compared to the AJCC 8th TNM staging system in the validation cohorts (Figure 8). A higher threshold probability represented superior estimations of decision outcomes. These results coincide with our C-index validation.
Figure 8.
DCA showed that our modified staging scheme had better accuracy for predicting 1-year survival (A), 2-year survival (B), and 3-year survival (C), and it yielded preferable net benefit along with a wider range of threshold probability for predicting 3-year survival compared to the AJCC 8th TNM staging system in validation cohorts. DCA, decision curve analysis; AJCC, American Joint Committee on Cancer.
Discussion
Cancer staging is very important to predict patient prognosis and guide clinical treatment approaches. The 8th TNM staging system for PDAC published by the AJCC in 2016 has shown improved prognostic performance against the 7th edition (5-9,14). The pancreas is a thin belt-like organ without a capsule, and PDAC often extends to the surface of the pancreas, leading to various definitions of conventional T3 (extended to peripancreatic tissues) (15). The revised T system discarded the ambiguous description of T3 and was based mainly on tumor size, bringing better reproducibility for the 8th TNM staging system. Regarding the discriminatory power of the T category, many studies have found better prognostic value of the new T stage under the N0 setting (7,9). However, in the present study, significant differences in prognosis were found between each T stage, except for that between T2 and T3, resulting in insignificant discriminatory power between stage IB and IIA. This problem can also be observed in our validation using the 2014−2015 SEER dataset (Supplementary Figure S3) as well as in two international multicenter validation studies (5,6).
Figure S3.
No significant difference in CSS between IB and IIA using the 2014−2015 SEER dataset (P=0.190). CSS, cancer-specific survival.
LN metastasis is negatively correlated with the survival of pancreatic cancer patients (16,17). LN-positive disease was defined as N1 in the 7th edition and was further divided into N1 (1−3 positive LNs) and N2 (≥4 positive LNs) in the 8th edition. This new feature helps stratify the survival of patients based on how far the disease has spread. The same N classification method is used for other cancers with different cutoff points (3,18). Shin et al. validated the 8th TNM staging system using data from Korean patients and found an insignificant difference in the median OS between pN1 and pN2 (18.1 months vs. 16.9 months; P=0.10) (8). However, in this study, we found good discriminatory power between N stages, consistent with most validation studies (5-7,9,12,14). The different prognostic performance between the T and N staging systems suggests that LN metastasis could better stratify patient outcome than tumor size, and it is necessary to add other factors into the T system or reevaluate “extrapancreatic extension”.
To date, several modifications for the 8th AJCC staging system for PDAC have been proposed. Chen et al. developed a refined staging system using SEER data for resectable PDAC patients, which incorporated postoperative tumor grade (19). Shi et al. maintained the T, N, and M definitions of the current 8th staging scheme but regrouped the substages into a new staging system (10). However, these modifications were not designed specifically for resected patients or were complex and thus have not been widely accepted among patients and clinicians. To our knowledge, no modification of the AJCC 8th staging system for PDAC has been proposed to incorporate preoperative biochemical variables.
Preoperative serum CA19-9 is a well-known biomarker for PDAC and has been widely used in the diagnosis and prognosis of PDAC (20,21). Many studies have identified serum CA19-9 as a strong predictor for the recurrence of PDAC. A recent analysis of 46 patients who underwent pancreaticoduodenectomy for PDAC in the pancreatic head showed that a high CA19-9 value (≥230 U/mL) was correlated with worse OS, advanced pathological grade, early recurrence, and larger tumor size (22). Liu et al. analyzed 284 resected and 425 locally advanced pancreatic cancer patients and found that preoperative CA19-9 ≥1,000 U/mL was associated with worse OS in resected patients (23). In addition, an early decrease in CA19-9 level after chemotherapy was reported as a favorable factor for improved survival in advanced disease (24). However, different cutoff values were correlated with survival and recurrence in PDAC, ranging from 37 U/mL to 1,000 U/mL (25-27).
In this study, we identified 500 U/mL as the cutoff point for preoperative CA19-9 levels in patients with resected PDAC. Furthermore, univariate and multivariate analyses demonstrated that CA19-9 was the strongest prognostic indicator among all enlisted preoperative factors, and prognostic heterogeneity was monitored within each 8th AJCC stage stratified by this cutoff point, except for stage III. Based on RPA, the Kaplan-Meier method and the log-rank test, we proposed a new staging system and showed better accuracy for predicting the 3-year survival of this system than that of the 8th AJCC staging system in the validation set. Furthermore, to rule out confounders such as hyperbilirubinemia and Lewis antigen negativity, we eliminated patients with serum CA19-9 <5 U/mL ( 28) and serum total bilirubin levels >2.0 mg/dL ( 29) and obtained the same results. These results indicated that the modified staging system outperformed the 8th AJCC staging scheme in discriminatory power.
In this study, 206 patients had high preoperative CA19-9 and LN-negative disease, including 25 patients in the IAH subgroup, 125 patients in the IBH subgroup, and 56 patients in the IIAH subgroup, and patients in the IAH subgroup had the worst prognosis (15 months for IAH, 23 months for IBH, 19 months for IIAH). These results suggest that patients in stage IA with a high preoperative CA19-9 value may not benefit from surgical resection, and neoadjuvant chemotherapy or chemoradiotherapy may be suitable for these patients.
The present study has several limitations. First, data quality is the major concern of retrospective studies. Our study was based on the CPDC database, a nationwide multicenter database, which may cause heterogeneity in data collection and analysis. Second, the short follow-up time and missing data may incur bias or impair the reliability and reproducibility of our conclusion. Last, further prospective studies are needed to verify our modified the AJCC 8th staging system.
Conclusions
This study demonstrated that the 8th AJCC staging system for PDAC is suitable for a Chinese cohort of resected patients. Furthermore, the N category had a better prognostic value than the T category in curatively resected patients. No difference in CSS between stage IB and IIA indicated that it is plausible to combine the two groups into a single group as tumors over 2 cm without LN metastasis. CA19-9 is a robust preoperative prognostic indicator for resected patients, and our modified staging system incorporating the preoperative CA19-9 value had superior accuracy in predicting patient survival and may help in the selection of optimal patients for neoadjuvant therapy.
Footnote
Conflicts of Interest: The authors have no conflicts of interest to declare.
Acknowledgements
This study was supported by grants from the National Natural Science Foundation of China (No. 81672353 and 81871954).
Contributor Information
Xiaodong Tian, Email: tianxiaodong@pkufh.cn.
Yinmo Yang, Email: yangyinmo@263.net.
References
- 1.Kleeff J, Korc M, Apte M, et al Pancreatic cancer. Nat Rev Dis Primers. 2016;2:16022. doi: 10.1038/nrdp.2016.22. [DOI] [PubMed] [Google Scholar]
- 2.Rahib L, Smith BD, Aizenberg R, et al Projecting cancer incidence and deaths to 2030: the unexpected burden of thyroid, liver, and pancreas cancers in the United States. Cancer Res. 2014;74:2913–21. doi: 10.1158/0008-5472.CAN-14-0155. [DOI] [PubMed] [Google Scholar]
- 3.Murakami Y, Uemura K, Sudo T, et al Number of metastatic lymph nodes, but not lymph node ratio, is an independent prognostic factor after resection of pancreatic carcinoma. J Am Coll Surg. 2010;211:196–204. doi: 10.1016/j.jamcollsurg.2010.03.037. [DOI] [PubMed] [Google Scholar]
- 4.Malleo G, Maggino L, Capelli P, et al Reappraisal of nodal staging and study of lymph node station involvement in pancreaticoduodenectomy with the Standard International Study Group of pancreatic surgery definition of lymphadenectomy for cancer. J Am Coll Surg. 2015;221:367–79. doi: 10.1016/j.jamcollsurg.2015.02.019. [DOI] [PubMed] [Google Scholar]
- 5.Kwon W, He J, Higuchi R, et al Multinational validation of the American Joint Committee on Cancer 8th edition pancreatic cancer staging system in a pancreas head cancer cohort. J Hepatobiliary Pancreat Sci. 2018;25:418–27. doi: 10.1002/jhbp.577. [DOI] [PubMed] [Google Scholar]
- 6.van Roessel S, Kasumova GG, Verheij J, et al International validation of the Eighth Edition of the American Joint Committee on Cancer (AJCC) TNM staging system in patients with resected pancreatic cancer. JAMA Surg. 2018;153:e183617. doi: 10.1001/jamasurg.2018.3617. [DOI] [PMC free article] [PubMed] [Google Scholar]
- 7.Kamarajah SK, Burns WR, Frankel TL, et al Validation of the American Joint Commission on Cancer (AJCC) 8th edition staging system for patients with pancreatic adenocarcinoma: A Surveillance, Epidemiology and End Results (SEER) analysis. Ann Surg Oncol. 2017;24:2023–30. doi: 10.1245/s10434-017-5810-x. [DOI] [PubMed] [Google Scholar]
- 8.Shin DW, Lee JC, Kim J, et al Validation of the American Joint Committee on Cancer 8th edition staging system for the pancreatic ductal adenocarcinoma. Eur J Surg Oncol. 2019;45:2159–65. doi: 10.1016/j.ejso.2019.06.002. [DOI] [PubMed] [Google Scholar]
- 9.Allen PJ, Kuk D, Castillo CF, et al Multi-institutional validation study of the American Joint Commission on Cancer (8th Edition) changes for T and N staging in patients with pancreatic adenocarcinoma. Ann Surg. 2017;265:185–91. doi: 10.1097/SLA.0000000000001763. [DOI] [PMC free article] [PubMed] [Google Scholar]
- 10.Shi S, Hua J, Liang C, et al Proposed modification of the 8th edition of the AJCC staging system for pancreatic ductal adenocarcinoma. Ann Surg. 2019;269:944–50. doi: 10.1097/SLA.0000000000002668. [DOI] [PubMed] [Google Scholar]
- 11.Pu N, Li J, Xu Y, et al Comparison of prognostic prediction between nomogram based on lymph node ratio and AJCC 8th staging system for patients with resected pancreatic head carcinoma: a SEER analysis. Cancer Manag Res. 2018;10:227–38. doi: 10.2147/CMAR.S157940. [DOI] [PMC free article] [PubMed] [Google Scholar]
- 12.Asano D, Nara S, Kishi Y, et al A single-institution validation study of lymph node staging by the AJCC 8th edition for patients with pancreatic head cancer: A proposal to subdivide the N2 category. Ann Surg Oncol. 2019;26:2112–20. doi: 10.1245/s10434-019-07390-z. [DOI] [PubMed] [Google Scholar]
- 13.Li HJ, Chen YT, Yuan SQ Proposal of a modified American Joint Committee on Cancer staging scheme for resectable pancreatic ductal adenocarcinoma with a lymph node ratio-based N classification: A retrospective cohort study. Medicine (Baltimore) 2018;97:e12094. doi: 10.1097/MD.0000000000012094. [DOI] [PMC free article] [PubMed] [Google Scholar]
- 14.Song M, Yoon SB, Lee IS, et al Evaluation of the prognostic value of the new AJCC 8th edition staging system for patients with pancreatic adenocarcinoma; a need to subclassify stage III? Eur J Cancer. 2018;104:62–9. doi: 10.1016/j.ejca.2018.08.027. [DOI] [PubMed] [Google Scholar]
- 15.Adsay NV, Bagci P, Tajiri T, et al Pathologic staging of pancreatic, ampullary, biliary, and gallbladder cancers: pitfalls and practical limitations of the current AJCC/UICC TNM staging system and opportunities for improvement. Semin Diagn Pathol. 2012;29:127–41. doi: 10.1053/j.semdp.2012.08.010. [DOI] [PubMed] [Google Scholar]
- 16.Konstantinidis IT, Deshpande V, Zheng H, et al Does the mechanism of lymph node invasion affect survival in patients with pancreatic ductal adenocarcinoma? J Gastrointest Surg. 2010;14:261–7. doi: 10.1007/s11605-009-1096-z. [DOI] [PMC free article] [PubMed] [Google Scholar]
- 17.Kawai M, Tani M, Kobayashi Y, et al The ratio between metastatic and examined lymph nodes is an independent prognostic factor for patients with resectable middle and distal bile duct carcinoma. Am J Surg. 2010;199:447–52. doi: 10.1016/j.amjsurg.2009.01.019. [DOI] [PubMed] [Google Scholar]
- 18.Riediger H, Keck T, Wellner U, et al The lymph node ratio is the strongest prognostic factor after resection of pancreatic cancer. J Gastrointest Surg. 2009;13:1337–44. doi: 10.1007/s11605-009-0919-2. [DOI] [PubMed] [Google Scholar]
- 19.Chen YT, Huang ZP, Zhou ZW, et al Equipping the American Joint Committee on Cancer staging for resectable pancreatic ductal adenocarcinoma with tumor grade: a recursive partitioning analysis. Med Oncol. 2016;33:122. doi: 10.1007/s12032-016-0839-4. [DOI] [PMC free article] [PubMed] [Google Scholar]
- 20.The NCCN Clinical Practice Guidelines in Oncology (NCCN GuidelinesTM). Available online: https://www.nccn.org/
- 21.Dell’Aquila E, Fulgenzi CAM, Minelli A, et al Prognostic and predictive factors in pancreatic cancer. Oncotarget. 2020;11:924–41. doi: 10.18632/oncotarget.27518. [DOI] [PMC free article] [PubMed] [Google Scholar]
- 22.Asaoka T, Miyamoto A, Maeda S, et al Prognostic impact of preoperative NLR and CA19-9 in pancreatic cancer. Pancreatology. 2016;16:434–40. doi: 10.1016/j.pan.2015.10.006. [DOI] [PubMed] [Google Scholar]
- 23.Liu L, Xu H, Wang W, et al A preoperative serum signature of CEA+/CA125+/CA19-9 ≥1000 U/mL indicates poor outcome to pancreatectomy for pancreatic cancer. Int J Cancer. 2015;136:2216–27. doi: 10.1002/ijc.29242. [DOI] [PubMed] [Google Scholar]
- 24.Aoki S, Motoi F, Murakami Y, et al Decreased serum carbohydrate antigen 19-9 levels after neoadjuvant therapy predict a better prognosis for patients with pancreatic adenocarcinoma: a multicenter case-control study of 240 patients. BMC Cancer. 2019;19:252. doi: 10.1186/s12885-019-5460-4. [DOI] [PMC free article] [PubMed] [Google Scholar]
- 25.Al Abbas AI, Zenati M, Reiser CJ, et al Serum CA19-9 response to neoadjuvant therapy predicts tumor size reduction and survival in pancreatic adenocarcinoma. Ann Surg Oncol. 2020;27:2007–14. doi: 10.1245/s10434-019-08156-3. [DOI] [PMC free article] [PubMed] [Google Scholar]
- 26.Tsai S, George B, Wittmann D, et al Importance of normalization of CA19-9 levels following neoadjuvant therapy in patients with localized pancreatic cancer. Ann Surg. 2020;271:740–7. doi: 10.1097/SLA.0000000000003049. [DOI] [PubMed] [Google Scholar]
- 27.Motoi F, Murakami Y, Okada KI, et al Sustained elevation of postoperative serum level of carbohydrate antigen 19-9 is high-risk stigmata for primary hepatic recurrence in patients with curatively resected pancreatic adenocarcinoma. World J Surg. 2019;43:634–41. doi: 10.1007/s00268-018-4814-4. [DOI] [PubMed] [Google Scholar]
- 28.Humphris JL, Chang DK, Johns AL, et al The prognostic and predictive value of serum CA19.9 in pancreatic cancer. Ann Oncol. 2012;23:1713–22. doi: 10.1093/annonc/mdr561. [DOI] [PMC free article] [PubMed] [Google Scholar]
- 29.Ferrone CR, Finkelstein DM, Thayer SP, et al Perioperative CA19-9 levels can predict stage and survival in patients with resectable pancreatic adenocarcinoma. J Clin Oncol. 2006;24:2897–902. doi: 10.1200/JCO.2005.05.3934. [DOI] [PMC free article] [PubMed] [Google Scholar]


