

Summary
ATP-citrate lyase (ACLY) synthesizes cytosolic acetyl-CoA, a fundamental cellular building block. Accordingly, aberrant ACLY activity is observed in many diseases. Here we report cryo-EM structures of human ACLY alone or bound to substrates or products. ACLY forms a homotetramer with a rigid citrate synthase homology (CSH) module, flanked by four flexible actyl-CoA synthetase homology (ASH) domains; CoA is bound at the CSH-ASH interface in mutually exclusive productive or unproductive conformations. The structure of a catalytic mutant of ACLY in the presence of ATP, citrate and CoA substrates reveals a phospho-citryl-CoA intermediate in the ASH domain. ACLY with acetyl-CoA and oxaloacetate (OAA) products shows the products bound in the ASH domain, with an additional OAA in the CSH domain, which could function in ACLY autoinhibition. These structures, which are supported by biochemical and biophysical data, challenge previous proposals of the ACLY catalytic mechanism and suggest additional therapeutic possibilities for ACLY-associated metabolic disorders.
Introduction
ATP-citrate lyase (ACLY) is the predominant source of nucleocytosolic acetyl-CoA, an essential building block for the production of fatty acids, cholesterol, isoprenoids and protein acetylation 1. Aberrant activity of ACLY is found in many cancers, cardiovascular diseases and metabolic disorders 2, prompting the development of several ACLY inhibitors 3. One such ACLY inhibitor prodrug, bempedoic acid, has been used in combination with statins in phase III clinical trials to reduce LDL cholesterol for patients with atherosclerotic cardiovascular risk 4–6, leading to significant lowering of LDL cholesterol levels without adverse effects 7.
ACLY can be split into its N-terminal acyl-CoA synthetase homology (ASH) superdomain 8 and a C-terminal citrate synthase homology (CSH) domain 9,10 (Fig. 1A). Together these domains use glycolytically-derived citrate with Mg-ATP and Coenzyme-A (CoA) cosubstrates to produce the acetyl-CoA and oxaloacetate (OAA) coproducts. Previous biochemical and X-ray crystallographic studies have revealed that the isolated ASH domain binds citrate and ATP to form a covalent citryl-phosphate adduct 11,12, although this domain is unable to bind CoA for acetyl-CoA production 13. Therefore, it is still unclear how the enzyme complexes with CoA to form a (3S)-citryl-CoA-like transition state, as well as how it is cleaved into acetyl-CoA and OAA 14–20.
Fig. 1.
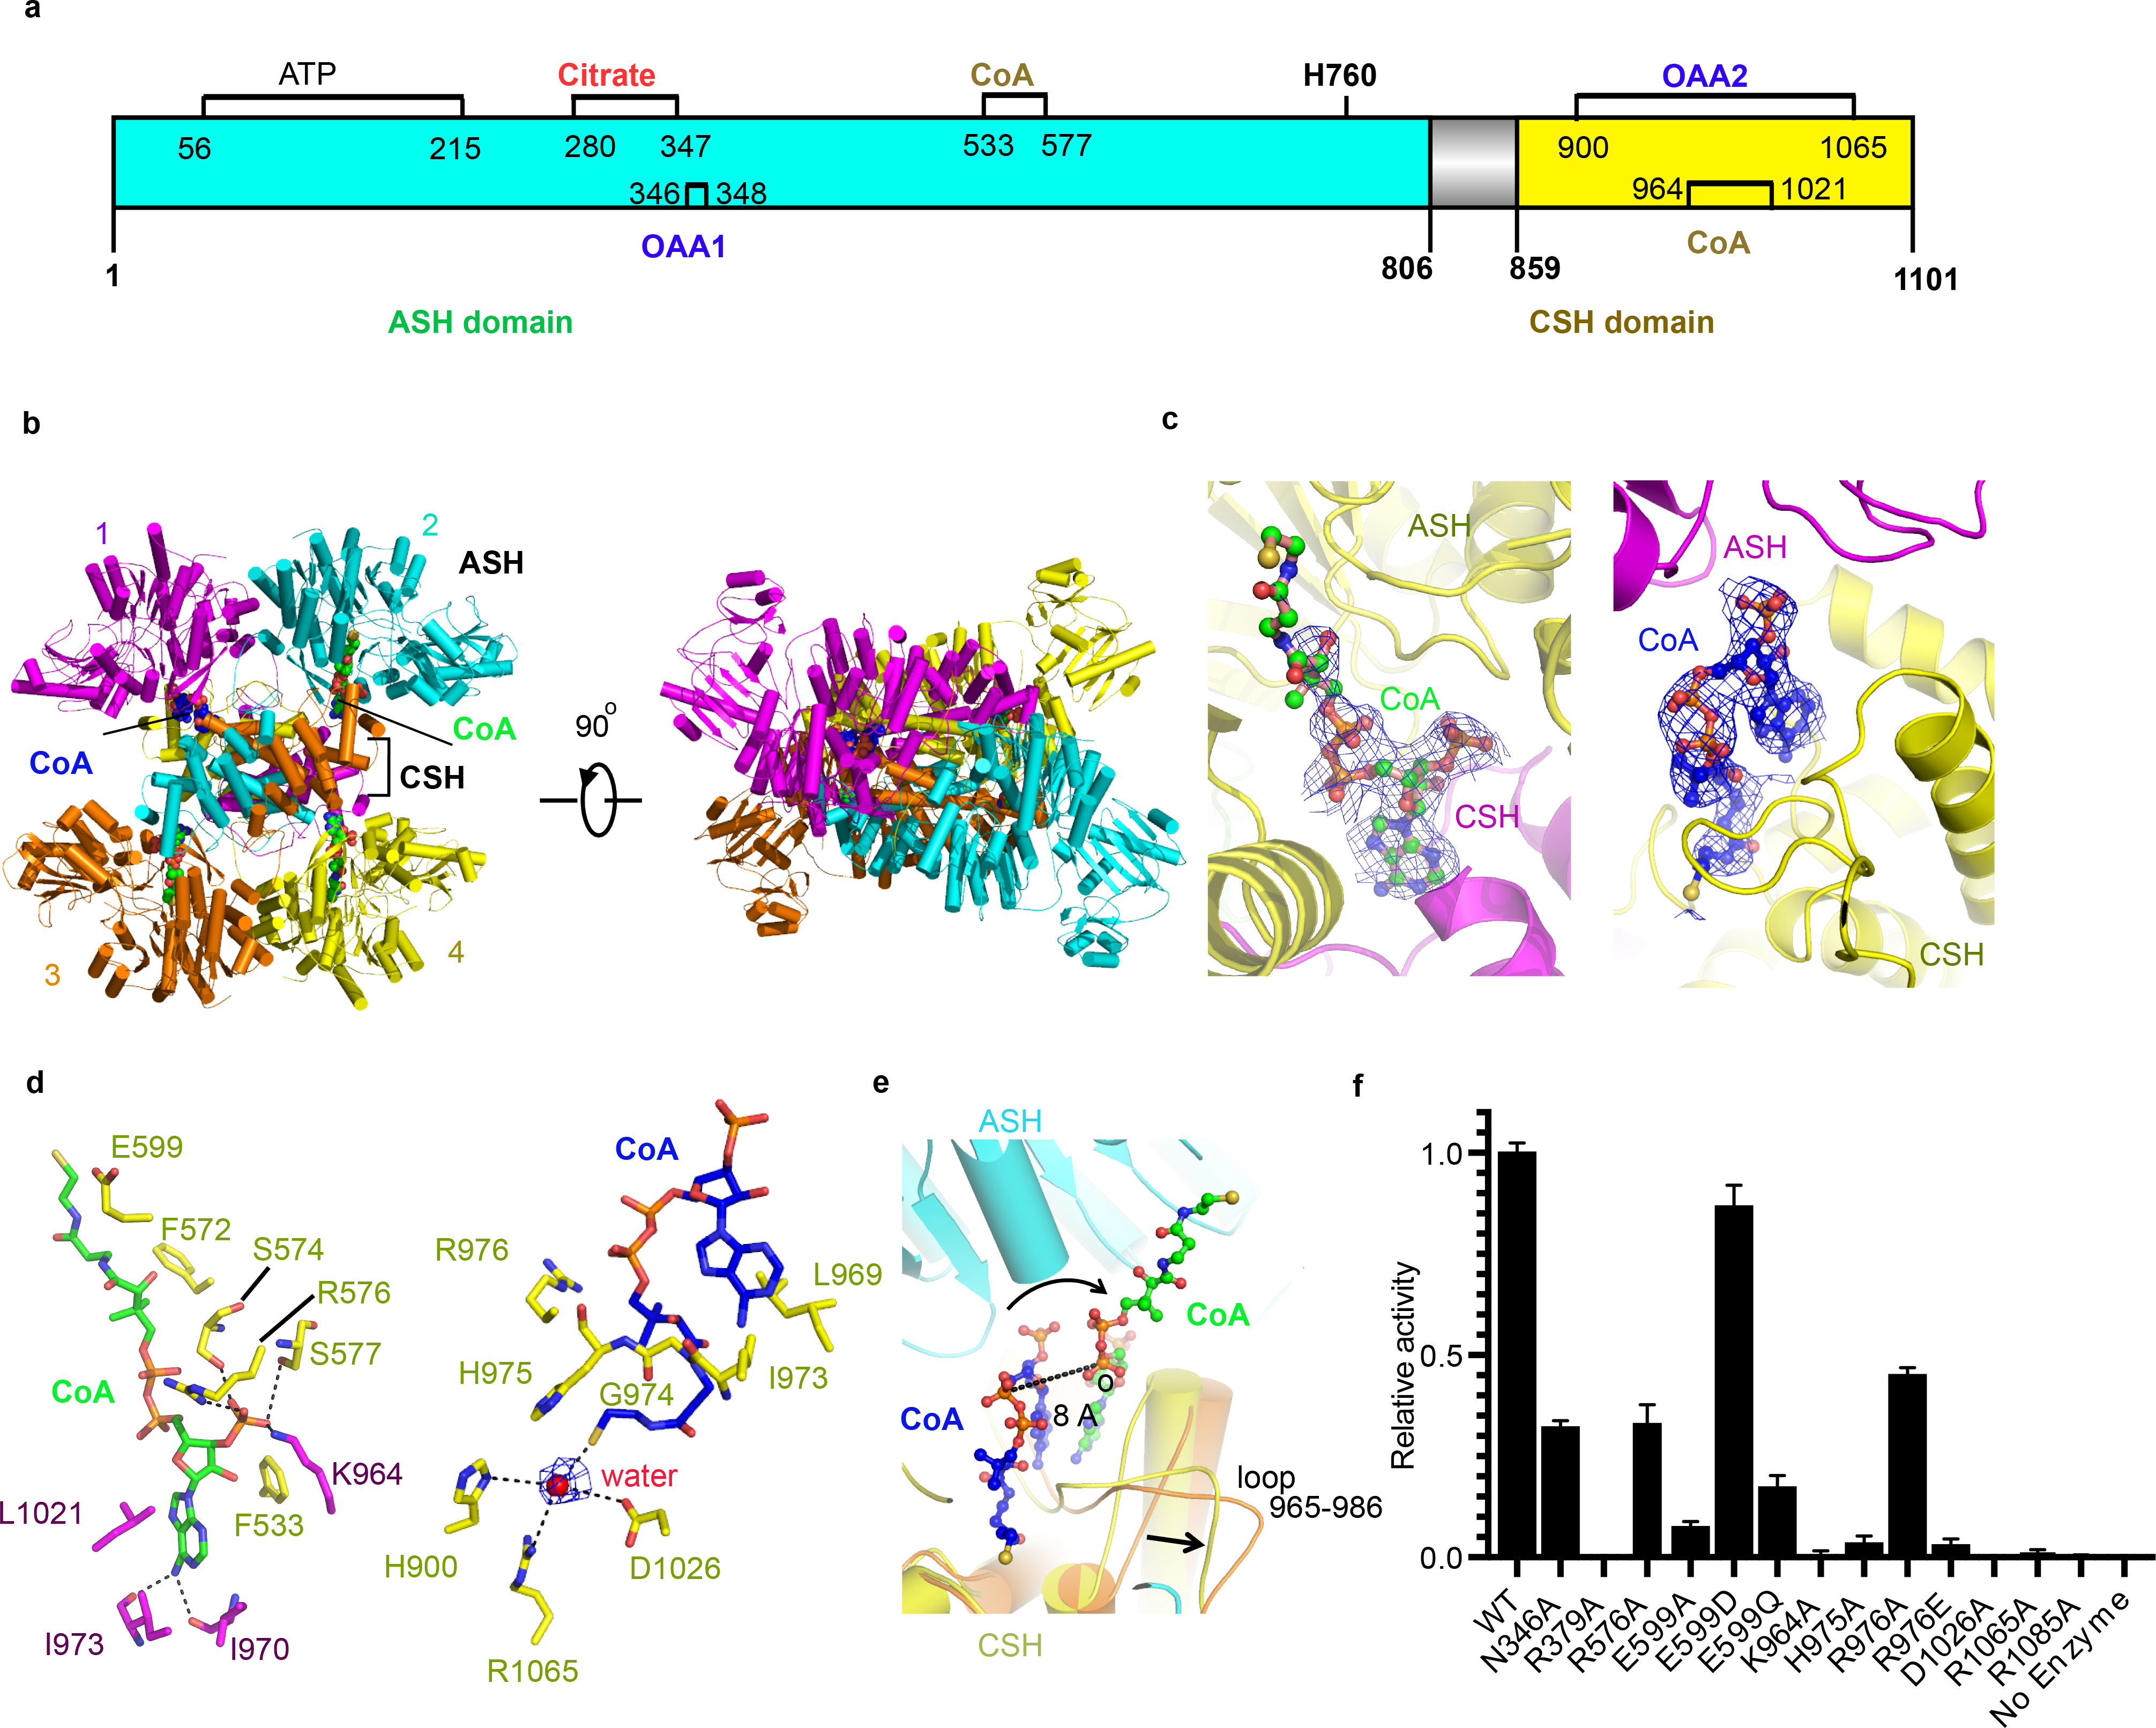
Structure of ACLY in complex with CoA and citrate substrates. (a) Domain organization of ACLY, with metabolite interaction regions highlighted. (b) Two views of the ACLY structure with citrate and CoA modeled from a 3.0 Å cryo-EM map. The four monomers are colored in orange, yellow, magenta and cyan with the ASH and CSH domains indicated. CoA in extended and bent conformation is in green and blue, respectively. (c) Close-up view of CoA bound at the ASH-CSH interface highlighting the corresponding cryo-EM density. CoA with the extended pantetheine arm pointing towards the ASH domain and the bent pantetheine arm pointing towards the CSH module are shown in green (left) and blue (right), respectively. (d) Close-up view of CoA-protein interactions. Residues that mediate van der Waals interactions and make hydrogen bonds are shown with the same color-coding as in panel C. (e) Superimposition of ACLY bound with the extended CoA and bent CoA conformations. (f) Relative enzyme activity of ACLY mutant constructs as measured against WT (Mean +/− Standard Deviation, n=3 technical replicates). Data for 1f is available as source data.
We recently reported biochemical and biophysical studies demonstrating that both the ASH and CSH domains in the context of a full-length ACLY tetramer contribute to CoA binding for acetyl-CoA production 21, and two recent structural characterizations of ACLY have reported the molecular basis for ACLY homotetramer formation 22,23. A crystallographic study captured two different conformations of citrate and CoA, one bound to the ASH domain of ACLY (referenced as the CCSβ-CCSα region in the study) and another bound to the isolated CSH domain of ACLY (referenced as the CCL region in the study). Based on these structures, the authors posit that ACLY initially binds citrate and CoA in the ASH domain. This is followed by a structural rearrangement of the enzyme coupled to a 35 Å movement of the (3S)-citryl-CoA adduct into the CSH module, in order to carry out the lyase reaction to form the acetyl-CoA and OAA products in the CSH domain 22. A cryo-EM study of ACLY bound to the NDI-091143 citrate-competitive inhibitor with the ASH domain (referenced as the N-terminal ACLY domain in the study) proposed a similar mechanism of catalysis 23. In this study, we set out to more systematically evaluate the catalytic mechanism of ACLY, and to provide more direct insights into the potential dynamic behavior of ACLY as a function of bound ligands. We report the cryo-EM structures of ACLY alone, with citrate plus CoA substrates, with acetyl-CoA plus OAA products; and an ACLY catalytic mutant in the presence of ATP, citrate and CoA, allowing us to capture a phospho-citryl-CoA intermediate. We present biochemical and biophysical data to complement our structural findings and to elucidate a complete ACLY reaction mechanism.
Results
Structure of ACLY with CoA reveals productive and unproductive CoA conformations
We produced recombinant, full-length ACLY in Escherichia coli for all of our biochemical and structural analyses (Extended Data Fig. 1a–b). Differential Scanning Fluorimetry of the enzyme with different cofactors confirmed the binding and potential structural changes associated with ligands added alone or in combination (Extended Data Fig 1c). We used these data to guide the structure determination of ACLY with its cosubstrates or coproducts.
We prepared the recombinant protein and initially performed negative stain single particle analysis of the protein in the absence of any metabolites (ACLY-apo). The 2D class averages from 3,000 particles confirmed that the protein formed a tetramer (Supplementary Fig. 2a-b). To gain more structural detail, we performed a cryo-EM study on the ACLY–citrate–CoA complex. After multiple rounds of optimization of the cryo-EM samples, we determined the D2 symmetric cryo-EM structure of the ACLY–citrate–CoA structure to an average overall resolution of 3.0 Å. (Extended Data Fig. 2c–d, Extended Data Fig 3, Extended Data Fig. 4 and Table 1).
Table 1 |.
Cryo-EM data collection, refinement, and validation statistics
| Apo | With citrate–CoA (D2) | With citrate–CoA (C1 asymm closed) | With citrate–CoA (C1 asymm open) | With OAA–acetyl-CoA (D2) | With OAA–acetyl-CoA (C1) | E599Q With ATP–citrate–CoA (D2) | |
|---|---|---|---|---|---|---|---|
| (EMDB-20414, PDB-6POF) | (EMDB-20903, PDB-6UUZ) | (EMDB-20413, PDB-6POE) | (EMDB-20784, PDB-6UIA) | (EMDB-20783, PDB-6UI9) | (EMDB-20904, PDB-6UV5) | (EMDB-20902, PDB-6UUW) | |
| Data collection and processing | |||||||
| Magnification | 28,000 | 45,000 | 45,000 | 45,000 | 45,000 | 45,000 | 45,000 |
| Voltage (kV) | 200 | 200 | 200 | 200 | 200 | 200 | 200 |
| Electron exposure (e–/Å2) | 40 | 37 | 37 | 37 | 37 | 37 | 40 |
| Defocus range (μm) | 1.5–3.5 | 0.9–2.8 | 0.9–2.8 | 0.9–2.8 | 0.9–2.8 | 0.9–2.8 | 1.0–2.0 |
| Pixel size (Å) | 1.485 | 0.87 | 0.87 | 0.87 | 0.87 | 0.87 | 0.87 |
| Symmetry imposed | D2 | D2 | C1 | C1 | D2 | C1 | D2 |
| Initial particle images (no.) | 3,98,391 | 7,16,394 | 7,16,394 | 7,16,394 | 7,19,613 | 7,19,613 | 7,70,837 |
| Final particle images (no.) | 20,677 | 1,29,563 | 1,29,563 | 73,969 | 1,08,738 | 1,08,738 | 2,07,653 |
| Map resolution (Å) | 4.3 | 3.0 | 3.5 | 4.3 | 3.1 | 3.4 | 2.9 |
| FSC threshold | 0.143 | 0.143 | 0.143 | 0.143 | 0.143 | 0.143 | 0.143 |
| Map resolution Range (Å) | 4.1–5.3 | 2.8–4.0 | 2.8–4.4 | 4.0–5.3 | 2.8–4.0 | 2.8–4.4 | 2.7–3.6 |
| Refinement | |||||||
| Initial model used (PDB code) | 3MWD | 3MWD | 3MWD | 3MWD | 3MWD | 3MWD | 5TDF |
| Model resolution (Å) | 4.4 | 3.1 | 3.6 | 4.4 | 3.2 | 3.5 | 2.9 |
| Model resolution Range (Å) | - | - | - | - | - | - | - |
| Map sharpening B factor (Å2) | −138 | −95 | −100 | −122 | −98 | −101 | −80 |
| Model composition | |||||||
| Nonhydrogen atoms | 31,624 | 31,816 | 31,810 | 31,720 | 31,900 | 31,951 | 32,532 |
| Protein residues | 4,084 | 4,084 | 4,084 | 4,084 | 4,084 | 4,084 | 4,136 |
| Ligands | 0 | 4 | 4 | 2 | 12 | 12 | 4 |
| R.m.s. deviations | |||||||
| Bond lengths (Å) | 0.009 | 0.01 | 0.008 | 0.012 | 0.009 | 0.014 | 0.01 |
| Bond angles (°) | 1.234 | 1.114 | 0.946 | 1.673 | 1.102 | 1.202 | 1.155 |
| Validation | |||||||
| MolProbity score | 1.95 | 1.90 | 2.51 | 2.20 | 1.77 | 1.77 | 1.56 |
| Clashscore | 9.80 | 8.06 | 6.34 | 14.17 | 6.03 | 6.26 | 3.11 |
| Poor rotamers (%) | 0.27 | 0.24 | 0.12 | 0.86 | 0.27 | 0.15 | 0.55 |
| Ramachandran plot | |||||||
| Favored (%) | 93.16 | 93.25 | 93.20 | 90.44 | 93.23 | 93.05 | 94.27 |
| Allowed (%) | 6.64 | 6.65 | 6.48 | 9.02 | 6.27 | 6.75 | 5.29 |
| Disallowed (%) | 0.2 | 0.1 | 0.32 | 0.54 | 0.1 | 0.2 | 0.4 |
The ACLY–citrate–CoA structure forms a homotetramer with a central tetrameric CSH module and two ASH domains on opposite ends of the CSH module (protomers 1&2 and 3&4) (Fig. 1a–b). The ASH domain (residues 1–806) adopts a structure very similar to previously reported α/β architecture of the isolated N-terminal domain bound to citrate and ADP 24. The CSH domain (residues 859–1101) is comprised exclusively of helices and short loops, with structural homology to a dimer of citrate synthase dimers that cross at roughly 90° angles (Extended Data Fig. 5a). The ASH and CSH domains of each polypeptide chain are connected by a largely extended ~50 residue coil region except for a short α-helix between residues 824–829. The helical region within this linker is the only point of significant contact (by van der Waals interaction) between the two ASH domains on one side of the molecule. The extended linker allows the CSH of one subunit to interact with the ASH domain of another subunit across the opposite side of the CSH module. In contrast to the relatively sparse interactions between the ASH protomers, the CSH domains form an extensive network of predominantly van der Waals interactions that would suggest that the CSH domains function as a rigid tetrameric module, while the four ASH domain are more flexible. This is consistent with the observed EM local resolution estimation on the EM map being highest at the CSH domain (2.8 Å; Extended Data Fig. 4c) and our previous observations that the CSH domain has a higher melting temperature relative to the ASH of ~75 °C vs ~55 °C, respectively 21.
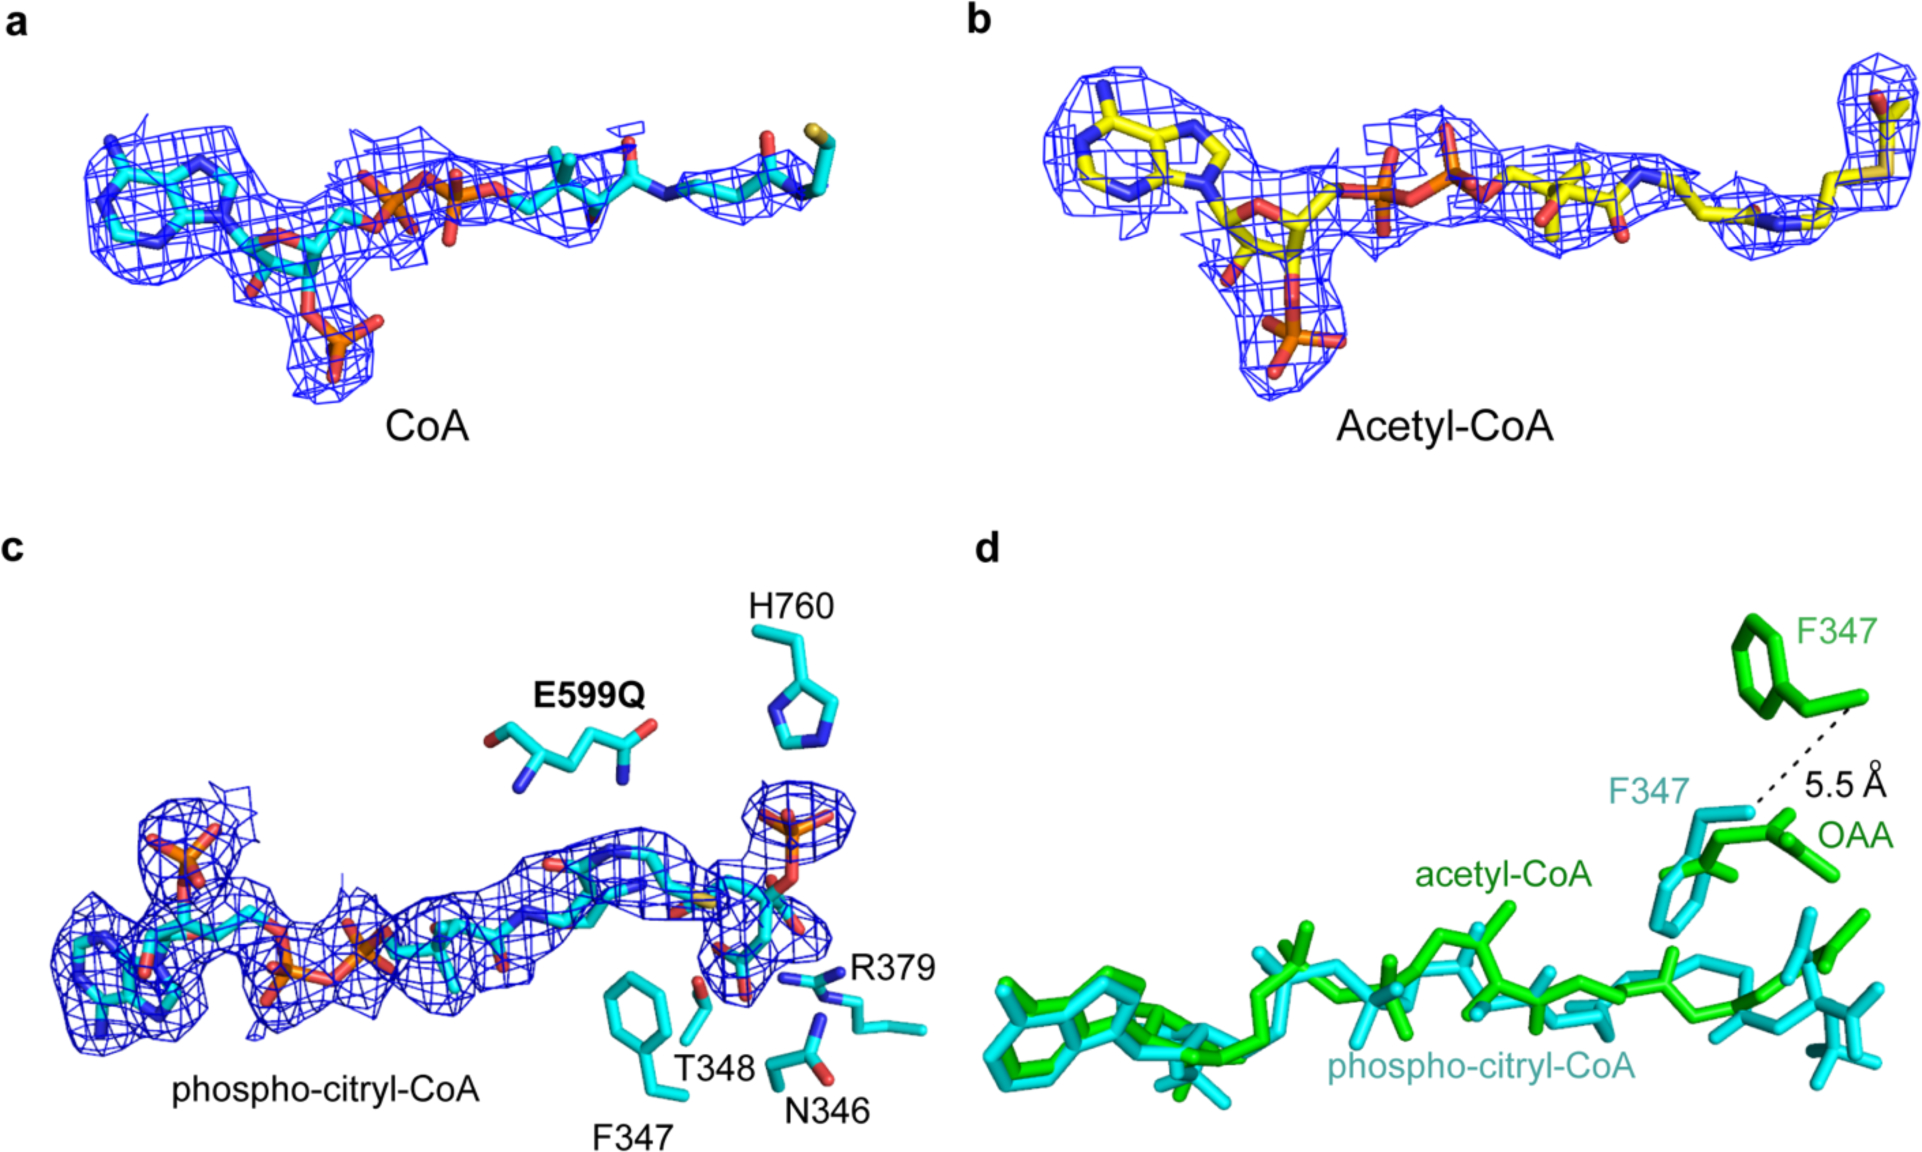
CoA binds at the interface between the CSH and ASH domains of separate subunits and appears to ‘staple’ the superdomains together. The adenine base and ribose ring interact with the CSH domain of one monomer and the pantothenic arm and β-mercapto group sticking into the active site of the ASH domain of another subunit (Fig. 1c-left and d-left). Modeling of the CoA is based on the observation that the phosphorylated ADP group is well resolved in the cryo-EM density. However, the mercapto group was not well resolved, suggesting flexibility of this region. While several residues from CSH and ASH domains make van der Waals interactions with CoA, hydrogen bonds from S574, R576 and S577 from the ASH domain and K964 from the CSH domain to the ribose phosphate oxygens appear to play a particularly important role in stapling CoA at the ASH-CSH interface. Interestingly, E599 is within hydrogen bonding distance to the modeled sulfur atom of CoA implicating that it might play an important catalytic role. The importance of the protein-CoA interactions from the ASH an CSH domain is supported by the mutational sensitivity of residues R576 and K964, and the potential catalytic role of E599 is supported by its mutational sensitivity to A or Q but not to D (Fig. 1f). Although citrate was included in the sample for cryo-EM reconstruction, it could not be confidently resolved in the cryo-EM map.
Given the unresolved density for the mercapto group of CoA, we carried out another reconstruction of the ACLY-citrate-CoA structure without imposing D2 symmetry to determine if CoA might adopt different conformations in different protomers. We were able to prepare a reconstruction without imposing symmetry (C1, asymmetric closed) to a nominal resolution of 3.5 Å. In this ACLY–citrate–CoA C1 asymm closed structure, the resolution around the ASH domain is poorer than the D2 structure but the local resolution around the CSH remains relatively high, from 2.8–3.2 Å. Analysis of this ACLY–citrate–CoA C1 asymm closed structure revealed that each of the ASH domains, and three of the four CSH domains and CoA molecules adopted the same configuration as the D2 structure. However, one of the CoA molecules adopts an alternate conformation in which the phosphorylated ADP moiety is shifted about 8 Å towards the CSH module and the pantothenic arm is bent over to interact with the CSH (Fig. 1b, c-right and e-right). The cryo-EM density corresponding to this alternate CoA conformation is very clear (Fig. 1c-right). Remarkably, cryo-EM density is also observed for a well ordered water molecule, which appears to bridge hydrogen bond interactions between the terminal sulfur atom of CoA with the side chain residues of H900, D1026 and R1065 with additional van der Waals interactions from L969, I973, H975 and R976, (Fig. 1d-right). Concomitant with this alternate CoA conformation a loop within the CSH domain (residues 965–986) and the flanking helices shift to accommodate the alternate position of the CoA adenine base (Fig. 1e). Mutation of H975, R976, D1026 and R1065 to alanine all show comprised activity suggesting that the binding of CoA to the CSH domain is somehow involved in enzyme activity (Fig. 1f). Given that CoA must react with citrate in the ASH domain, we refer to the CoA conformations with the cysteamine of the pantothenic arm that points towards the ASH and CSH as “productive” and “unproductive” CoA conformations, respectively, bound to ACLY.
Structure of ACLY–citrate–CoA subpopulation reveals asymmetric ASH orientations
In addition to the major ACLY–citrate–CoA particle population representing 57% of the class 3 particles, a subpopulation of ACLY–citrate–CoA complex particles representing 23% of subclass of the particles (10% overall) was also captured in a 3D reconstruction without imposing symmetry to a resolution of 4.3 Å (Fig. S3). This subpopulation of particles has an overall structure that is similar to the major ACLY–citrate–CoA population except that one of the four ASH domains is rotated about 50° towards its nearest ASH subunit to adopt a more “open” conformation so we refer to it as “ACLY–citrate–CoA-C1 asymm open”. In this structure, density is only visible for the phosphorylated ADP moiety of two CoA molecules bound to two of the symmetric ASH domains (Fig. 2a and b). One of the symmetric and the asymmetric ASH subunits show no evidence for CoA binding. Notably, the asymmetric ASH domain appears incompatible with productive CoA binding (Fig. 2c). We propose that this ACLY–citrate–CoA-C1 asymm open structure represents an intermediate state of ACLY, where two active sites are primed for catalysis and two are not. The observation of this structure also suggests that the four ACLY active sites may function independently.
Fig. 2.
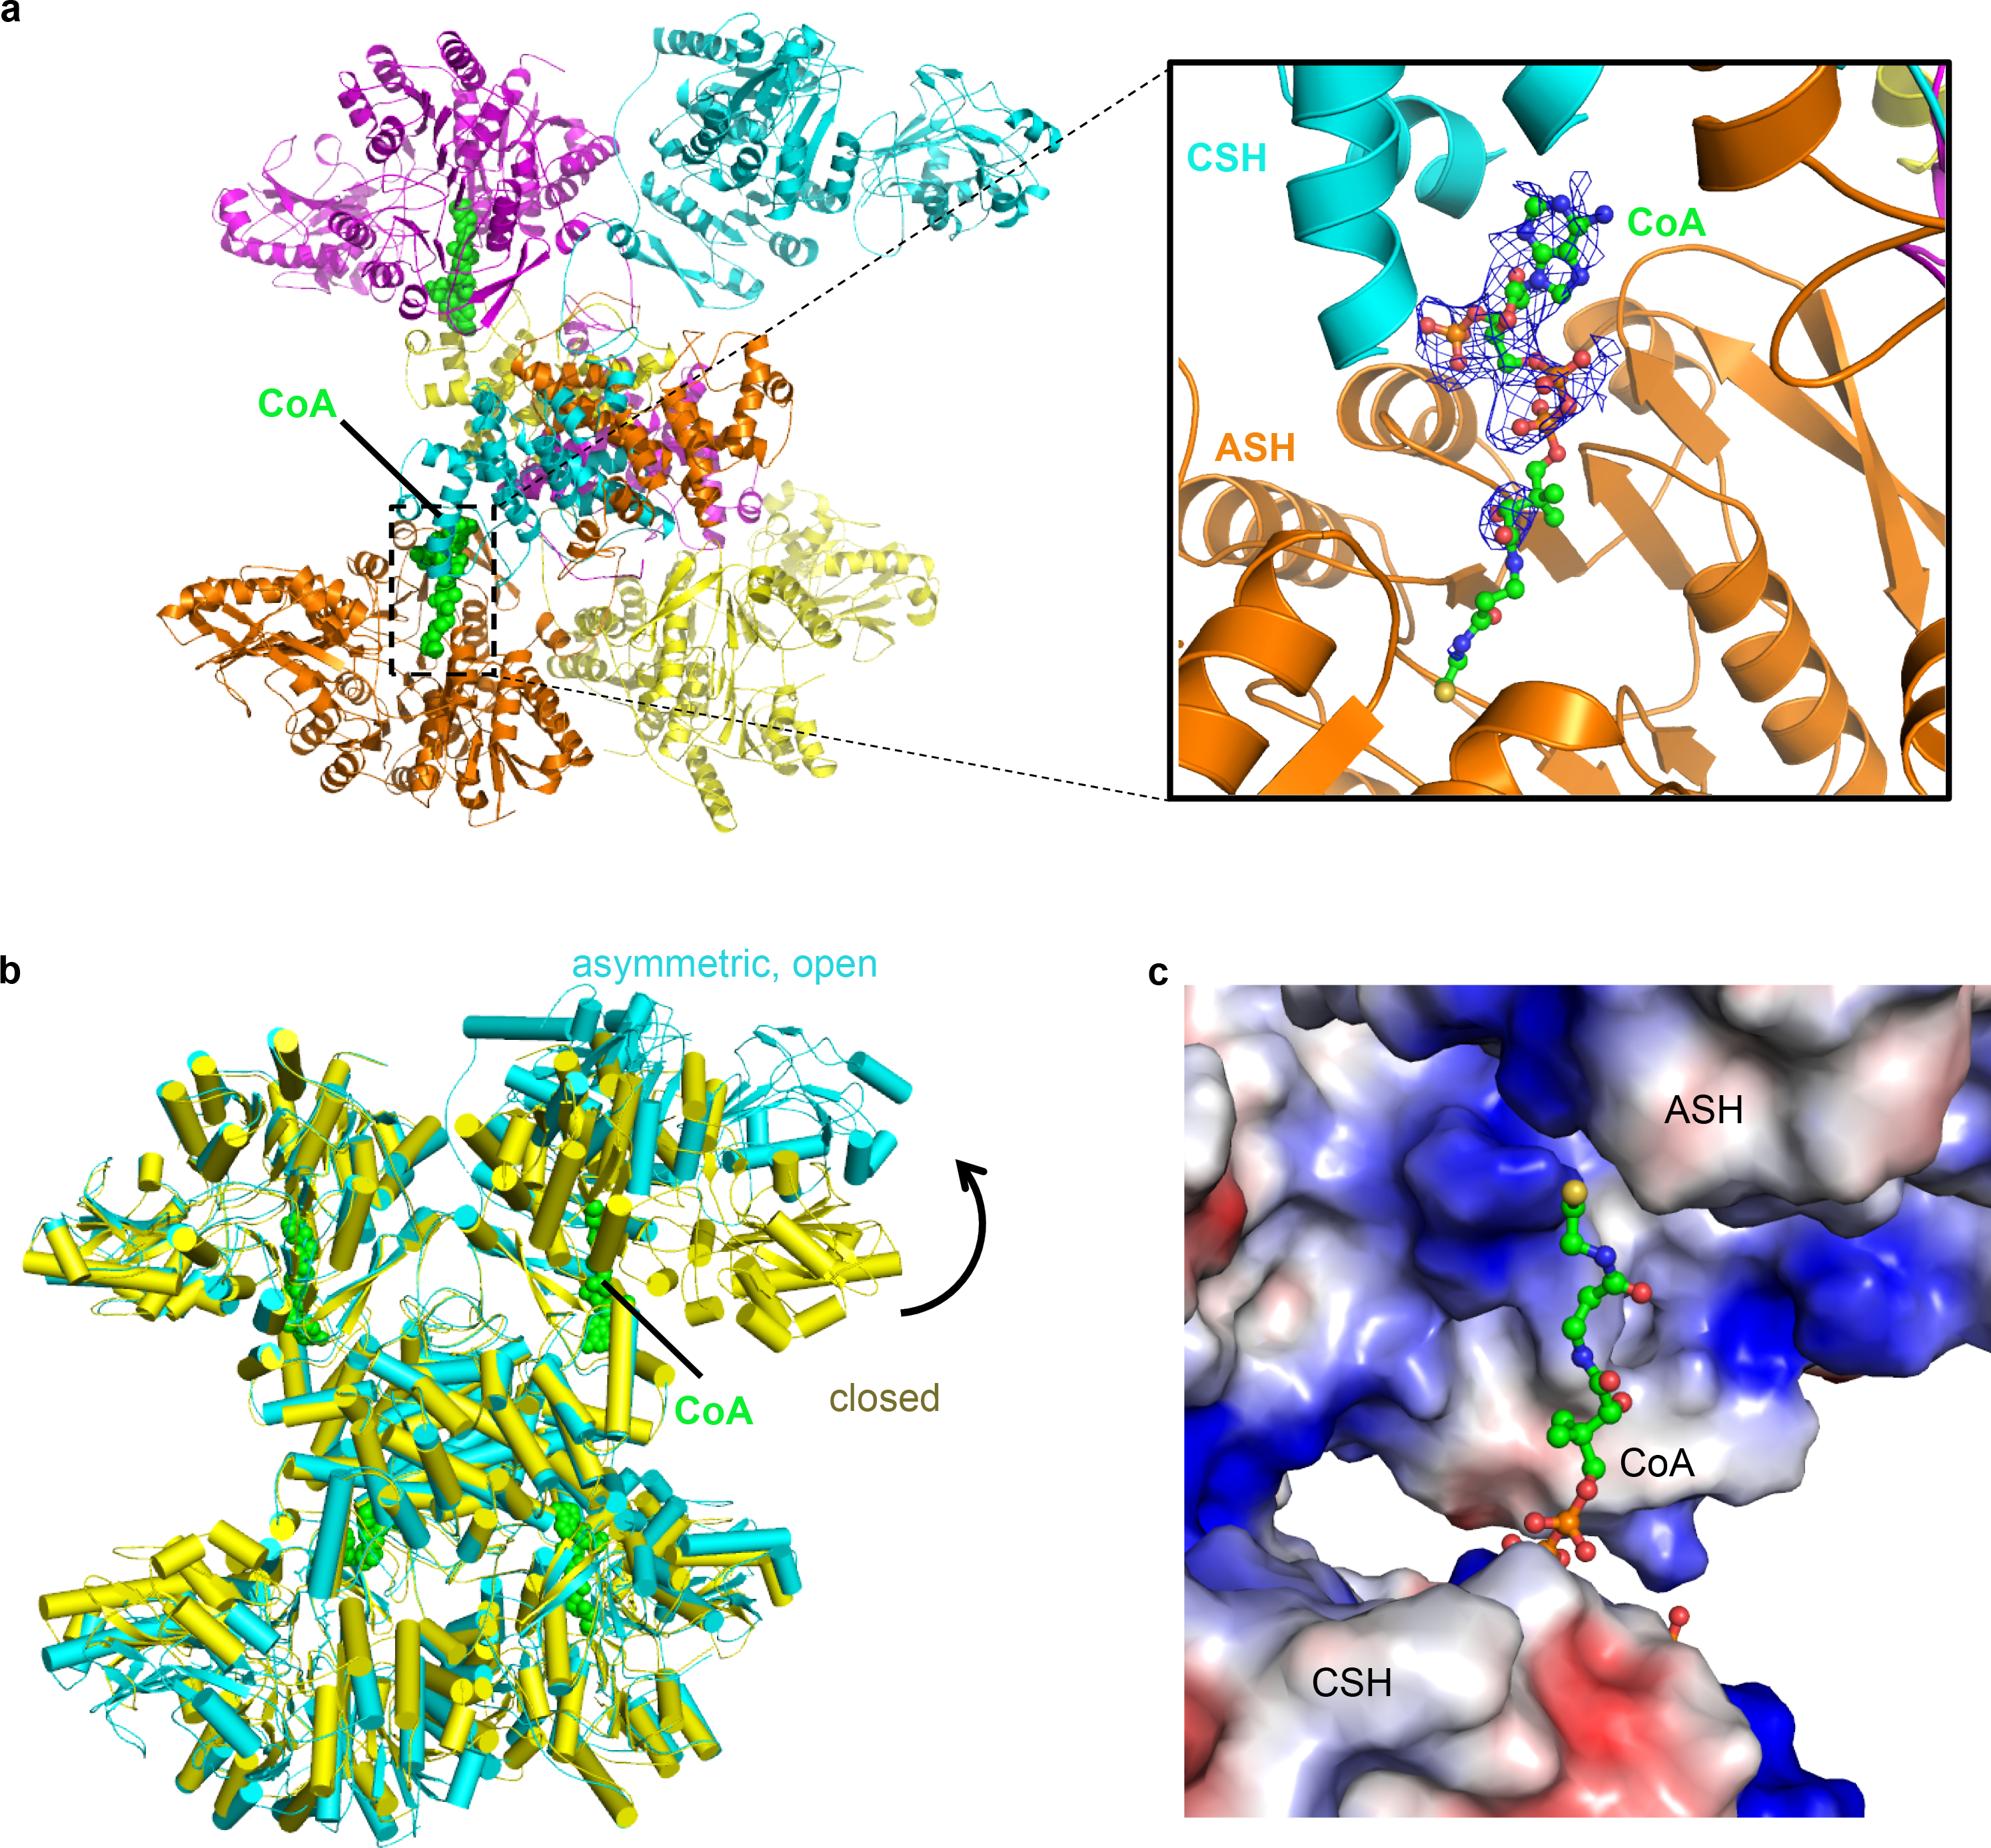
Structure of ACLY tetramer with an asymmetric ASH subunit in complex with two CoA molecules. (a) Overall structure of ACLY–citrate–/CoA-C1containing the asymmetric ASH subunit and highlighting the two bound CoA molecules in green. A blow up of one of the two CoA binding sites with corresponding cryo-EM density is shown. (b) Overlay of the symmetric (D2) and asymmetric (C1-asymm open) ACLY–citrate–CoA structures. (c) Overlay of CoA as bound in the symmetric ACLY–citrate–CoA (D2) structure onto the asymmetric ASH subunit of the ACLY–citrate–CoA (C1 asymm open) structure illustrating that the asymmetric ASH subunit is incompatible with productive CoA binding. Neutral, electro-positive and electro-negative surfaces of the ACLY structure are colored white, blue and red, respectivfely.
Structure of the ACLY-apo state is unfavorable for CoA binding
Given the limited interactions between the CSH and ASH domains, we enquired about the structure of ACLY in the absence of bound ligands. To do this, we determined the cryo-EM structure of ACLY in apo form, which we were able to resolve to 4.3-Å resolution (Extended Data Fig. 4a and Table 1). A comparison of the ACLY-apo and ACLY-citrate/CoA structures reveals that in the apo state, each of the ASH pairs on opposite ends of the tetramer are rotated towards each other by 10° to form a more open ACLY tetramer and to place the ASH domains in positions that appear to disfavor productive CoA binding (Fig. 3). Specifically, ASH loops centered on F533 and S574 and K1018 from the adjacent CSH domain would clash with CoA as bound in the ACLY-citrate/CoA structure (Fig. 3b). In addition, the two residues that are within hydrogen bonding distance to CoA from the ASH domain, R576 and E599, move out of hydrogen-bonding distance in the ACLY-apo structure (Fig. 3c). Meanwhile, the CSH module remains largely unchanged between the two structures. Together, a comparison of the ACLY-apo and ACLY–citrate–CoA structures reveal that the ACLY-apo structure must rearrange to accommodate the CoA substrate.
Fig. 3.
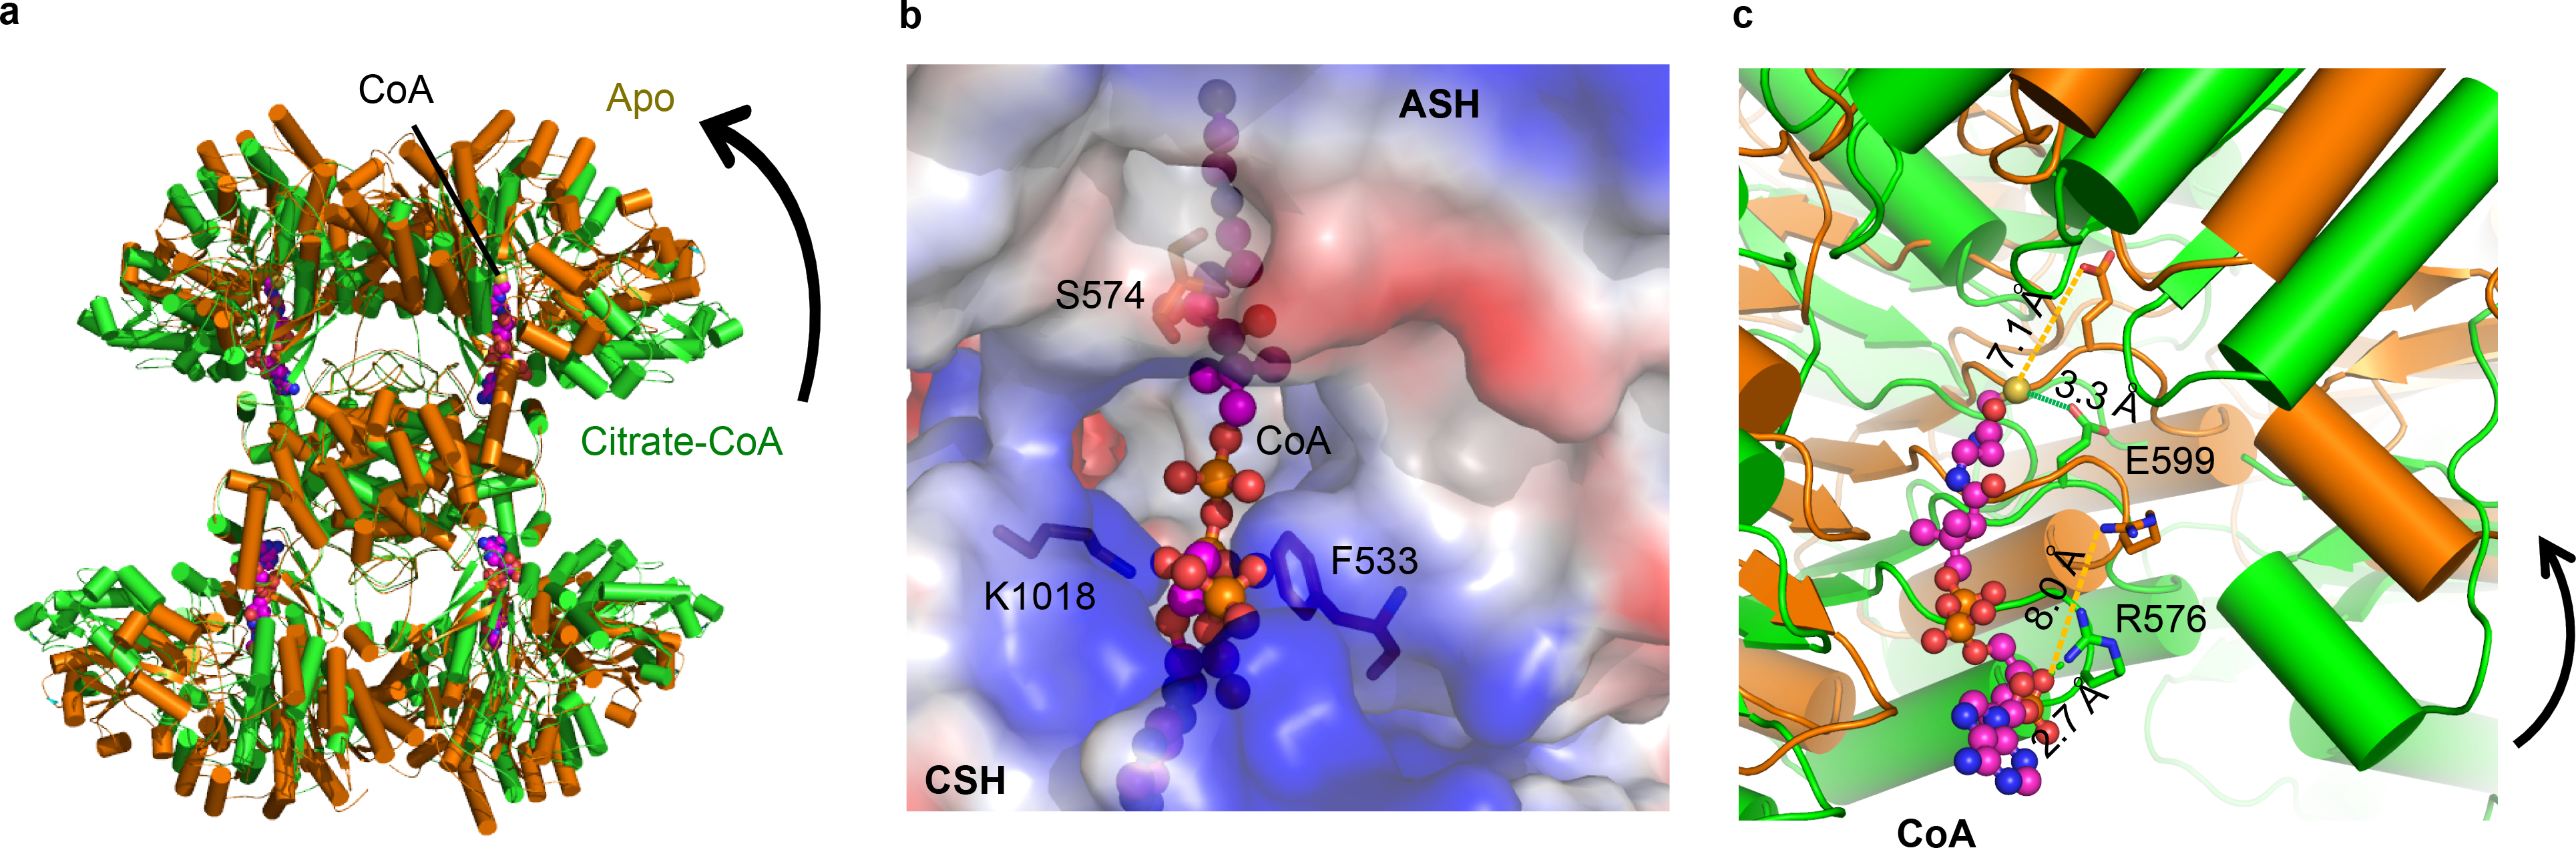
Structure of ACLY in its unliganded form. (a) Superimposition of ACLY-apo (orange) and ACLY–citrate–CoA (green). CoA is shown in magenta. (b) Close-up of CoA extracted from the ACLY–citrate–CoA structure superimposed on the ACLY-apo structure illustrating significant clashes of CoA that would occur with unliganded ACLY, particularly with residues F533 and K1018. (c) Close-up view around CoA of the superposition of the ACLY-apo and ACLY–citrate–CoA structures, highlighting the movement of R576 and E599 from ACLY-apo to ACLY–citrate–CoA structures to within hydrogen-bonding distance of CoA.
ACLY–acetyl-CoA–OAA complex reveals CoA-citrate lyase reaction occurs in ASH domain
The DSF data revealed that both the acetyl-CoA and OAA products stabilized the ACLY protein (Extended Data Fig. 1C). This finding indicated that we could capture the ACLY–OAA–acetyl-CoA product complex, and so better understand the reaction mechanism. To this end, we determined the cryo-EM structure of the complex, which we resolved to 3.1 Å resolution using D2 symmetry (Fig S4). The overall structure of the ACLY-coproduct complex was most similar to the symmetric ACLY-cosubstrate (ACLY–citrate–CoA-D2) complex, with an overall RMSD of 0.407 Å for Cα atoms (Fig. 4a). We found that acetyl-CoA occupied the same binding site as CoA and was also stabilized by the same basic residues, R576 and K964 (Fig. 4b). In addition, we were able to unambiguously model two OAA molecules bound to each ACLY subunit (Figs. 4b and 4c). One OAA molecule (OAA1) overlaps with the citrate-binding pocket within the ASH domain and proximal to the acetyl group of acetyl-CoA. OAA1 makes relatively modest interactions with the protein, including h-bonds to N346 and T348 and van der Walls interactions with F547. The other OAA molecule (OAA2) is bound to the CSH domain and makes more extensive interactions with ACLY than OAA1. OAA2 contacts the CSH module through hydrogen bonds to H900, D1026, R1065, and R1085 and through van der Waals interactions to F935 and F1061 from one subunit, as well as through a hydrogen bond to R1065 from another subunit (Fig. 4c). OAA2 overlaps well with bound OAA in pig heart citrate synthase 25 (Extended Data Fig. 5b).
Fig. 4.
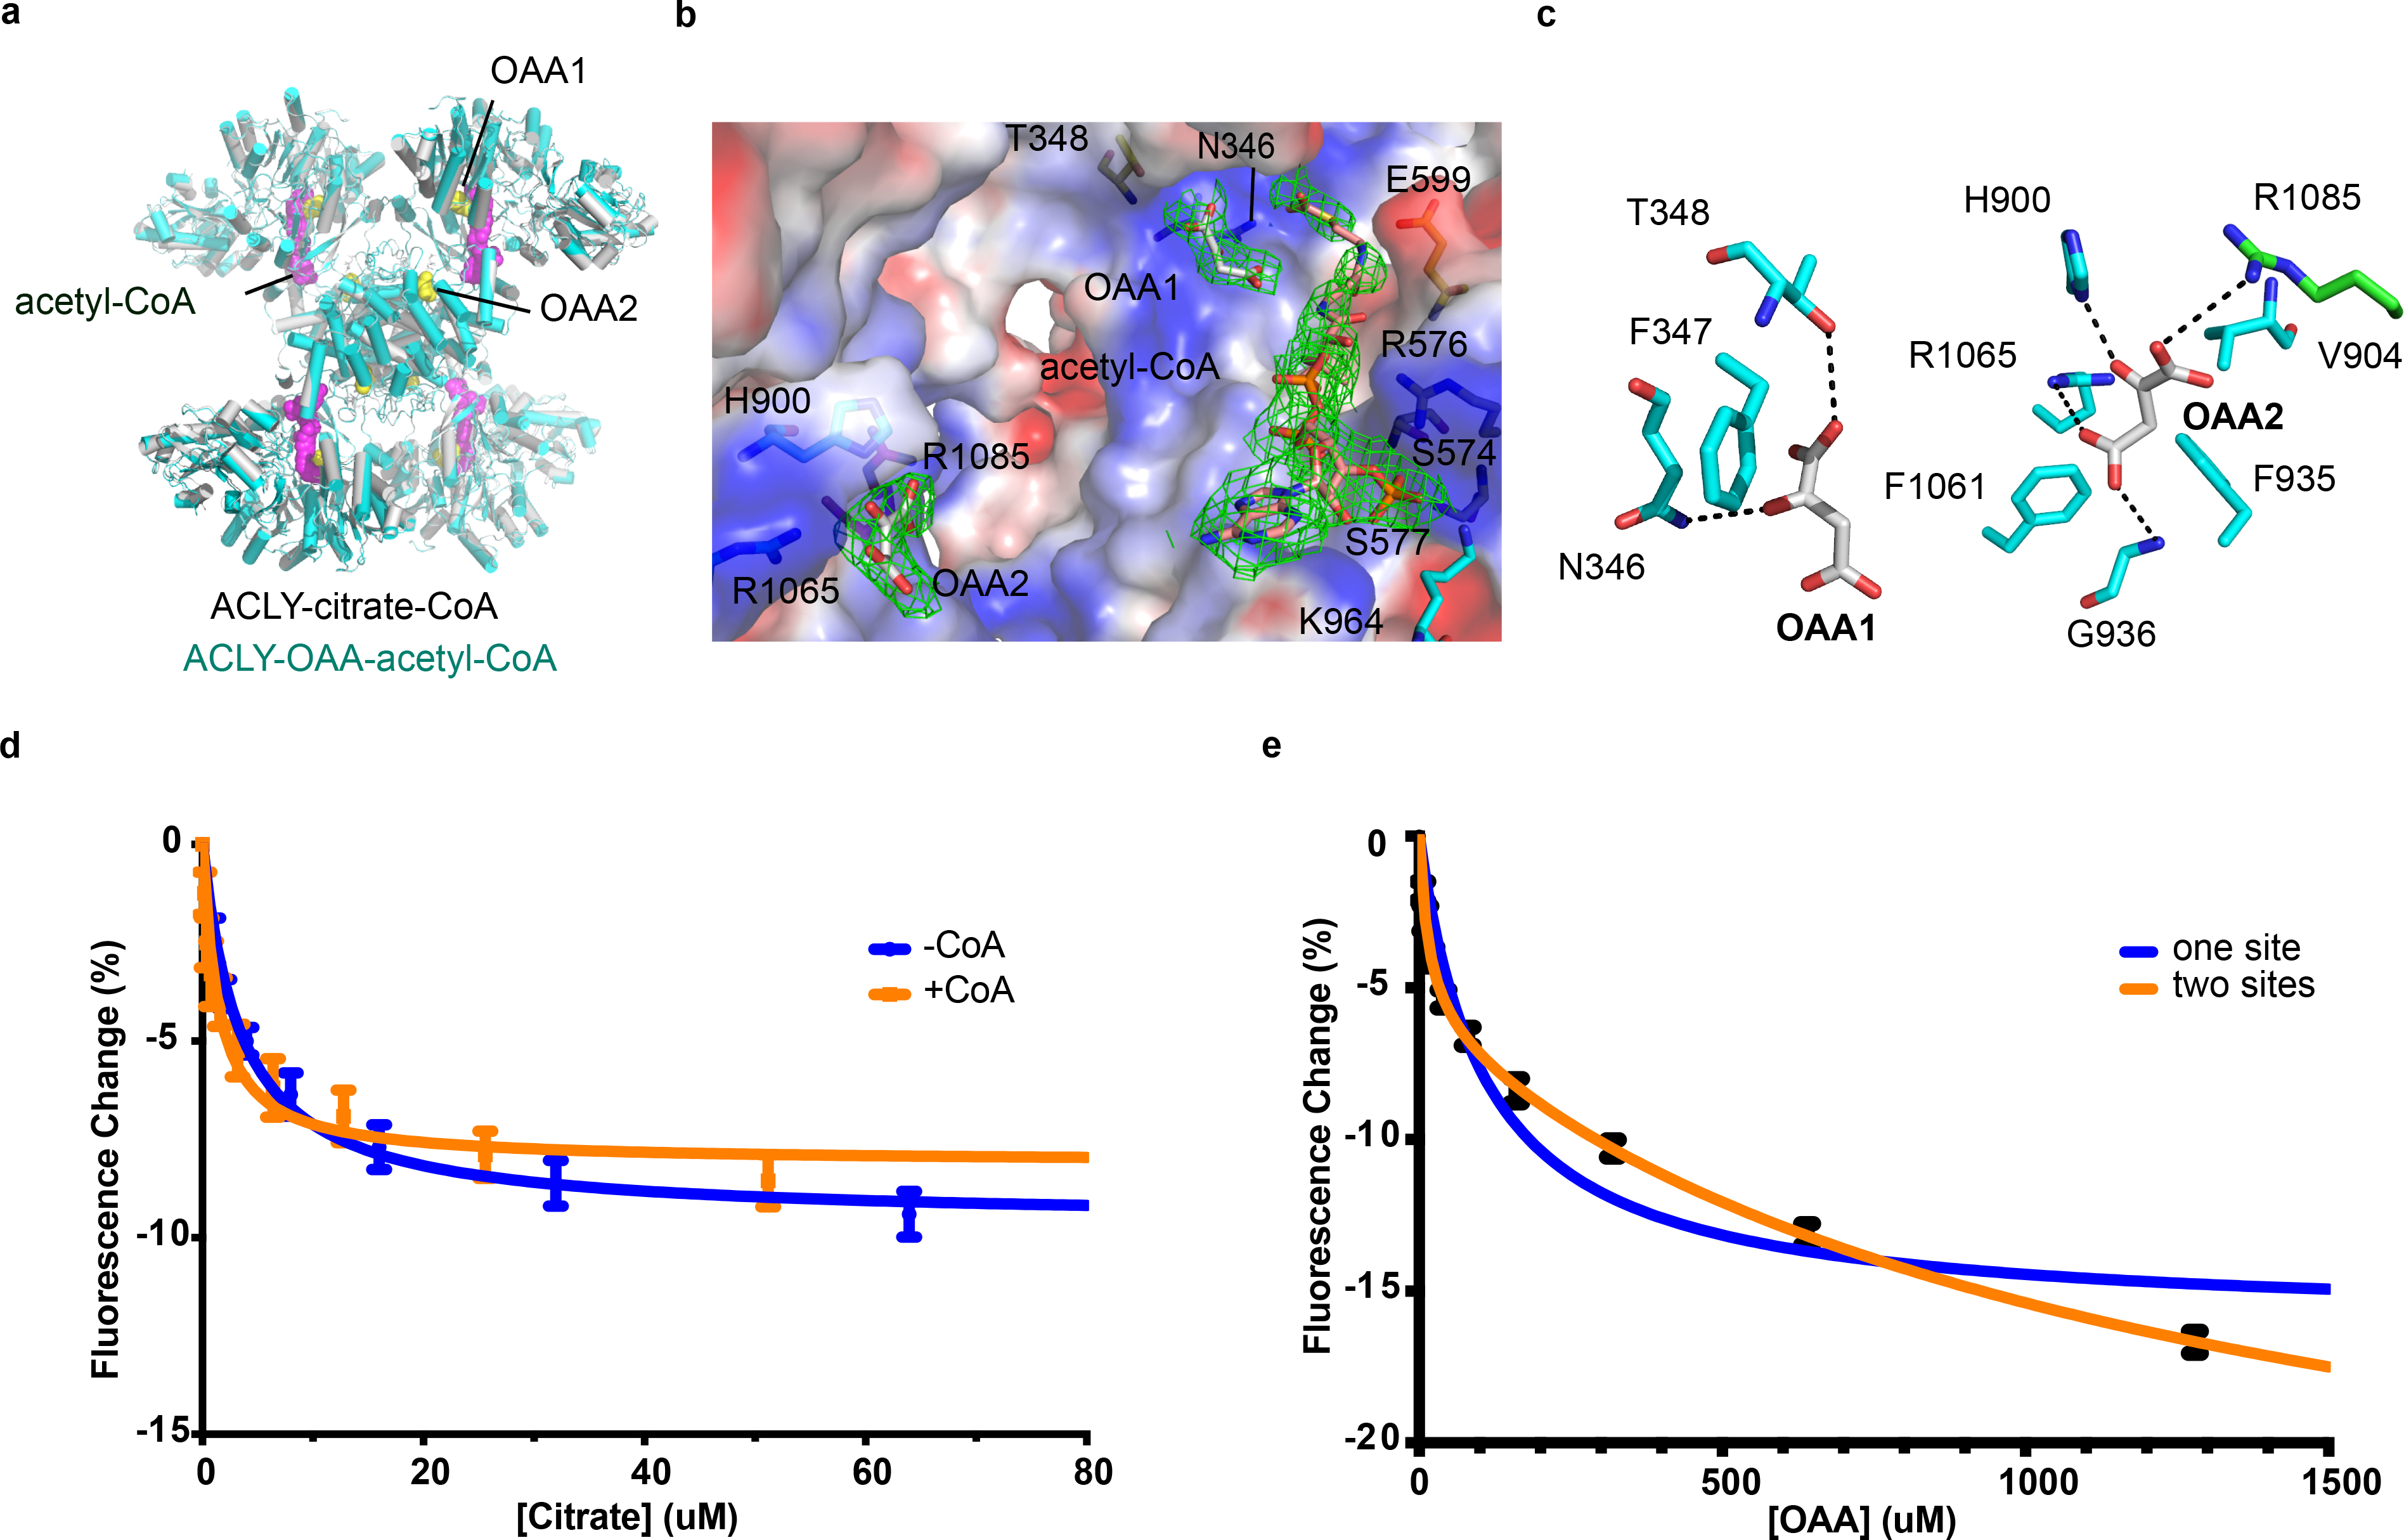
Structure of ACLY in the presence of acetyl-CoA and OAA products and citrate and OAA binding properties. (a) Comparison of ACLY–citrate–CoA (grey) and ACLY–OAA–acetyl–CoA (aqua) structures. Bound acetyl-CoA (purple) and OAA molecules 1 and 2 (yellow) are shown in CPK rendering. (b) Close-up of the electrostatic surface of ACLY around the CoA and OAA binding sites, highlighting the bound ligands (sticks) and the corresponding cryo-EM density (mesh). Key residues that interact with the bound metabolites are shown. (c) Close-up view of hydrogen bonding and van der Waals interactions with OAA1 (left) and OAA2 (right). (d) Plot of the steady-state fluorescence change of ACLY as a function of increasing concentrations of citrate in the absence (blue) or presence of 200 μM coenzyme A (orange). Solid lines display best fit to a single site binding model. (e) Plot of the steady-state fluorescence change of ACLY as a function of increasing concentrations of OAA. Solid lines display best fit to a one-site binding model (blue) and two-site binding model (orange). Data in panel d and e are plotted as Mean +/− Standard Deviation generated from n=4 independent experiments and are available as source data.
We also refined the cryo-EM map of the ACLY–OAA–acetyl-CoA structure without symmetry constraints and obtained an identical structure with D2 symmetry except that one of the four acetyl-CoA molecules showed two possible conformations of the pantothenic arm of acetyl-CoA, one with the cysteamine of CoA towards the ASH domain like in the other three protomers, and the other towards the CSH domain (Extended Data Fig. 6a). However, unlike the alternative conformation of CoA found in the ACLY–citrate–CoA structure, the position of the phosphorylated ADP group did not change in these two conformations. The potential alternative conformation of acetyl-CoA could suggest a possible substrate release pathway in enzyme turnover or an autoinhibitory state of the enzyme (discussed below).
The observation of the OAA1 and acetyl-coA products in the ASH domain strongly suggested that the lyase chemistry is carried out there, in contrast to previous proposals that this chemistry is carried out in the CSH domain 22,23. We speculate that OAA2 may function to help organize the CSH domain for cooperation with the ASH domain and/or act as a second OAA product autoinhibitory site that could sequester the pantothenic arm of acetyl-CoA (or the cysteamine of CoA) to sit across the CSH domain, such that the mutually exclusive binding of CoA in a productive conformation is inhibited at high cellular OAA concentrations (Extended Data Fig. 6a). Interestingly, while the productive extended CoA orientation with the cysteamine pointing towards the ASH domain cannot be modeled into ACLY-apo without significant steric clash (Fig. 2b), the flipped orientation with the cysteamine pointing towards the CSH domain can (Extended Data Fig. 6b). This is consistent with our findings that CoA is able to bind to ACLY in the absence of citrate and/or ATP (data not shown), but we propose in a bent conformation, as observed in one of the ACLY–citrate–CoA-C1 protomers (Fig. 1c-right and 1d-right) and also the isolated structure of the CSH domain 22.
Consistent with the hypothesis that OAA2 may serve as an ACLY autoinhibitory site, a previous study showed that OAA is able to inhibit rat liver ACLY in a manner that was non-competitive with citrate 26. To validate the functional significance of the two OAA sites observed in the ACLY–OAA–acetyl-CoA structure we employed a steady-state fluorescence quenching experiment. As a control experiment, we first titrated citrate into ACLY in the absence or presence of a saturating concentration of CoA and were able to fit the data to one citrate binding site with Kd values of 3.4 ± 0.5 μM and 1.4 ± 0.3 μM in the absence or presence of CoA with good R2 values of 0.92 and 0.84, respectively (Fig. 4d). This is consistent with the one citrate binding site observed in the ACLY ASH domain crystal structure bond to citrate 13 and the crystal structure of intact ACLY bound to CoA and citrate 22, showing that CoA stabilizes citrate binding in the ACLY ASH domain 22. We next titrated OAA into ACLY and found that the data fit significantly better to a two-site model (R2 = 0.99) over a one-site model (R2 = 0.93) (Fig. 4e). The two-site binding model better accommodated the bi-phasic fluorescence decrease that becomes apparent at higher oxaloacetate concentrations and gives rise to a high affinity oxaloacetate binding site (Kd = 15 ± 4 μM) that accounts for one third of the total fluorescence change and a low affinity oxaloacetate binding site (Kd = 1300 ± 500 μM) that accounts for the remaining two thirds of the total fluorescence change (Fig. 4e). This data is consistent with the functional relevance of the two OAA binding sites observed in the ACLY–OAA–acetyl-CoA structure.
ACLY E599 is in position to function as an important catalytic residue
The ACLY-coproduct structure allowed us to address a longstanding question about the ACLY molecular mechanism. ACLY is proposed to cleave the citryl-CoA intermediate with the aid of a general base to extract a proton from the citrate substrate and/or a general acid to reprotonate the OAA leaving group 16,27,28. This is consistent with a pH rate profile analysis of ACLY with a pKa of ~8.5 (Fig. 5a). We hypothesize that the evolutionarily conserved E599 is positioned to play an important catalytic role, either as a general base and/or acid and/or for stabilizing the phosphor-citrate intermediate (see section below) (Fig. 4b). A relatively high pKa for a buried glutamate residue has been noted previously 29. Consistent with an important catalytic role for E599, we found that E599A and E599Q mutants has significantly compromised activity (Fig. 1f), even though cofactor binding was unaffected (Fig. 5b). In contrast, we found that a similarly acidic E599D mutant exhibited similar activity as wild-type ACLY (Fig. 1f) with a similar pH rate profile (Fig. 5a). Taken together, this data argues for the importance of E599 for catalysis by ACLY.
Fig. 5.
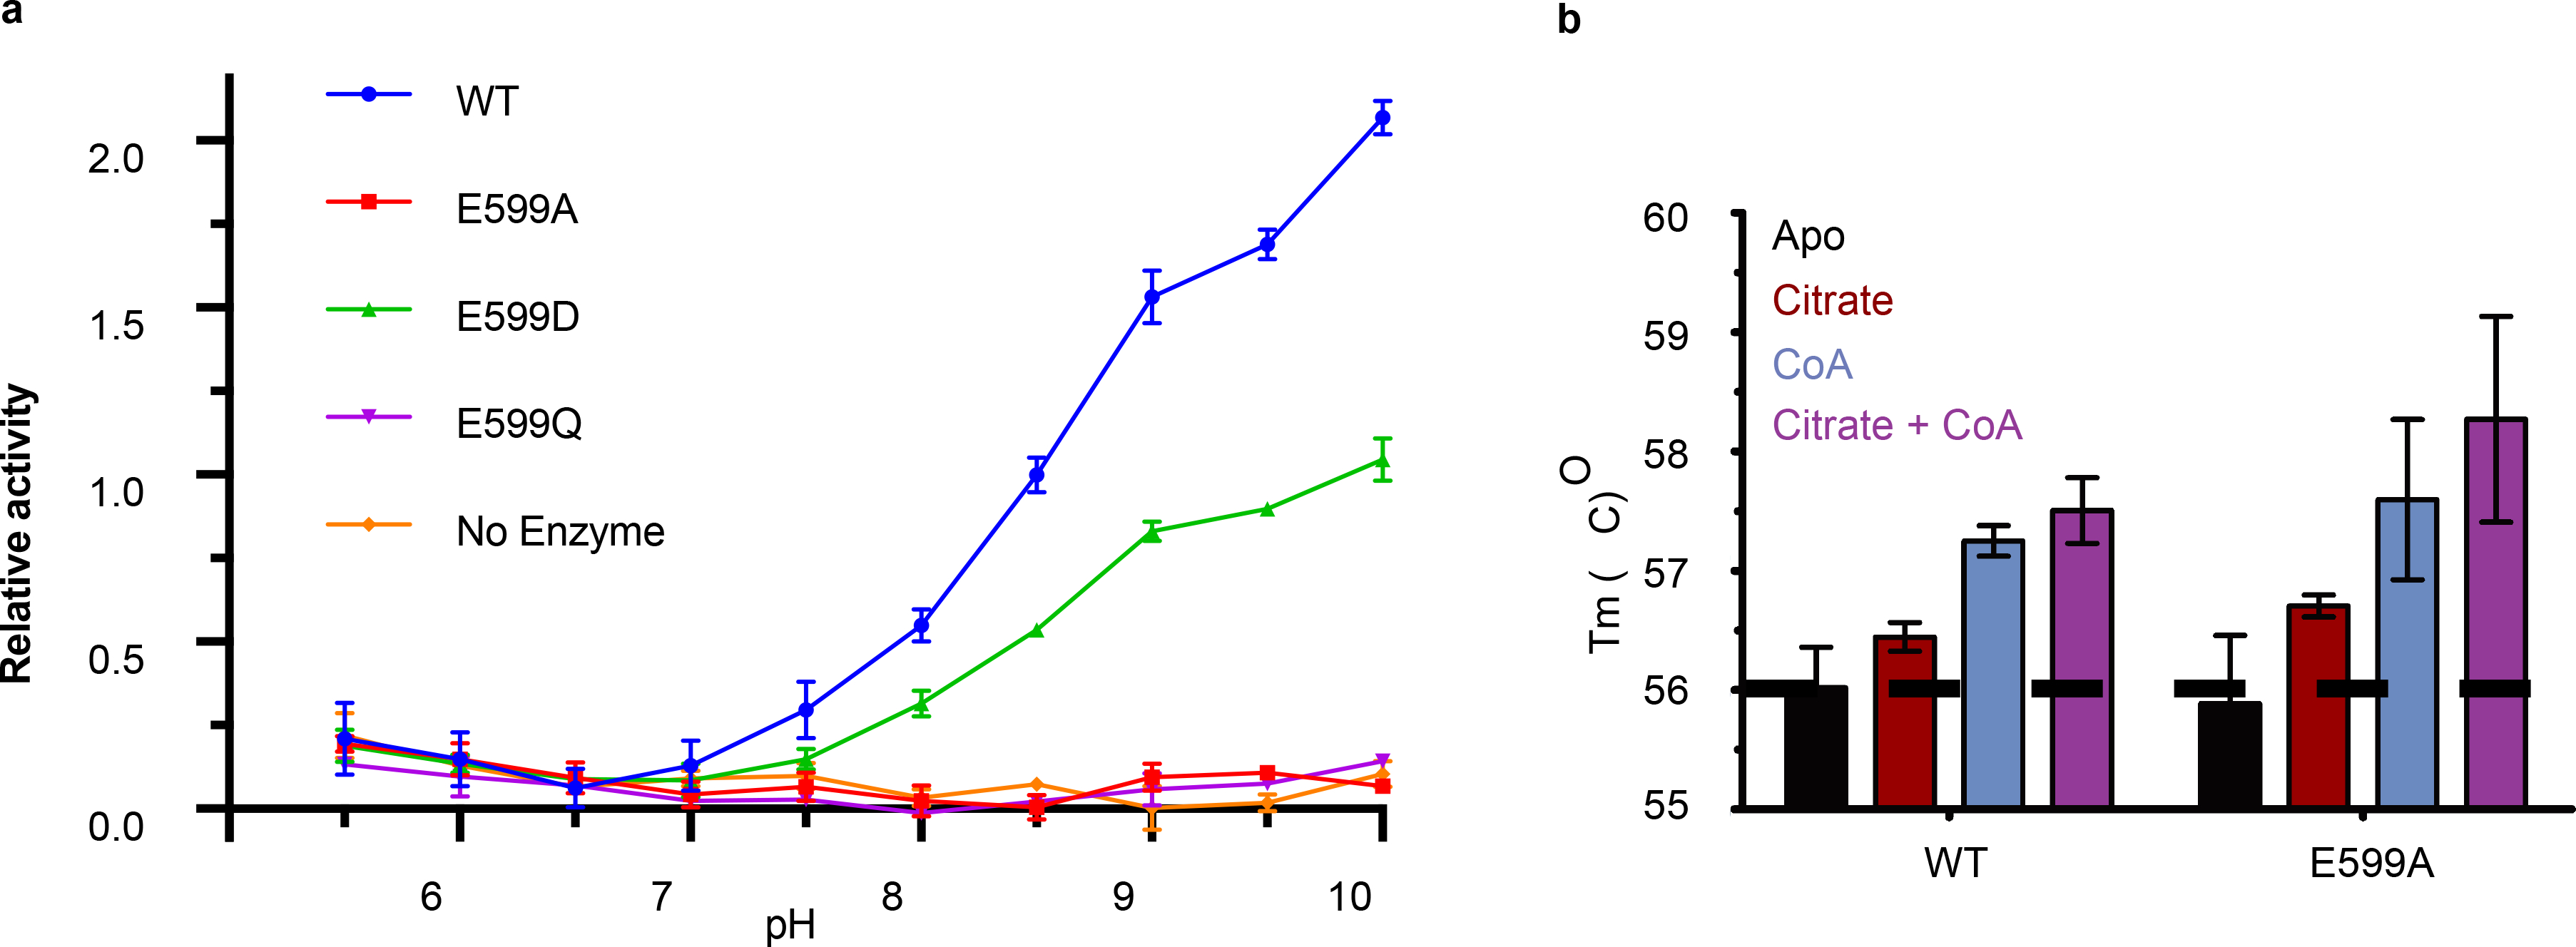
Activity of the putative E599 catalytic residue. (a) pH rate profile of ACLY-WT and ACLY-E599 mutants (Mean +/− Standard Deviation, n=3 technical replicates). (b) DSC of ACLY-WT or ACLY-E599A with or without citrate and CoA cofactors (Mean +/− Standard Deviation, n=2 technical replicates). The dashed line indicates the average Tm for apo ACLY. Data for 5a and 5b are available as source data.
ACLY catalysis proceeds through a phospho-citryl-CoA intermediate in the ASH domain
The identification of E599 as an important catalytic residue for cleavage of the citryl-CoA adduct to acetyl-CoA and OAA products, provided us an opportunity to trap a reaction intermediate of an ACLY-E599Q mutant in the presence of the ATP, citrate and CoA cosubstrates. We therefore mixed the ACLY-E599A mutant with saturating concentrations of ATP, citrate and CoA (ACLY-E599Q–ATP–citrate–CoA) and determined it’s cryo-EM structure, which we were able to resolve to an overall resolution of 2.85 Å. The structure was determined by imposing D2 symmetry and revealed that the ASH and CSH domains of ACLY were arranged similarly to the ACLY–citrate–CoA product and ACLY–OAA–acetyl-CoA structures with RMSD values for Cα atoms of 0.584 and 0.620 Å, respectively. However, in contrast to these other substrate and product complexes, the ACLY-E599Q–ATP–citrate–CoA complex revealed remarkably well- defined cryo-EM density in the ASH domain active site, that could be modeled as ADP (hydrolyzed ATP) and a phospho-citryl-CoA intermediate (Fig. 6a and 6b). Also, in contrast to each of the other ACLY structures reported in this study, the amino acid 752–767 loop harboring the H760 residue, which has been shown to mediate phosphate transfer from ATP to citrate, is well ordered in the ACLY-E599Q–ATP–citrate–CoA structure (Fig. 6c). In addition, a magnesium ion or water molecule, also proposed to stabilize H760, is observed to be bound to the E599 and phosphate group (Fig. 6c). This observation suggests that the His760 residue, phosphate group and magnesium ion may cooperate to stabilize citrate for ligation to CoA in the ASH domain active site. In addition, the fact that the acetyl-CoA and OAA products are not observed in this structure, further supports our conclusions that E599 plays an important catalytic role in cleavage of the phospho-citryl-CoA intermediate to the acetyl-CoA and OAA products within the ASH domain.
Fig. 6.
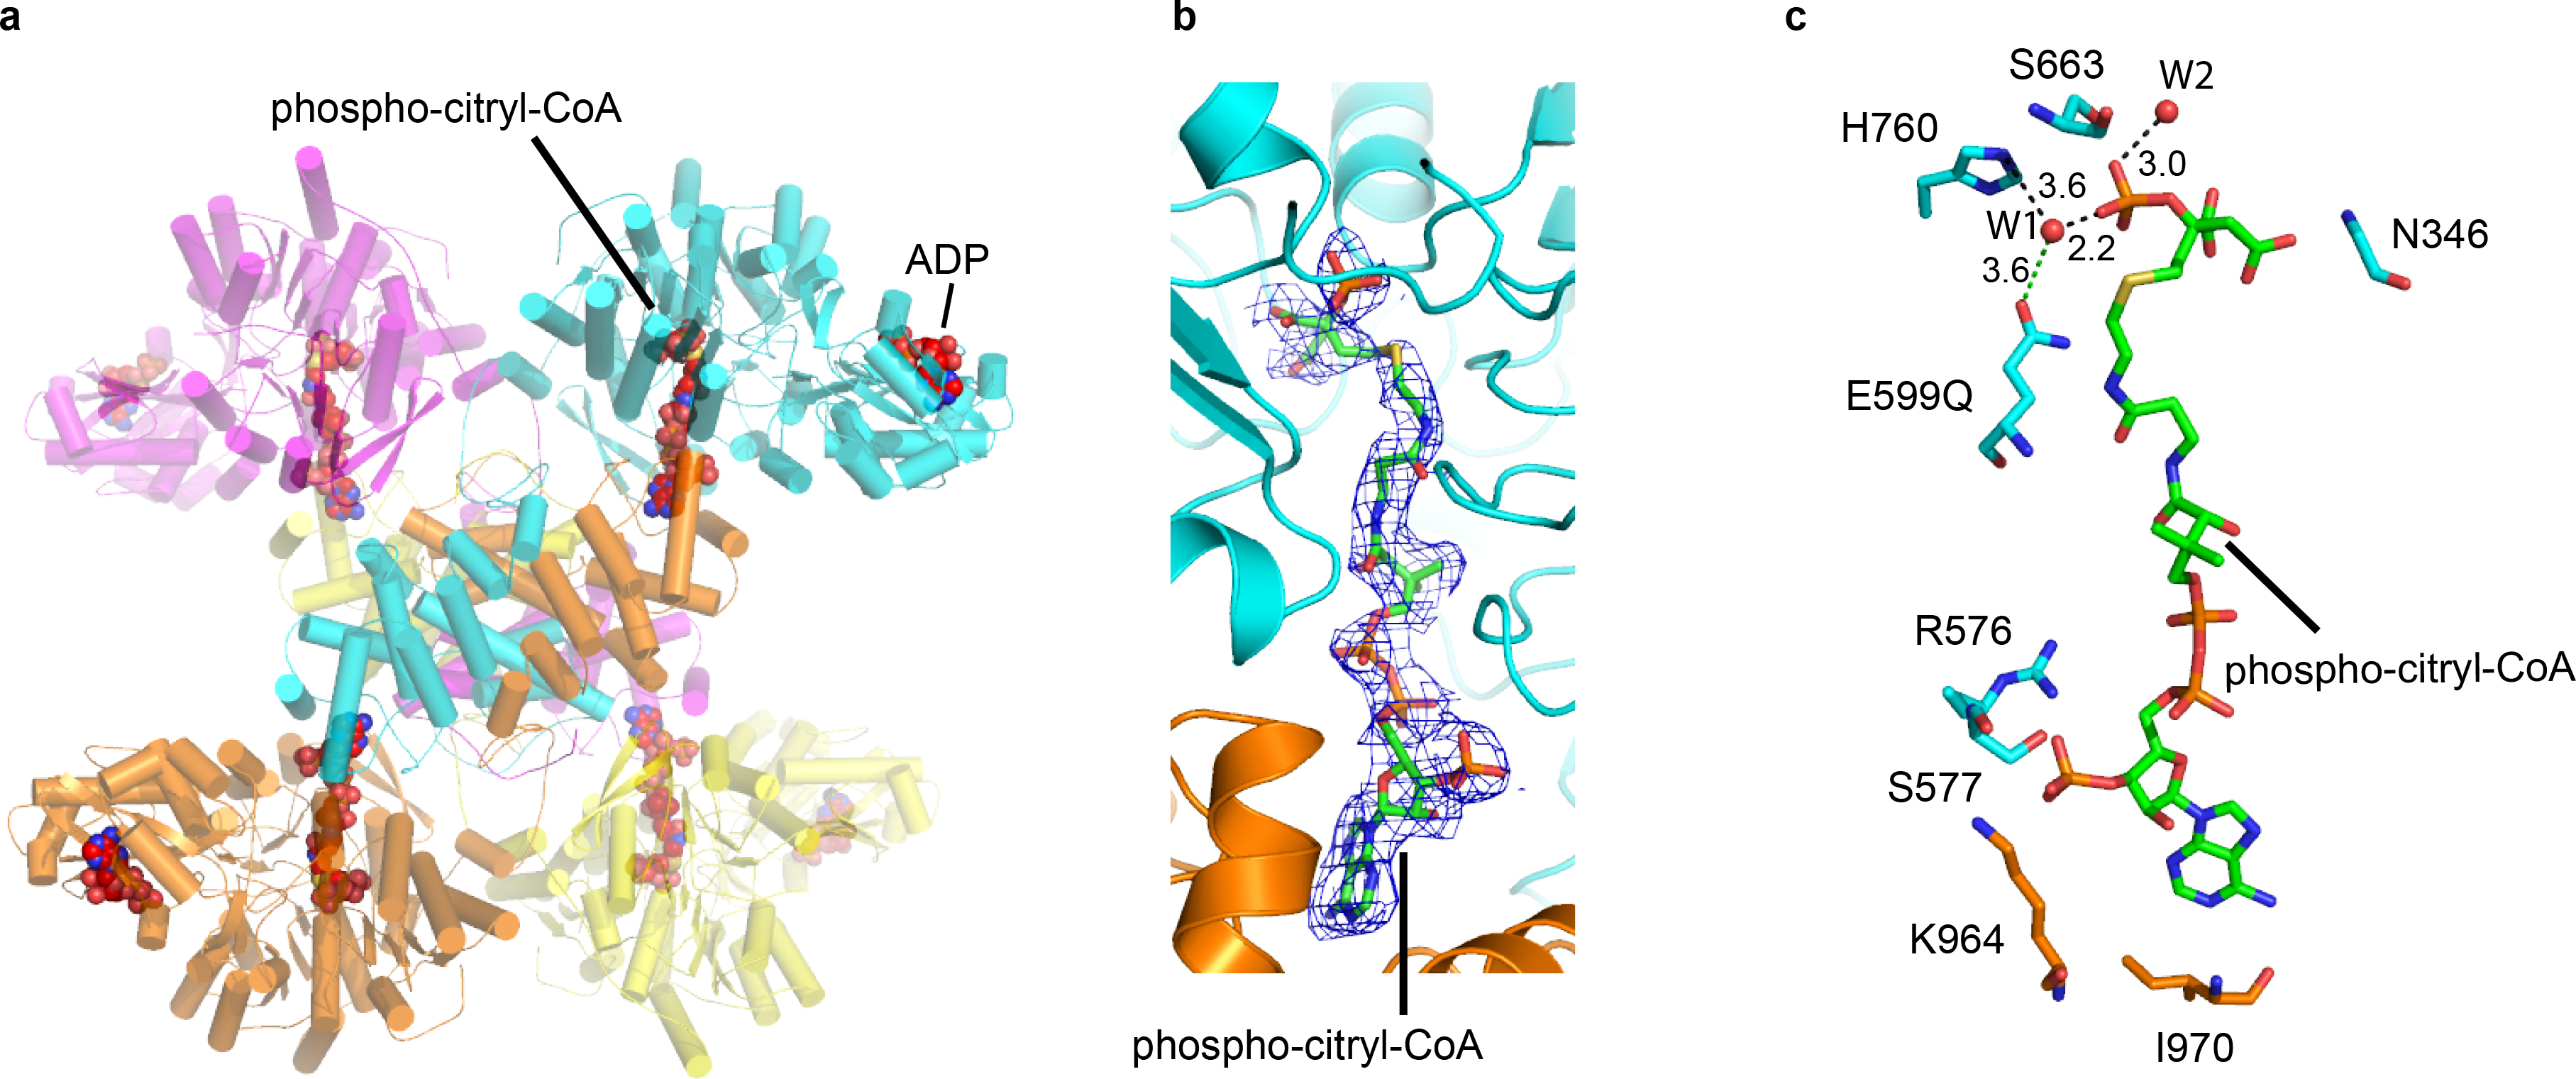
Structure of the ACLY-E599Q catalytic mutant in the presence of ATP, citrate and CoA cosubstrates. (a) Overall structure of the ACLY-E599Q–ATP–citrate–CoA structure highlighting the bound ADP (hydrolyzed ATP) and phospho-citryl-CoA intermediate. (b) Close up of the phospho-citryl-CoA intermediate with corresponding cryo-EM density. (c) Close up of protein interactions proximal to the phospho-citryl-CoA intermediate. Residues that mediate either hydrogen bonds or van der Waals interactions with the phospho-citryl-CoA intermediate are shown.
Discussion
In this study, we capture ACLY in three distinct states (ACLY-apo, ACLY–citrate–CoA and ACLY–OAA–acetyl-CoA); and an ACLY catalytic mutant in the presence of the three cosubstrates ATP, citrate and CoA, allowing us to capture a phosphor-citryl-CoA intermediate. Interestingly, citrate was added to both the ACLY-citrate/CoA and ACLY-E599A–ATP–citrate–CoA structures but it is only visible in the latter structure, which traps the phospho-citryl-CoA intermediate (Extended Data Fig. 7c). This suggests that citrate binding may be stabilized by phosphorylation and the β-mercapto group of CoA. In the absence of phosphorylation and CoA β-mercapto group stabilization, the citrate in the ACLY–citrate–CoA structure is not yet engaged in catalysis and therefore might be too flexible to be visualized in the cryo-EM map. These snapshots of ACLY during various steps of the ACLY reaction pathway allow us to propose a more complete model for the production of acetyl-CoA and OAA products (Fig. 7 and Extended Data Movie 1). This model starts with the unliganded ACLY-apo state, which is suboptimal for productive CoA binding. While CoA is able to bind to ACLY in both productive and non-productive conformation in the presence of citrate, catalysis requires the prior binding of ATP. In the presence of ATP, citrate and CoA, a conformational change of the ASH domains to a more compact position relative to the ACLY apo form occurs, where the active site is more shielded from water and where a phospho-citryl-CoA intermediate can be formed in the ASH domain. This intermediate is then cleaved in the ASH domain to form the acetyl-CoA and OAA products, with participation of an important catalytic residue, E599, which could act as a general base, acid or both for cleavage and/or stabilize the phospho-citrate intermediate. The release of acetyl-CoA might be facilitated through flipping of its pantothenic arm against the CSH module as its alternative conformation suggests (Extended Data Fig. 6). We also propose a novel mechanism of ACLY regulation during metabolic flux; high concentrations of OAA results in a negative feedback loop through nonproductive binding of OAA to the CSH domain (OAA2) to sequester the pantothenic arm of acetyl-CoA in a non-productive conformation, which would sterically block productive CoA binding and thus inhibit subsequent catalysis. Decreased concentrations of OAA or increased concentrations of substrates can then reactivate the enzyme.
Fig. 7.
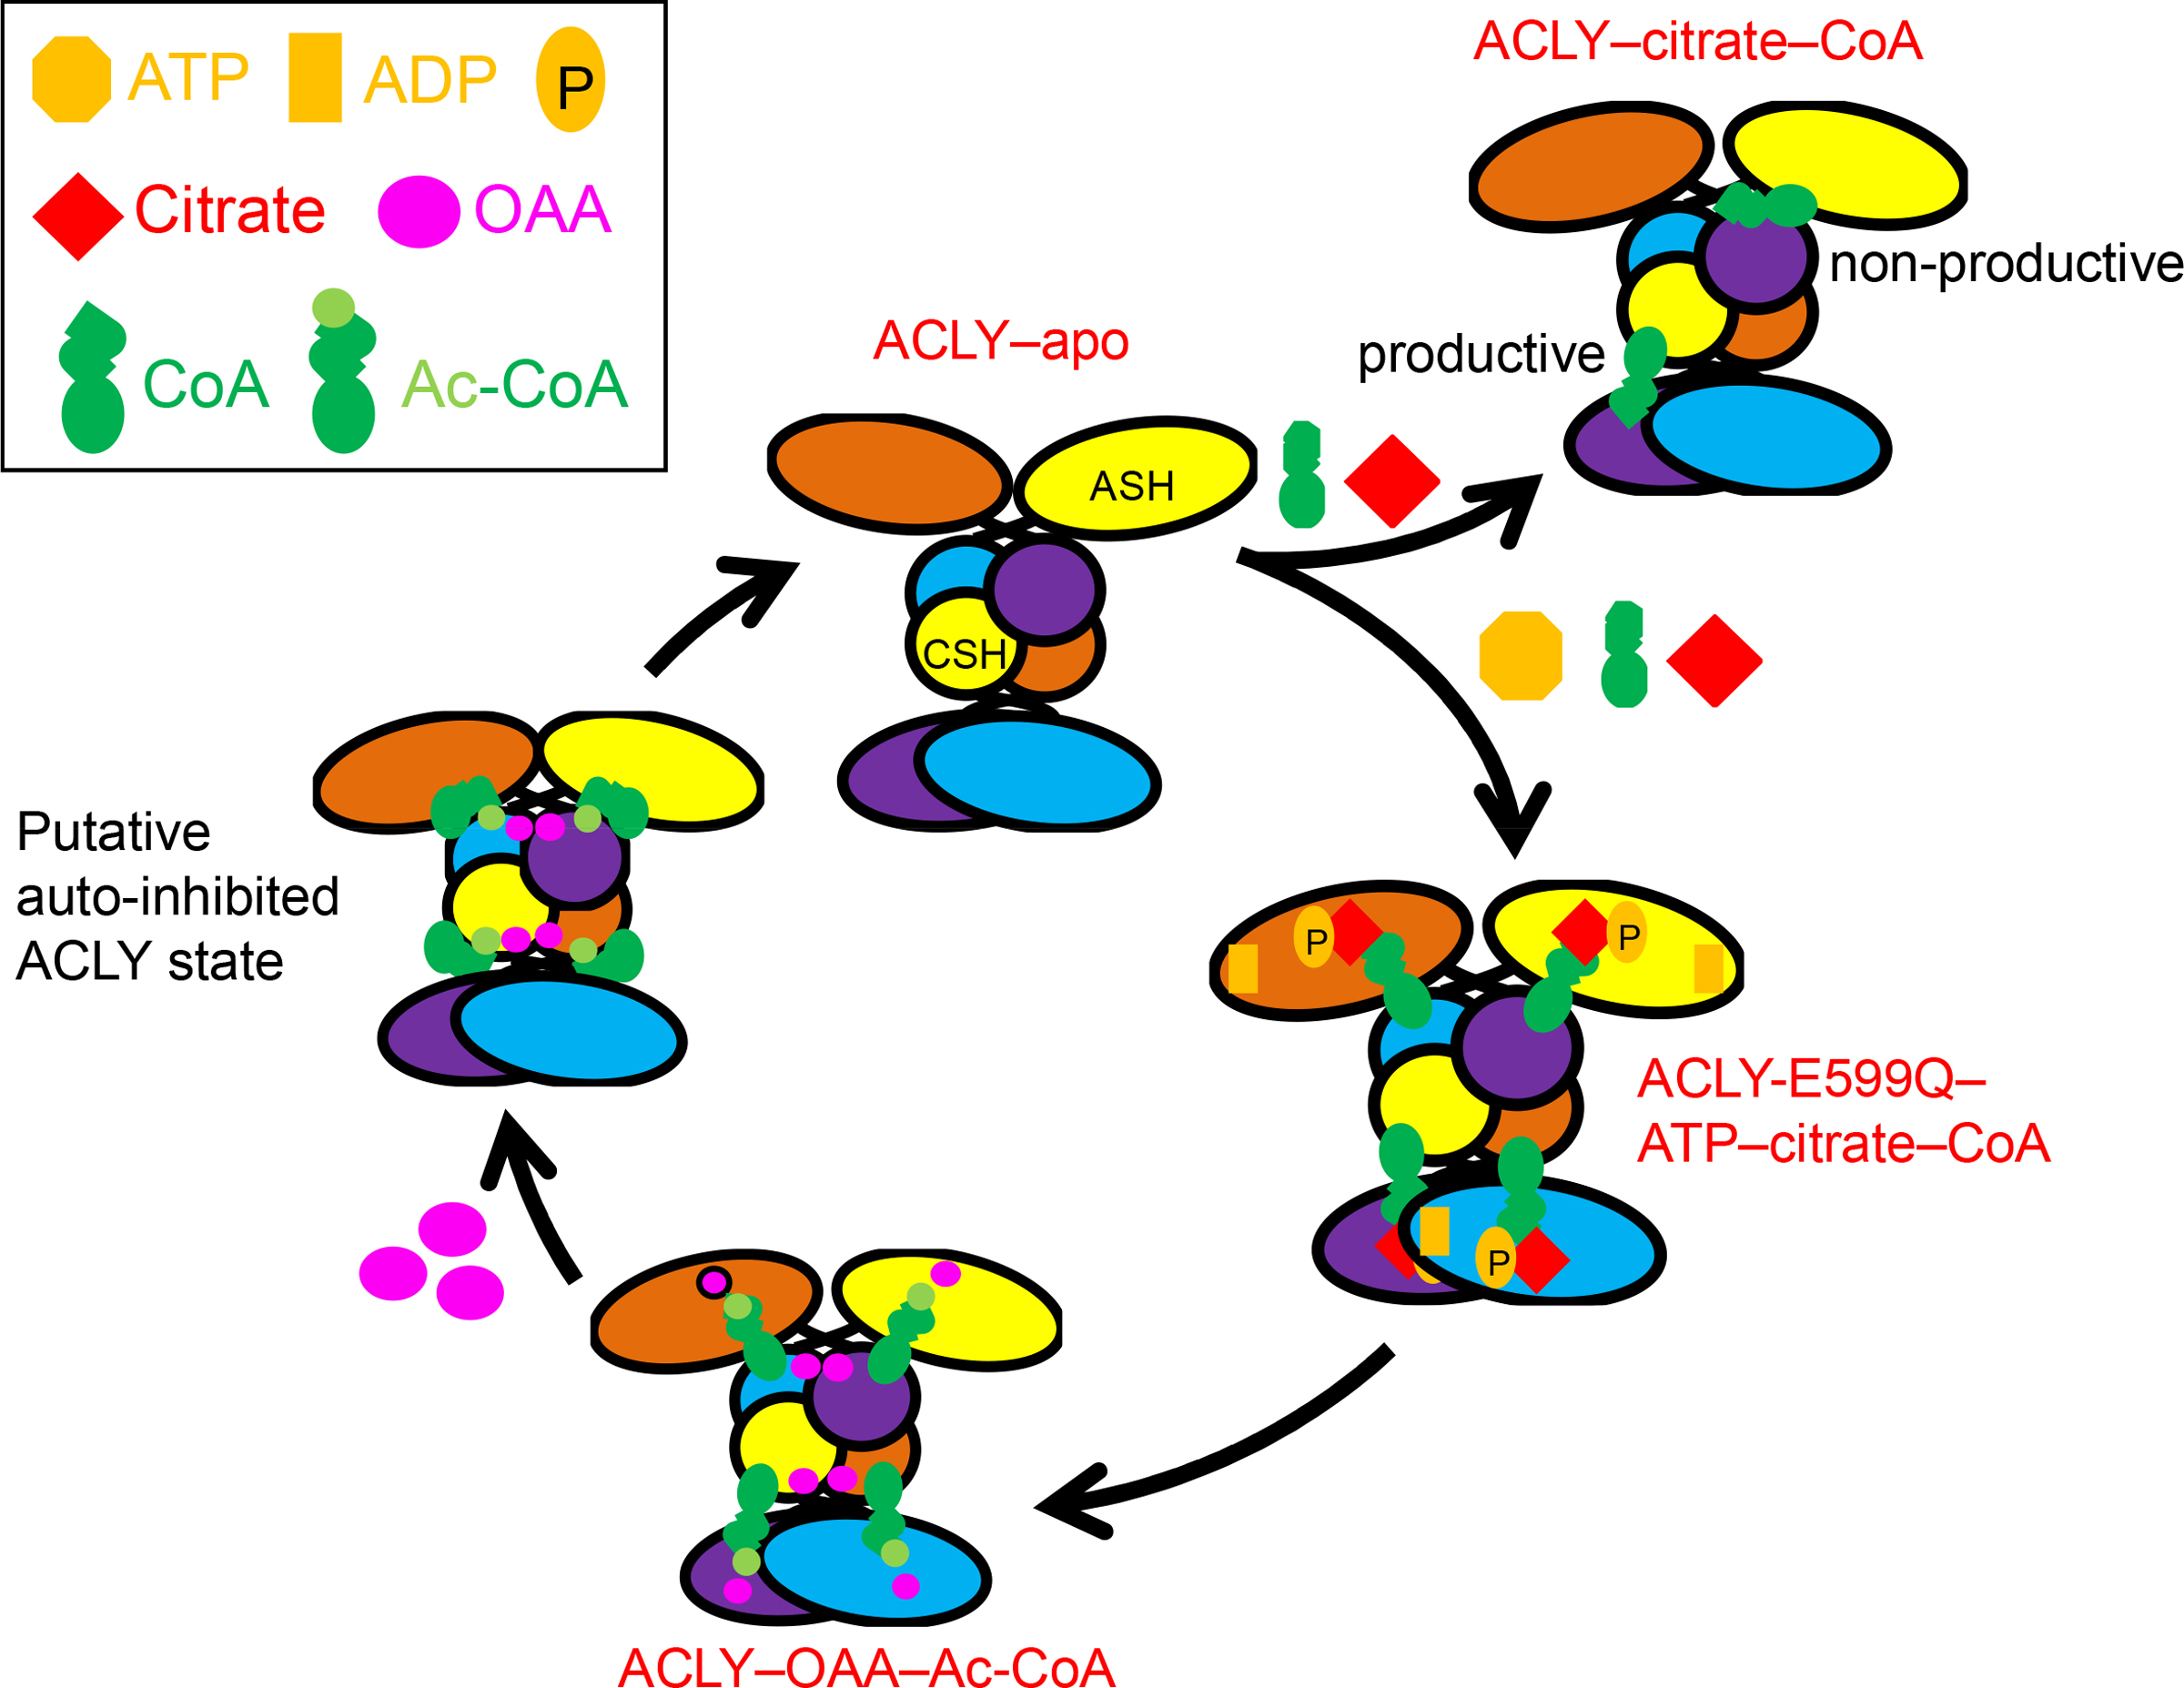
Proposed model of metabolite regulation of ACLY activity. Structures reported in this study are indicated in red, while other structural states are proposed. The model depicts that ACLY–apo is suboptimal for productive CoA binding and that CoA can bind in productive or non-productive conformations, but CoA cannot be converted to acetyl-CoA until ATP and citrate substrates bind. The ACLY-E599Q mutant in the presence of CoA, citrate and ATP (ACLY-E599Q–ATP–citrate–CoA) reveals that a phospho-citrate-CoA intermediate forms prior to formation of acetyl-CoA and OAA products. Following cleavage of the phospho-citrate-CoA intermediate, the ACLY–OAA–Ac-CoA structure reveals that acetyl-CoA and OAA products are formed in the ASH domain. We propose that high acetyl-CoA and/or OAA at a second binding site in the CSH domain could then hold ACLY in an auto-inhibited state, followed by reactivation of ACLY through reduced OAA concentrations and/or elevated substrate concentrations.
The presence of two OAA binding sites in ACLY is supported by our ACLY–OAA–acetyl-CoA product structure and our steady state fluorescence quenching experiments indicating two OAA binding sites with Kd values of 15 and 1300 μM. We propose that the lower and higher affinity ACLY binding sites correspond to the more sparsely and extensively held OAA1 and OAA2 molecules in the ACLY–OAA–acetyl-CoA structure, respectively. The assignment of OAA2 to the higher affinity ACLY binding site, is consistent with the finding the OAA inhibits cytosolic rat liver ACLY with a Ki of 63 μM in a manner that is non-competitive with citrate (although a weaker KI of 1.2 mM is also reported against the isolated enzyme) 26. A more definitive biological role of the OAA2 binding site warrants further study.
It is notable that we observe a nonproductive CoA binding mode in the ACLY–citrate–CoA-C1 structure (Fig. 1c-right), which could represent an intermediate for productive CoA binding and/or an intermediate for acetyl-CoA release with the acetyl group replacing the water molecule (Fig. 1d-right). This alternate, nonproductive CoA orientation is similar to the one recently identified in the isolated structure of the CSH domain 22. The mutational sensitivity of several residues that stabilize the nonproductive CoA orientation (for example H975, D1026 and R1065) is consistent with its functional importance (Fig. 1f).
A recent crystallographic study by Verstraete and coworkers 22 captured the structure of ACLY bound of citrate and CoA, which is similar to the symmetric ACLY–citrate–CoA-D2 structure reported here. This same study captured the crystal structure of the isolated CSH module of ACLY bound to citrate and CoA, in which the CSH module, citrate and CoA all adopt different conformations than in the intact ACLY structure. Notably, the CoA bound to the CSH module adopts the same orientation as the nonproductive CoA orientation observed in this study. However the authors interpret this observation differently and propose that ACLY initially binds citrate and CoA in the ASH domain to synthesize the (3S)-citryl-CoA adduct, followed by a structural rearrangement of the enzyme and a movement of the CoA adduct into the CSH module to carry out the cleavage reaction to form the acetyl-CoA and OAA products in the CSH domain. A cryo-EM study of ACLY bound to a citrate-competitive inhibitor by Tong and coworkers proposed a similar molecular mechanism for production of ACLY products 23. This mechanism is in contrast to the structures reported here, which clearly demonstrate that both the acetyl-CoA and OAA products are located in the ASH domain, demonstrating that both the citrate clevage and acetyl-CoA synthesis reactions occur exclusively in the ASH domain. This conclusion is further supported by our ability to trap a phospho-citryl-CoA intermediate bound to an ACLY-E599A catalytic mutant.
The structural studies described here provide new opportunities for the rational design of ACLY inhibitors. In addition to targeting the ATP, citrate and CoA sites within the ASH domain, sites at the interface of ASH and CSH domains would seem particularly attractive as they would likely have high potency and specificity for ACLY. In addition, the phospho-citryl-CoA intermediate observed in the ACLY-E599Q–ATP–citrate–CoA structure might make an attractive starting point for ACLY inhibitor development. Together, the studies presented here further elucidate the molecular basis for Ac-CoA production in response to the metabolic state of the cell and presents additional therapeutic vulnerabilities for ACLY-associated metabolic disorders.
Methods
Expression and purification of full-length human ACLY
A codon optimized gene sequence for recombinant full length ACLY expression in bacteria was synthesized (Genscript) and inserted into a pET24a vector between NdeI and XhoI sites. Full length human ACLY with a C-terminal 6xHis tag was expressed in BL21(DE3) cells. The E. coli cells were cultured in LB-kanamycin media. When the cell density reached OD600=0.8–1.0, protein expression was induced with 1 mM IPTG for 16–20 hr. at 16 °C. After expression, the cells were harvested by centrifugation (Sorvall S6) at 4,000g for 15 min, and the pellets were resuspended in a lysis buffer containing 25 mM Tris-HCl pH 7.5, 500 mM NaCl, and 10% glycerol, and then sonicated. The cell lysate was centrifuged at 40,000g for 30 min and the supernatant was collected. The protein was affinity purified with Ni-NTA resin, with a 25 mM Tris-HCl pH 7.5, 500 mM NaCl, and 10% glycerol equilibration buffer, a 25 mM Tris-HCl, pH 7.5, 500 mM NaCl, and 10% glycerol and 40 mM imidazole wash buffer, and lastly a 25 mM Tris-HCl pH 7.5, 500 mM NaCl, 10% glycerol, and 200 mM imidazole elution buffer. After being eluted from the Ni-NTA, the protein was concentrated and further purified through gel filtration chromatography using Superdex 200 10/30 GL column (GE healthcare) in 25 mM Tris pH 7.5, 200 mM NaCl, and 10 mM β-mercaptoethanol. The highly purified protein was concentrated to about 5 mg/mL at 4 °C prior to use.
Negative staining
Purified ACLY (5 μl at 0.05 mg/mL) was applied to glow-discharged EM grids covered by a thin layer of continuous carbon film and was stained with 2% (w/v) uranyl acetate. Negatively stained EM grids were imaged on a Tecnai T12 microscope (FEI Company).
Cryo-EM data collection, image processing, model building and refinement
For cryo-EM, 20 μL of 5 mg/mL ACLY was mixed with 1 μL 0.05% (v/v) NP-40, and then applied (3 μL) to glow discharged Quantifoil R1.2/1.3 300 mesh copper grids, blotted for 10 seconds ( blot force=2) under 100% humidity at 16 °C and plunged into liquid ethane using an FEI Vitribot Mark IV. These grids were screened using a FEI TF20 microscope. Data collection was performed using either a Talos Arctica microscope or Titan Krios equipped with a K2 or K3 Summit direct detector (Gatan).
All cryo-EM data were processed with the following workflow. For EM data of ACLY with citrate and CoA, first, beam-induced motions were corrected using MotionCor2 30. Gctf was used to determine the defocus value of each micrograph 31. For reconstruction of ACLY–citrate–CoA, a subset of about 3,000 particles was manually picked from ten micrographs. The images of this subset were classified using reference-free 2D classification and eight of the class-averaged images were selected as templates for an automatic particle-picking procedure in the program RELION 32. A low-resolution 3D initial cryo-EM was generated in RELION from these 3,000 particles and used as a reference for 3D classification. In total, 716,394 particles were picked and extracted from 3,617 micrographs. All the particles were binned to accelerate the 2D and 3D classification and no symmetry was imposed in the 3D classification. After several rounds of 2D and 3D classifications, bad particles were removed. The remaining 129,563 particles were retained for 3D-auto refinement with D2 symmetry imposed and we were able to produce a cryo-EM map with a resolution of 3.3 Å. The resolution of the cryo-EM map was further improved to 3.0 Å by particle polishing and per-particle CTF refinement (ACLY–citrate–CoA-D2). The same set of particles above were also refined without imposing symmetry to a final resolution of 3.5 Å (ACLY–citrate–CoA-C1 asymm closed).
Besides the symmetrical ACLY tetramer, a subset of 73,969 asymmetrical ACLY tetramer particles were combined for 3D classification and were used to produce a cryo-EM map with a resolution of 4.2 Å (ACLY–citrate–CoA-C1 asymm open).
For cryo-EM micrographs of ACLY-apo, motion correction and CTF estimation were performed by MotionCor2 and Gctf. Initially, about 2,000 particles were manually picked from 10 micrographs. 2D class averages from these 2,000 particles were used as a reference for automatic particle picking in RELION. 398,391 particles were automatically picked from 816 micrographs. The EM map of the ACLY-citrate/CoA structure was low-pass filtered to 100 Å and then used as a reference in 3D classification. After multi rounds of 2D and 3D classification, we determined that nearly over 90% of these particles were not intact ACLY tetramer and removed. The best 20,677 particles with D2 symmetry were kept for 3D-auto refinement and were sufficient to produce a reconstruction at a resolution of 5.2 Å. The resolution was further improved to 4.3 Å by particle polishing and per-particle CTF refinement.
For 3D reconstruction of the ACLY–OAA–acetyl-CoA structure, 719,613 particles were picked from 4,003 micrographs. The best 147,854 particles were kept for 3D-auto refinement with D2 symmetry imposed and were sufficient to produce a cryo-EM map with a resolution of 3.4 Å. The resolution was further improved to 3.1 Å by particle polishing and per-particle CTF refinement. Local resolution estimation of the cryo-EM maps were performed by Resmap 33. Image processing statistics for all cryo-EM data are shown in Table S1.
For 3D reconstruction of the ACLY-E599–citrate–ATP–CoA structure, 746,030 particles were picked from 5,600 micrographs. The best 207,653 particles were kept for 3D-auto refinement with D2 symmetry imposed and were sufficient to produce a cryo-EM map with a resolution of 3.3 Å. The resolution was further improved to 2.85 Å by particle polishing and per-particle CTF refinement.
For model building of the ACLY–citrate–CoA structure, the crystal structure of the ACLY N-terminus (PDB code: 3MWD) was fitted into the 3.0 Å cryo-EM map by rigid body fitting. The initial homology model of the ACLY C-terminus was created from structures of Sulfolobus solfataricus citrate synthase (PDB code: 1O7X) using Robetta and I-TASSER 34,35. Manual adjustments were made using Coot 36. PHENIX was used to refine the model against the map 37. As there are no significant conformational changes between substrate-bound and product-bound ACLY, the coordinates of ACLY–citrate–CoA structure were docked into the EM map of ACLY–OAA–acetyl-CoA and ACLY-E599Q–ATP–citrate–CoA. Acetyl-CoA, OAA and the phospho-citryl-CoA intermediate were manually added into the map based on the corresponding density for these metabolites. Afterwards, manual adjustments to the protein were made using Coot, and PHENIX was used to refine the model against the map interactively. For model building of ACLY-apo, coordinates of the ASH domain and CSH domain from ACLY–citrate–CoA were docked into the cryo-EM map separately. The atomic coordinates were manually adjusted in coot and refined by real-space-refinement in PHENIX.
All representations of cryo-EM density and structural models were prepared with Chimera 38 and PyMol 39.
Coupled Enzyme Activity Assays
Enzyme activity of 20 nM protein was measured by coupling to malate dehydrogenase (MDH) activity 40. The reactions were set up as 200 uL volumes in a clear 96-well plate. The reaction buffer was 200 mM Tris-HCl pH 8.5, 20 mM MgCl2, 20 mM potassium citrate tribasic pH 7.5, 20 mM ATP, and 10 mM DTT with 2U of porcine MDH and 200 μM NADH. The reactions were initiated with 200 μM CoA and the change in Absorbance340nm was recorded every 30 seconds for 15 minutes in a Molecular Devices SpectraMax M2e plate reader (one experiment, n=3 each) The delta absorption was used to calculate relative activity to WT protein.
The pH-dependent activity was determined by substituting the standard reaction buffer for 100 mM sodium acetate, 50 mM Bis-Tris, and 50 mM Tris base at a pH range of 5.5–10, with added 20 mM MgCl2, 20 mM potassium citrate tribasic pH 7.5, 20 mM ATP, 10 mM DTT, 2U MDH, 200 μM NADH, and 200 μM CoA used to initiate the reaction. The change in Absorbance340nm was recorded every 5 five minutes for 1 hour (one experiment, n=3 each).
Differential Scanning Fluorimetry
Cofactor binding to 0.8 μM ACLY in 25mM HEPES pH 8.0, 200 mM NaCl, 1 mM DTT was measured by Differential Scanning Fluorimetry (three independent experiments. n=8 each). All additives were added at 10 mM (20-fold excess of Km or Kd) in various combinations in a 384-well optical plate, and the fluorescence of 5X SYPRO Orange protein dye was measured across a 20 °C – 85 °C temperature range in a 7900HT Real-Time PCR (Applied Biosystems) at a 2% ramp rate with a 10 min 20°C pre-equilibration step. The inflection point of the data was taken to be the temperature of unfolding. These data were compared by two-way ANOVA with Dunnett’s multiple comparisons test and plotted using Prism.
Differential Scanning Calorimetry
Cofactor binding to 5 μM ACLY was measured by Differential Scanning Calorimetry with a VP-Capillary DSC (MicroCal). The protein was dialyzed overnight into 25mM HEPES pH 8.0 and 200 mM NaCl. Cofactors were added either individually or in combination at 500 μM each (two independent experiments per set, n=1 each). The samples were centrifuged to clear out particulates, vacuum degassed, and run against water in the reference. The same solutions without enzyme were also run as buffer controls and used for normalization. The samples were scanned at 60 °C hr−1 from 10 °C - 90 °C with a 10-min 10 °C pre-equilibration. The TM, ΔHCAL, and ΔHvH were calculated through a non-two state Levenberg-Marquardt fitting model after baselining (linear connect, step-at-peak) and evaluated by reduced χ2 analysis. We correct for systematic baseline error by averaging weighted estimates (ΔHWA) 41.
Steady-State Fluorescence
Steady-state fluorescence binding experiments were conducted on a JASCO FP-8300 Spectrofluorometer. All experiments were conducted in triplicate in 50 mM Tris, 200 mM NaCl, 5 mM MgCl2, 0.5 mM TCEP, pH 7.6 at 20 °C. For the citrate binding experiments, sodium citrate was titrated into 100 nM ACLY using an excitation wavelength of 280 nm and emission was monitored at 330 nm. Slit widths were set to 5 nm for excitation and 10 nm for emission. For the oxaloacetate binding experiments, oxaloacetate was titrated into 100 nM ACLY using an excitation wavelength of 295 nm and emission was monitored at 365 nm. Slit widths were set to 5 nm for both excitation and emission. Total fluorescence was corrected for dilution (>1%) and normalized using ΔFi (%) = 100*(Fi-F0)/F0, where ΔFi is the percent fluorescence change at ligand concentration i, Fi is the fluorescence at ligand concentration i, and F0 is the fluorescence in the absence of ligand. Data was fit in GraphPad Prism version 5.01 using non-linear regression to one-site and two-site specific binding models. The one-site specific binding model used was ΔFi = (Fmax*L)/(L+Kd), where Fmax is the maximum fluorescence change, L is the concentration of ligand, and Kd is the equilibrium dissociation binding constant. The two-site specific binding model used was ΔFi = (Fmax,1*L)/(L+Kd,1)+(Fmax,2*L)/(L+Kd,2), where Fmax,1 is the maximum fluorescence change for binding to the first site, Fmax,2 is the maximum fluorescence change for binding to the second site, L is the concentration of ligand, Kd,1 is the equilibrium dissociation binding constant for the first site, and Kd,2 is the equilibrium dissociation binding constant for the second site. Fit parameters were Fmax = −9.6 ± 0.4 % and Kd = 3.4 ± 0.5 μM, R2 = 0.92 for citrate binding in the absence of CoA; Fmax = −8.1 ± 0.4 % and Kd = 1.4 ± 0.3 μM, R2 = 0.84 for citrate binding in the presence of CoA; Fmax = −16.0 ± 0.7 % and Kd = 110 ± 20 μM, R2 = 0.93 for oxaloacetate binding using the one-site model; and Fmax,1 = −6.6 ± 0.7 %, Kd,1 = 15 ± 4 μM, Fmax,2 = −20 ± 3 %, Kd,2 = 1300 ± 500 μM, R2 = 0.99 for oxaloacetate binding using the two-site model.
Further information on experimental design is available in the Nature Research Reporting Summary linked to this article.
Data Availability
Structures and EM maps of ACLY-apo (PDB-6POF, EMDB-20414), ACLY–citrate–CoA-D2 (PDB-6UUZ, EMDB-20903), ACLY–citrate–CoA-C1 assym open (PDB-6UIA, EMDB-20784), ACLY–citrate–CoA-C1 assym closed (PDB-6POE, EMDB-20413), ACLY–OAA–acetyl-CoA-C1 (PDB-6UV5, EMDB-20904), ACLY–OAA–acetyl-CoA-D2 (PDB-6UI9, EMDB-20783) and ACLY-E599Q–ATP–citrate–CoA (PDB-6UUW, EMDB-20902) have been deposited to the PDB and EMDB. Source data for Figures 1f, 4d, 4e, 5a and 5b and Extended Data Figure 1c are available with the paper online.
Extended Data
Extended Data Fig. 1.
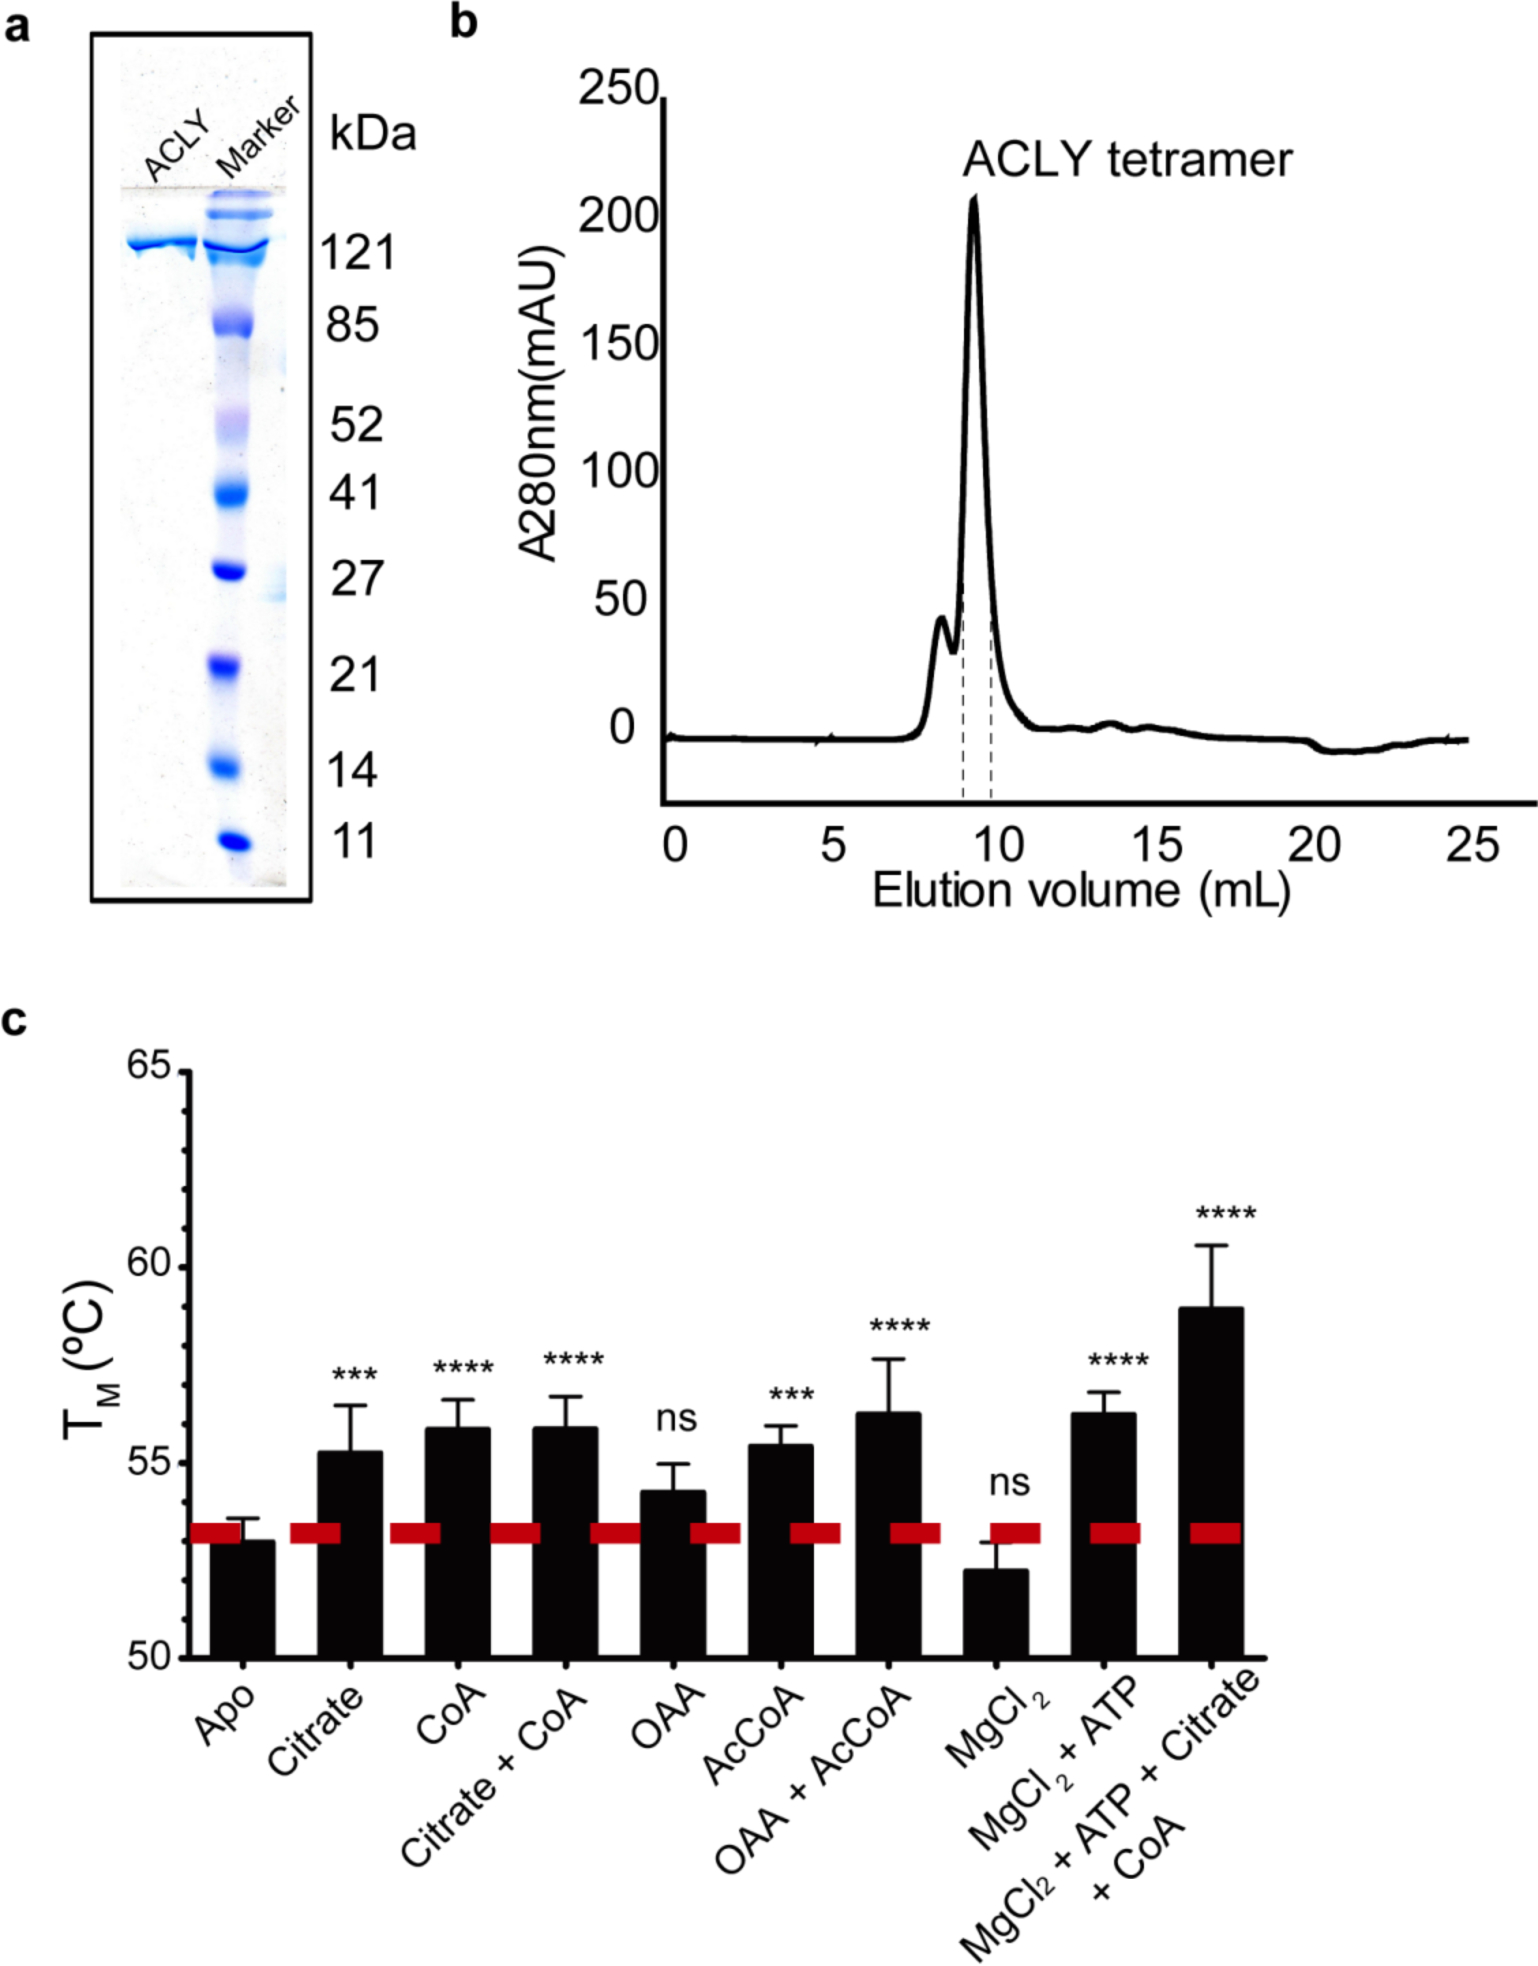
Production of recombinant human ACLY. (a) SDS-PAGE (12% acrylamide) verification of intact, homogeneous human ACLY protein produced in Escherichia coli. (b) Size-exclusion chromatography of ACLY on a superdex 200 increase column. (c) Differential Scanning Fluorimetry (DSF) of ACLY in the absence and presence of metabolite ligands (Mean +/− Standard Deviation, n=3 biologically independent samples). P-values were calculated by two-way ANOVA with Dunnett’s multiple comparisons test.
Extended Data Fig. 2.
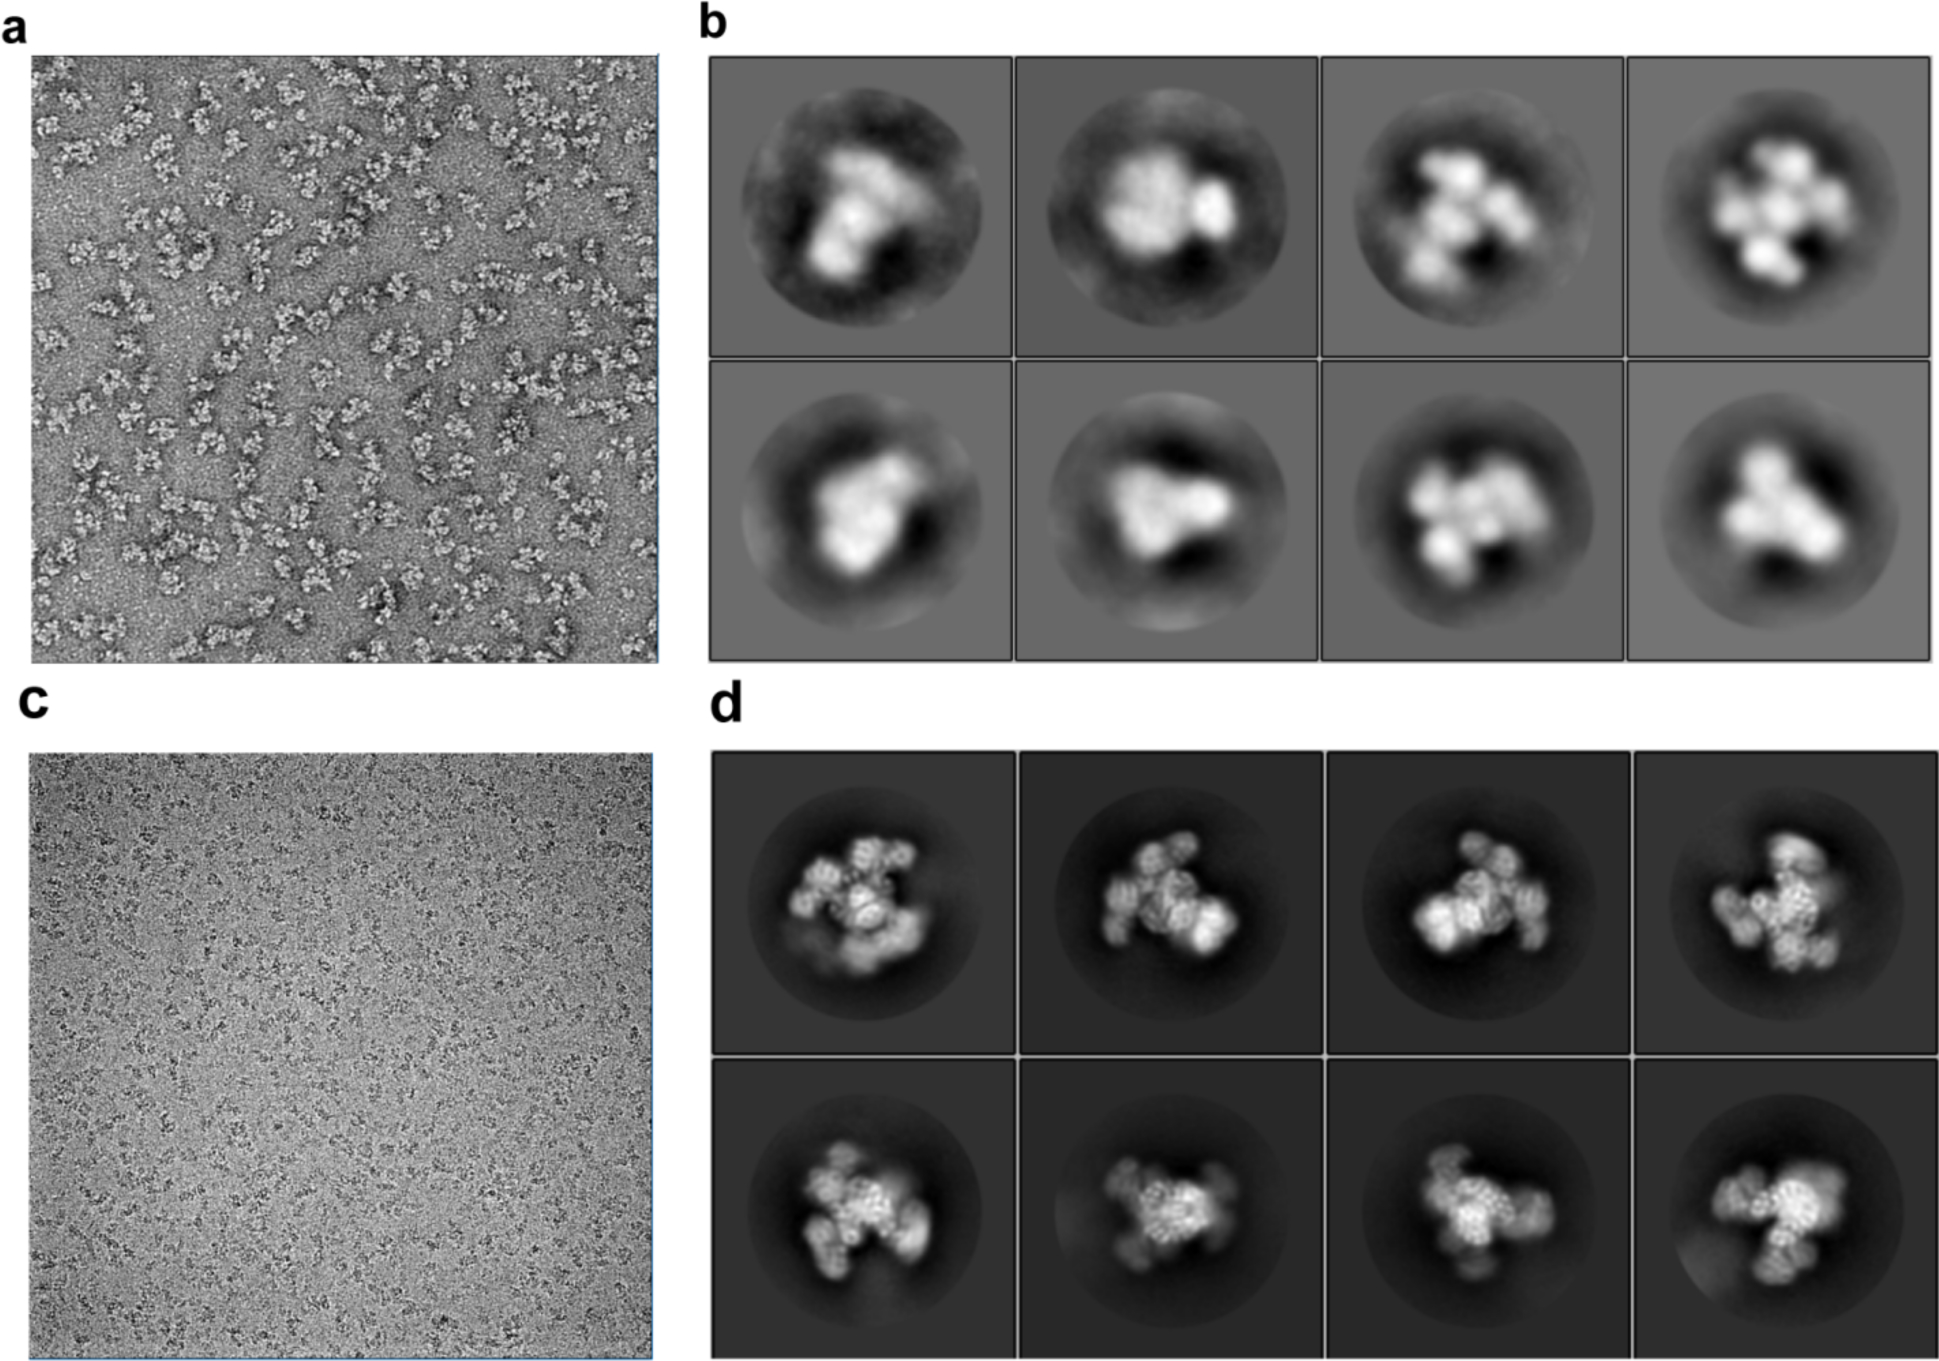
Electron micrographs of ACLY. (a) Representative negative stain images of human ACLY. (b) 2D class average from 3,000 negative stain ACLY (c) Representative cryo-EM images of human ACLY in complex with citrate–CoA. (d) Representative 2D class averages of cryo-EM ACLY particles.
Extended Data Fig. 3.
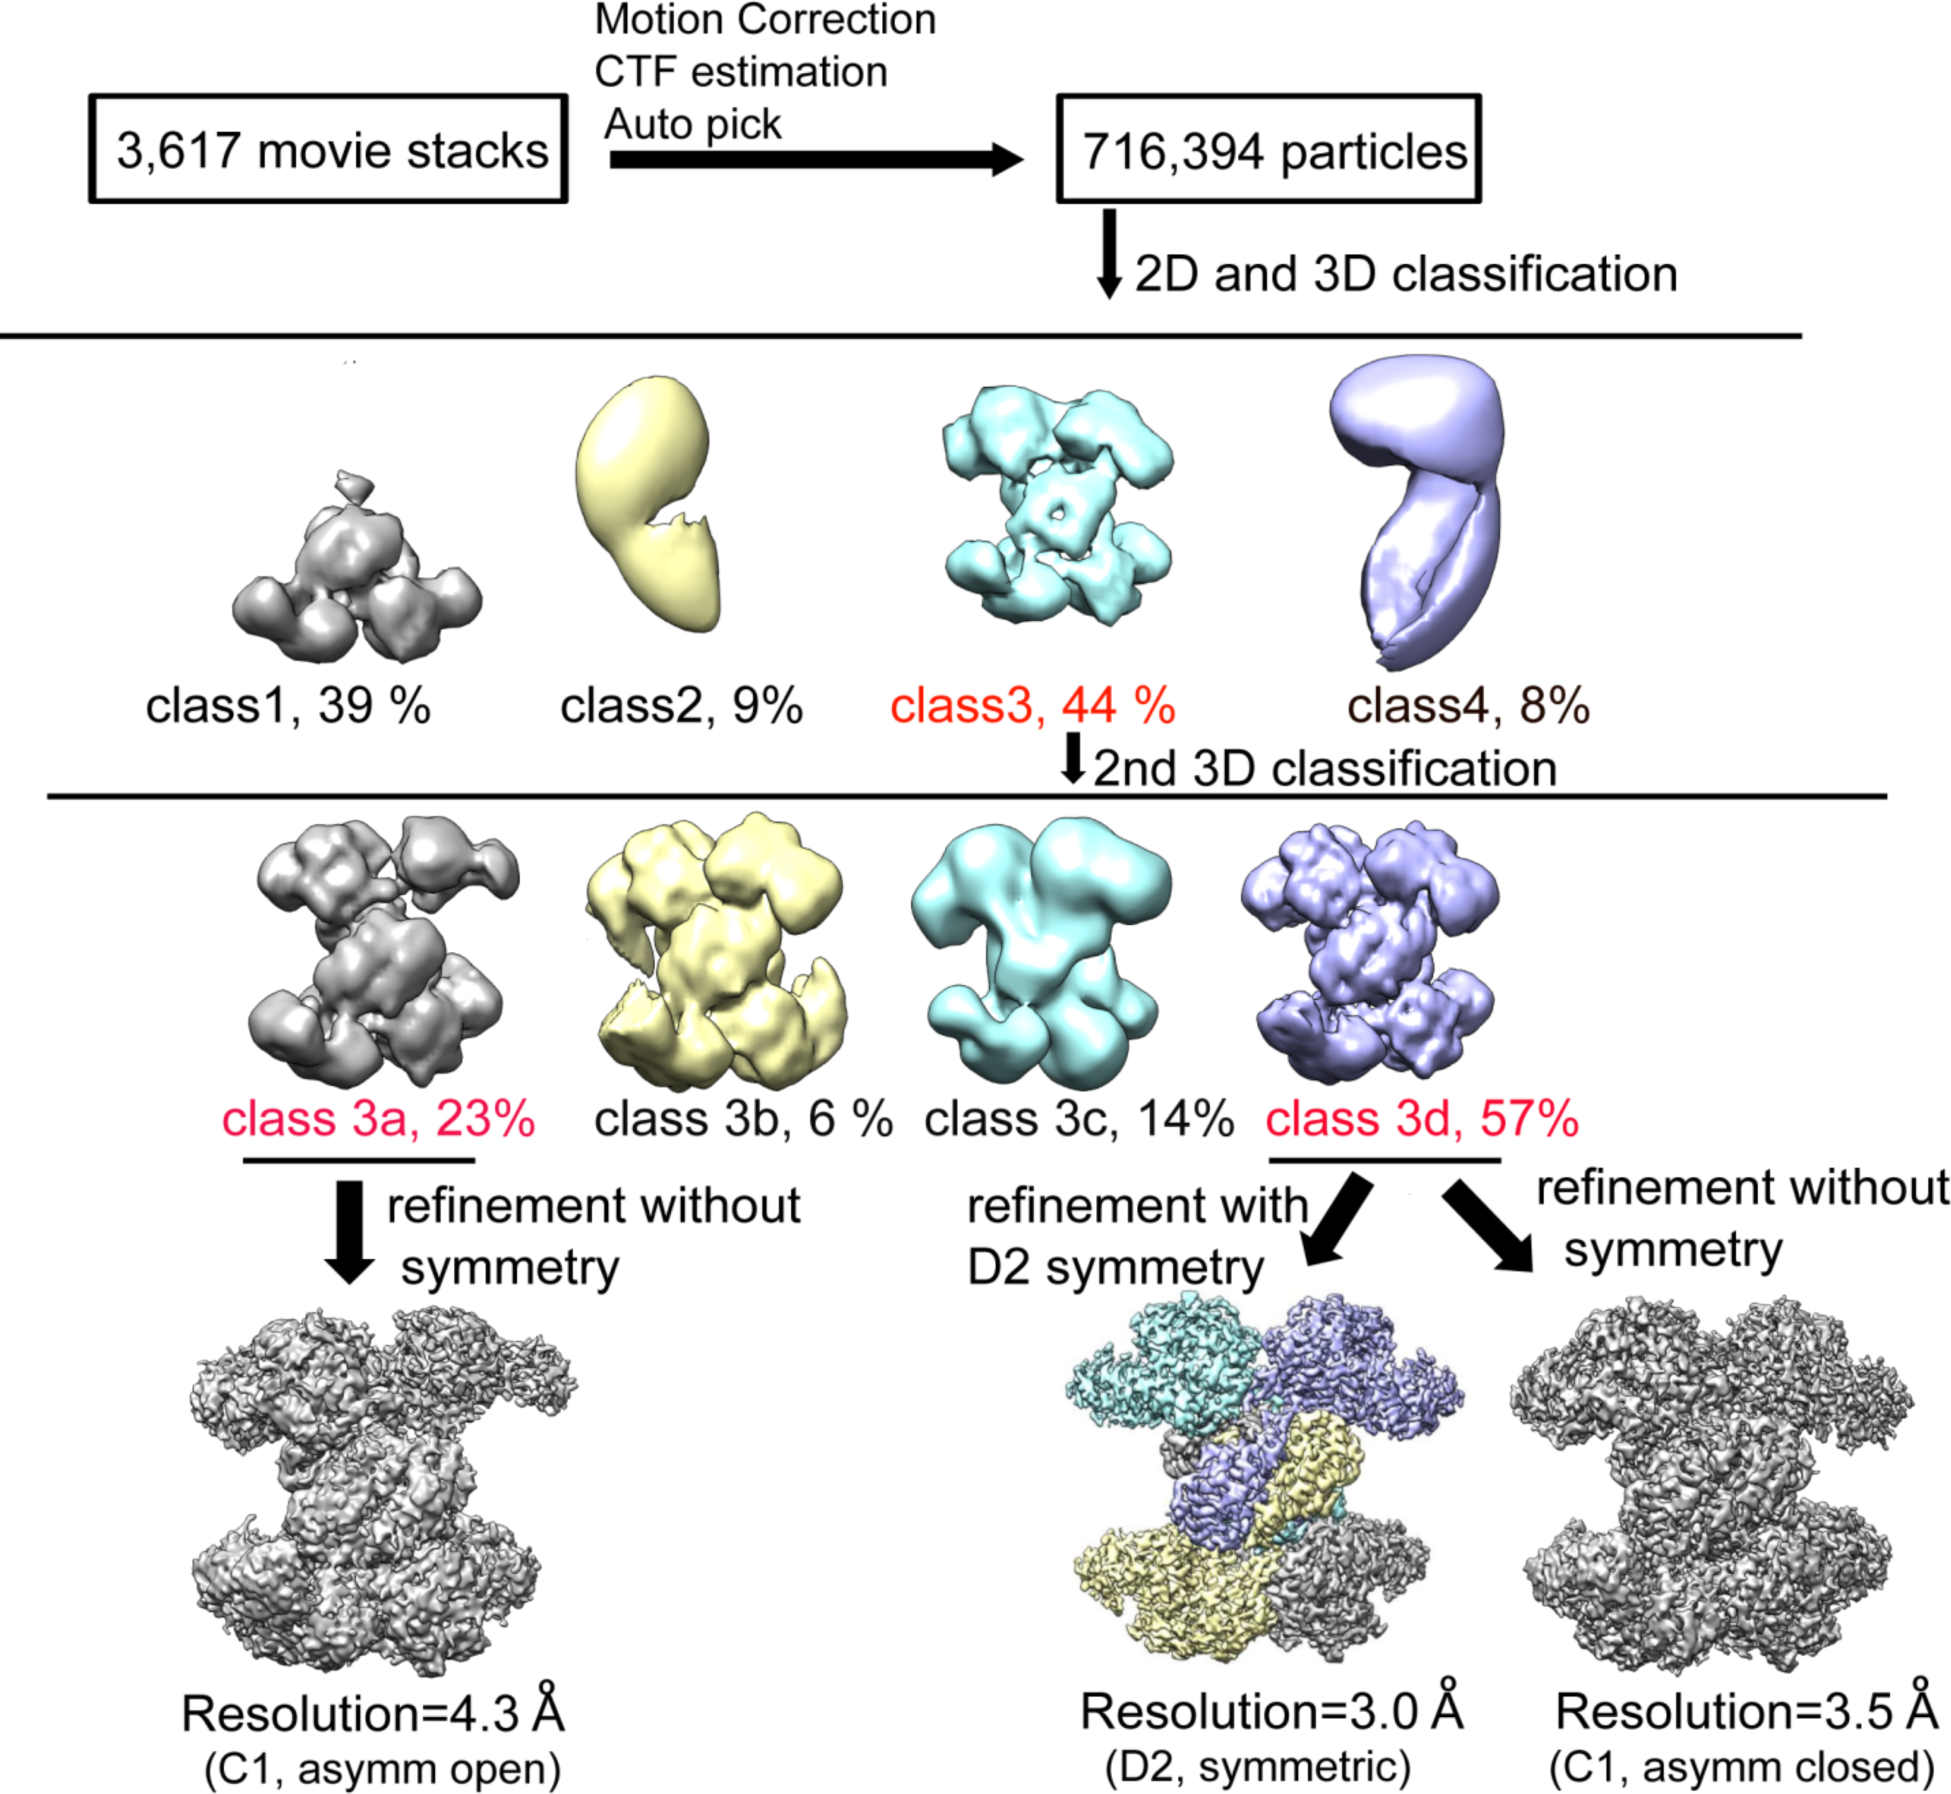
Image processing workflow for single particle reconstruction of ACLY–citrate–CoA.
Extended Data Fig. 4.
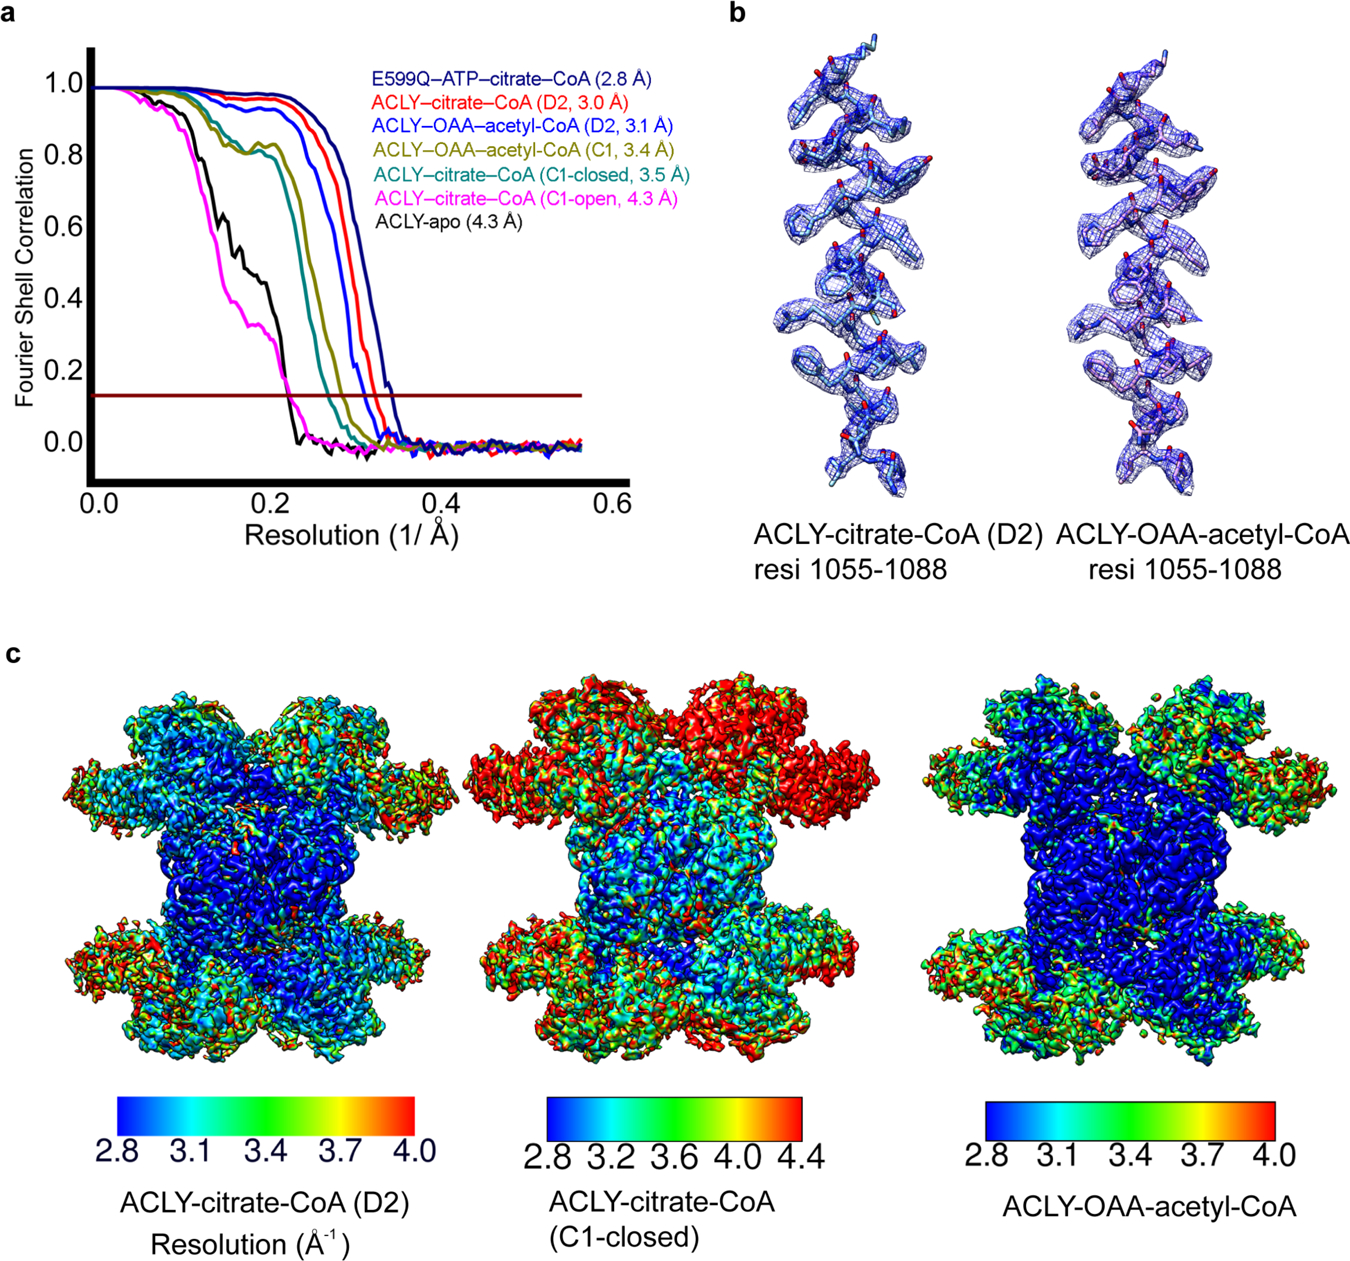
Analysis of single particle cryo-EM reconstructions. (a) Fourier Shell Correlation (FSC) curves for 3D reconstructions of reported structures, marked with resolutions corresponding to FSC = 0.143. (b) Cryo-EM density of representative helical segments (residues 1055–1080) from ACLY–citrate–CoA (left) and ACLY–OAA–acetyl-CoA structures. (c) Local resolution estimation of cryo-EM maps of ACLY–citrate–CoA-D2 (left), ACLY–citrate-CoA-C1 asymm closed (middle) and ACLY–OAA–acetyl-CoA (right) by Resmap.
Extended Data Fig. 5.
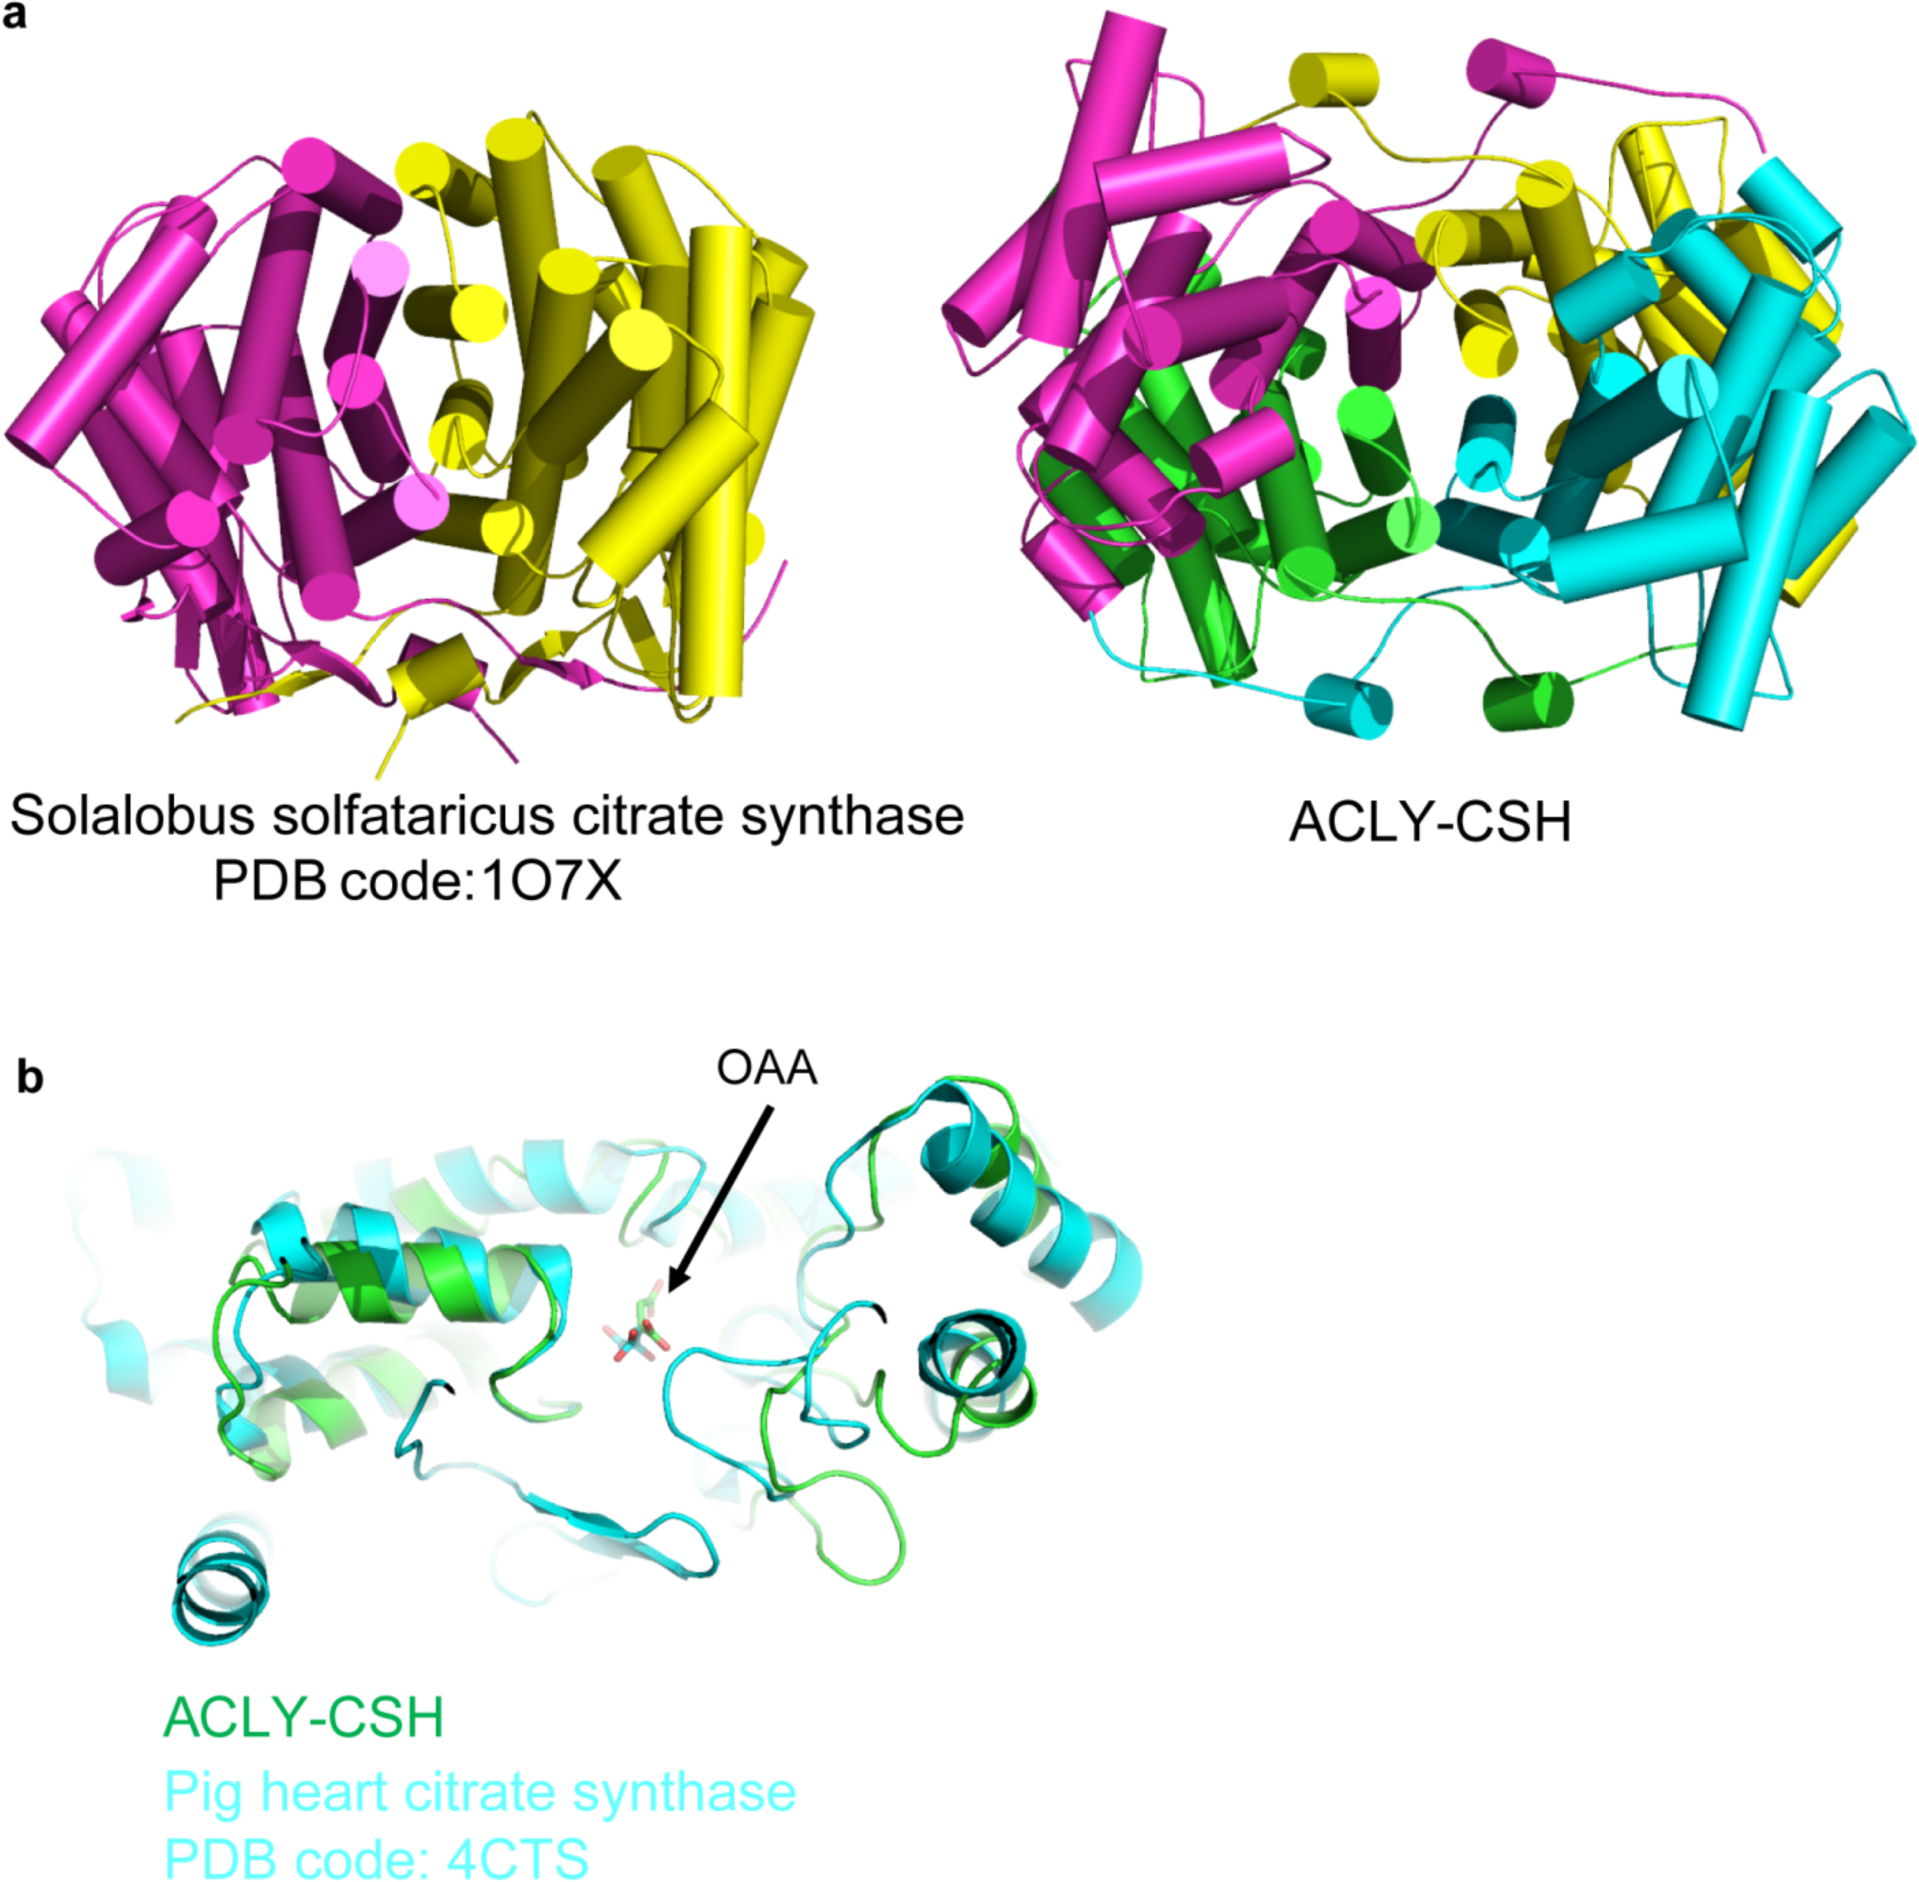
Structural comparison of the CSH module of ACLY with citrate synthase. (a) Side-by-side views of Sulfolobus solfataricus citrate synthase (left) with the ACLY CSH module. (b) Superposition of CSH/OAA2 with pig heart citrate synthase bound to OAA.
Extended Data Fig. 6.
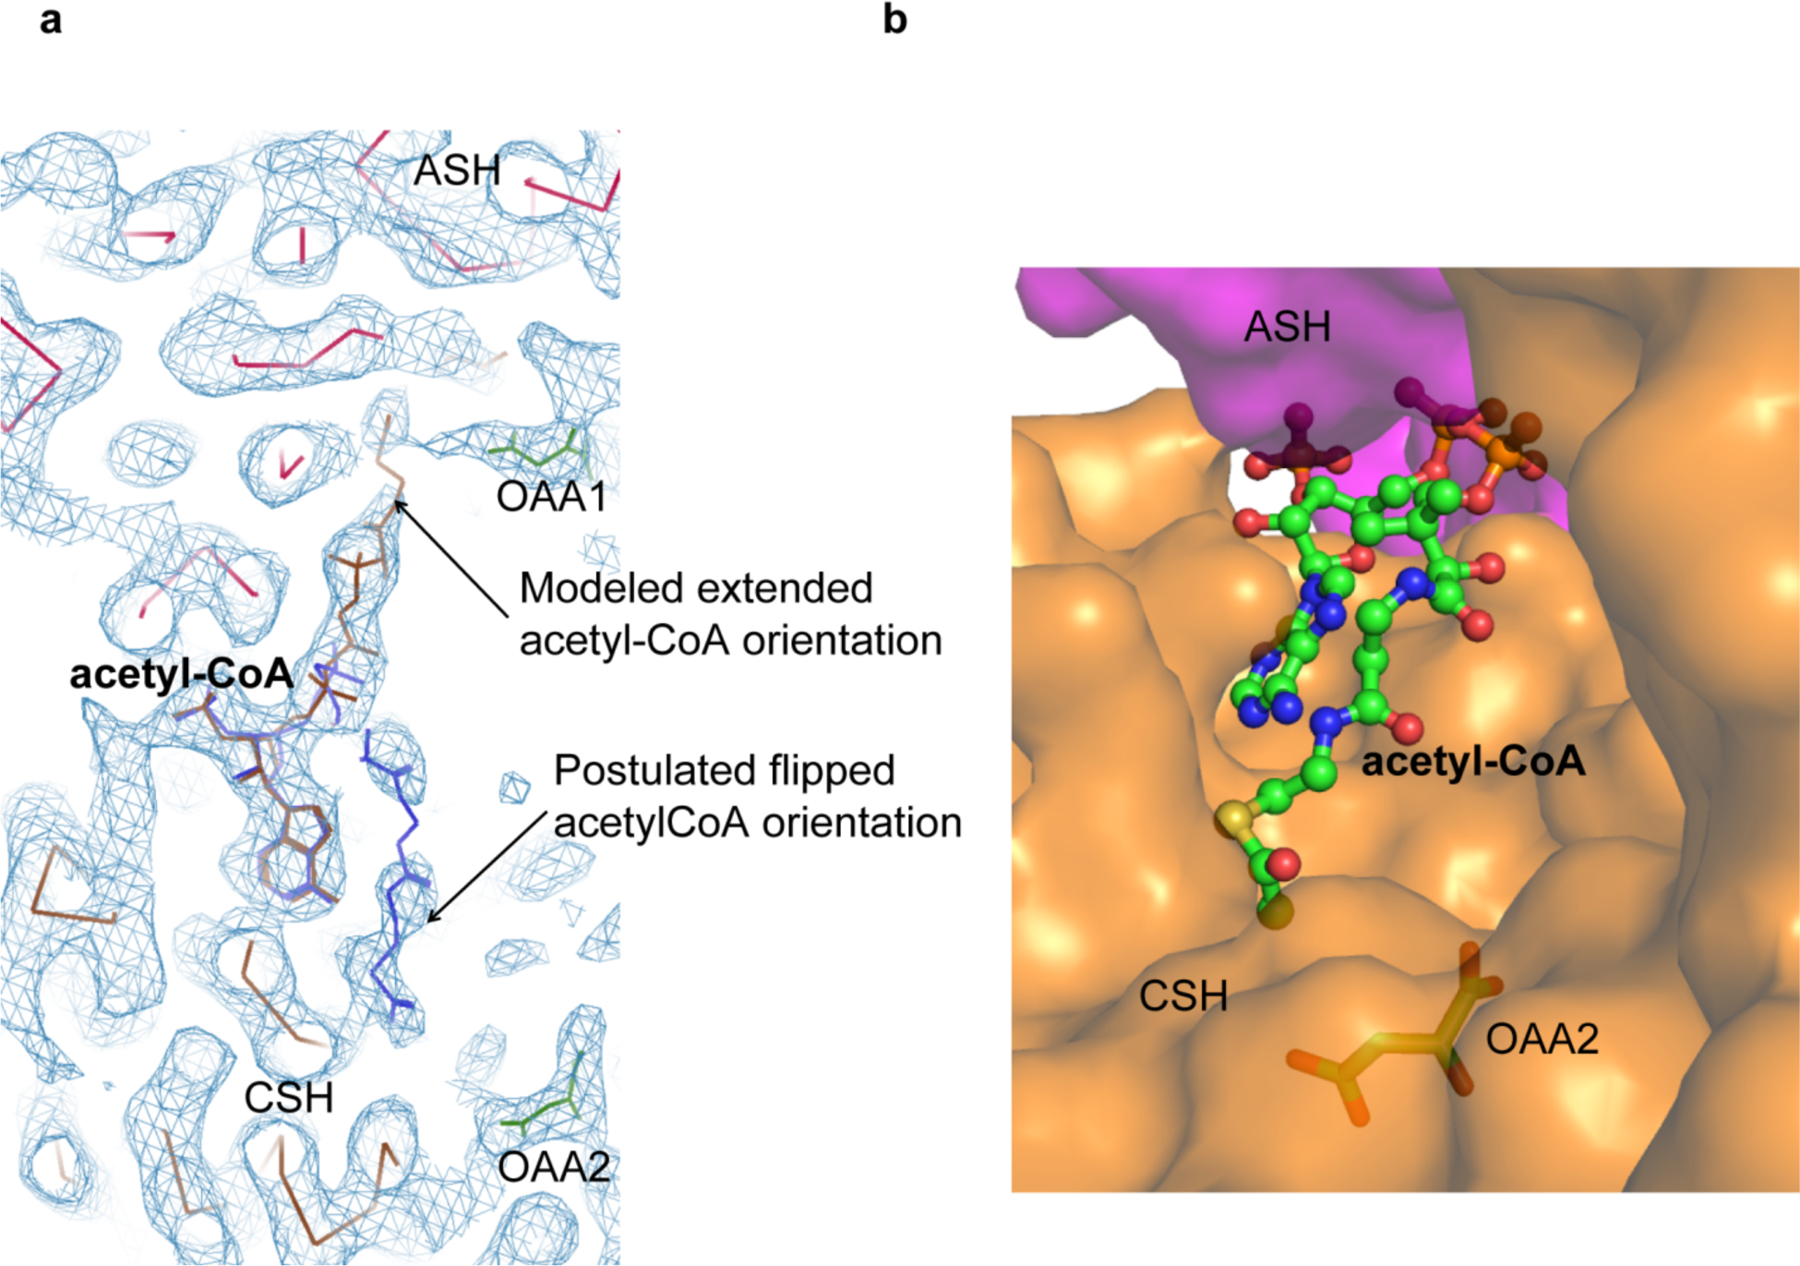
Model of alternative acetyl-CoA orientations against the citrate synthase homology (CSH) domain. (a) Both the extended and “flipped” orientations of acetyl-CoA with the observed cryo-EM density (blue chicken wire) are shown. (b) The flipped orientation of acetyl-CoA is modeled into ACLY-apo showing no significant steric clashes.
Extended Data Fig. 7.
Cryo-EM density of ACLY ligands. (a) CoA in ACLY–CoA–citrate. (b) Acetyl-CoA in ACLY–OAA–acetyl-CoA. (c) Phosphor-citryl-CoA in ACLY-E599Q–ATP–citrate–CoA. (d) Superposition of Acetyl-CoA and Phosphor-citryl-CoA showing movement of F537 as a function of bound intermediate/product.
Supplementary Material
Acknowledgments
Negative staining and Cryo-EM grids screening were carried out in EMRL at Perelman School of Medicine, University of Pennsylvania. We thank B. Zuo and S. Molugu for their help in negative staining and Cryo-EM grids screening. Cryo-EM data collection was carried out at University of Massachusetts Cryo-EM Core Facility. Molecular graphics and structural analyses were performed with UCSF Chimera, developed by the Resource for Biocomputing, Visualization, and Informatics at the University of California, San Francisco, with support from NIH P41-GM103311. We thank K. Song, K. Lee, C. Xu and other staff members at the University of Massachusetts Cryo-EM Core Facility for their support in Cryo-EM data collection; Kathryn Wellen, A. Olia, S. Deng and M Ricketts for helpful discussions; T. Eeuwen and K. Murakami for advice in EM data collection and S. Zeng for organizing cryo-EM data collection trips. This work was supported by NIH grants R35 GM118090 and P01 AG031862 to R.M and NIH grant F31CA189559 to G.B.
Footnotes
Competing Interests Statement
The authors declare no conflict of interests.
Extended Data Movie 1. Side view of ACLY morphed through 4 conformational states reported here (ACLY-apo, ACLY-citrate/CoA, ACLY-E599Q-ATP/citrate/CoA, ACLY-OAA/acetyl-CoA and back to ACLY-apo). CPK-white carbon coloring is used for bound ligands. The binding of ATP and citrate prior to CoA binding is modeled based on the ACLY ASH domain crystal structures bound to citrate (3MWD) and ADP (5TES).
References
- 1.Lee JV, Shah SA & Wellen KE Obesity, cancer, and acetyl-CoA metabolism. Drug Discov Today Dis Mech 10, e55–e61 (2013). [DOI] [PMC free article] [PubMed] [Google Scholar]
- 2.Chypre M, Zaidi N & Smans K ATP-citrate lyase: a mini-review. Biochem Biophys Res Commun 422, 1–4 (2012). [DOI] [PubMed] [Google Scholar]
- 3.Granchi C ATP citrate lyase (ACLY) inhibitors: An anti-cancer strategy at the crossroads of glucose and lipid metabolism. Eur J Med Chem 157, 1276–1291 (2018). [DOI] [PubMed] [Google Scholar]
- 4.Bilen O & Ballantyne CM Bempedoic Acid (ETC-1002): an Investigational Inhibitor of ATP Citrate Lyase. Curr Atheroscler Rep 18, 61 (2016). [DOI] [PMC free article] [PubMed] [Google Scholar]
- 5.Burke AC & Huff MW ATP-citrate lyase: genetics, molecular biology and therapeutic target for dyslipidemia. Curr Opin Lipidol 28, 193–200 (2017). [DOI] [PubMed] [Google Scholar]
- 6.Pinkosky SL et al. Liver-specific ATP-citrate lyase inhibition by bempedoic acid decreases LDL-C and attenuates atherosclerosis. Nat Commun 7, 13457 (2016). [DOI] [PMC free article] [PubMed] [Google Scholar]
- 7.Ray KK et al. Safety and Efficacy of Bempedoic Acid to Reduce LDL Cholesterol. N Engl J Med 380, 1022–1032 (2019). [DOI] [PubMed] [Google Scholar]
- 8.Sanchez LB, Galperin MY & Muller M Acetyl-CoA synthetase from the amitochondriate eukaryote Giardia lamblia belongs to the newly recognized superfamily of acyl-CoA synthetases (Nucleoside diphosphate-forming). J Biol Chem 275, 5794–803 (2000). [DOI] [PubMed] [Google Scholar]
- 9.Bond DR et al. Characterization of citrate synthase from Geobacter sulfurreducens and evidence for a family of citrate synthases similar to those of eukaryotes throughout the Geobacteraceae. Appl Environ Microbiol 71, 3858–65 (2005). [DOI] [PMC free article] [PubMed] [Google Scholar]
- 10.Nguyen NT et al. Comparative analysis of folding and substrate binding sites between regulated hexameric type II citrate synthases and unregulated dimeric type I enzymes. Biochemistry 40, 13177–87 (2001). [DOI] [PubMed] [Google Scholar]
- 11.Singh M, Richards EG, Mukherjee A & Srere PA Structure of ATP citrate lyase from rat liver. Physicochemical studies and proteolytic modification. J Biol Chem 251, 5242–50 (1976). [PubMed] [Google Scholar]
- 12.Walsh CT Jr. & Spector LB Citryl phosphate and the mode of action of the citrate cleavage enzyme. J Biol Chem 244, 4366–74 (1969). [PubMed] [Google Scholar]
- 13.Sun T, Hayakawa K, Bateman KS & Fraser ME Identification of the citrate-binding site of human ATP-citrate lyase using X-ray crystallography. J Biol Chem 285, 27418–28 (2010). [DOI] [PMC free article] [PubMed] [Google Scholar]
- 14.Inoue H, S. F, Fukunishi K, Adachi K, Takeda Y. Studies on ATP Citrate Lyase of Rat Liver: I. Purification and Some Properties. J. Biol. Chem 60, 543–553 (1966). [Google Scholar]
- 15.Inoue H, Suzuki F, Tanioka H & Takeda Y Role of ATP in the ATP citrate lyase reaction. Biochem Biophys Res Commun 26, 602–8 (1967). [DOI] [PubMed] [Google Scholar]
- 16.Inoue H, Suzuki F, Tanioka H & Takeda Y Studies on ATP citrate lyase of rat liver. 3. The reaction mechanism. J Biochem 63, 89–100 (1968). [DOI] [PubMed] [Google Scholar]
- 17.Inoue H, Tsunemi T, Suzuki F & Takeda Y Studies on ATP citrate lyase of rat liver. IV. The role of CoA. J Biochem 65, 889–900 (1969). [DOI] [PubMed] [Google Scholar]
- 18.Srere PA The citrate cleavage enzyme. I. Distribution and purification. J Biol Chem 234, 2544–7 (1959). [PubMed] [Google Scholar]
- 19.Srere PA The Citrate Cleavage Enzyme: II. STOICHIOMETRY SUBSTRATE SPECIFICITY AND ITS USE FOR COENZYME A ASSAY. Journal of Biological Chemistry 236, 50–53 (1961). [Google Scholar]
- 20.Srere PA & Lipmann F AN ENZYMATIC REACTION BETWEEN CITRATE, ADENOSINE TRIPHOSPHATE AND COENZYME A1. Journal of the American Chemical Society 75, 4874–4874 (1953). [Google Scholar]
- 21.Bazilevsky GA et al. ATP-citrate lyase multimerization is required for coenzyme-A substrate binding and catalysis. in J Biol Chem Vol. 294 7259–7268 (2019). [DOI] [PMC free article] [PubMed] [Google Scholar]
- 22.Verschueren KHG et al. Structure of ATP citrate lyase and the origin of citrate synthase in the Krebs cycle. Nature 568, 571–575 (2019). [DOI] [PubMed] [Google Scholar]
- 23.Wei J et al. An allosteric mechanism for potent inhibition of human ATP-citrate lyase. Nature 568, 566–570 (2019). [DOI] [PubMed] [Google Scholar]
- 24.Hu J, Komakula A & Fraser ME Binding of hydroxycitrate to human ATP-citrate lyase. Acta Crystallogr D Struct Biol 73, 660–671 (2017). [DOI] [PubMed] [Google Scholar]
- 25.Wiegand G, Remington S, Deisenhofer J & Huber R Crystal structure analysis and molecular model of a complex of citrate synthase with oxaloacetate and S-acetonyl-coenzyme A. J Mol Biol 174, 205–19 (1984). [DOI] [PubMed] [Google Scholar]
- 26.Pentyala SN & Benjamin WB Effect of oxaloacetate and phosphorylation on ATP-citrate lyase activity. Biochemistry 34, 10961–9 (1995). [DOI] [PubMed] [Google Scholar]
- 27.Rokita SE, Srere PA & Walsh CT 3-fluoro-3-deoxycitrate: a probe for mechanistic study of citrate-utilizing enzymes. Biochemistry 21, 3765–74 (1982). [DOI] [PubMed] [Google Scholar]
- 28.Fan F et al. On the catalytic mechanism of human ATP citrate lyase. Biochemistry 51, 5198–211 (2012). [DOI] [PubMed] [Google Scholar]
- 29.Tanner KG et al. Catalytic mechanism and function of invariant glutamic acid 173 from the histone acetyltransferase GCN5 transcriptional coactivator. J Biol Chem 274, 18157–60 (1999). [DOI] [PubMed] [Google Scholar]
Methods Only References
- 30.Zheng SQ et al. MotionCor2: anisotropic correction of beam-induced motion for improved cryo-electron microscopy. Nat Methods 14, 331–332 (2017). [DOI] [PMC free article] [PubMed] [Google Scholar]
- 31.Zhang K Gctf: Real-time CTF determination and correction. J Struct Biol 193, 1–12 (2016). [DOI] [PMC free article] [PubMed] [Google Scholar]
- 32.Scheres SH RELION: implementation of a Bayesian approach to cryo-EM structure determination. J Struct Biol 180, 519–30 (2012). [DOI] [PMC free article] [PubMed] [Google Scholar]
- 33.Kucukelbir A, Sigworth FJ & Tagare HD Quantifying the local resolution of cryo-EM density maps. Nat Methods 11, 63–5 (2014). [DOI] [PMC free article] [PubMed] [Google Scholar]
- 34.Kim DE, Chivian D & Baker D Protein structure prediction and analysis using the Robetta server. Nucleic Acids Res 32, W526–31 (2004). [DOI] [PMC free article] [PubMed] [Google Scholar]
- 35.Zhang Y I-TASSER server for protein 3D structure prediction. BMC Bioinformatics 9, 40 (2008). [DOI] [PMC free article] [PubMed] [Google Scholar]
- 36.Emsley P, Lohkamp B, Scott WG & Cowtan K Features and development of Coot. Acta Crystallogr D Biol Crystallogr 66, 486–501 (2010). [DOI] [PMC free article] [PubMed] [Google Scholar]
- 37.Afonine PV et al. Real-space refinement in PHENIX for cryo-EM and crystallography. Acta Crystallogr D Struct Biol 74, 531–544 (2018). [DOI] [PMC free article] [PubMed] [Google Scholar]
- 38.Pettersen EF et al. UCSF Chimera--a visualization system for exploratory research and analysis. J Comput Chem 25, 1605–12 (2004). [DOI] [PubMed] [Google Scholar]
- 39.Delano WL The PyMol Molecular Graphics System. (2002). [Google Scholar]
- 40.Linn TC & Srere PA Identification of ATP citrate lyase as a phosphoprotein. J Biol Chem 254, 1691–8 (1979). [PubMed] [Google Scholar]
- 41.Michnik A, Drzazga Z, Kluczewska A & Michalik K Differential scanning microcalorimetry study of the thermal denaturation of haemoglobin. Biophys Chem 118, 93–101 (2005). [DOI] [PubMed] [Google Scholar]
Associated Data
This section collects any data citations, data availability statements, or supplementary materials included in this article.
Supplementary Materials
Data Availability Statement
Structures and EM maps of ACLY-apo (PDB-6POF, EMDB-20414), ACLY–citrate–CoA-D2 (PDB-6UUZ, EMDB-20903), ACLY–citrate–CoA-C1 assym open (PDB-6UIA, EMDB-20784), ACLY–citrate–CoA-C1 assym closed (PDB-6POE, EMDB-20413), ACLY–OAA–acetyl-CoA-C1 (PDB-6UV5, EMDB-20904), ACLY–OAA–acetyl-CoA-D2 (PDB-6UI9, EMDB-20783) and ACLY-E599Q–ATP–citrate–CoA (PDB-6UUW, EMDB-20902) have been deposited to the PDB and EMDB. Source data for Figures 1f, 4d, 4e, 5a and 5b and Extended Data Figure 1c are available with the paper online.