

Abstract
Background
older persons can be grouped according to their objective risk of falling (ORF) and perceived risk of falling (PRF) into ‘vigorous’ (low ORF/PRF), ‘anxious’ (low ORF/high PRF), ‘stoic’ (high ORF/low PRF) and ‘aware’ (high ORF/PRF). Sensor-assessed daily walking activity of these four groups has not been investigated, yet.
Objective
we examined everyday walking activity in those four groups and its association with ORF and PRF.
Design
cross-sectional.
Setting
community.
Subjects
N = 294 participants aged 70 years and older.
Methods
ORF was determined based on multiple independent risk factors; PRF was determined based on the Short Falls Efficacy Scale-International. Subjects were allocated to the four groups accordingly. Linear regression was used to quantify the associations of these groups with the mean number of accelerometer-assessed steps per day over 1 week as the dependent variable. ‘Vigorous’ was used as the reference group.
Results
average number of steps per day in the four groups were 6,339 (‘vigorous’), 5,781 (‘anxious’), 4,555 (‘stoic’) and 4,528 (‘aware’). Compared with the ‘vigorous’, ‘stoic’ (−1,482; confidence interval (CI): −2,473; −491) and ‘aware’ (−1,481; CI: −2,504; −458) participants took significantly less steps, but not the ‘anxious’ (−580 steps; CI: −1,440; 280).
Conclusion
we have integrated a digital mobility outcome into a fall risk categorisation based on ORF and PRF. Steps per day in this sample of community-dwelling older persons were in accordance with their ORF rather than their PRF. Whether this grouping approach can be used for the specification of participants’ needs when taking part in programmes to prevent falls and simultaneously promote physical activity remains to be answered in intervention studies.
Keywords: objective risk of falling, perceived risk of falling, digital mobility outcome, walking activity, older people
Key points
Daily walking activity was in accordance with ORF rather than PRF.
Higher subjective risk was not associated with significantly less steps.
A digital mobility outcome was added into a profile previously based on ORF and PRF.
Introduction
Functional impairment of mobility, gait, strength and balance control are all key risk factors for falls in older populations [1,2], deteriorating with increasing age or progression of age-associated diseases [3]. Of the psychological aspects related to risk of falling, self-perceived risk of falling (PRF) is a key element. Prevalence of PRF ranges between 20 and 92% depending on assessment methodology and study cohort [4,5]. Studies show that PRF is present in older persons who have not yet fallen, whereas not all older persons who have experienced a fall or have high objective risk of falling (ORF) perceive themselves at risk of falling [6–8]. It is especially this disparity which seems problematic, as those who have high ORF may underestimate their actual risk or, on the contrary, those who have a low ORF often restrict their motor activity due to ill-founded perceived risk. Self-reported activity avoidance has been reported as a consequence of PRF as it demonstrably translates into a maladaptive reduction of actual motor behaviour during everyday life, which in turn is associated with reduced motor performance and increased risk of future falls [6]. Prevalence rates of PRF-related activity avoidance vary between 15 and 55% [9].
In 2010, Delbaere et al. [8] introduced a categorisation of older persons regarding their physiological and PRF. They could show that this categorisation is useful to allow individual tailoring of fall prevention interventions. They defined four groups of which two groups had disproportionate physiological risk (according to the physiological profile assessment) and PRF (according to the Falls Efficacy Scale-International (FES-I)), which were designated as ‘anxious’, showing low physiological risk/high PRF, and as ‘stoic’, showing high physiological risk/low PRF. In the other two groups, PRF was aligned with physiological risk, designated as ‘vigorous’, having low physiological risk/low PRF, and ‘aware’, showing high physiological risk/high PRF. Hence, this separation of fall risk into ORF and PRF can be seen as an important and clinically meaningful step to further explore the complexity of fall risk. For the study at hand, we did not use the physiological profile assessment but instead used multiple independent factors to assess ORF.
In persons aged 65 and above, a large proportion of falls occurs during walking activity [1,10], especially in the presence of strong risk factors such as gait and balance impairment [11]. Therefore, walking can be seen as an important mobility outcome and adequate surrogate of exposure to risk of falls [12]. Still, to maintain functional independence, promotion of physical activity is a risk worth accepting as related health and quality-of-life benefits usually outweigh the potential detrimental consequences [13].
The aim of this study is twofold. First, we explore the extent of a digital mobility outcome—sensor-assessed walking activity—in the four groups which were built based on ORF and PRF. Second, we examine which of the two factors—ORF or PRF—has a stronger relationship with decreased everyday walking activity when comparing the low ORF/PRF group (‘vigorous’) with the other three groups. Of particular interest is the question which of the two groups showing disproportionate ORF and PRF differs more from the ‘vigorous’ group: the low ORF/high PRF (‘anxious’) or the high ORF/low PRF (‘stoic’) group.
Methods
Sample
This study is a cross-sectional analysis of baseline data collected in the LiFE-is-LiFE trial (ClinicalTrials.gov: NCT03462654), a multi-centre, single-blinded noninferiority trial conducted in Heidelberg and Stuttgart, Germany, among older adults aged 70 years and above, living at home without having active assistance. Ethical approval for the project was obtained for both study centres (Heidelberg identifier: Schwe20172/1-1; Stuttgart identifier: 723/2017BO2). Some 309 persons who were able to walk at least 200 m with or without walking aid participated in the study, of whom n = 294 were included for the analysis. Of those lost to follow-up, all 15 retracted their consent to participate in the study and to use their data immediately after baseline assessments due to personal issues or because they reportedly felt overwhelmed by the subsequent intervention schedule. To be included in the study, participants had either experienced at least one injurious or >1 non-injurious fall in the year prior to study participation, or—if they had not fallen—were designated as having high fall risk when indicating self-perceived balance decline in the past 12 months (single item question) and needing ≥12 s for the ‘Timed Up-and-Go’ (TUG) [14] test. Falls were defined in accordance with the widely used definition of Lamb et al. [15]. Further information on the study and exclusion criteria can be found elsewhere [16].
Measures
Grouping according to ORF and PRF
In line with the established clinical guidelines [17,18], multiple factors to assess fall risk were considered to distinguish between high and low ORFs. Drawing from a list of independent risk factors for falling from Tinetti and Kumar [13], the strongest independent risk factors, namely, previous falls, balance impairment, gait impairment and multimedication were assessed. Previous falls were measured asking the participant whether s/he had fallen in the past 12 months (yes = 1). Gait and balance impairment was measured using the TUG test [14], the cut-off being 13.5 s (≥13.5 = 1) [19] as well as gait speed of less than 1 m/s (stopwatch) at normal speed [20] when performing the 7-m walk test (<1 m/s = 1). Multimedication was defined as taking four or more medications simultaneously [13] (≥4 medications = 1). As 1-year risk of falling was shown to increase with the number of confirmed risk factors in previous studies [13,21], we used presence of three or more (sum ≥ 3) of the strongest risk factors as a cut-off for high ORF.
Participants’ PRF was assessed using the validated short FES-I [22] (instead of the long version used by Delbaere et al.), assessing concerns about falling when performing certain activities of daily living [23]. Items can be self-rated by the individual from ‘not at all concerned’ (1 point) to ‘very concerned’ (4 points). It ranges between 7 (‘not concerned about falling’) and 28 points (‘very concerned about falling’). PRF cut-points were defined using validated cut-off of 7–10 points (low concern) and 11–28 points (high concern) [24].
Participants were grouped into four groups according to their ORF and PRF following Delbaere et al. [8] (Figure 1).
Figure 1 .
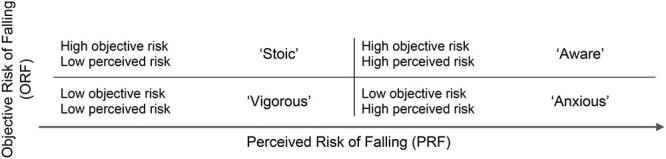
Four groups following Delbaere et al. [8] based on ORF and PRF.
Walking behaviour
Walking behaviour was assessed using ‘activPAL4™ micro’ accelerometers (PAL Technologies Ltd., Glasgow, Scotland) worn on the central front thigh for full 7 days, wrapped in a nitrile finger cot fixed with a waterproof, adhesive and transparent film. The sensor was fixed on Day 1 and removed on Day 9, i.e. Days 2–8 were used for the analysis. Participants were given extra material and a manual on how to reattach the device if it was removed during measurement, and a 9-day diary in which they needed to insert the time they got up in the morning and got to bed in the evening as well as the times they removed and reattached the sensor on a daily basis. Data plausibility was checked for each measurement by matching of these times with sensor data. The device has shown good to excellent reliability and validity [25]. To depict overall walking activity, the average number of steps per day over 1 week was analysed. If the device was removed earlier, data were used if at least two weekdays and the Sunday of the respective week were fully captured [26].
Assessment of participant characteristics
Balance was assessed using the eight-level balance scale [27], which includes basic and higher level balance tasks. Lower body strength was measured using the 30-s chair stand test [28], i.e. counting the number of full chair rises within 30 s. Regarding health status, body mass index (BMI) and number of co-morbidities (any heart-associated diseases, hypertension, stroke, arthrosis, arthritis, pulmonary diseases, osteoporosis, diabetes and neuropsychiatric diseases) were included. Neuropsychological status was assessed using the Montreal Cognitive Assessment (MoCA) [29].
Statistical analyses
Study participants were grouped into four groups according to the multiple independent risk factors and based on their FES-I score, using the proposed cut-offs (where applicable) to distinguish between high and low ORF and high and low PRFs [24], respectively. Descriptive analysis of participant characteristics included the mean and standard deviation (SD) of the respective parameters. Linear regression was conducted with the mean number of steps per day as the dependent variable and with the four groups—‘anxious’, ‘stoic’, ‘aware’ and ‘vigorous’—as explanatory variable (Model 1). By this means, differences in steps per day between the reference group (‘vigorous’) and each of the other three groups were calculated, including 95% confidence intervals (CIs). Model 2 was adjusted for sex, age and number of co-morbidities in a first step; the four groups were added in a second step. Statistical analyses were performed using SPSS (IBM SPSS Statistics, Version 27; Armonk, NY, USA).
Results
Participant characteristics
As shown in Table 1, 48% of the participants belonged to the ‘vigorous’ group, the rest being evenly distributed across the other three groups. The large majority of the participants were female (73%), with the highest proportion of women in the ‘stoic’ group (81%) and the lowest proportion in the ‘vigorous’ group (67%). In the ‘stoic’ and ‘vigorous’ groups, self-reported falls before study participation were lowest with 51%, followed by the ‘anxious (53%) and ‘aware’ (57%). All groups were comparable regarding BMI, sex, percentage of fallers and cognitive status (MoCA). As can be expected, there were significant differences between groups in age, number of co-morbidities, variables used for grouping into high/low ORF and in lower body strength (30-s chair stand) and balance (eight-level balance scale).
Table 1 .
Participant characteristics stratified after the four groups
| N | Vigorous | Anxious | Stoic | Aware | P a |
|---|---|---|---|---|---|
| 141 | 60 | 47 | 46 | ||
| Age, mean ± SD, years 95% CI |
77.8 ± 4.7 77.0; 78.6 |
77.6 ± 5.7 76.1; 79.1 |
81.6 ± 5.5 80.0; 83.3 |
80.5 ± 5.4 78.9; 82.7 |
<0.001 |
| Sex, % female | 67 | 78 | 81 | 76 | 0.145b |
| Fallers, % past year | 51 | 53 | 51 | 57 | 0.926b |
| BMI, mean ± SD, kg/m2 95% CI |
27.0 ± 4.7 26.2; 27.8 |
26.9 ± 4.3 25.8; 28.0 |
27.3 ± 5.6 25.6; 28.9 |
28.0 ± 5.3 26.4; 29.6 |
0.635 |
| MoCA score, mean ± SD 95% CI |
26.2 ± 2.0 25.8; 26.5 |
26.1 ± 2.1 25.6; 26.7 |
25.8 ± 2.1 25.2; 26.4 |
25.7 ± 1.8 25.2; 26.2 |
0.449 |
| Number of co-morbidities, mean ± SD 95% CI |
2.2 ± 1.3 2.0; 2.4 |
2.4 ± 1.2 2.0; 2.7 |
2.9 ± 1.2 2.6; 3.2 |
3.5 ± 1.4 3.1; 3.9 |
<0.001 |
| Number of steps per day, mean ± SD 95% CI |
6,339 ± 2,794 5,874; 6,804 |
5,781 ± 2,958 5,017; 6,546 |
4,555 ± 2,785 3,738; 5,373 |
4,528 ± 2,828 3,690; 5,366 |
<0.001 |
| TUG, mean ± SD 95% CI |
11.4 ± 1.6 11.2; 11.7 |
11.9 ± 1.9 11.4; 12.4 |
16.4 ± 3.7 15.3; 17.5 |
17.6 ± 5.1 16.1; 19.1 |
<0.001 |
| Short FES-I, mean ± SD 95% CI |
8.5 ± 1.0 8.3; 8.7 |
13.1 ± 2.0 12.5; 13.6 |
8.7 ± 1.1 8.3; 9.0 |
13.7 ± 3.4 13.2; 14.2 |
<0.001 |
| Normal walking speed, mean ± SD, m/s 95% CI |
1.1 ± 0.1 1.1; 1.2 |
1.1 ± 0.1 1.1; 1.1 |
0.9 ± 0.1 0.8; 0.9 |
0.8 ± 0.2 0.8; 0.9 |
<0.001 |
| Eight-level balance scale, mean ± SD 95% CI |
4.7 ± 1.3 4.5; 5.0 |
4.4 ± 1.4 4.1; 4.8 |
3.6 ± 1.4 3.2; 4.0 |
3.3 ± 1.4 2.9; 3.8 |
<0.001 |
| 30-s Chair stand, mean ± SD 95% CI |
9.9 ± 2.8 9.5; 10.4 |
9.1 ± 3.3 8.3; 10.0 |
8.5 ± 4.6 7.2; 9.9 |
6.5 ± 3.5 5.5; 7.6 |
<0.001 |
m/s, metres per second.
aone-way ANOVA.
bPearson Chi2.
Walking activity per group
Of the 294 persons in the analysis, 268 (91.2%) completed the full 7 days, 23 (7.8%) had 6 days, including Sunday, and 3 (1%) persons had 4 days, including Sunday. Persons in the ‘vigorous’ group performed most steps on average per day (mean = 6,339; 95% CI: 5,874; 6,804). In descending order, they were followed by those defined as ‘anxious’ (mean = 5,781; 95% CI: 5,017; 6,546), ‘stoic’ (mean = 4,555; 95% CI: 3,738; 5,373) and ‘aware’ (mean = 4,528; 95% CI: 3,690; 5,366) (see Figure 1).
Comparison of walking activity between groups
Linear regression results are presented in Table 2. Adjustment for age, sex and number of co-morbidities did not alter the resultant models significantly. All assumptions of linear regression were met (data not shown). Comparing the ‘vigorous’ group to the two groups showing disparities between ORF and PRF in the adjusted Model 2, it was the group showing high ORF/low PRF (‘stoic’) that took significantly less steps (−1,482; 95% CI: −2,473; −491), but not the ‘anxious’ group with low ORF/high PRF (−580 steps; 95% CI: −1,440; 280). Differences in the number of steps in the ‘aware’ group were very similar to the ‘stoic’ group (1,481 steps less than the ‘vigorous’ (95% CI: −2,504; −458)).
Table 2 .
Association between risk group (vigorous group as reference) and mean number of steps per day using a linear regression model. Model 2 was adjusted for age, sex and number of co-morbidities
| Mean number of steps per day | Model 1 | Model 2 (adjusted) |
|---|---|---|
| vigorous-anxious | −557.4 (−1,416.2; 301.4) | −579.8 (−1,440.0; 280.3) |
| vigorous-stoic | −1,783.4 (−2,721.8; −844.9) | −1,481.7 (−2,472.6; −490.8) |
| vigorous-aware | −1,811.0 (−2,757.1; −865.0) | −1,480.8 (−2,503.5; −458.1) |
| Adjusted R2 (n = 294) | 0.063 (P < 0.001) | 0.072 (P = 0.006) |
To sum up the results, there was no significant difference in the mean steps per day over 1 week between the two groups showing low ORF, although the step values were higher in those additionally showing low PRF (‘vigorous’) compared to those with high PRF (‘anxious’) (Figure 2). When comparing those showing high ORF (‘stoic’ and ‘aware’) with those being ‘vigorous’, both groups on average took significantly fewer steps per day over 1 week. There was practically no difference between those additionally having high PRF (‘aware’) and those with low PRF (‘stoic’).
Figure 2 .
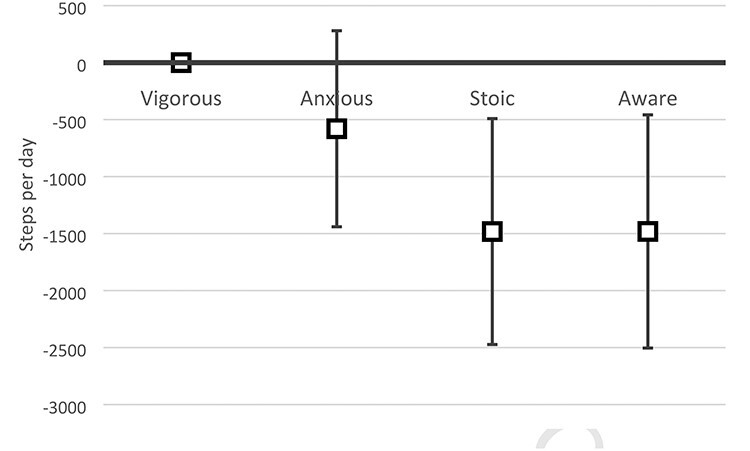
Difference in mean steps per day according to the linear regression between those designated as ‘vigorous’ and the other three groups, including 95% CIs.
Discussion
In this study, we presented the actual walking activity over 1 week in a sample of older persons with a history or risk of falling, who were categorised according to their ORF and PRF. In doing so, we have included a digital mobility outcome in terms of daily walking activity into a profile previously based solely on ORF and PRF.
Walking activity
With on average 5,656 steps per day across all four groups, our sample was comparable to other studies using accelerometry in older adults of similar age, showing 4,992 steps per day in men [30] and 5,499 steps per day in women [31]. The two groups with the high ORF took fewest steps per day, irrespective of high or low PRF; those with low ORF and low PRF (‘vigorous’) took most steps, and those with high ORF and high PRF (‘aware’) took the fewest. In those two groups showing disparities between both factors, high ORF and not high PRF was associated with a significant difference in walking activity compared to the reference group (‘vigorous’). Considering that the ‘aware’ and ‘stoic’ were the least active in terms of walking activity, these are to be seen as the high risk group for negative effects associated with low physical activity.
Association between ORF/PRF and walking activity
The two groups showing low ORF took most steps, not those showing low PRF, suggesting that ORF has a stronger relation to walking behaviour than PRF. One may see this as a positive finding for two reasons: first, there is stronger evidence supporting decreases in the (objective) risk of falling by means of physical exercise [3] than there is on reducing PRF by any means [32]. Second, low PRF is not related to overly increased walking activity in those with high ORF, who seem not to overestimate their functional capacity. This is very important considering that physical activity, and here especially walking activity, resonates with the higher risk exposure [10]. However, a U-shape of the relation between physical activity and fall risk has been discussed, but results on this issue remain controversial [33,34]. There could be certain low and high thresholds of the amount of steps and the relation to fall risk. A positive association between walking activity and risk of falls was found in older men without mobility limitations (comparable to our ‘vigorous’ and ‘anxious’ group), but not in those with mobility limitations (comparable to ‘aware’ and ‘stoic’) [30]. Consequently, future research should investigate how these four groups respond to intervention measures. It may be that each group has different needs when it comes to finding optimal levels of physical activity and fall risk. It is unclear whether especially the latter two groups may improve their physical activity without raising actual falls. As suggested in other work, it might be that geriatric syndromes with strong relation to falls such as frailty [35] act as a moderator of the relationship between the motor function and walking activity [36]. However, this was the case in a frail subsample that was older and had inferior motor function than the oldest subgroup (‘stoic’) in the present work. Our data also show that the activity-restricting effect of PRF tends to being higher in those with low ORF (8.8%; unadjusted difference between ‘vigorous’ and ‘anxious’) than in those with high ORF (0.6%; unadjusted difference between ‘stoic’ and ‘aware’). Although insignificant in both cases, especially the difference of 580 steps per day between the low ORF groups—‘vigorous’ and ‘anxious’—may still be clinically relevant.
Strengths and limitations
There are some strengths of this study. To allocate study participants into the four groups, we have used evidence-based cut-offs where applicable, which distinguish between high/low ORF and PRF. Another strength was the direct, sensor-based measurement of physical activity over 1 full week in more than 90% of the participants, which exceeds previous recommendations in terms of measurement duration [37]. The device used in this study was shown to be less obtrusive than other comparable devices [38].
One may see a limitation in the fact that we have used the accumulated number of steps averaged per day. There is emerging evidence that there may be a difference in fall risk when differentiating between sporadic (<10 min) and bouted physical activities (>10 min) [34]; sporadic physical activity seems less fall-endangering than bouted physical activity. We did not use the Physiological Profile Assessment to determine ORF as was done by Delbaere et al., which could have led to different group compositions than in their study. Instead, we have used an approach taking into account the multiple independent risk factors for falling. These may not cover all relevant aspects related to ORF, but in their sum, can well discriminate between older people with high and low fall risks [13,21]. Regarding the FES-I, we acknowledge that the cut-off to distinguish between high and low PRFs has not been evaluated on a large scale. However, when comparing high and low PRF groups, there is a clear gap between the CIs of short FES-I scores (Table 1), suggesting that even if the cut-offs were inaccurate, there are somewhat large differences in the short FES-I scores between the participants allocated into high and low PRF groups in our sample. Looking at the age of the participants, those in the low ORF groups were somewhat younger (>3 years) than those in the high ORF groups. It may be that age is some sort of separator of our cohort and that the low ORF groups will align within the following years in terms of ORF and PRF. Lastly, our findings apply to independent-living seniors and may not be applicable to other cohorts, e.g. those with cognitive impairment, advanced geriatric syndromes or neurological diseases.
Conclusion
We saw that those with congruently low ORF and PRF took most steps per day, whereas those with congruently high ORF and PRF took the fewest. Drawing from the results of the two groups with disproportionate ORF and PRF, low ORF was more closely linked to higher walking activity than low PRF. This underlines that older community dwellers seem to behave in accordance with their ORF rather than with their PRF. Whether this grouping approach can be used for the specification of the participants’ needs when taking part in programmes to prevent falls and simultaneously promote physical activity remains to be answered in the intervention studies. The same applies to the question how walking behaviour is predictive of actual falls when applying the grouping procedure used in this study.
Contributor Information
Carl-Philipp Jansen, Network Aging Research, Heidelberg University, Heidelberg, Germany.
Jochen Klenk, Department of Clinical Gerontology and Geriatric Rehabilitation, Robert Bosch Hospital, Stuttgart, Germany; Institute of Epidemiology and Medical Biometry, Ulm University, Ulm, Germany; IB University of Applied Health and Social Sciences, Study Centre Stuttgart, Stuttgart, Germany.
Corinna Nerz, Department of Clinical Gerontology and Geriatric Rehabilitation, Robert Bosch Hospital, Stuttgart, Germany.
Chris Todd, Faculty of Biology, Medicine and Health, School of Health Sciences, The University of Manchester, Manchester, UK; Manchester University NHS Foundation Trust, Manchester, UK; Manchester Academic Health Science Centre, Manchester, UK.
Sarah Labudek, Network Aging Research, Heidelberg University, Heidelberg, Germany.
Franziska Kramer-Gmeiner, Network Aging Research, Heidelberg University, Heidelberg, Germany.
Clemens Becker, Department of Clinical Gerontology and Geriatric Rehabilitation, Robert Bosch Hospital, Stuttgart, Germany.
Michael Schwenk, Network Aging Research, Heidelberg University, Heidelberg, Germany.
Declaration of Conflicts of Interest
None.
Declaration of Sources of Funding
This work was supported by the German Federal Ministry of Education and Research (grant number 01GL1705A-D) and from the Cusanuswerk (to S.L.). The content of this paper is the responsibility of the authors. The funders did not take any part in this work.
References
- 1.Tinetti ME, Speechley M, Ginter SF. Risk factors for falls among elderly persons living in the community. N Engl J Med 1988Dec 29; 319: 1701–7. [DOI] [PubMed] [Google Scholar]
- 2.Grossman DC, Curry SJ, Owens DKet al. Interventions to prevent falls in community-dwelling older adults: US preventive services task force recommendation statement. JAMA 2018Apr 24; 319: 1696–704. [DOI] [PubMed] [Google Scholar]
- 3.Sherrington C, Fairhall NJ, Wallbank GKet al. Exercise for preventing falls in older people living in the community. Cochrane Database Syst Rev 2019Jan 31; 1: 1–582, Cd012424. [DOI] [PMC free article] [PubMed] [Google Scholar]
- 4.Scheffer AC, Schuurmans MJ, Dijk N, Hooft T, Rooij SE. Fear of falling: measurement strategy, prevalence, risk factors and consequences among older persons. Age Ageing 2008; 37: 19–24. [DOI] [PubMed] [Google Scholar]
- 5.Landers MR, Oscar S, Sasaoka J, Vaughn K. Balance confidence and fear of falling avoidance behavior are most predictive of falling in older adults: prospective analysis. Phys Ther 2016Apr; 96: 433–42. [DOI] [PubMed] [Google Scholar]
- 6.Delbaere K, Crombez G, Vanderstraeten G, Willems T, Cambier D. Fear-related avoidance of activities, falls and physical frailty. A prospective community-based cohort study. Age Ageing 2004Jul; 33: 368–73. [DOI] [PubMed] [Google Scholar]
- 7.Bruce DG, Devine A, Prince RL. Recreational physical activity levels in healthy older women: the importance of fear of falling. J Am Geriatr Soc 2002Jan; 50: 84–9. [DOI] [PubMed] [Google Scholar]
- 8.Delbaere K, Close JCT, Brodaty H, Sachdev P, Lord SR. Determinants of disparities between perceived and physiological risk of falling among elderly people: cohort study. BMJ 2010; 341: c4165. [DOI] [PMC free article] [PubMed] [Google Scholar]
- 9.Zijlstra GA, Haastregt JC, Eijk JT, van Rossum E, Stalenhoef PA, Kempen GIJM. Prevalence and correlates of fear of falling, and associated avoidance of activity in the general population of community-living older people. Age Ageing 2007May; 36: 304–9. [DOI] [PubMed] [Google Scholar]
- 10.Berg WP, Alessio HM, Mills EM, Tong C. Circumstances and consequences of falls in independent community-dwelling older adults. Age Ageing 1997Jul; 26: 261–8. [DOI] [PubMed] [Google Scholar]
- 11.Ambrose AF, Paul G, Hausdorff JM. Risk factors for falls among older adults: a review of the literature. Maturitas 2013May; 75: 51–61. [DOI] [PubMed] [Google Scholar]
- 12.Klenk J, Kerse N, Rapp Ket al. Physical activity and different concepts of fall risk estimation in older people--results of the ActiFE-Ulm study. PLoS One 2015; 10: 1–11, e0129098. [DOI] [PMC free article] [PubMed] [Google Scholar]
- 13.Tinetti ME, Kumar C. The patient who falls: “It’s always a trade-off”. JAMA 2010Jan 20; 303: 258–66. [DOI] [PMC free article] [PubMed] [Google Scholar]
- 14.Podsiadlo D, Richardson S. The timed “Up & Go”: a test of basic functional mobility for frail elderly persons. J Am Geriatr Soc 1991Feb; 39: 142–8. [DOI] [PubMed] [Google Scholar]
- 15.Lamb SE, Jorstad-Stein EC, Hauer K, Becker C. Development of a common outcome data set for fall injury prevention trials: the Prevention of Falls Network Europe consensus. J Am Geriatr Soc 2005Sep; 53: 1618–22. [DOI] [PubMed] [Google Scholar]
- 16.Jansen CP, Nerz C, Kramer Fet al. Comparison of a group-delivered and individually delivered lifestyle-integrated functional exercise (LiFE) program in older persons: a randomized noninferiority trial. BMC Geriatr 2018Nov 6; 18: 267. [DOI] [PMC free article] [PubMed] [Google Scholar]
- 17.Panel on Prevention of Falls in Older Persons, American Geriatrics Society and British Geriatrics Society.. Summary of the updated American Geriatrics Society/British Geriatrics Society clinical practice guideline for prevention of falls in older persons. J Am Geriatr Soc 2011Jan; 59: 148–57. [DOI] [PubMed] [Google Scholar]
- 18.National Institut for Health and Care Excellence . Falls in older people: assessing risk and prevention 2013. Clinical guideline [CG161]. https://www.nice.org.uk/guidance/CG161 (5 December 2020, date last accessed). [PubMed]
- 19.Shumway-Cook A, Brauer S, Woollacott M. Predicting the probability for falls in community-dwelling older adults using the Timed Up & Go Test. Phys Ther 2000; 80: 896–903. [PubMed] [Google Scholar]
- 20.Tiedemann A, Shimada H, Sherrington C, Murray S, Lord S. The comparative ability of eight functional mobility tests for predicting falls in community-dwelling older people. Age Ageing 2008Jul; 37: 430–5. [DOI] [PubMed] [Google Scholar]
- 21.Robbins AS, Rubenstein LZ, Josephson KR, Schulman BL, Osterweil D, Fine G. Predictors of falls among elderly people. Results of two population-based studies. Arch Intern Med 1989Jul; 149: 1628–33. [PubMed] [Google Scholar]
- 22.Kempen GI, Yardley L, Haastregt JCet al. The short FES-I: a shortened version of the falls efficacy scale-international to assess fear of falling. Age Ageing 2008Jan; 37: 45–50. [DOI] [PubMed] [Google Scholar]
- 23.Yardley L, Beyer N, Hauer K, Kempen G, Piot-Ziegler C, Todd C. Development and initial validation of the Falls Efficacy Scale-International (FES-I). Age Ageing 2005Nov; 34: 614–9. [DOI] [PubMed] [Google Scholar]
- 24.Delbaere K, Close JCT, Mikolaizak AS, Sachdev PS, Brodaty H, Lord SR. The Falls Efficacy Scale International (FES-I). A comprehensive longitudinal validation study. Age Ageing 2010; 39: 210–6. [DOI] [PubMed] [Google Scholar]
- 25.Ryan CG, Grant PM, Tigbe WW, Granat MH. The validity and reliability of a novel activity monitor as a measure of walking. Br J Sports Med 2006Sep; 40: 779–84. [DOI] [PMC free article] [PubMed] [Google Scholar]
- 26.Klenk J, Peter RS, Rapp Ket al. Lazy Sundays: role of day of the week and reactivity on objectively measured physical activity in older people. Eur Rev Aging Phys Act 2019; 16: 18. [DOI] [PMC free article] [PubMed] [Google Scholar]
- 27.Clemson L, Fiatarone Singh MA, Bundy Aet al. Integration of balance and strength training into daily life activity to reduce rate of falls in older people (the LiFE study): randomised parallel trial. BMJ 2012Aug 7; 345: 1–15, e4547. [DOI] [PMC free article] [PubMed] [Google Scholar]
- 28.Jones CJ, Rikli RE, Beam WC. A 30-s chair-stand test as a measure of lower body strength in community-residing older adults. Res Q Exerc Sport 1999Jun; 70: 113–9. [DOI] [PubMed] [Google Scholar]
- 29.Nasreddine ZS, Phillips NA, Bedirian Vet al. The Montreal Cognitive Assessment, MoCA: a brief screening tool for mild cognitive impairment. J Am Geriatr Soc 2005Apr; 53: 695–9. [DOI] [PubMed] [Google Scholar]
- 30.Jefferis BJ, Merom D, Sartini Cet al. Physical activity and falls in older men: the critical role of mobility limitations. Med Sci Sports Exerc 2015Oct; 47: 2119–28. [DOI] [PMC free article] [PubMed] [Google Scholar]
- 31.Lee IM, Shiroma EJ, Kamada M, Bassett DR, Matthews CE, Buring JE. Association of step volume and intensity with all-cause mortality in older women. JAMA Intern Med 2019; 179: 1105–12. [DOI] [PMC free article] [PubMed] [Google Scholar]
- 32.Kendrick D, Kumar A, Carpenter Het al. Exercise for reducing fear of falling in older people living in the community. Cochrane Database Syst Rev 2014: CD009848. [DOI] [PMC free article] [PubMed] [Google Scholar]
- 33.Peeters GM, Schoor NM, Pluijm SM, Deeg DJ, Lips P. Is there a U-shaped association between physical activity and falling in older persons? Osteoporos Int 2010Jul; 21: 1189–95. [DOI] [PMC free article] [PubMed] [Google Scholar]
- 34.Lu Z, Lam FMH, Leung JCS, Kwok TCY. The U-shaped relationship between levels of bouted activity and fall incidence in community-dwelling older adults: a prospective cohort study. J Gerontol A 2020; 75: e145–51. [DOI] [PMC free article] [PubMed] [Google Scholar]
- 35.Kojima G. Frailty as a predictor of future falls among community-dwelling older people: a systematic review and meta-analysis. J Am Med Dir Assoc 2015Dec; 16: 1027–33. [DOI] [PubMed] [Google Scholar]
- 36.Jansen C-P, Toosizadeh N, Mohler MJ, Najafi B, Wendel C, Schwenk M. The association between motor capacity and mobility performance: frailty as a moderator. Eur Rev Aging Phys Act 20192019/10/10; 16: 16. [DOI] [PMC free article] [PubMed] [Google Scholar]
- 37.Hart TL, Swartz AM, Cashin SE, Strath SJ. How many days of monitoring predict physical activity and sedentary behaviour in older adults? Int J Behav Nutr Phys Act 2011Jun 16; 8: 62. [DOI] [PMC free article] [PubMed] [Google Scholar]
- 38.Brakenridge CL, Healy GN, Winkler EA, Fjeldsoe BS. Usage, acceptability, and effectiveness of an activity tracker in a randomized trial of a workplace sitting intervention: mixed-methods evaluation. Interact J Med Res 2018Mar 2; 7: e5. [DOI] [PMC free article] [PubMed] [Google Scholar]