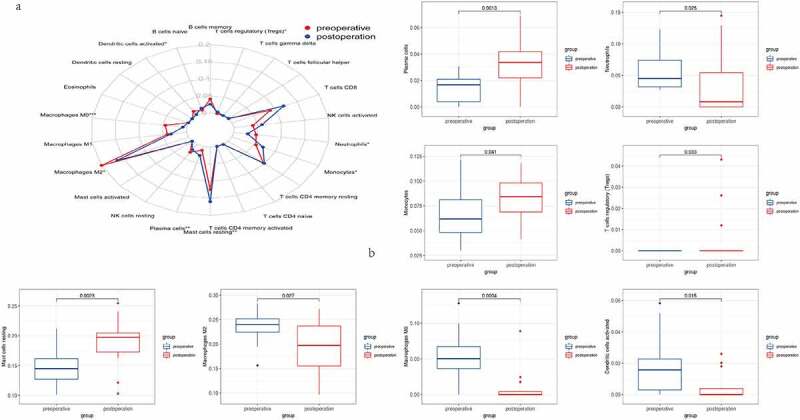
Figure 6.

Results of immune cell infiltration. (a) The relative abundance of 22 different immune cells before and after BS. (b) Comparison of T cells regulatory (Tregs), neutrophils, macrophages M2, macrophages M0, dendritic cells activated, monocytes, mast cell resting and plasma cells before and after BS
