Abstract
PURPOSE
Primary care physicians have an important role in encouraging adequate cancer screening. Disparities in cancer screening by socioeconomic status (SES) may affect presentation stage and cancer survival. This study aimed to examine whether breast, colorectal, and cervical cancer screening rates in women differed by SES and age, and whether screening rates and SES disparities changed after introduction of a primary care–based national quality indicator program.
METHODS
This repeated cross-sectional study spanning 2002-2017 included all female Israeli residents in age ranges appropriate for each cancer screening assessed. SES was measured both as an individual-level variable based on exemption from copayments and as an area-level variable using census data.
RESULTS
In 2017, the most recent year in the study period, screening rates among 1,529,233 women were highest for breast cancer (70.5%), followed by colorectal cancer (64.3%) and cervical cancer (49.6%). Women in the highest area-level SES were more likely to undergo cervical cancer screening compared with those in the lowest (odds ratio = 3.56; 99.9% CI, 3.47-3.65). Temporal trends showed that after introduction of quality indicators for breast and colorectal cancer screening in 2004 and 2005, respectively, rates of screening for these cancers increased, with greater reductions in disparities for the former. The quality indicator for cervical cancer screening was introduced in 2015, and no substantial changes have occurred yet for this screening.
CONCLUSIONS
We found increased uptake and reduced socioeconomic disparities after introduction of cancer screening indicators. Recent introduction of a cervical cancer screening indicator may increase participation and reduce disparities, as has occurred for breast and colorectal cancer screening. These findings related to Israel’s quality indicators program highlight the importance of primary care clinicians in increasing cancer screening rates to improve outcomes and reduce disparities.
Key words: health care research, quality of care, primary care, delivery of health care, women’s health, health status disparities, healthcare disparities, socioeconomic disparities, population health, cancer screening, early detection of cancer, quality indicators, health care, vulnerable populations
INTRODUCTION
Cancer is the leading cause of death in Israel.1 Early detection of some cancers can improve survival rates. Breast and colorectal cancers are the first and second most common cancers among women, respectively, and both malignancies have widely used guidelines for early detection.2 Cervical cancer incidence is relatively low in Israel (4.8 per 100,000 women); however, the incidence-to-mortality ratio is relatively high (0.44), suggesting that diagnosis often occurs at an advanced stage.2 Population-level screening every 3 to 5 years can reduce cervical cancer mortality by 50%.3,4
Women in higher socioeconomic statuses (SESs) are more likely to participate in breast, colorectal, and cervical cancer screening,5 even in countries with universal access to health care,6-8 and disparities in mortality exist as well.9,10 Older women are more likely to undergo screening for colorectal cancer, but less likely to undergo screening for breast and cervical cancers.11-13
Studies of the impact of implementing quality indicators on SES disparities in cancer screening rates have had conflicting findings.14 Disparities in breast cancer screening decreased in Canada, but did not change in the United States. In contrast, cervical cancer screening disparities increased in Canada and New Zealand, but did not change in the United States.14
Israel provides universal health care coverage to all residents.15 The Israeli national program for Quality Indicators in Community Healthcare (QICH) continuously measures the health care quality of preventive services, screening, treatment, and management of disease, to improve the quality of care provided.16 Most QICH indicators assess care provided by primary care physicians. Primary care physicians receive reminders during and between patient visits regarding patients in their care who have or have not undergone necessary tests, procedures, or treatments, as defined by QICH. Representatives of the Family Physicians’ Society also participate in QICH steering committee meetings to select appropriate, evidence-based indicators.
According to the National Academies of Sciences, Engineering, and Medicine, quality in health care comprises several elements, including effectiveness, safety, timing, suitability, efficacy, and equality.17 As such, one of the goals of the QICH program is to ensure efficacy and equality in the care provided, guaranteeing equal quality of care regardless of sex, age, or socioeconomic status. When the QICH program identifies areas that have major SES disparities, targeted interventions aimed at reducing these disparities can be implemented.
Indicators assessing screening uptake of various cancers have been introduced gradually, beginning in 2002. The indicator for breast cancer screening was introduced in 2004, the indicator for colorectal cancer screening in 2005, and the indicator for cervical cancer screening a decade later in 2015. In addition to the QICH program, national screening programs were introduced for breast cancer in the early 1990s and for colorectal cancer screening in 2005.18,19 The quality indicators for these cancers are under the direct responsibility and purview of primary care physicians.
As women and men experience encounters with the health care system differently, and these differences can affect the quality of care provided,20 we focused specifically on cancer screening among women. The aim of our study was to assess whether there were SES and age disparities in breast, colorectal, and cervical cancer screening rates among women. In addition, we assessed whether screening rates and SES disparities changed over time after introduction of the QICH program.
METHODS
Data Source
The QICH program monitors and evaluates the quality of community-based health care provided through Israel’s 4 health maintenance organizations (HMOs) using data originating from electronic health records, for the entire Israeli population.15 All QICH program indicators are calculated by the HMOs, using individual-level information, and then anonymized and aggregated by sex, SES, and year, before they are merged into a national data set to calculate population-wide rates. Our study used the QICH data to assess cancer screening rates among women. Ethics approval and consent were not required because all data used were anonymized and aggregated.
Study Design and Population
This study had a repeated cross-sectional design. The study population included all Israeli women aged 35 to 74 years, with complete membership in an HMO during a measurement year in the study period (2002-2017). In 2017, the sample size was 1,529,233 women.
Outcome Measures
The study outcome measures were the percentages of women who underwent appropriate breast, colorectal, and cervical cancer screening. Details are given in Supplemental Appendix 1, available at https://www.AnnFamMed.org/lookup/suppl/doi.10.1370/afm.2715/-/DC1. In brief, for breast cancer screening, we assessed the percentage of women aged 50 to 74 years who had at least 1 mammogram in the past 2 years. For colorectal cancer screening, we assessed the percentage of women aged 50 to 74 years who had a fecal occult blood test performed during the past year or a colonoscopy during the past 10 years. For cervical cancer screening, we assessed the percentage of women aged 35 to 54 years having Papanicolaou (Pap) tests provided for free within the universal health basket of covered procedures and medications who had at least 1 Pap test performed in the past 3 years.
SES Measures
We assessed SES with 2 measures: an individual-level measure based on a single factor and an area-level measure (using individual postal code of residence) based on multiple factors.
The crude, dichotomous, individual-level SES measure was based on women’s exemption from copayment when receiving health care. Under the National Health Insurance law, all Israeli residents are entitled to a unified basic set of health care services. Certain individuals, including older adults receiving additional pensions under the minimum income law, as well as dialysis patients and individuals with other disabilities and illnesses,21 are given an exemption from copayments for physician visits. Exemption status, available from 2002, is determined on an individual basis. It is not based solely on economic need, however, and is therefore only a crude measure of an individual’s SES.
The area-level SES measure, available from 2012, is based on small statistical areas used in Israel’s census.22 The Central Bureau of Statistics uses information on demographics, education, employment, housing conditions, and household income to define the small statistical areas. The bureau uses factor analysis to obtain a robust and valid measure reflecting the multidimensional nature of SES at the area level. As the latest data available from the bureau were from 2008, we used more recent data from the Points Location Intelligence Company (Points Business Mapping Ltd) to update the accuracy of the SES measure, using current commercial, housing, and sociodemographic data.23 These data were grouped into 4 SES categories, ranging from 1 (lowest) to 4 (highest).
The area-level SES was correlated with the individual-level SES (exemption status): comparing women in SES 4 with women in SES 1, the odds ratio (OR) of being exempt from copays was 3.5 among those aged younger than 65, compared with 7.0 among those aged 65 and older. We did not find evidence of multicollinearity, however (variance inflation factor = 1.6).
Statistical Analysis
We report the percentages of women appropriately screened by age, individual-level SES (exemption status), and area-level SES for 2017. We used multivariate logistic regression analysis to assess the association between the area-level SES and breast, colorectal, and cervical cancer screening, while adjusting for age and individual-level SES. In addition, we used multivariate models adjusting for age without adjusting for individual-level SES, to assess whether adjusting for the latter substantially influenced our findings. As results were virtually the same in both models, we report the fully adjusted model, including individual-level SES. We further assessed whether SES disparities differed by age (Supplemental Appendix 2, available at https://www.AnnFamMed.org/lookup/suppl/doi.10.1370/afm.2715/-/DC1).
We used multivariate logistic regression models including age, calendar year (as a continuous variable), and individual-level SES to assess changes in cancer screening prevalence over time. Individual-level SES was used in this analysis, as the area-level SES measure was not available before 2012. Given that the 3 cancer screening quality indicators were introduced at different times, the years included in the models differ by cancer type. To assess whether SES disparities changed over time, we considered interactions between SES and year, and when we found this interaction to be significant, we stratified the analysis by exemption status.
Because of the large sample size, we based statistical significance on a P value of .001 and report 99.9% confidence intervals. We used Stata version 14.0 (StataCorp LLC) to perform all analyses.
RESULTS
Cross-Sectional Associations
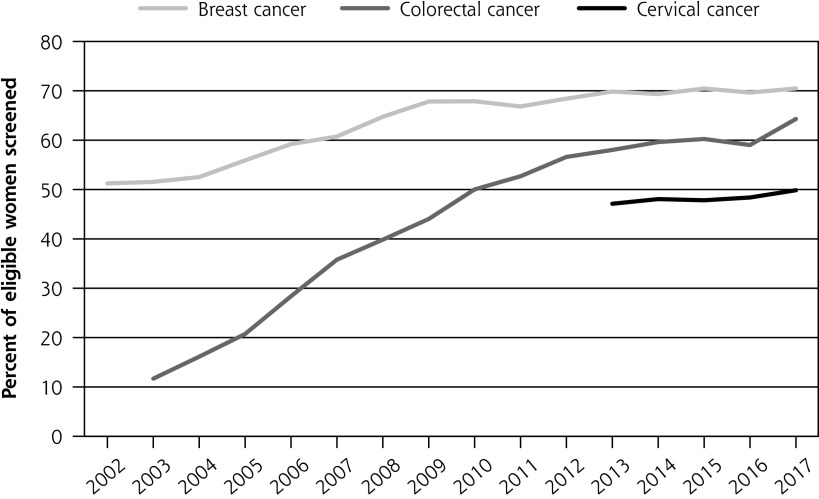
In 2017, our cohort included 826,757 women between the ages of 50 and 74 years, the recommended ages for breast and colorectal cancer screening, while 895,814 women were between the ages of 35 and 54 years, the recommended ages for cervical cancer screening (Table 1). The screening rate among eligible women in 2017 was highest for breast cancer at 70.5%, followed by colorectal cancer at 64.3% and cervical cancer at 49.6%.
Table 1.
Sociodemographic Characteristics and Screening Prevalences of Women Aged 35-74 Years in Israel, 2017 (N = 1,529,233)
| Characteristic | Women, No. (%) | Breast Cancer Screening,a % | Colorectal Cancer Screening,b % | Cervical Cancer Screening,c % |
|---|---|---|---|---|
| Total | 1,529,233 (100) | 70.5 | 64.3 | 49.6 |
| Age-group, y | ||||
| 35-39 | 243,001 (15.9) | … | … | 51.3 |
| 40-44 | 244,601 (16.0) | … | … | 51.5 |
| 45-49 | 214,874 (14.1) | … | … | 50.1 |
| 50-54 | 193,338 (12.6) | 68.7 | 55.2 | 44.5 |
| 55-59 | 190,668 (12.5) | 69.9 | 62.2 | … |
| 60-64 | 148,113 (9.7) | 71.9 | 66.8 | … |
| 65-69 | 178,259 (11.7) | 73.5 | 70.8 | … |
| 70-74 | 116,379 (7.6) | 67.0 | 69.2 | … |
| Area-level SESd | ||||
| 1 | 221,527 (15.0) | 65.7 | 60.5 | 31.0 |
| 2 | 444,682 (30.1) | 69.1 | 62.8 | 46.2 |
| 3 | 535,348 (36.2) | 72.3 | 65.5 | 57.1 |
| 4 | 275,567 (18.7) | 72.9 | 67.2 | 62.2 |
| Individual-level SESe | ||||
| Exempt | 256,667 (16.8) | 68.5 | 64.8 | 37.4 |
| Not exempt | 1,272,566 (83.2) | 71.2 | 64.1 | 51.0 |
SES = socioeconomic status.
Percentage of women aged 50-74 years who had at least 1 mammogram in past 2 years.
Percentage of women aged 50-74 years who had a fecal occult blood test during past year or a colonoscopy during past 10 years.
Percentage of women aged 35-54 years having Pap tests provided for free within the universal health basket of covered procedures and medications who had at least 1 Pap test performed in past 3 years.
Higher values indicate more favorable SES. Missing for 52,109 women (3.4% of total sample).
Based on copayment exemption.
The odds of screening in 2017 increased as the area-level SES increased for all 3 cancers assessed, after adjusting for age and individual-level SES (Table 2). Breast and colorectal cancer screening showed modest but statistically significant SES disparities between the lowest and highest SES levels (OR = 1.36 and 1.27, respectively) with a monotonic increase per SES level. We found a dramatic gradient in cervical cancer screening, where women in SES 4 had 3.6 times the odds of being screened compared with women in SES 1 (OR = 3.56; 99.9% CI, 3.47-3.65). The individual-level SES measure showed almost no association with breast and colorectal cancer screening, after adjusting for area-level SES and age (OR = 1.09 and 1.02, respectively), whereas cervical cancer screening increased modestly with individual-level SES (OR = 1.43; 99.9% CI, 1.39-1.47).
Table 2.
Associations Between Sociodemographic Characteristics and Cancer Screening Among Women in Israel, 2017
| Characteristic | Breast Cancer Screening, OR (99.9% CI) | Colorectal Cancer Screening, OR (99.9% CI) | Cervical Cancer Screening, OR (99.9% CI) |
|---|---|---|---|
| Age-group, y | |||
| 35-39 | … | … | Ref |
| 40-44 | … | … | 0.99 (0.98-1.01) |
| 45-49 | … | … | 0.95 (0.93-0.96) |
| 50-54 | … | … | 0.76 (0.75-0.78) |
| Age decile or quintile, y | |||
| 50-59 | Ref | Ref | … |
| 60-69 | 1.17 (1.15-1.19) | 1.54 (1.52-1.57) | … |
| 70-74 | 0.90 (0.88-0.92) | 1.58 (1.54-1.62) | … |
| Area-level SES | |||
| 1 | Ref | Ref | Ref |
| 2 | 1.15 (1.12-1.18) | 1.06 (1.04-1.09) | 1.92 (1.87-1.96) |
| 3 | 1.33 (1.29-1.36) | 1.18 (1.15-1.21) | 2.91 (2.85-2.98) |
| 4 | 1.36 (1.32-1.40) | 1.27 (1.23-1.30) | 3.56 (3.47-3.65) |
| Individual-level SESa | |||
| Exempt | Ref | Ref | Ref |
| Not exempt | 1.09 (1.07-1.11) | 1.02 (1.00-1.04) | 1.43 (1.39-1.47) |
OR = odds ratio; Ref = reference group; SES = socioeconomic status.
Note: All models were adjusted for age, area-level SES, and individual-level SES (copayment exemption).
Based on copayment exemption.
The odds of screening also differed by age. Older women were more likely to be screened for colorectal cancer compared with younger women (OR60-69 vs 50-59 = 1.54; 99.9% CI, 1.52-1.57; OR70-74 vs 50-59 = 1.58; 99.9% CI, 1.54-1.62) (Table 2). Older women, however, were less likely to undergo screening for cervical cancer (OR50-54 vs 35-39 = 0.75; 99.9% CI, 0.74-0.76) and for breast cancer (OR70-74 vs 50-59 = 0.90; 99.9% CI, 0.88-0.92).
Stratifying our analyses by age-group, we found that area-level SES disparities for breast and colorectal cancer screening were more pronounced among older women compared with younger women (Supplemental Table 1, available at https://www.AnnFamMed.org/lookup/suppl/doi.10.1370/afm.2715/-/DC1). Among women aged 50 to 59, those in SES 4 were 1.3 times more likely to be screened for breast cancer compared with those in SES 1, whereas among women aged 70 to 74, those in SES 4 were 2.0 times more likely to be screened for breast cancer compared with those in SES 1. Colorectal cancer screening also showed a more pronounced SES gradient among women who were older. In contrast, SES disparities in cervical cancer screening did not show substantial differences by age-group and were only slightly more pronounced in women aged 35 to 44 compared with those age 45 to 54.
Temporal Trends
The breast cancer screening rate increased by 9% per year during 2002-2017 (OR = 1.09; 99.9% CI, 1.10-1.10) and the colorectal cancer screening rate increased by 6% per year during 2003-2017 (OR = 1.06; 99.9% CI, 1.06-1.06), following introduction of the QICH program, which initially focused on these cancers (Figure 1). The cervical cancer screening quality indicator was introduced only in 2015 and the rate of screening for this cancer has not yet changed substantially (OR = 1.03; 99.9% CI, 1.03-1.03).
Figure 1.
Trends in screening rates over time for breast, colorectal, and cervical cancer among all eligible women.
Note: The indicator for breast cancer screening was introduced in 2004, the indicator for colorectal cancer screening in 2005, and the indicator for cervical cancer screening in 2015.
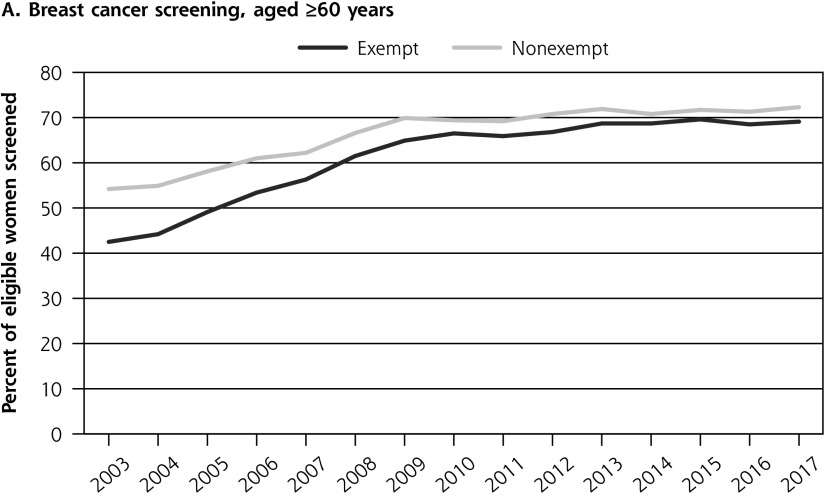
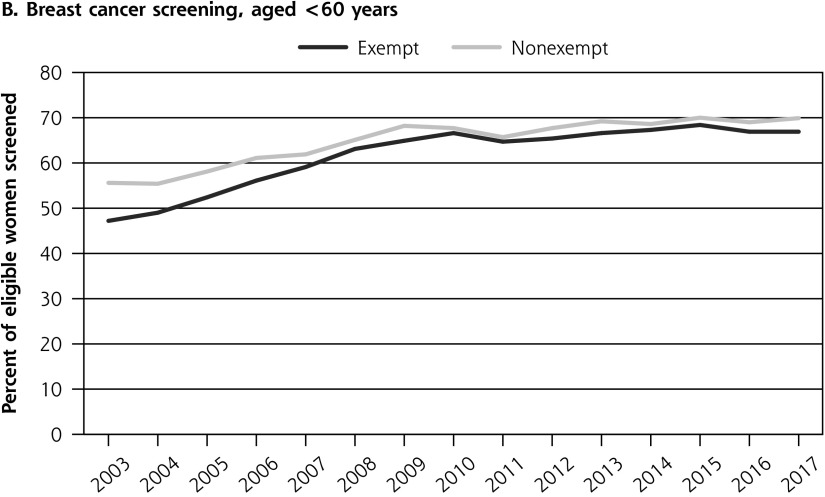
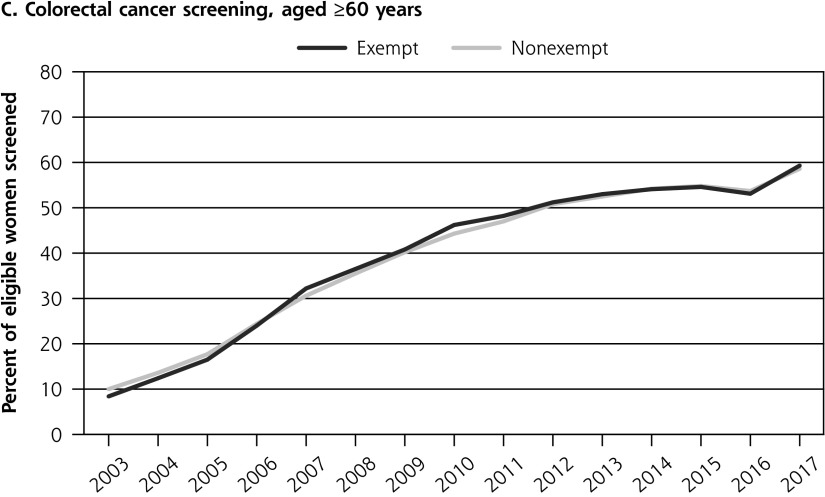
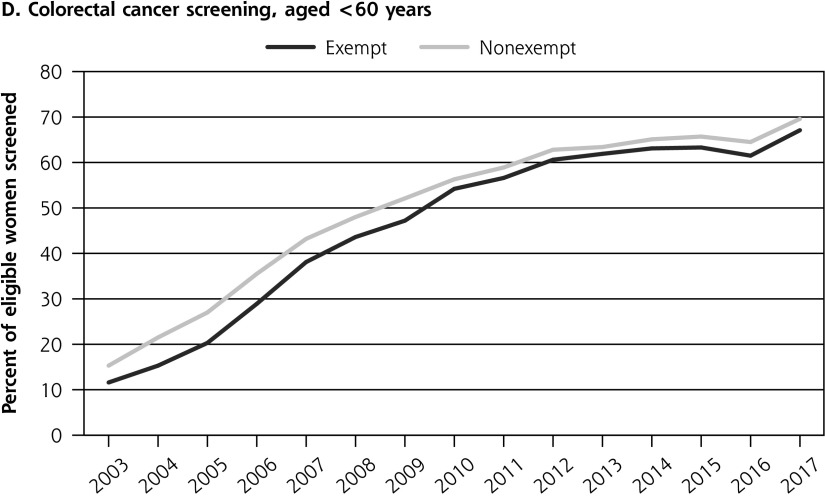
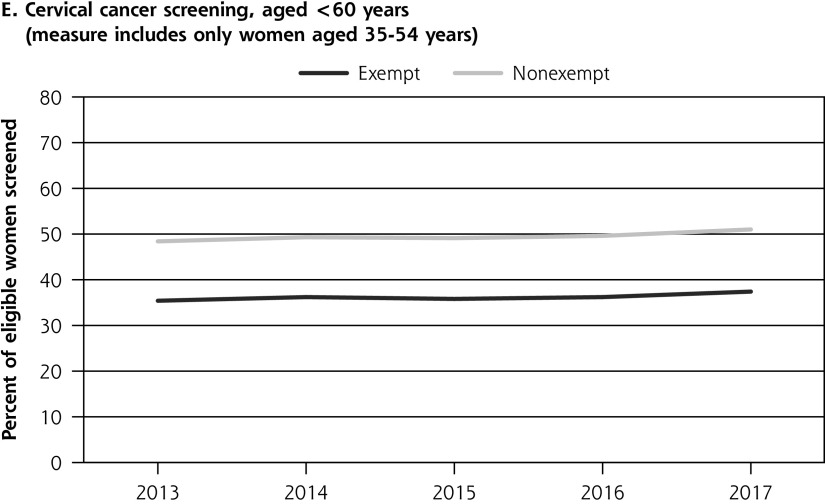
We found significant positive interactions between exemption status and year for breast cancer screening (P <.001). The rate increased among all women (Figure 2), but the magnitude of increase per year was greater among those exempt from copayments (OR = 1.08; 99.9% CI, 1.08-1.08) than among those nonexempt (OR = 1.05; 99.9% CI, 1.05-1.05). During the study period, screening rates among exempt women nearly reached those of women not exempt. Rates of colorectal cancer screening did not differ considerably by exemption status and increased similarly in both groups (exempt OR = 1.06; 99.9% CI, 1.05-1.06; nonexempt OR = 1.07; 99.9% CI, 1.06-1.07). We did not find significant interactions between exemption status and year for cervical cancer screening (P = .002). Cervical cancer screening rates have been available for only the past 5 years, and these rates have remained largely stable over time (OR = 1.03; 99.9% CI, 1.02-1.03), with no reduction in SES disparities.
Figure 2.
Trends in screening rates over time, by individual-level socioeconomic status (exemption status) and age.
Note: The indicator for breast cancer screening was introduced in 2004, the indicator for colorectal cancer screening in 2005, and the indicator for cervical cancer screening in 2015.
DISCUSSION
In this population-based study, women in lower SESs were less likely to undergo cancer screening after adjusting for age and year. Substantial SES disparities were found for cervical cancer screening. Older women were more likely to undergo colorectal cancer screening, but less likely to be screened for cervical and breast cancer. Rates of breast and colorectal cancer screening improved markedly over time. We detected substantial attenuation of individual-level SES disparities that initially emerged for breast cancer, but major disparities for cervical cancer screening remained.
Breast Cancer Screening
Rates of breast cancer screening in Israel have increased over time and are now higher than the Organisation for Economic Co-operation and Development average (69.6% vs 60.8%).24 Israel implemented a national systematic breast cancer screening program in 1995, yet breast cancer screening rates were still more than 10% higher among women not exempt from copayments at the beginning of our measurements in 2002. The introduction of this screening quality indicator created pressure on health care organizations to increase participation rates for their members as well as to decrease disparities.25 Results concerning the annual performance rate indicators are published each year26 and are presented to the HMOs, who adopt various strategies to improve screening rates and address disparities.27 The 4 HMOs have undertaken various efforts, including sending mobile mammography units to outlying towns to improve access, and multilevel intervention programs to reduce disparities.25,28 One HMO introduced a combined top-down and bottom-up approach. The top-down approach included reporting screening rates within the organization, using a computerized promotion system, and calling noncompliant members, while the bottom-up approach analyzed local barriers to health care services, including social norms and accessibility, and implementation of tailored solutions based on identified needs.29 Additionally, resources were preferentially allocated to populations at risk, and health professionals were trained to understand cultural differences that may hinder the provision of health care services. Another HMO implemented the use of personal invitation letters for mammography screening, with follow-up telephone calls, as this practice was found to increase screening participation threefold.25
A study of Israeli primary care physicians found that more than one-half reported that they made changes in their practices in the wake of the quality indicator monitoring, including increasing their outreach to women regarding the importance of breast cancer screening.30 Since these efforts were undertaken, the SES disparities have significantly diminished.
Colorectal Cancer Screening
Screening for colorectal cancer reduces both incidence of and mortality from the disease, by enabling detection and removal of precancerous polyps.31,32 In Israel, participation rates in colorectal cancer screening have substantially increased over time. As rates have increased, there has been a substantial decrease in incidence of colorectal cancer and an increase in the percentage of people with early-stage cancer (in situ and stage 1) at diagnosis.19
Our findings of limited SES disparities are supported by a study in France that found smaller SES disparities in colorectal cancer screening compared with those for breast and cervical cancer screening.5 Similarly, in countries that have organized screening, women with less education were less likely to undergo breast cancer screening; however, these disparities were smaller for colorectal cancer screening.33 To adhere to colorectal cancer screening guidelines, individuals can undergo a colonoscopy once every 10 years, whereas adherence for breast cancer screening guidelines requires undergoing mammography every 2 years, and cervical cancer screening requires undergoing a Pap test every 3 years. It is therefore possible that it is easier for individuals from lower SESs to adhere to colorectal cancer screening guidelines compared with breast or cervical cancer screening guidelines.
Cervical Cancer Screening
Cervical cancer screening can reduce morbidity and mortality by 50%.3,34 Moreover, most cervical cancer occurs in women not routinely screened.35 We found considerable SES disparities for cervical cancer screening, similar to those found in countries with universal access to screening.11,36,37 SES disparities also exist in cervical cancer mortality, even with universal access,38 indicating that offering screening is insufficient in overcoming disparities. The introduction of a nationwide organized screening program in Israel, similar to the existing breast and colorectal cancer screening programs, may reduce these substantial SES disparities.
Several strategic quality improvement methods have been implemented to increase screening rates in Israel. Physician audit and feedback, which is effective in increasing breast, colorectal, and cervical cancer screening,39 is performed by routinely holding meetings with physicians to review individual and group performance and to consider improvement ideas.40 Automatic computer reminders, proven effective in increasing mammography and Pap test participation rates,41 were added to physicians’ systems. Nurses and clerical staff were involved in follow-up and monitoring, to reduce the burden on physicians. The Israeli HMOs work intensively to provide operational support to improve quality, using a broad range of managerial tools, including physician staff support, patient transportation services, coaching, and training.40
Strengths and Limitations
A strength of our study was its population-based design, which precluded sampling errors or selection biases. In addition, the data were checked at 3 levels—an internal audit by each HMO, a QICH program directorate data audit, and an external process audit—ensuring high quality of the data.26
The limitations of our study include the use of aggregated data, which required us to assess women’s screening behaviors separately for each cancer site, and we were unable to determine whether women were screened for multiple cancers. As our study had a repeated cross-sectional design, we were unable to follow women over time and assess correlations between their participation in screening programs and their outcomes, and to assess whether individual women’s participation in screening programs changed over time. We included only women and are therefore unable to generalize these findings to men. Finally, our area-level SES measure was limited. We were unable to tease apart the impact of important covariates such as marital status, education level, smoking, chronic disease, and subjective health status. A recent study based on QICH data assessed the contribution that factors such as body mass index, diabetes, hypertension, and smoking had on colorectal cancer screening rates.42 Although these factors were statistically significantly associated with reduced screening rates, their contributions to screening rates were small.
Conclusions
Between 2002 and 2017 and in concert with implementation of screening quality indicators, breast and colorectal cancer screening rates improved in Israel, and SES disparities in breast cancer screening diminished. A cervical cancer screening indicator has only recently been added; inclusion of this indicator may act as a catalyst toward both improving participation rates and reducing SES disparities. Our study demonstrates that universal health coverage does not directly translate into equitable health care, and additional barriers exist that hinder cancer screening performance. Efforts are required to implement interventions that reach the most vulnerable subgroups to combat health inequalities.
Supplementary Material
Acknowledgments
Yiska Loewenberg Weisband is grateful to the Azrieli Foundation for the award of an Azrieli Fellowship. The authors wish to thank the Israel National Institute for Health Policy Research for funding.
Footnotes
Conflicts of interest: authors report none.
To read or post commentaries in response to this article, go to https://www.AnnFamMed.org/content/19/5/396/tab-e-letters.
Authors’ contributions: Y.L.W., L.T., and O.M. conceived and designed the study; O.P., Y.W.S., R.C-M., and O.M. collected the data; Y.L.W., L.T., and O.M. contributed data or analysis tools; Y.L.W. and L.T. performed the analysis; Y.L.W. and L.T. wrote the paper, with considerable input from O.P., Y.W.S., R.C-M., and O.M. All authors reviewed and approved the final manuscript.
Funding support: The Israel National Institute for Health Policy Research partially funded this research.
Disclaimer: The Azrieli Foundation and the Israel National Institute for Health Policy Research had no role in the design, analysis, or writing of this article.
Supplemental materials: Available at https://www.AnnFamMed.org/lookup/suppl/doi:10.1370/afm.2715/-/DC1/.
References
- 1.State of Israel Ministry of Health . Leading causes of death in Israel 2000 – 2015. Published 2018. Accessed Jul 4, 2019. https://www.health.gov.il/English/News_and_Events/Spokespersons_Messages/Pages/22052018_2.aspx
- 2.State of Israel Ministry of Health . Israel national cancer registry. Published 2018. Accessed Jul 4, 2019. https://www.health.gov.il/English/MinistryUnits/HealthDivision/Icdc/Icr/Pages/default.aspx
- 3.IARC Working Group on the Evaluation of Cancer-Preventive Strategies . Cervix Cancer Screening. IARC Press; 2005. Accessed Jul 4, 2019. https://publications.iarc.fr/Book-And-Report-Series/Iarc-Handbooks-Of-Cancer-Prevention/Cervix-Cancer-Screening-2005 [Google Scholar]
- 4.Curry SJ, Krist AH, Owens DK, et al. ; US Preventive Services Task Force . Screening for cervical cancer: US Preventive Services Task Force recommendation statement. JAMA. 2018; 320(7): 674-686. [DOI] [PubMed] [Google Scholar]
- 5.Kelly DM, Estaquio C, Léon C, Arwidson P, Nabi H. Temporal trend in socioeconomic inequalities in the uptake of cancer screening programmes in France between 2005 and 2010: results from the Cancer Barometer surveys. BMJ Open. 2017; 7(12): e016941. [DOI] [PMC free article] [PubMed] [Google Scholar]
- 6.Fedewa SA, Cullati S, Bouchardy C, et al. Colorectal cancer screening in Switzerland: cross-sectional trends (2007-2012) in socioeconomic disparities. PLoS One. 2015; 10(7): e0131205. [DOI] [PMC free article] [PubMed] [Google Scholar]
- 7.Burton-Jeangros C, Cullati S, Manor O, Courvoisier DS, Bouchardy C, Guessous I. Cervical cancer screening in Switzerland: cross-sectional trends (1992-2012) in social inequalities. Eur J Public Health. 2017; 27(1): 167-173. [DOI] [PMC free article] [PubMed] [Google Scholar]
- 8.Marlow LAV, Chorley AJ, Haddrell J, Ferrer R, Waller J. Understanding the heterogeneity of cervical cancer screening non-participants: data from a national sample of British women. Eur J Cancer. 2017; 80: 30-38. [DOI] [PMC free article] [PubMed] [Google Scholar]
- 9.Vanthomme K, Vandenheede H, Hagedoorn P, Gadeyne S. Evolution of socioeconomic inequalities in site-specific cancer mortality among Belgian women between 1991 and 2008 using a fundamental cause approach. Cancer Causes Control. 2017; 28(8): 829-840. [DOI] [PubMed] [Google Scholar]
- 10.Goldberg M, Calderon-Margalit R, Paltiel O, et al. Socioeconomic disparities in breast cancer incidence and survival among parous women: findings from a population-based cohort, 1964-2008. BMC Cancer. 2015; 15(1): 921. [DOI] [PMC free article] [PubMed] [Google Scholar]
- 11.Olesen SC, Butterworth P, Jacomb P, Tait RJ. Personal factors influence use of cervical cancer screening services: epidemiological survey and linked administrative data address the limitations of previous research. BMC Health Serv Res. 2012; 12(1): 34. [DOI] [PMC free article] [PubMed] [Google Scholar]
- 12.Wools A, Dapper EA, de Leeuw JRJ. Colorectal cancer screening participation: a systematic review. Eur J Public Health. 2016; 26(1): 158-168. [DOI] [PubMed] [Google Scholar]
- 13.Jerant AF, Franks P, Jackson JE, Doescher MP. Age-related disparities in cancer screening: analysis of 2001 Behavioral Risk Factor Surveillance System data. Ann Fam Med. 2004; 2(5): 481-487. [DOI] [PMC free article] [PubMed] [Google Scholar]
- 14.Hussey P, Anderson G, Berthelot J-M, et al. Trends in socioeconomic disparities in health care quality in four countries. Int J Qual Health Care. 2008; 20(1): 53-61. [DOI] [PubMed] [Google Scholar]
- 15.State of Israel Ministry of Health . Rights of the Insured under National Health Insurance Law. 2019. Accessed Jul 4, 2019. https://www.health.gov.il/English/Topics/RightsInsured/RightsUnderLaw/Pages/default.aspx
- 16.Jaffe DH, Shmueli A, Ben-Yehuda A, et al. Community healthcare in Israel: quality indicators 2007-2009. Isr J Health Policy Res. 2012; 1(1): 3. [DOI] [PMC free article] [PubMed] [Google Scholar]
- 17.Institute of Medicine Committee on Quality of Health Care in America . Crossing the Quality Chasm: A New Health System for the 21st Century. National Academies Press; 2001. [PubMed] [Google Scholar]
- 18.Israel Cancer Association . The Israel Cancer Association – breast screening program. Accessed Jun 26, 2019. https://en.cancer.org.il/template_e/default.aspx?PageId=7645
- 19.Israel Cancer Association . The Israel Cancer Association – colorectal cancer. Accessed Jun 26, 2019. https://en.cancer.org.il/template_e/default.aspx?PageId=7747
- 20.Krzyzanowska MK, Barbera L, Elit L, et al. Identifying population-level indicators to measure the quality of cancer care for women. Int J Qual Health Care. 2011; 23(5): 554-564. [DOI] [PubMed] [Google Scholar]
- 21.Ministry of Health . Copay – discounts and exemptions. Published Nov 28, 2017. Accessed Jan 16, 2019. https://www.health.gov.il/English/Topics/RightsInsured/RightsUnderLaw/CollectionArrangements/Pages/Hanahot.aspx
- 22.Central Bureau of Statistics Israel . Characterization and classification of geographical units by the socio-economic level of the population 2008. Published Jul 15, 2013. Accessed Jun 26, 2019. https://www.cbs.gov.il/en/publications/Pages/2013/CHARACTERIZATION-AND%C2%A0CLASSIFICATION-OF%C2%A0GEOGRAPHICAL-UNITS%C2%A0BY-THE-SOCIO-ECONOMIC-LEVEL-OF-THE-POPULATION-2008.aspx
- 23.Points Location Intelligence. Accessed Jul 11, 2019. https://www.points.co.il/?lang=en
- 24.Organisation for Economic Co-operation and Development (OECD) . Health at a Glance 2017. OECD Publishing; 2017. Accessed Jun 26, 2019. https://www.oecd-ilibrary.org/social-issues-migration-health/health-at-a-glance-2017_health_glance-2017-en [Google Scholar]
- 25.Hayek S, Enav T, Shohat T, Keinan-Boker L. Factors associated with breast cancer screening in a country with national health insurance: did we succeed in reducing healthcare disparities? J Womens Health (Larchmt). 2017; 26(2): 159-168. [DOI] [PubMed] [Google Scholar]
- 26.Calderon-Margalit R, Abu-Ahmed W, Ben-Yehuda A, et al. Israel National Program for Quality Indicators in Community Healthcare. English Summary Report; 2013-2017. Accessed Jun 26, 2019. https://www.israelhealthindicators.org/publications?lang=en [PubMed]
- 27.Dreiher D, Blagorazumnaya O, Balicer R, Dreiher J. National initiatives to promote quality of care and patient safety: achievements to date and challenges ahead. Isr J Health Policy Res. 2020; 9(1):62. [DOI] [PMC free article] [PubMed] [Google Scholar]
- 28.Baron-Epel O, Friedman N, Lernau O. Reducing disparities in mammography-use in a multicultural population in Israel. Int J Equity Health. 2009; 8(1): 19. [DOI] [PMC free article] [PubMed] [Google Scholar]
- 29.Wilf-Miron R, Galai N, Gabali A, et al. Organisational efforts to improve quality while reducing healthcare disparities: the case of breast cancer screening among Arab women in Israel. Qual Saf Health Care. 2010; 19(5): e36. [DOI] [PubMed] [Google Scholar]
- 30.Nissanholtz-Gannot R, Rosen B; Quality Monitoring Study Group . Monitoring quality in Israeli primary care: the primary care physicians’ perspective. Isr J Health Policy Res. 2012; 1(1): 26. [DOI] [PMC free article] [PubMed] [Google Scholar]
- 31.Telford JJ, Levy AR, Sambrook JC, Zou D, Enns RA. The cost-effectiveness of screening for colorectal cancer. CMAJ. 2010; 182(12): 1307-1313. [DOI] [PMC free article] [PubMed] [Google Scholar]
- 32.Atkin WS, Edwards R, Kralj-Hans I, et al. ; UK Flexible Sigmoidoscopy Trial Investigators . Once-only flexible sigmoidoscopy screening in prevention of colorectal cancer: a multicentre randomised controlled trial. Lancet. 2010; 375(9726): 1624-1633. [DOI] [PubMed] [Google Scholar]
- 33.Willems B, Bracke P. Participants, physicians or programmes: participants’ educational level and initiative in cancer screening. Health Policy. 2018; 122(4): 422-430. [DOI] [PubMed] [Google Scholar]
- 34.Smith SG, McGregor LM, Raine R, Wardle J, von Wagner C, Robb KA. Inequalities in cancer screening participation: examining differences in perceived benefits and barriers. Psychooncology. 2016; 25(10): 1168-1174. [DOI] [PMC free article] [PubMed] [Google Scholar]
- 35.Saslow D, Solomon D, Lawson HW, et al. ; ACS-ASCCP-ASCP Cervical Cancer Guideline Committee . American Cancer Society, American Society for Colposcopy and Cervical Pathology, and American Society for Clinical Pathology screening guidelines for the prevention and early detection of cervical cancer. CA Cancer J Clin. 2012; 62(3): 147-172. [DOI] [PMC free article] [PubMed] [Google Scholar]
- 36.Leinonen MK, Campbell S, Klungsøyr O, Lönnberg S, Hansen BT, Nygård M. Personal and provider level factors influence participation to cervical cancer screening: a retrospective register-based study of 1.3 million women in Norway. Prev Med. 2017; 94: 31-39. [DOI] [PubMed] [Google Scholar]
- 37.Palència L, Espelt A, Rodríguez-Sanz M, et al. Socio-economic inequalities in breast and cervical cancer screening practices in Europe: influence of the type of screening program. Int J Epidemiol. 2010; 39(3): 757-765. [DOI] [PubMed] [Google Scholar]
- 38.Ng E, Wilkins R, Fung MFK, Berthelot JM. Cervical cancer mortality by neighbourhood income in urban Canada from 1971 to 1996. CMAJ. 2004; 170(10): 1545-1549. [DOI] [PMC free article] [PubMed] [Google Scholar]
- 39.Sabatino SA, Habarta N, Baron RC, et al. ; Task Force on Community Preventive Services . Interventions to increase recommendation and delivery of screening for breast, cervical, and colorectal cancers by healthcare providers systematic reviews of provider assessment and feedback and provider incentives. Am J Prev Med. 2008; 35(1) (Suppl): S67-S74. [DOI] [PubMed] [Google Scholar]
- 40.Rosen B, Pawlson LG, Nissenholtz R, et al. What the United States could learn from Israel about improving the quality of health care. Health Aff (Millwood). 2011; 30(4): 764-772. [DOI] [PubMed] [Google Scholar]
- 41.Emery JD, Shaw K, Williams B, et al. The role of primary care in early detection and follow-up of cancer. Nat Rev Clin Oncol. 2014; 11(1): 38-48. [DOI] [PubMed] [Google Scholar]
- 42.Paltiel O, Keidar Tirosh A, Paz Stostky O, et al. Adherence to national guidelines for colorectal cancer screening in Israel: comprehensive multi-year assessment based on electronic medical records. J Med Screen. 2021; 28(1): 25-33. [DOI] [PubMed] [Google Scholar]
Associated Data
This section collects any data citations, data availability statements, or supplementary materials included in this article.


