ABSTRACT
Ganglioside GD3/GD2 are over-expressed in various neuroectoderm-derived tumors. Previous studies indicated that GD3 is involved in the enhancement of cancer properties such as rapid growth and increased invasiveness. However, little is known about the functions of GD3/GD2 in glioma cells and glioma microenvironments. To clarify the functions of GD3/GD2 in gliomas, we used a mouse glioma model based on the RCAS/Gtv-a system. At first, we compared the gliomas size between wild-type (WT) and GD3 synthase (GD3S) knockout (KO) mice, showing a less malignant histology and slower tumor growth in GD3S-KO mice than in WT mice. Immunohistochemistry of glioma sections from WT and GD3S-KO mice revealed that reactive microglia/macrophages showed different localization patterns between the two genetic types of mice. CD68+ cells were more frequently stained inside glioma tissues of GD3S-KO mice, while they were stained mainly around glioma tissues in WT mice. The number of CD68+ cells markedly increased in tumor tissues of GD3S-KO mice at 2 weeks after injection of transfectant DF-1 cells. Furthermore, CD68+ cells in GD3S(-/-) glioma tissues expressed higher levels of inducible nitric oxide synthase. We observed higher expression levels of pro-inflammatory cytokine genes in primary-cultured glioma cells of WT mice than in GD3S-KO mice. DNA microarray data also revealed differential expression levels of various cytokines and chemokines in glioma tissues between WT and GD3S-KO mice. These results suggest that expression of GD3S allows glioma cells to promote polarization of microglia/macrophages towards M2-like phenotypes by modulating the expression levels of chemokines and cytokines.
Key Words: glioma, ganglioside GD3 synthase, knockout, microglia, tumor environment
INTRODUCTION
Gliomas account for approximately 50% of all primary brain neoplasms, and the most common type is highly malignant glioblastoma multiforme. Glioblastoma multiforme is an aggressive, rapidly progressive, infiltrative parenchymal neoplasm associated with a poor prognosis.1,2 Ganglioside GD3 and GD2 are over-expressed in many types of neuroectoderm-derived tumors,3,4 and are associated with tumor progression and development of the metastatic potential.5,6
Glioblastomas consist of multiple cell types, and some of them show increased tumorigenicity and stem cell-like properties, leading to relapse. Here, various cells existing in the tumor environment play important roles in regulating the disease course,7 and the actual contribution of those cells in the tumor environment has been rigorously studied.8 Among them, macrophages and microglia, dendritic cells, neutrophils, lymphocytes, fibroblasts, and endothelial cells have been considered to be involved in the formation of the environmental niche of gliomas.9 In particular, macrophages and microglia are now considered to play crucial roles in tumor progression and invasion.10,11
Microglia are resident innate immune cells in the central nervous system (CNS). In the healthy and diseased CNS, microglia are exposed to diverse environmental stimuli that can influence their functions, showing unique molecular and morphological profiles.12,13 Glioma-associated microglia/macrophages (MI/MΦ) (GAMs) are frequently polarized into two subsets : the M1-like phenotype or M2-like phenotype, when exposed to a different cytokine milieu.14,15 The polarization is also regulated by the progression stage and anatomical site.16 Classically activated macrophages, designated as the M1 phenotype, are characterized by the expression of the signal transducer and activator of transcription 1 (STAT-1) and the production of inducible nitric oxide synthase (iNOS). On the other hand, the M2 phenotype, an alternatively activated one, is characterized by the expression of the surface macrophage mannose receptor (CD206), and intracellular activator of transcription 3 (STAT-3), and the production of arginase.15,17
Previously, we reported that GD3/GD2 enhance malignant properties of various cancer cells such as melanomas,5,18,19 small cell lung cancers,20 osteosarcomas,21 and gliomas.22,23 Other groups also reported that GD3 synthase (GD3S; alternative name, ST8SIA1 or St8sia1) and its products drive the production of glioblastoma stem cells and tumorigenicity.24 These gangliosides promoted malignant properties of cancers by enhancing cell signals transduced through membrane microdomains (lipid/rafts) by forming molecular complexes with membrane molecules such as integrins,18,25 Neogenin,26 platelet-derived growth factor (PDGFR) receptor α,23 and glutamine transporter, ASCT2.27 However, little is known about the roles of GD3/GD2 on glioma cells in the regulation of GAMs. In this study, we employed a genetically engineered mouse model of glioma to clarify the roles of GD3/GD2 in regulating the interaction between glioma cells and innate immune cells in tumor environments.
The RCAS/Gtv-a system (Expression vector with replication-competent ALV splice acceptor combined with GFAP-transgenic tv-a) is very useful to analyze the in vivo function of gangliosides in the evolution and progression of gliomas.28 By injecting avian cells transfected with human PDGFB cDNA-containing RCAS viral vector into the new-born mouse brain, human glioma-mimicking gliomas can be induced due to astrocyte-specific viral infection based on the transgenic expression of an avian tv-a receptor in the presence of a glial fibrillary acidic protein (GFAP) promoter.28 In this study, we analyzed the roles of GD3S in gliomas generated in mice based on the complex genetically-engineered mice of GD3S-KO, p53-KO, and transgenic (Tg) tv-a with a focus on the effects of GD3S on the tumor environment.
MATERIALS AND METHODS
Mice used in this study
The Gtv-a mouse that expresses tv-a under the GFAP promoter was previously described.28 p53-decifient mice29 were from the RIKEN Bioresource Center (Tsukuba, Japan). These mice have a mixed genetic background of C57BL/6, 129, BALB/c, and FVB/N. GD3 synthase gene (St8sia1)-deficient mice lacking all b- and c-series gangliosides (Fig. 1) were generated as previously reported.30 All experiments were approved by the animal experimental committee of Nagoya University Graduate School of Medicine based on the guidelines of the Japanese government.
Fig. 1.
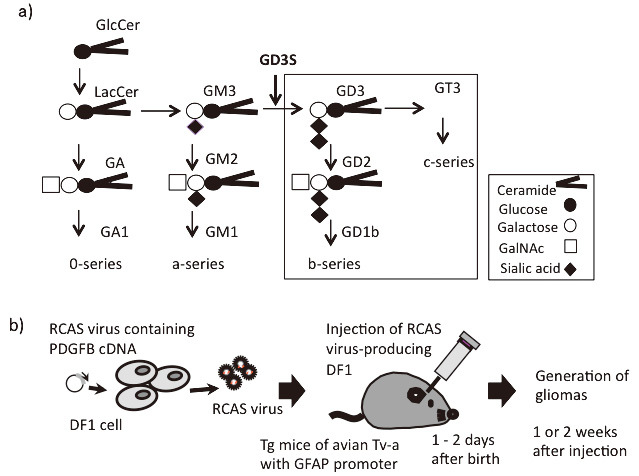
Synthetic pathway of gangliosides, and the RCAS/Gtv-a system used to generate gliomas in mice
Fig. 1a: The majority of glycosphingolipids are generated from glucosylceramide (GlcCer). In the normal brain, major gangliosides consist of GM1, GD1a, GD1b, and GT1b. Gangliosides deleted in GD3S-KO mice are indicated by a square.
Fig. 1b: The RCAS/Gtv-a system used to generate gliomas in mice is shown. To clarify the roles of GD3S in gliomas, we used GD3-expressing (WT) and GD3S-KO mice. By injecting DF1 chicken fibroblast cells producing RCAS virus with PDGFB cDNA into newborn transgenic mice of Tv-a, astrocyte-lineage gliomas can be found at 1–2 weeks after injection, when p53-KO-background mice are used.
Generation of tumor-bearing mice
DF-1 (chicken embryonic fibroblast line) was maintained in Dulbecco’s modified Eagle medium (DMEM) supplemented with 10% fetal calf serum (FCS). To generate virus-producing cells, DF-1 cells were transfected with RCAS retroviral vectors that contain cDNA of PDGFB linked with GFP via the T2A sequence, using Lipofectamine 2000TM (Thermo Fisher Scientific, Waltham, MA, USA), as shown in Supplementary Fig. S1B. Approximately 1 × 10⁴ virus-producing DF-1 cells were injected into the right cerebral cortex of newborn p53-deficient Gtv-a mice, as described previously.23 At 2 weeks after the injection of DF-1/RCAS containing cDNA of PDGFB, almost all mice generated brain tumors. Tumors were imaged by IVIS SpectrumTM (Perkin-Elmer, Waltham, MA, USA), and diagnosed as glioblastoma by pathological examination.
Antibodies and reagents
Mouse anti-GD3 monoclonal antibody (mAb) (R24) was obtained from Dr. L. J. Old (Memorial Sloan-Kettering Cancer Center, New York, USA). Anti-GD2 mAb 220-51 was as described previously.31 Rat anti-mouse CD68 (MCA1957) and rabbit anti-mouse iNOS (PA1-036) were purchased from AbDSerotec (Kidlington, UK). Rabbit anti-Iba1 antibody was from Wako (Cat. No. 019-19741, Osaka, Japan). Alexa568-conjugated anti-rabbit IgG and Alexa488-conjugated anti-rat IgG were purchased from Abcam (Cambridge, UK). Alexa546-conjugated anti-mouse IgG and DAPI were from Thermo Fisher Scientific (Waltham, MA, USA).
Immunohistochemistry with frozen sections
Two-week-old mouse brain tissues were fixed with 4% paraformaldehyde in PBS overnight at 4°C. Then, the solution was replaced sequentially with 10, 15, and 20% sucrose, embedded in O.C.T.TM compound (Sakura Finetechnical, Tokyo, Japan), and frozen in liquid nitrogen. Ten-mm-thick frozen sections were prepared with a cryostat (CM3050S, Leica, Wetzlar, Germany). After drying, sections were blocked with 10% BSA in PBS at room temperature for 1 h, and were stained with primary antibodies and appropriate secondary antibodies sequentially. Antibodies were diluted in 10% BSA in PBS. Finally, sections were stained with DAPI and mounted on microscope slide with ProLongTM Gold antifade reagent (P36934, Thermo Fisher Scientific, Waltham, MA, USA). Sections were observed by confocal microscopy (FluoviewFv10iTM, Olympus, Tokyo, Japan).
RNA extraction from primary cultured cells
Total RNA was extracted from WT or GD3S-KO mouse-derived primary cultured glioma cells using TRIzolTM according to the manufacturer’s protocol. The primers for RT-qPCR were designed based on the published sequences. cDNA was synthesized from total RNA by PrimeScript™ Double Strand cDNA Synthesis Kit (6111A, Takara, Shiga, Japan).
Real-time qPCR
The qPCR was carried out using DyNAmo SYBR GreenTM qPCR Kit (Thermo Fisher Scientific, Waltham, MA, USA) and CFX ConnectTM Real-Time System (BioRad, Hercules, CA, USA). Primers used in this study are listed in Table 1.
Table 1.
Sequences of primers used for RT-qPCR
| Name of gene: F (Forward sequence) / R (Reverse sequence) |
| IL-6: F 312 TGATGGATGCTACCAAACTGGA/ R 545 AGGAGAGCATTGGAAATTGGGG |
| PGE2: F 369 TTCCTCGACTTCCACTCCCT/ R 617 CTCCTTGCCCTGGTCATTCA |
| M-CSF: F 940 CTCTAGCCGAGGCCATGTG/ R 1216 AAGAGATAGTCCTGTGTGCCC |
| TGF-b1: F 1211 ACCGCAACAACGCCATCTAT/ R 1486 ACTGCCGTACAACTCCAGTG |
| Ccl2: F 89 CAGGTCCCTGTCATGCTTCT/ R 314 ACCCATTCCTTCTTGGGGTC |
| Ccl11: F 64: AGCTAGTCGGGAGAGCCTAC/ R 185 AAGGAAGTGACCGTGAGCAG |
| Cxcl12: F 244: AGCCAACGTCAAGCATCTGA/ R 428 TCGGGGGTCTACTGGAAAGT |
| Ccl7: F 118 GCTTTCAGCATCCAAGTGTGG/ R 434 CAGAAAGAACAGCGGTGAGGA |
| Ccl8: F 124 GCCAGATAAGGCTCCAGTCA/ R 409 TGCCTGGAGAAGATTAGGGG |
| Cx3cl1: F 1039 TCCCCAGAAACTGAGTGTGC/ R 1211 CTACCATTTCCCCCGCCATT |
| Ccl24: F 434 ATAGCACCGAGGTTTAGCCG/ R 745 GACAAGAACCCTATGGAAGCCA |
| Ccl27(a): F 8 CTGTGCCGACCCCTGAG/ R 184 TGGCTTGTTGGAGACATCGG |
All information is on mouse cDNAs.
DNA microarray
Pooled RNA samples of glioma tissues prepared from five each of GD3S-WT and GD3S-KO mice were analyzed by Agilent SurePrint G3 Mouse GE 8×60K Microarray (Agilent Technologies, Santa Clara, CA, USA). The analysis of microarray results was performed by Takara Bio Inc. (Kusatsu, Shiga, Japan). The scanned images obtained using a SureScan microarray scanner were analyzed with Feature Extraction Software (Agilent Technologies) and default parameters to obtain background subtracted and spatially detrended Processed Signal intensities. Processed signal intensities were normalized by the global scaling method. A trimmed mean probe intensity was determined by removing 2% of the lower and higher ends of the probe intensities in order to calculate the scaling factor. Normalized signal intensities were then calculated from the target intensity on each array using the scaling factor, so that the trimmed mean target intensity of each array was arbitrarily set to 2500. From signal data of 10,522 genes, data of chemokines (91 genes) were sorted, and Log2 ratios between WT and GD3S-KO samples were obtained.
RESULTS
GD3S-KO mice exhibited smaller gliomas
Based on the RCAS/tv-a system, we generated glioma-bearing WT and glioma-bearing GD3S-KO mouse lines (Fig. 1). Newborn Gtv-a mice were injected with DF1 cells carrying PDGFB cDNA linked with GFP via the T2A sequence. After 1–2 weeks, tumors were generated.
Hematoxylin and eosin (HE) staining of the brain tissues showed that tumors were generated in most mice one week after DF-1 cell injection (Fig. 2a). Compared with WT mice, GD3S-KO mice showed smaller tumors (Fig. 2b) and slower progression.
Fig. 2.
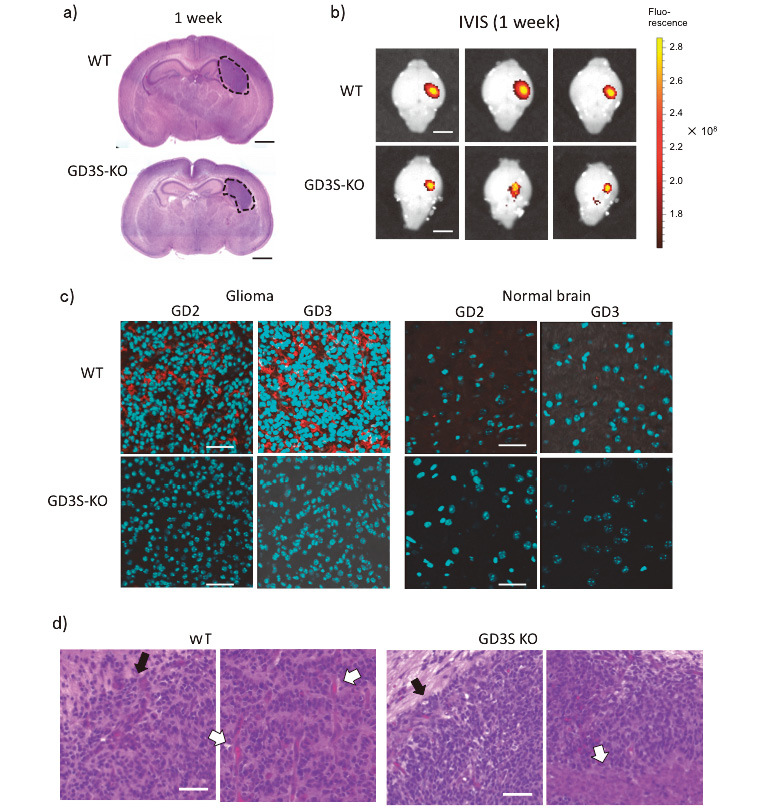
Generation of gliomas in WT and GD3S-KO mouse brains, different growth, and expression of GD3/GD2
Fig. 2a: Gliomas were generated one week after the injection of DF1 cells producing RCAS-PDGFB-GFP. The induced gliomas in WT showed a larger size than those in GD3S-KO mice (H-E staining), and exhibited similar pathologic features to human glioblastomas. Bar, 1 mm.
Fig. 2b: GD3S-KO mice showed smaller sizes of gliomas than WT mice on IVIS imaging performed 1 week after DF-1 cell injection. Bars, 2 mm.
Fig. 2c: Gangliosides GD3 and GD2 were highly expressed in glioma tissues of WT mice (red color). Brain sections at two weeks after injection were stained with an anti-GD2 mAb 220-51 and an anti-GD3 mAb R24. Alexa546-labeled rabbit anti-mouse IgG was used as a secondary antibody. Cyan-colored spots are nuclei. After staining, microscopic analysis was performed by confocal fluorescence microscopy (Olympus, FuoView 10i). More than 3 samples each were examined. Bars, 40 μm in upper panels, 20 μm in lower panels.
Fig. 2d: Pathological features of glioma tissues. H-E-stained patterns of glioma tissues generated in WT and GD3S-KO mice. After resection of tissues at 1 week after injection of DF-1 cells, tissues were formalin-fixed, paraffin-embedded, and analyzed. Note increased mitosis, vascular formation (white arrow), and polymorphic features in WT, and relatively uniform cells, necrosis (white arrow), and clear borders (black arrows) in GD3S-KO. (Scale bars = 50 μm) Three samples each were analyzed for H-E staining (a and d), and representative images are shown.
Glioma tissues over-expressed ganglioside GD3 and GD2
At 1 or 2 weeks after DF-1 cell injection, mice were sacrificed and glioma tissues were extirpated. Using these tissues, frozen sections were prepared for immunohistochemistry (IHC-F). We stained those sections with anti-GD3 and anti-GD2 mAbs (Fig. 1C). GD3/GD2 were highly expressed in glioma tissues of WT mice, as shown in red. However, normal brain tissues scarcely expressed those gangliosides (Fig. 2c, right). In GD3S-KO mice, neither GD3 nor GD2 was detected in glioma or normal tissues (Fig. 2c). HE staining of glioma tissues revealed that GD3S-KO mice showed a less aggressive histology with necrosis (right, indicated by a white arrow), and a clearer tumor border than WT mice (see black arrows) (Fig. 2d). Pathological diagnosis of WT mouse tumors was grade IV glioblastoma multiforme, as previously reported,28 and that of GD3S-KO mice was grade II–III oligodendrocytoma-like.
CD68+/Ibal+ MI/MΦ showed different localization patterns between WT and GD3S-KO mice
At one week after injection of DF-1 cells, the numbers of CD68+ cells increased in gliomas compared with those in normal tissues in both WT and GD3S-KO mice (Fig. 3a). At 2 weeks after injection, the number of CD68-positive (CD68+) cells as well as Iba1-positive (Ibal+) cells significantly increased in tumor tissues of GD3S-KO mice compared with those of WT mice (Fig. 3a).
Fig. 3.
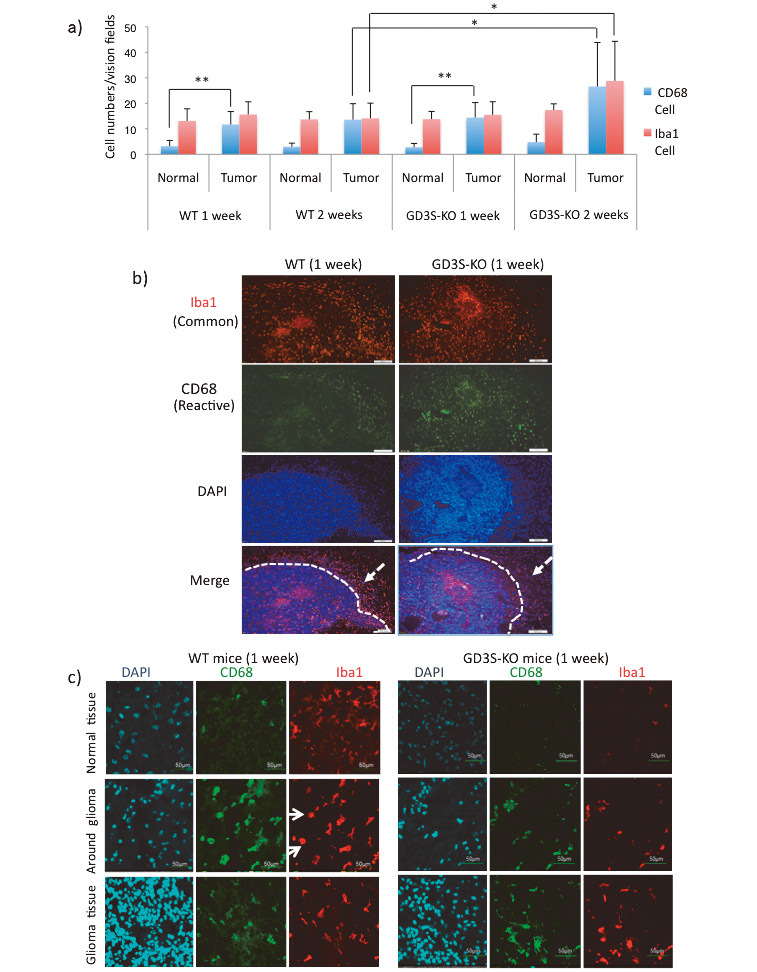
Activated CD68-positive (CD68+) MI/MΦ infiltrated tumor tissues in GD3S-KO mice
Fig. 3a: Total numbers of CD68+ microglia and Iba-1-positive (Iba-1+) cells in normal tissues and tumor tissues were counted at 1 and 2 weeks after DF-1 cell injection, and average numbers in 10 fields of view are presented. *p<0.05, **p<0.01.
Fig. 3b: Images of immunohistochemistry of glioma sections performed at 1 week after injection in WT and GD3S-KO mice. Anti-Iba1 and anti-CD68 staining was detected by Alexa546- and Alexa488-labeled secondary antibodies, respectively. Nuclei were stained with DAPI. (Scale bars = 500 μm)
Fig. 3c: Details of the distribution patterns of Iba-1/CD68-stained cells were examined using the same sections. Images of normal tissues (top), around gliomas (middle) (arrows indicate round cells), and glioma tissues (bottom) are presented. (Scale bars = 50 μm) Three samples each were analyzed for a–c experiments, and representative results are shown (b,c).
To observe MI/MΦ localization, we used Iba1 as a marker for MI/MΦ and CD68 as a marker for activated cells to stain the glioma frozen sections. The results showed that Ibal+ cells broadly existed inside glioma tissues (Fig. 3b, top) in the sections 1 week after injection. On the other hand, CD68+/Ibal+ cells showed different localization patterns between WT and GD3S-KO mice (2ndrow and bottom in Fig. 3b, and Fig. 3c). CD68+/Ibal+ cells formed a dense band surrounding the glioma mass of WT tumors. On the other hand, in GD3S-KO mice, many CD68+ cells were localized in glioma tissues. Furthermore, WT mouse sections showed highly activated (CD68+) cells with retracted processes (round shape) around gliomas, but not so many in glioma tissues (Fig. 3c, middle).
Glioma sections from GD3S-KO mice expressed higher levels of iNOS+ CD68+ MI/MΦ
To distinguish the phenotypes of MI/MΦ, we used iNOS as an M1-like cell marker. This antibody was used together with an anti-CD68 antibody. In WT mouse sections, iNOS expression was difficult to detect, and GD3S-KO mouse glioma sections also showed slightly low expression of iNOS at 1 week after DF-1 cell injection (Fig. 4a, left). However, GD3S-KO mouse sections showed increased numbers of iNOS+/CD68+ cells at 2 weeks after injection compared with WT mice (Fig. 4a, right). iNOS+/CD68+ cells were detected mainly in glioma tissues from GD3S-KO mice.
Fig. 4.
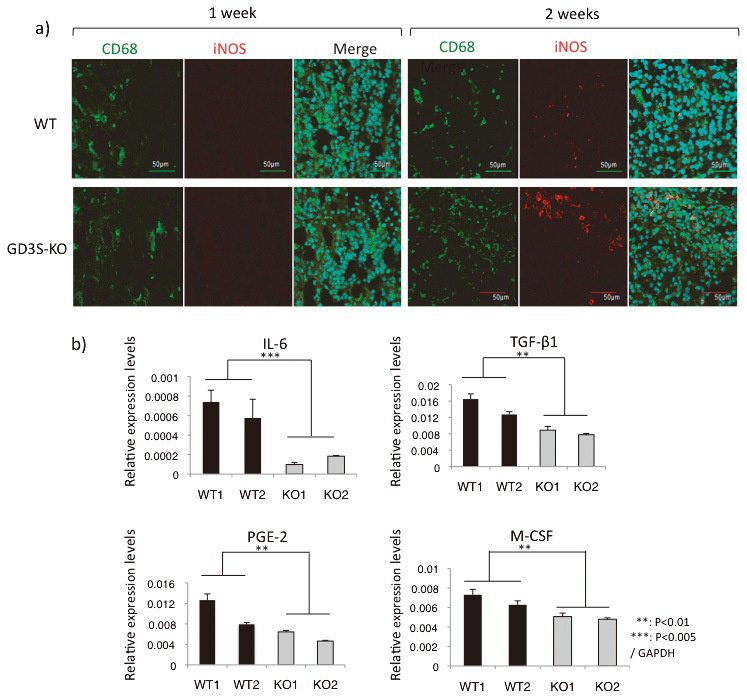
Glioma tissues from GD3S-KO mice expressed higher levels of iNOS, and primary cultured glioma cells from WT mice expressed higher levels of pro-inflammatory cytokines
Fig. 4a: Glioma tissues generated in WT and GD3S-KO mice were resected at 1 and 2 weeks after DF-1 cell injection, and those sections were stained by anti-CD68 antibody and anti-iNOS antibody. Alexa488-labeled goat-anti-mouse IgG antibody and Alexa568-labeled anti-rabbit IgG antibody were used as secondary antibodies, respectively. Three samples each were examined, and representative data are shown. Bars, 50 μm.
Fig. 4b: Total RNA was extracted from WT and GD3S-KO mouse-derived primary cultured glioma cells. Gene expression levels were analyzed by RT-qPCR. Two samples each were analyzed 3 times. Student’s t-test was performed for evaluation of the results. **p<0.01, ***p<0.001.
WT mouse-derived glioma cells expressed higher levels of pro-inflammatory cytokines
Although the IHC-F data suggested that MI/MΦ were reacting with glioma, as shown by iNOS staining (Fig. 4a), it remained to be determined whether this response represents an active anti-tumor defense mechanism or a tumor-supportive one. Thus, we investigated expression levels of cytokine genes in gliomas. We extracted RNA from primary cultured glioma cells, and performed RT-qPCR. Consequently, interleukin-6 (IL-6), transforming growth factor (TGF)-β1, prostaglandin E2 (PGE-2), and macrophage colony-stimulating factor (M-CSF) mRNA levels were significantly elevated in WT glioma-derived cells (Fig. 4b). Previous studies indicated that these cytokines could suppress M1-like or support M2-like glioma-associated MI/MΦ (GAMs).32,33,34 IL-6 was 4-fold higher in WT than in GD3S-KO mice. TGF-b1 and M-CSF also increased 50% more in WT than GD3S-KO mice.
DNA microarray showed different expression patterns of chemokine genes
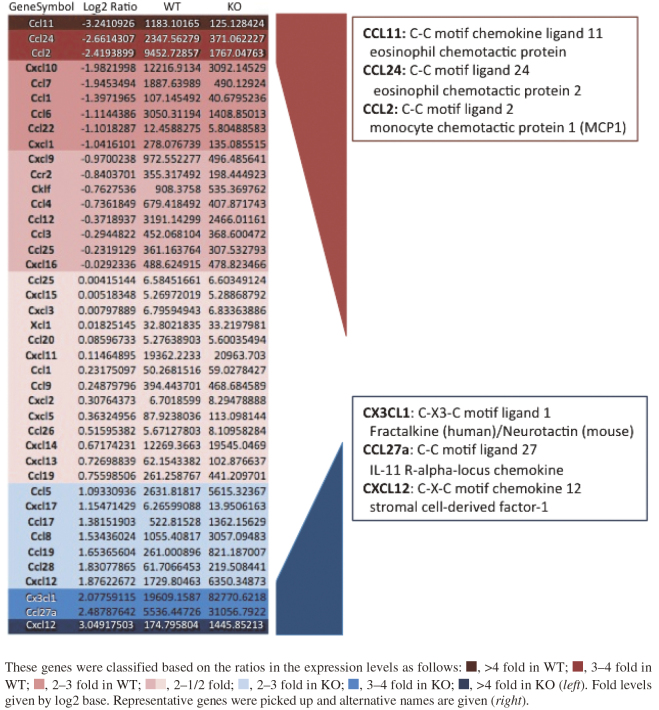
WT and GD3S KO mice show marked differences in the expression profiles of chemokines in glioma tissues on comparing the results of DNA microarray performed to screen and raise candidate genes for further analysis, as shown in Fig. 5. Therefore, expression levels of representative chemokine genes in primary cultured glioma cells were examined by RT-qPCR. As shown in Fig. 6a, Ccl24, Ccl2, and Ccl7 showed higher levels in WT than in GD3S-KO glioma cells, although Ccl11 did not show distinct differences. On the other hand, Cxcl12 and Ccl8 tended to increase in GD3S-KO with no clear significance.
Fig. 5.
DNA microarray showed different expression patterns of chemokine genes between WT and GD3S-KO mice
Fig. 6.
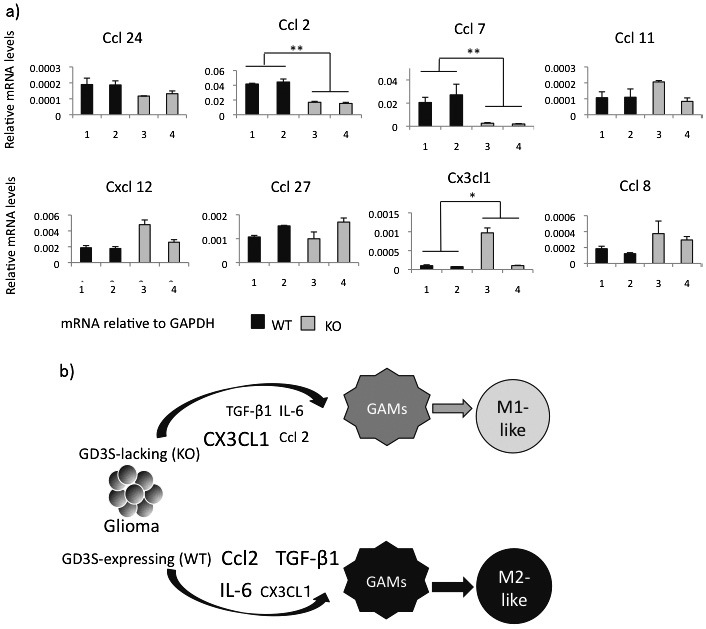
Chemokines showed distinct expression patterns between WT and GD3S-KO mice, leading to distinct types
Fig. 6a: RT-qPCR was performed for the representative chemokine genes identified in DNA microarray analysis (Fig. 5). The expression levels in primary cultured glioma cells derived from WT and GD3S-KO mice were analyzed. Two samples each were analyzed 3 times. *p<0.05, **p<0.01.
Fig. 6b: A schema showing the regulation of microenvironments by gliomas in WT and GD3S-KO mice. Glioma-associated MI/MΦ are differentially regulated by gliomas with/without GD3S, leading to the induction of M2-like or M1-like cells, respectively.
As summarized in Fig. 6b, it was considered that generated gliomas altered GAMs to the M2-like phenotype based on increased expression of TGF-β1, IL-6, and CCL2 in WT mice. On the other hand, M1-like GAMs were dominant in GD3S-KO mice based on the increased CXCL1 and reduced levels of TGF-β1, IL-6, and CCL2.
DISCUSSION
In this study, we generated gliomas in WT and GD3S-KO mice using an RCAS/Gtv-a system. Tv-a is an avian leukemia virus receptor, expressed under the regulation of the GFAP promoter in Gtv-a mice.28 The gliomas in these mice showed a similar pathologic signature to human glioblastoma multiforme. We bred p53-deficient mice with both GD3S-KO and WT mice as a common genetic background to promote gliomagenesis.
We previously reported increased malignant properties of human glioma cells based on the expression of GD3/GD2,22 and also enhanced malignant cell signals in mouse glioma models23 in WT mice compared with GD3S-KO mice. GD3S also conferred tumor-stem cell properties.24 In addition to the alteration in phenotypes of tumor cells themselves, effects of GD3S on the tumor environments were also suggested. We actually observed that the density of vessels was higher in gliomas of WT mice than of GD3S-KO mice in the tumor tissues (Fig. 2d). Other groups also demonstrated that GD3 enhanced the release of vascular endothelial growth factor.35 Here, we elucidated that GD3S deficiency altered not only glioma phenotypes, but also the tumor microenvironment including the nature of MI/MΦ and their distribution.
CD11b, CD45, Iba1, and F4/80 have been used as general markers to label MI/MΦ, but they are actually difficult to distinguish except for differential CD45 expression levels: CD11b+CD45high for macrophages and CD11b+CD45low for microglia.8,9,12 Therefore, we mainly used the term MI/MΦ here as used in many other studies.8,36,37 In addition, we used CD68 as a marker for activated MI/MΦ.8 M1 cells are capable of stimulating anti-tumor immune responses by presenting antigens to adaptive immune cells, producing cytokines and phagocytosing tumor cells.15 M2 polarization prevents the production of cytokines required to support anti-tumor CD8+ T cells and CD4+ helper T cells, and promotes the function of CD4+ regulatory T cells, thereby playing tumor supportive roles as M2 polarized MI/MΦ.7,14
There are several lines of evidences suggesting that the survival rate of glioma patients is associated with the M1/M2 ratio of TAM (or GAM).9,16 Accordingly, many studies demonstrated that “tumor-educated macrophages” promote tumor progression,32 or glioma cancer stem cells induce immunosuppressive MI/MΦ37 promoting the progression of gliomas.33,37,38
In our study of IHC-F and RT-qPCR, we observed differences in the numbers and localization of CD68+ cells inside glioma tissues between WT and GD3S-KO mice. After 2 weeks of DF-1 cell injection, GD3S-KO mouse sections showed increased numbers of MI/MΦ (Iba1+/CD68+) inside gliomas, probably due to the reduced expression of TGF-β1 mRNA (Fig. 4b). TGF-β1 is known as a factor associated with inhibiting microglia cell proliferation and the production of pro-inflammatory cytokines in vitro.39 The difference in the localization pattern of CD68+/Ibal+ microglia may be because WT gliomas release migration-inhibitory factor (MIF) to inhibit the migration of microglia into glioma tissues. Numbers of iNOS+/CD68+ microglia were lower in glioma tissues of WT mice than in those of GD3S-KO mice. This may be due to high IL-6 expression levels in WT mice. IL-6 also plays an important role in tumor growth and promotes the polarization of M1-like cells (high iNOS) towards M2-like cells (low iNOS), resulting in the decreased ratio of M1 to M2, and further affecting the tumorigenicity and progression of gliomas.16,40
Glioma cells secrete a wide variety of factors that suppress immune cells, such as interleukin-4, IL-6, interleukin-10, M-CSF, MIF,32,39 TGF-β,39 and PGE2,41 and many other molecules.11 These cytokines are known to change the polarization of M1 macrophages towards the M2 phenotype.17,36,37 CCL2 is a representative molecule: it induces the M2-type MI/MΦ34 and recruits regulatory T cells and myeloid-derived suppressor cells.42 Periostin secreted from glioblastoma stem cells also recruits M2-type macrophages.43 Tumor-associated MI/MΦ subsequently secrete tumor cell chemo-attractants.11 These cross-talks lead to changes in the local milieu where tumor cells grow and infiltrate. Accordingly, DNA microarray and RT-qPCR of chemokine genes revealed distinct expression profiles between WT- and GD3S-KO mouse-derived gliomas.
Taken together, these observations suggest that the expression of GD3S causes activation of glioma cells,22,23,44 and makes glioma cells secrete cytokines to promote MI/MΦ polarizations from M1-like towards M2-like phenotypes, as presented in a schema (Fig. 6b). Consequently, these results suggest that growth factors and chemokines that enhance tumor progression/invasion via M2-like MI/MΦ could be targets of glioma therapy,9-11,32 and GD3S might also be one of such target molecules. Thus, expression levels of GD3/GD2 and GD3S may be good prognostic indicators for glioma, and synthetic machinery for GD3/GD2 by GD3S might be a suitable therapeutic target for both malignant phenotypes of glioma cells and altered tumor environments.
ACKNOWLEDGMENTS
This study was supported by grants-in aids from the Ministry of Education, Culture, Sports, and Technology of Japan (MEXT) (18H02628, 19K22518), and by JST-CREST (Grant Number: JPMJCR17H2).
CONFLICT OF INTERESTS
Authors have no conflict of interest to be disclosed.
Abbreviations
- CNS
central nervous system
- DMEM
Dulbecco’s modified Eagle medium
- GAMs
glioma-associated microglia/macrophages
- GD3S
GD3 synthase (St8sia1)
- GFAP
glial fibrillary acidic protein
- Gtv-a
GFAP-transgenic tv-a
- IL-6
interleukin-6
- iNOS
inducible nitric oxide synthase
- M-CSF
macrophage colony-stimulating factor
- MIF
migration inhibitory factor
- MI/MΦ
microglia/macrophages
- PDGF
platelet-derived growth factor
- PGE2
prostaglandin E2
- RCAS
replication-competent ALV splice acceptor
- TGF
transforming growth factor
REFERENCES
- 1.Huse JT, Holland EC. Targeting brain cancer: advances in the molecular pathology of malignant glioma and medulloblastoma. Nat Rev Cancer. 2020;10(5):319–331. doi: 10.1038/nrc2818. [DOI] [PubMed]
- 2.Xie Q, Mittal S, Berens ME. Targeting adaptive glioblastoma: an overview of proliferation and invasion. Neuro Oncol. 2014;16(12):1575–1584. doi: 10.1093/neuonc/nou147. [DOI] [PMC free article] [PubMed]
- 3.Hakomori S. Philip Levine award lecture: blood group glycolipid antigens and their modifications as human cancer antigens. Am J Clin Pathol. 1984;82(6):635–648. doi: 10.1093/ajcp/82.6.635. [DOI] [PubMed]
- 4.Lloyd KO. Humoral immune responses to tumor-associated carbohydrate antigens. Semin Cancer Biol. 1991;2(6):421–431. [PubMed]
- 5.Hamamura K, Furukawa K, Hayashi T, et al. Ganglioside GD3 promotes cell growth and invasion through p130Cas and paxillin in malignant melanoma cells. Proc Natl Acad Sci U S A. 2005;102(31):11041–11046. doi: 10.1073/pnas.0503658102. [DOI] [PMC free article] [PubMed]
- 6.Furukawa K, Hamamura K, Ohkawa Y, Ohmi Y, Furukawa K. Disialyl gangliosides enhance tumor phenotypes with differential modalities. Glycoconj J. 2012;29(8–9):579–584. doi: 10.1007/s10719-012-9423-0. [DOI] [PubMed]
- 7.Charles NA, Holland EC, Gilbertson R, Glass R, Kettenmann H. The brain tumor microenvironment. Glia. 2012;60(3):502–514. doi: 10.1002/glia.21264. [DOI] [PubMed]
- 8.Garofalo S, D’Alessandro G, Chece G, et al. Enriched environment reduces glioma growth through immune and non-immune mechanisms in mice. Nat Commun. 2015;6:6623. doi: 10.1038/ncomms7623. [DOI] [PMC free article] [PubMed]
- 9.Quail DF, Joyce JA. The microenvironmental landscape of brain tumors. Cancer Cell. 2017;31(3):326–341. doi: 10.1016/j.ccell.2017.02.009. [DOI] [PMC free article] [PubMed]
- 10.Pyonteck SM, Akkari L, Schuhmancher AJ, et al. CSF-1R inhibition alters macrophage polarization and blocks glioma progression. Nat Med. 2013;19(10):1264–1272. doi: 10.1038/nm.3337. [DOI] [PMC free article] [PubMed]
- 11.Hambardzumyan D, Gutmann DH, Kettenmann H. The role of microglia and macrophages in glioma maintenance and progression. Nat Neurosci. 2016;19(1):20–27. doi: 10.1038/nn.4185. [DOI] [PMC free article] [PubMed]
- 12.Sedgwick JD, Schwender S, Imrich H, Dörries R, Butcher GW, ter Meulen V. Isolation and direct characterization of resident microglial cells from the normal and inflamed central nervous system. Proc Natl Acad Sci U S A. 1991;88(16):7438–7442. doi: 10.1073/pnas.88.16.7438. [DOI] [PMC free article] [PubMed]
- 13.Perry VH, Nicoll JAR, Holmes C. Microglia in neurodegenerative disease. Nat Rev Neurol. 2010;6(4):193–201. doi: 10.1038/nrneurol.2010.17. [DOI] [PubMed]
- 14.Martinez FO, Sica A, Mantovani, A, Locati M. Macrophage activation and polarization. Front Biosci. 2008;13:453–461. doi: 10.2741/2692. [DOI] [PubMed]
- 15.Murray PJ, Allen JE, Biswas SK, et al. Macrophage activation and polarization: nomenclature and experimental guidelines. Immunity. 2014;41(1):14–20. doi: 10.1016/j.immuni.2014.06.008. [DOI] [PMC free article] [PubMed]
- 16.Redente EF, Dwyer-Nield LD, Merrick DT, et al. Tumor progression stage and anatomical site regulate tumor-associated macrophage and bone marrow-derived monocyte polarization. Am J Pathol. 2010;176(6):2972–2985. doi: 10.2353/ajpath.2010.090879. [DOI] [PMC free article] [PubMed]
- 17.Gabrusiewicz K, Ellert-Miklaszewska A, Lipko M, Sielska M, Frankowska M, Kaminska B. Characteristics of the alternative phenotype of microglia/ macrophages and its modulation in experimental gliomas. PLoS One. 2011;6(8):e23902. doi: 10.1371/journal.pone.0023902. [DOI] [PMC free article] [PubMed]
- 18.Ohkawa Y, Miyazaki S, Hamamura K, et al. Ganglioside GD3 enhances adhesion signals and augments malignant properties of melanoma cells by recruiting integrins to glycolipid-enriched microdomains. J Biol Chem. 2010;285(35):27213–27223. doi: 10.1074/jbc.M109.087791. [DOI] [PMC free article] [PubMed]
- 19.Ohmi Y, Kambe M, Ohkawa Y, et al. Differential roles of gangliosides in malignant properties of melanomas. PLoS One. 2018;13(11):e0206881. doi: 10.1371/journal.pone.0206881. [DOI] [PMC free article] [PubMed]
- 20.Yoshida S, Fukumoto S, Kawaguchi H, Sato S, Ueda R, Furukawa K. Ganglioside GD2 in small cell lung cancer cell lines: enhancement of cell proliferation and mediation of apoptosis. Cancer Res. 2001;61(10):4244–4252. [PubMed]
- 21.Shibuya H, Hamamura K, Hotta H, et al. Enhancement of malignant properties of human osteosarcoma cells with disialyl gangliosides GD2/GD3. Cancer Sci. 2012;103(9):1656–1664. doi: 10.1111/j.1349-7006.2012.02344.x. [DOI] [PMC free article] [PubMed]
- 22.Iwasawa T, Zhang P, Ohkawa Y, et al. Enhancement of malignant properties of human glioma cells by ganglioside GD3/GD2. Int J Oncol. 2018;52(4):1255–1266. doi: 10.3892/ijo.2018.4266. [DOI] [PubMed]
- 23.Ohkawa Y, Momota H, Kato A, et al. Ganglioside GD3 enhances invasiveness of gliomas by forming a complex with platelet-derived growth factor receptor α and Yes kinase. J Biol Chem. 2015;290(26):16043–16058. doi: 10.1074/jbc.M114.635755. [DOI] [PMC free article] [PubMed]
- 24.Yeh SC, Wang PY, Lou YW, et al. Glycolipid GD3 and GD3 synthase are key drivers for glioblastoma stem cells and tumorigenicity. Proc Natl Acad Sci U S A. 2016;113(20):5592–5597. doi: 10.1073/pnas.1604721113. [DOI] [PMC free article] [PubMed]
- 25.Aixinjueluo W, Furukawa K, Zhang Q, et al. Mechanisms for the apoptosis of small cell lung cancer cells induced by anti-GD2 monoclonal antibodies: roles of anoikis. J Biol Chem. 2005;280(33):29828–29836. doi: 10.1074/jbc.M414041200. [DOI] [PubMed]
- 26.Kaneko K, Ohkawa Y, Hashimoto N, et al. Neogenin, defined as a GD3-associated molecule by enzyme-mediated activation of radical sources, confers malignant properties via intracytoplasmic domain in melanoma cells. J Biol Chem. 2016;291(32):16630–16643. doi: 10.1074/jbc.M115.708834. [DOI] [PMC free article] [PubMed]
- 27.Esaki N, Ohkawa Y, Hashimoto N, et al. ASC amino acid transporter 2, defined by enzyme-mediated activation of radical sources, enhances malignancy of GD2- positive small-cell lung cancer. Cancer Sci. 2018;109(1):141–153. doi: 10.1111/cas.13448. [DOI] [PMC free article] [PubMed]
- 28.Hambardzumyan D, Amankulor NM, Helmy KY, Becher OJ, Holland EC. Modeling adult gliomas using RCAS/t-va technology. Transl Oncol. 2009;2(2):89–95. doi: 10.1593/tlo.09100. [DOI] [PMC free article] [PubMed]
- 29.Donehower LA, Harvey M, Slagle BL, et al. Mice deficient for p53 are developmentally normal but susceptible to spontaneous tumours. Nature. 1992;356(6366):215–221. doi: 10.1038/356215a0. [DOI] [PubMed]
- 30.Okada M, Furukawa K, Yamashiro S, et al. High expression of ganglioside α-2,8-sialyltransferase(GD3 synthase) gene in adult T-cell leukemia cells unrelated to the gene expression of human T-lymphotropic virus type I. Cancer Res. 1996;56(12):2844–2848. [PubMed]
- 31.Zhao J, Furukawa K, Fukumoto S, et al. Attenuation of the interleukin 2 signal in the spleen cells of complex ganglioside-lacking mice. J Biol Chem. 1999;274(20):13744–13747. doi: 10.1074/jbc.274.20.13744. [DOI] [PubMed]
- 32.Pollard JW. Tumour-educated macrophages promote tumor progression and metastasis. Nat Rev Cancer. 2004;4(1):71–78. doi: 10.1038/nrc1256. [DOI] [PubMed]
- 33.Komohara Y, Ohnishi K, Kuratsu J, Takeya M. Possible involvement of the M2 anti-inflammatory macrophage phenotype in growth of human gliomas. J Pathol. 2008;216(1):15–24. doi10.1002/path.2370. [DOI] [PubMed]
- 34.Roca H, Varsos ZS, Sud S, Craig MJ, Ying C, Pienta KJ. CCL2 and interleukin-6 promote survival of human CD11b+ peripheral blood mononuclear cells and induce M2-type macrophage polarization. J Biol Chem. 2009;284(49):34342–34354. doi: 10.1074/jbc.M109.042671. [DOI] [PMC free article] [PubMed]
- 35.Zeng G, Gao L, Birklé S, Yu RK. Suppression of ganglioside GD3 expression in a rat F-11 tumor cell line reduces tumor growth, angiogenesis, and vascular endothelial growth factor production. Cancer Res. 2000;60(23):6670–6676. [PubMed]
- 36.Wu A, Wei J, Kong LY, et al. Glioma cancer stem cells induce immunosuppressive macrophages/microglia. Neuro Oncol. 2010;12(11):1113–11125. doi: 10.1093/neuonc/noq082. [DOI] [PMC free article] [PubMed]
- 37.Zhai H, Heppner FL, Tsirka SE. Microglia/macrophages promote glioma progression. Glia. 2011;59(3):472–485. doi: 10.1002/glia.21117. [DOI] [PMC free article] [PubMed]
- 38.Sica A, Schioppa T, Mantovani A, Allavena P. Tumour-associated macrophages are a distinct M2 polarised population promoting tumour progression: potential targets of anti-cancer therapy. Eur J Cancer. 2006;42(6):717–727. doi: 10.1016/j.ejca.2006.01.003. [DOI] [PubMed]
- 39.Ye XZ, Xu SL, Xin YH, et al. Tumor-associated microglia/macrophages enhance the invasion of glioma stem-like cells via TGF-β1 signaling pathway. J Immunol. 2012;189(1):444–453. doi: 10.4049/jimmunol.1103248. [DOI] [PubMed]
- 40.MacMicking J, Xie QW, Nathan C. Nitric oxide and macrophage function. Annu Rev Immunol. 1997;15:323–350. doi: 10.1146/annurev.immunol.15.1.323. [DOI] [PubMed]
- 41.Jiang J, Qiu J, Li Q, Shi Z. Prostaglandin E2 signaling: alternative target for glioblastoma? Trends Cancer. 2017;3(2):75–78. doi: 10.1016/j.trecan. 2016.12.002. [DOI] [PMC free article] [PubMed]
- 42.Chang AL, Miska J, Wainwright DA, et al. CCL2 produced by the glioma microenvironment is essential for the recruitment of regulatory T cells and myeloid-derived suppressor cells. Cancer Res. 2016;76(19):5671–5682. doi: 10.1158/0008-5472.CAN-16-0144. [DOI] [PMC free article] [PubMed]
- 43.Zhou W, Ke SQ, Huang Z, et al. Periostin secreted by glioblastoma stem cells recruits M2 tumour-associated macrophages and promotes malignant growth. Nat Cell Biol. 2015;17(2):170–182. doi: 10.1038/ncb3090. [DOI] [PMC free article] [PubMed]
- 44.Furukawa K, Ohkawa Y, Yamauchi Y, Hamamura K, Ohmi Y, Furukawa K. Fine tuning of cell signals by glycosylation. J Biochem. 2012;151(6):573–578. doi: 10.1093/jb/mvs043. [DOI] [PubMed]


