Abstract
X-ray induced molecular luminescence (XML) is a phenomenon that can be utilized for clinical, deep-tissue functional imaging of tailored molecular probes. In this study, a survey of common or clinically approved fluorophores was carried out for their megavoltage X-ray induced excitation and emission characteristics. We find that direct scintillation effects and Cherenkov generation are two possible ways to cause these molecules’ excitation. To distinguish the contributions of each excitation mechanism, we exploited the dependency of Cherenkov radiation yield on X-ray energy. The probes were irradiated by constant dose of 6 MV and 18 MV X-ray radiation, and their relative emission intensities and spectra were quantified for each X-ray energy pair. From the ratios of XML, yield for 6 MV and 18 MV irradiation we found that the Cherenkov radiation dominated as an excitation mechanism, except for aluminum phthalocyanine, which exhibited substantial scintillation. The highest emission yields were detected from fluorescein, proflavin and aluminum phthalocyanine, in that order. XML yield was found to be affected by the emission quantum yield, overlap of the fluorescence excitation and Cherenkov emission spectra, scintillation yield. Considering all these factors and XML emission spectrum respective to tissue optical window, aluminum phthalocyanine offers the best XML yield for deep tissue use, while fluorescein and proflavine are most useful for subcutaneous or superficial use.
Keywords: X-ray induced molecular luminescence (XML), Cherenkov radiation, scintillation, therapeutic megavoltage X-rays, organic fluorophores
INTRODUCTION
X-ray induced molecular luminescence (XML) signals can be used for molecular imaging in tissue, providing deep tissue sampling of relevant metabolic information if the probe is coupled to a targeting approach [1–3]. However, the origins of luminescence from organic molecules by X-ray excitation can be unclear at times, with the general phenomenon being referred to as radioluminescence. This can originate from different parts of the interaction cascade [4], often from secondary or tertiary radiation sources, being largely scattered electrons or low energy photons with high interaction cross sections. In general, organic molecules can be non-radiatively excited via scintillation mechanisms, or radiatively excited by Cherenkov radiation originating from high energy charged particles’ interaction with matter. However, the exact contribution of each mechanism is uncertain in most biologically relevant molecules. Yet, it is important to parse this out because the origin of the signal can affect the choice of X-ray energy and source used, as well as the efficiency of use. In this article we survey a set of molecular reporters with the goal to evaluate their potential as radioluminescent reporters, as well as to determine their primary mode of interaction with therapeutic (megavoltage) X-rays.
The choice of reporters tested here was guided by their having regulatory approval for human use as fluorescent agents or having been involved in human trials. The specific agents examined were fluorescein, methylene blue, proflavine, verteporfin, protoporphyrin IX, aluminum phthalocyanine. In an effort to examine direct scintillation further, additional metallophthalocyanines were included that might have high interaction cross section with X-rays, such as cobalt phthalocyanine and gadolinium phthalocyanine. In this survey their potential as radioluminescent reporters was quantified for emission yield, and secondarily their emission yield energy dependence was used to assay their primary mode of interaction with the X-rays. Scintillation is a direct linear reporter of dose, independent of energy in most cases of high energy MV photons, while changes in the X-ray energy spectrum from 6 MV to 18 MV [5] increases Cherenkov light yield by nearly a factor of two. The ratio of XML light yield per unit dose or per unit Cherenkov intensity was used as an assay to discern if the origins of radioluminescence from each molecule was Cherenkov mediated or scintillation mediated. Parsing out the emission origins can be challenging because of solvent radioluminescence background, which is largely Cherenkov light. Analysis of XML emission spectra was performed to separate the Cherenkov solvent background from the absorption and fluorescence of the probes. Excitation origins of the probes were evaluated looking at the 18 MV/6 MV signal ratios around their emission wavelength relative to the ratio of a scintillator and 1× phosphate buffered saline solution (PBS). This data should provide a useful way to determine which clinical or in vivo compatible tracers could be good radioluminescent probes for XML.
METHODS
Samples
The fluorophores considered in this survey are as follows: Fluorescein sodium salt (Fluorescein, Fluka, St Louis, MO), Proflavine hemisulfate salt hydrate (Proflavine, Sigma-Aldrich, St Louis, MO), Al(III) Phthalocyanine Chloride Tetrasulfonic Acid (AlPcS4, Frontier Scientific, Logan, UT), Co(II) Phthalocyanine Tetrasulfonic Acid (CoPcS4, Frontier Scientific, Logan, UT), Gd(III) Phthalocyanine tetrasulfonate tetrasodium salt hydroxide (GdPcS4, Frontier Scientific, Logan, UT), Protoporphyrin IX (PpIX, Sigma-Aldrich, St Louis, MO), Verteporfin (Sigma-Aldrich, St Louis, MO), Methylene blue (MB, Sigma-Aldrich, St Louis, MO).
The influence of different solvents on the molecules fluorescent efficiency was studied testing three different solvents, these being PBS (DPBS 1X, Corning Inc., Corning, NY), Dimethyl sulfoxide (DMSO) (Sigma-Aldrich, St Louis, MO) and Methanol (Fisher Chemicals, Waltham, MA). In this first step, all probes were tested in each of the solvents at 10 μM concentration.
In subsequent studies, all fluorophores were prepared in PBS solution. Both Verteporfin and Protoporphyrin IX (PpIX) were pre-dissolved in DMSO with a ratio of 0.1 mg/mL and thereafter dissolved in PBS at low concentrations as listed. The concentrations used for each probe in latter studies was chosen according to the initial results where maximal emission yield was found.
Irradiation
All samples were irradiated using a Varian TrueBeam (Varian Medical Systems, Palo Alto, CA) linear accelerator. A 10×10 cm2 photon beam was used, the energy being either 6 MV or 18 MV. For each energy, an extra thickness (1 cm and 3 cm, respectively) of Solid Water plastic (Sun Nuclear, Melbourne, FL) was added underneath the sample such that each sample was located at the maximum dose deposition depth [6]. All samples were irradiated from the bottom and imaged from the top in an attempt to reduce X-ray noise on the detector while maximizing the signal as shown in Fig. 1.
Fig. 1.
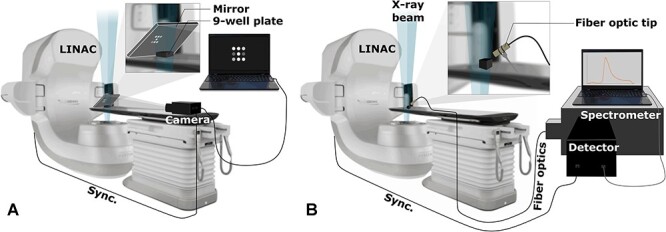
(A) Wide field imaging of nine-well plate; and (B) spectrally resolved imaging experimental setup. The X-ray beam is delivered from the bottom and the signal is acquired from the top using respectively a widefield camera coupled with a mirror and a fiber optic hold above the sample.
For each energy comparison, the dose delivered to samples was monitored using radiochromic film dosimeters (EBT-XD, Ashland, Bridgewater, NJ) in order to confirm that the same dose was delivered between 6 MV and 18 MV. The dose measured for 6 MV and 18 MV was 522 ± 3 cGy and 523 ± 3 cGy respectively.
Intensity and spectroscopy
In order to explore Cherenkov and scintillations’ contribution in the luminescent processes, an intensified charge-coupled device (ICCD) camera (PiMAX3, Princeton Instruments, Acton, MA) was coupled to a SpectraPro 2300i spectrograph (Acton Research Corporation, Princeton Instruments) to capture luminescence emission spectra (Cherenkov vs scintillation assay). The spectrometer was calibrated for its spectral detection sensitivity. A 10 m fiber optic bundle was used to couple the sample emission to spectrometer, which was located outside the shielded medical linear accelerator vault in order to minimize stray X-ray noise effects on ICCD. The end of the fiber was placed above an 8 mL well with an angle of approximately 30° with respect to the solution surface (see Fig. 1b). Since the ionizing beam induced luminescence effect in the fiber [5], the sample was placed at the edge of the 10×10 cm2 beam in order to minimize the interaction between the photon beam and the fiber tip. For each probe, 600 monitor units (MU) were delivered at a rate of 600 MU/min. To ensure correct spectral sensitivity calibration that includes the fiber and other experimental conditions, additional correction steps were performed. The persistent X-ray induced scintillation signal from the fiber was subtracted from the raw data for each energy. Further, we used a known ~1/λ2 proportionality of emitted Cherenkov photons per wavelength λ of a pure Cherenkov emitter [7], in our case pure PBS. The detected emission spectrum of pure PBS under 18 MV irradiation exhibited a good match to the theoretical profile in the spectral range of 580–750 nm, but it deviated below 580 nm due to limited signal-to-noise ratio of the ICCD detector. We therefore created a spectral correction profile k(λ) by fitting a k(λ) · 1/λ2 model to the measured PBS spectrum in the 580–750 nm spectral range using an iterative non-linear least square method (Matlab R2018a, The MathWorks Inc., Natick, MA), and by taking the ratio of measured spectra to the fitted model in the full spectral range of 450–750 nm. This calibration was then applied to all fluorescence spectra acquired. Finally, a plastic scintillator EJ-212 (Eljen, Windsor, CT) was measured to serve as a control of pure scintillator response, assuming Cherenkov light is negligible to the large scintillation yield of EJ-212.
For quantitative analysis of the probes’ integrated emission spectra (concentration dependence study), the fluorophores at their ideal concentrations were irradiated and their luminescence emissions were imaged in a black nine-well plate using a red-sensitive PiMAX4 (Princeton Instruments, Acton, MA) intensified CCD camera. For each probe, solutions were made at zero, 10 nM, 100 nM, 500 nM, 1 μM, 5 μM and 10 μM. In addition, data points were added for proflavine at 50 μM and for fluorescein at 50 μM, 100 μM and 500 μM. 2 mL (corresponding to 2 cm thickness) aliquots were transferred to 2 cm deep wells made of black high-density polyethylene, positioned on top of Solid Water plastic slab. In this setup, the samples were irradiated from below (Gantry angle of 180°) and imaged using a front-surface mirror making a 45° angle with the upper surface of the well plate (see Fig. 1a). This configuration allowed for minimization of the X-ray noise on the CCD sensor. The intensifier pulses of 4 μs width were synchronized with the linear accelerator pulses. Each acquisition was made over 600 MU at a rate of 600 MU/min. All acquired frames were thereafter summed to obtain a total number of photons detected over the whole dose delivery. The exact same setup was used for sample irradiation in the solvent effect study.
For both spectrally resolved data and wide field data, the measurement error was calculated using a set of five measurements in the same conditions. This error was then added to the single measurement data from Figs 2,3 and 5.
Fig. 2.
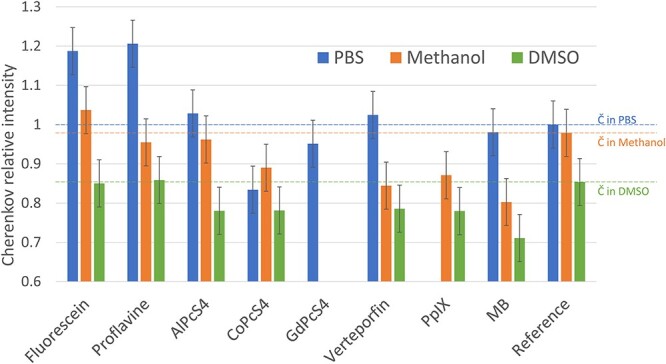
Luminescent signal from nine organic molecules dissolved in PBS (blue), methanol (orange) and DMSO (green), irradiated by an 18 MV X-ray beam. The signals are normalized to the Cherenkov signal in PBS.
Fig. 3.
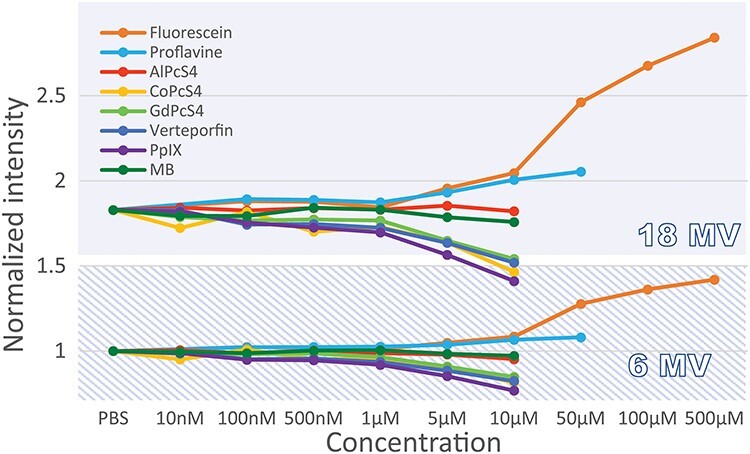
Comparison of the radioluminescence from nine probes in PBS solution exposed to 18 MV and 6 MV X-ray beams, depending on concentration. The intensity is normalized to the Cherenkov level in PBS corresponding to 6 MV irradiation.
Fig. 5.
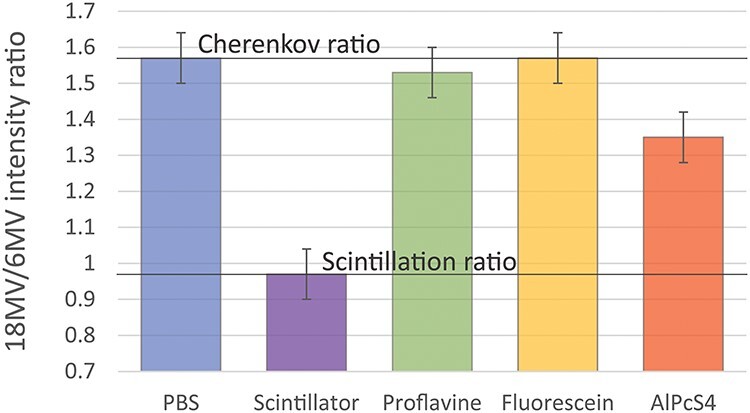
Ratios of 18 MV to 6 MV signals from pure PBS, a scintillator, proflavine, fluorescein and AlPcS4. The ratio for PBS Cherenkov, 1.57 ± 0.07, is normalized by the ratio coming from the scintillator equals 0.97 ± 0.07. The organic molecules show ratios in between, depending on the influence of each phenomenon.
RESULTS
Solvent effects
It has been shown that X-ray excited luminescence properties of molecules can be altered by a solvent [8]. Here we studied the influence of three different solvents on relative XML intensity. Fig. 2 shows the spectrally-unresolved XML intensities detected in red spectral range detected from 10 μM fluorophore solutions and pure solvents irradiated by 18 MV photon beam. The missing data corresponds to cases where the contrast agent was insoluble in the solvent. All probes except CoPc4 exhibit the brightest luminescence when dissolved in PBS, yet only fluorescein, proflavine, AlPcS4, and Verteporfin showed signals distinctly above the Cherenkov level. In the case of Verteporfin, the slightly superior signal was within the accuracy level of this measurement. Despite the fact that the Cherenkov signal is almost as important in methanol as in PBS, we observed that this solvent quenched the fluorescence of all probes. The level of this quenching importance varied with the probe. Only fluorescein exhibited an emission signal above the Cherenkov signal in methanol. Finally, no probe showed a higher signal than the Cherenkov signal in DMSO. While Cherenkov intensity is far lower in DMSO than in PBS and methanol, DMSO also showed strong quenching for most of the probes. Fluorescence emission quantum yields, maximum excitation and emission wavelengths, fluorescent lifetime and solubility of each agents are shown in Table 1 for comparison.
Table 1.
Organic fluorescent probes characteristics. Fluorescence quantum yield (QY), maximum excitation/emission wavelength, lifetime and solubility corresponding to each probe listed in Fig. 2 [8–19]
| Probe | QY | λex (nm) | λem (nm) | Lifetime (ns) | Solubility |
|---|---|---|---|---|---|
| Fluorescein | 79% | 494 | 521 | 4 | PBS |
| Proflavine | 44% | 444 | 515 | 4 | PBS |
| AIPcS4 | 40% | 673 | 680 | 5 | PBS |
| GdPcS4 | - | 636 | 688 | - | PBS |
| CoPcS4 | - | 669 | - | - | PBS |
| Verteporfin | 5% | 436 | 692 | 6 | DMSO |
| PpIX | 9% | 405 | 634 | 16 | DMSO |
| MB | 5% | 664 | 684 | <1 | PBS |
Concentration dependence
To find the maximum of fluorescence emission, the spectra were measured at different probe concentrations when irradiated by both 6 MV and 18 MV X-rays. Fig. 3 shows light intensity normalized to 6 MV Cherenkov in PBS, as a function of concentration for all probes listed above. The dotted lines correspond to the 6 MV photon beam while the solid lines represent the 18 MV data. For each probe, the intensity level was compared to the luminescence coming from PBS, which corresponds to Cherenkov light only. In the case of Fluorescein, Proflavine and AlPcS4, light emission increased when a certain concentration was reached and then saturated at higher concentrations. For all probes, we observe that higher concentration involved a loss of luminescent signal, presumably due to the effects of probe absorption of the Cherenkov light of the medium. The ratio of intensity between 6 MV and 18 MV for PBS is 1.83 ± 0.06, which corresponds to the expected ratio for Cherenkov [20].
Cherenkov vs scintillation assay
Fig. 4 shows the emission spectra of an EJ-212 scintillator, AlPcS4, proflavine and fluorescein when exposed to 6 MV and 18 MV X-ray beams. The spectra of molecular probes also include Cherenkov emission spectra of PBS for each used X-ray energy. Each figure is overlayed with visible light absorption and emission spectra (acquired respectively with Cary 50 Bio UV–Visible Spectrophotometer, Agilent Technologies, Santa Clara, CA and Fluoromax 4, Horiba, Kyoto, Japan) for comparison purposes. The difference of signal between the two energies is shown by Fig. 5 which represents the ratio of light intensity around the fluorophores’ maximum emission wavelength (± 10 nm) between the 18 MV and 6 MV signal. Again, on these graphs, the ratio corresponding to PBS is added for comparison.
Fig. 4.
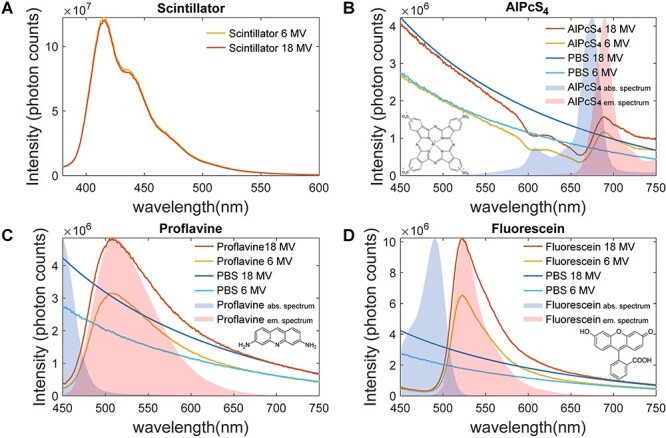
Comparison of 18 MV and 6 MV emission spectra for: (A) scintillator at a fixed dose level; and those for (B) AlPcS4; (C) Proflavine; and (D) Fluorescein in PBS. Each organic molecule spectra is overlapped with 18 MV and 6 MV PBS emission spectra as well as the molecules visible light absorption and emission spectra. Inset in each graph is its molecular bond diagram.
The coincidence of the two curves in the scintillator graph (Fig. 4 [A]) indicates that there is no change of light emission as the energy varies. This is highlighted by the corresponding constant ratio of 0.97 ± 0.07 on Fig. 5. However, this is not true for the three organic molecules which show a different luminescence intensity as the X-ray beam energy varies. In the case of proflavine and fluorescein, we measured ratios of 1.53 ± 0.07 and 1.57 ± 0.07, respectively, which are similar to the ratio of Cherenkov emission intensities from PBS. On the other hand, AlPcS4 is showing an inconsistency in its ratio which goes down to approximately 1.35 ± 0.07 around its emission peak.
Finally looking at X-ray emission spectra, we see that many probes exhibit luminescence decreases in comparison to the PBS spectra. These correspond to the probes’ absorption spectra. Around their maximum emission wavelength, CoPcS4, GdPcS4, Verteporfin, PPIX and MB show weaker signal than PBS due to their low quantum yield. The data corresponding to the later molecules is therefore not shown in Figs 4 and 5.
DISCUSSION
Solvent effect
It has been shown in Fig. 2 that when exposed to high energy X-rays, PBS, DMSO and Methanol’s light emission varied depending on the solvent. This is due to fluorescence solvent quenching, a complex phenomenon with many causes, of which the major ones are solvent polarity and viscosity [21]. When combined with an inadequate solvent, fluorophores can aggregate leading to quenching of their fluorescence through a phenomenon called aggregation-caused quenching [22]. This quenching effect is particularly true for DMSO and Methanol, which is not surprising given that most of these molecules have been designed to be soluble in an aqueous biological environment.
Concentration dependence
In order to be relevant for human use, contrast agents must show strong signal at tolerable concentrations as governed by FDA guidelines [23]. In the case of X-ray or Cherenkov excited fluorescence, a probe must have an emission signal greater than the Cherenkov baseline signal. Fluorescence of all probes at low concentrations (10 nM – 1 μM) went undetected for both spectrally integrated and resolved experiments. In the broadband detection scheme (Fig. 3), the intensities are similar to the Cherenkov emission intensity of pure PBS, exhibiting a ratio of 1.83 ± 0.06 between 18 MV and 6 MV energies. As the concentration increases, fluorescein, proflavine and AlPcS4 show increasing fluorescence until a certain point where the signal saturates (data cropped on Fig. 3). This is attributed to fluorescence self-quenching [24] of the molecules within the solution. As for the case of proflavine, fluorescein and AlPcS4, the concentrations exhibiting the brightest luminescence are 50 μM, 500 μM and 10 μM, respectively. In spectrally-resolved data (Fig. 4), we further show that the emission exceeds Cherenkov intensity level also in AlPcS4 around its emission peak.
Cherenkov vs scintillation
The mechanisms behind organic molecules excitation during irradiation are not always clear because of the series of radiative and non-radiative events that occur. The two major pathways these molecules could be excited by are considered here, with the first being Cherenkov light generated throughout the medium upon x-ray irradiation. This broadband light emitted due to secondary electrons during irradiation can in principle excite any of the used probes, although the efficiency of Cherenkov production is fairly low. Importantly, Cherenkov intensity depends on both the X-ray energy spectrum, as well as the total dose deposited [25]. The second way radioluminescence can be excited is through scintillation mechanisms, that are largely mediated by excitation of the solvent, followed by non-radiative energy transfer to the emitter molecule [7]. In contrast with Cherenkov, scintillation is known to be energy independent throughout this high energy MV X-ray range [5]. Thus, by irradiating each sample with different energies (6 MV vs 18 MV) while keeping the deposited dose constant, we expect to be able to quantify the contribution from both phenomena.
For the three probes shown in Fig. 4, the light intensity is higher than the Cherenkov intensity around their emission peak. At the same time, it can be seen that the Cherenkov signal is absorbed by probes in their absorption spectral band. Those probes that have the highest luminescence essentially are redistributing the UV and blue Cherenkov photons from higher energies to lower energy photons via fluorescence. Note that the concentration of each probe was chosen to be optimal for emission intensity within PBS. Interestingly, as seen in Fig. 5, the AlPcS4 probe exhibited a mixed scintillation (63%) and Cherenkov-excited fluorescence (37%) behavior.
The difference in PBS Cherenkov emission ratio as seen in Figs 3 and 4 (1.83 ± 0.06 versus 1.57 ± 0.07, respectively) is most probably due to the acquisition setup. Data in Fig. 3 was acquired with a large numerical aperture lens while the spectrally resolved data were acquired using a fiber optics coupling. Given that Cherenkov emission is more forward directed as the exciting particles’ energy increases [26], it is possible that less light was captured with the fiber optics for 18 MV than for 6 MV due to its small numerical aperture. Nonetheless, these ratiometric values of fluorophores’ emission relative to PBS emission can be used in a fixed setup geometry as a measure of the scintillation versus Cherenkov excitation of the probes since the same changes apply to all studied samples.
CONCLUSION
The aim of this work was to identify the excitation mechanisms of various X-ray excitable fluorescent molecules. The choice of these tracers was specifically made based on their approval for human use as fluorescent agents. These findings may be utilized in future studies of in vivo X-ray excited luminescence [27] or in dosimetry applications [28]. The choice of these tracers was specifically made based on their approval for human use as fluorescent agents. The excitation of fluorescent organic molecules is mainly Cherenkov mediated, even though some of them, particularly aluminium phthalocyanine, seem to luminesce through scintillation mechanisms also. Fluorescein and proflavine show strong signals to Cherenkov ratios even at low concentrations, although the emission is still largely in the blue–green part of the spectrum. However, AlPcS4 shows a more interesting signal in the red spectrum, consistent with the diffuse light transport window of tissue [29,30]. Thus, radioluminescence reporting from fluorescein and proflavine are ideal when blue–green emission is desired and high quantum yield phthalocyanines are likely optimal when red to near-infrared emission is desired. Further exploration of the potential for direct scintillation in tissue from molecular probes that have similar interactions with their environment as AlPcS4 may be of further benefit.
Contributor Information
Arthur F Pétusseau, Thayer School of Engineering, Dartmouth College, Hanover, NH 03755, USA.
Petr Bruza, Thayer School of Engineering, Dartmouth College, Hanover, NH 03755, USA.
Brian W Pogue, Thayer School of Engineering, Dartmouth College, Hanover, NH 03755, USA.
FUNDING
This work was supported by the National Institutes of Health through grant R01 EB024498.
Pétusseau, A. F., Bruza, P., Pogue, W. B. Survey of X-ray induced Cherenkov excited fluorophores with potential for human use.
References
- 1.Cao X, Rao Allu S, Jiang S et al. Tissue pO 2 distributions in xenograft tumors dynamically imaged by Cherenkov-excited phosphorescence during fractionated radiation therapy. Nat Commun 2020;11:1–9. [DOI] [PMC free article] [PubMed] [Google Scholar]
- 2.Hu Z, Qu Y, Wang K et al. In vivo nanoparticle-mediated radiopharmaceutical-excited fluorescence molecular imaging. Nat Commun 2015;6:1–12. [DOI] [PMC free article] [PubMed] [Google Scholar]
- 3.Li C, Mitchell GS, Cherry SR. Cherenkov luminescence tomography for small-animal imaging. Opt Lett 2010;35:1109–11. [DOI] [PMC free article] [PubMed] [Google Scholar]
- 4.Klein JS, Sun C, Pratx G. Radioluminescence in biomedicine: physics, applications, and models. Phys Med Biol 2019;64:04TR01:1–47. [DOI] [PMC free article] [PubMed] [Google Scholar]
- 5.Beddar AS. Plastic scintillation dosimetry and its application to radiotherapy. Radiat Meas 2006;41:S124–33. [Google Scholar]
- 6.Glide-Hurst C, Bellon M, Foster R et al. Commissioning of the Varian TrueBeam linear accelerator: a multi-institutional study: multi-institutional commissioning of five TrueBeam linear accelerators. Med Phys 2013;40:031719:1–15. [DOI] [PubMed] [Google Scholar]
- 7.Peng CT, Horrocks DL, Alpen EL. Liquid scintillation counting, recent applications and development. Vol I Physical Aspects. Cambridge: Academic Press. 2013;17–225. [Google Scholar]
- 8.Kellogg RE, Bennett RG. Radiationless intermolecular energy transfer. III. Determination of phosphorescence efficiencies. J Chem Phys 1964;41:3042–5. [Google Scholar]
- 9.Kubota Y, Steiner RF. Fluorescence decay and quantum yield characteristics of acridine orange and proflavine bound to DNA. Biophys Chem 1977;6:279–89. [DOI] [PubMed] [Google Scholar]
- 10.Dhami S, Cosa JJ, Bishop SM et al. Photophysical Characterization of Sulfonated Aluminum Phthalocyanines in a Cationic Reversed Micellar System. Langmuir 1996;12:293–300. [Google Scholar]
- 11.Gotardo F, Cocca LHZ, Acunha TV et al. Investigating the intersystem crossing rate and triplet quantum yield of Protoporphyrin IX by means of pulse train fluorescence technique. Chem Phys Lett 2017;674:48–57. [Google Scholar]
- 12.Aveline B, Hasan T, Redmond RW. Photophysical and Photosensitizing Properties of Benzoporphyrin Derivative Monoacid Ring a (bpd-Ma). Photochem Photobiol 1994;59:328–35. [DOI] [PubMed] [Google Scholar]
- 13.Matsui A, Tanaka E, Choi HS et al. Real-Time Near-Infrared Fluorescence-Guided Identification of the Ureters using Methylene Blue. Surgery 2010;148:78–86. [DOI] [PMC free article] [PubMed] [Google Scholar]
- 14.Sjöback R, Nygren J, Kubista M. Absorption and fluorescence properties of fluorescein. Spectrochim Acta A Mol Biomol Spectrosc 1995;51:L7–21. [Google Scholar]
- 15.Russell J, Diamond K, Collins T et al. Characterization of Fluorescence Lifetime of Photofrin and Delta-Aminolevulinic Acid Induced Protoporphyrin IX in Living Cells Using Single- and Two-Photon Excitation. Sel Top Quantum Electron IEEE J Of 2008;14:158–66. [Google Scholar]
- 16. Ramstein J, Leng M. Interaction between proflavine and chemically methylated deoxyribonucleic acid. Biochimica et Biophysica Acta (BBA)-Nucleic Acids and Protein Synthesis. 1972;281:18–32. [DOI] [PubMed] [Google Scholar]
- 17. Diamond KR, Malysz PP, Hayward JE et al. Quantification of fluorophore concentration in vivo using two simple fluorescence-based measurement techniques. Journal of biomedical optics. 2005;10:024007:1–10. [DOI] [PubMed] [Google Scholar]
- 18.Calori IR, Caetano W, Tedesco AC et al. Self-aggregation of verteporfin in glioblastoma multiforme cells: a static and time-resolved fluorescence study. Dyes Pigments 2020;182:08598:1–8. [Google Scholar]
- 19.Dunn DA, Lin VH, Kochevar IE. The role of ground state complexation in the electron transfer quenching of methylene blue fluorescence by purine nucleotides. Photochem Photobiol 1991;53:47–56. [DOI] [PubMed] [Google Scholar]
- 20.Glaser AK, Zhang R, Gladstone DJ et al. Optical dosimetry of radiotherapy beams using Cherenkov radiation: the relationship between light emission and dose. Phys Med Biol 2014;59:3789–811. [DOI] [PubMed] [Google Scholar]
- 21.Lakowicz JR (ed). Solvent and environmental effects. In: Lakowicz JR (ed). Principles of Fluorescence Spectroscopy. Boston, MA: Springer US, 2006, 205–35. [Google Scholar]
- 22.Qi J, Hu X, Dong X et al. Towards more accurate bioimaging of drug nanocarriers: turning aggregation-caused quenching into a useful tool. Adv Drug Deliv Rev 2019;143:206–25. [DOI] [PubMed] [Google Scholar]
- 23.Center for Drug Evaluation and Research (U.S.), Center for Biologics Evaluation and Research (U.S.) . Guidance for Industry: S6 Preclinical Safety Evaluation of Biotechnology-Derived Pharmaceuticals. Rockville, MD: U.S: Department of Health and Human Services, Food and Drug Administration, Center for Drug Evaluation and Research, Center for Biologics Evaluation and Research, 1997. [Google Scholar]
- 24.Zhegalova NG, He S, Zhou H et al. Minimization of self-quenching fluorescence on dyes conjugated to biomolecules with multiple labeling sites via asymmetrically charged NIR fluorophores. Contrast Media Mol Imaging 2014;9:355–62. [DOI] [PMC free article] [PubMed] [Google Scholar]
- 25.Glaser AK, Davis SC, Voigt WHA et al. Projection imaging of photon beams using Čerenkov-excited fluorescence. Phys Med Biol 2013;58:601–19. [DOI] [PMC free article] [PubMed] [Google Scholar]
- 26.Jelley JV. Cherenkov radiation and its applications. Br J Appl Phys 1955;6:227–32. [Google Scholar]
- 27.Pratx G, Carpenter CM, Sun C et al. Tomographic molecular imaging of x-ray-excitable nanoparticles. Optics letters. 2010;35:3345–7. [DOI] [PubMed] [Google Scholar]
- 28.Beaulieu L, Beddar S. Review of plastic and liquid scintillation dosimetry for photon, electron, and proton therapy. Phys Med Biol 2016;61:R305–43. [DOI] [PubMed] [Google Scholar]
- 29.Lin H, Zhang R, Gunn JR et al. Comparison of Cherenkov excited fluorescence and phosphorescence molecular sensing from tissue with external beam irradiation. Phys Med Biol 2016;61:3955–68. [DOI] [PubMed] [Google Scholar]
- 30.Dsouza A, Lin H, Gunn JR et al. Cherenkov-excited multi-fluorophore sensing in tissue-simulating phantoms and in vivo from external beam radiotherapy. Radiat Res 2018;189:197–204. [DOI] [PMC free article] [PubMed] [Google Scholar]


