Abstract
The opening of stomata in plants in response to blue light is driven by the plasma membrane H+-ATPase in guard cells. To evaluate the activation of the H+-ATPase in vivo, we can use H+-pumping by guard cells in response to blue light and fusicoccin. To do this, it is required to prepare a large amount of guard cell protoplasts and measure H+-pumping in the protoplasts. It is also necessary to determine the protein amount of H+-ATPase. In this protocol, we describe the procedures required for these preparations and measurements.
Keywords: Arabidopsis thaliana, Blue light, Fusicoccin, H+-pumping , Plasma membrane H+-ATPase
Background
The opening of stomata in response to blue light is driven by membrane hyperpolarization mediated through H+-pumping across the plasma membrane in guard cells ( Assmann et al., 1985 ; Shimazaki et al., 1986 ), and is brought about by the plasma membrane H+-ATPase (Kinoshita and Shimazaki, 1999). The H+-ATPase generates an electrochemical gradient across the membrane, and provides the energy required for numerous secondary transports in plant cells. However, it is not easy to measure the activity of H+-ATPase in vivo. Taking advantage of the blue light-sensitive properties of guard cells, our method makes it possible to measure H+-pumping as an in vivo H+-ATPase activity using Arabidopsis guard cell protoplasts ( Ueno et al., 2005 ). Together with H+-ATPase quantification by Western blot ( Yamauchi et al., 2016 ), this method allows comparing H+-ATPase activity under different conditions or mutant backgrounds.
Materials and Reagents
Planter (640 x 230 x 185 mm) (Iris Oyama E-type, PR650EMK)
Vermiculite (particle size 3-6 mm)
Soil (potting soil containing peat moss)
Cellophanes (Asahi KASEI)
Nylon mesh (10 µm, 25 µm, 58 µm and 94 µm) (Kyoshin Riko)
Micro slide glass (Matsunami Glass, catalog number: S011260)
Glass test tube (10 ml) (IWAKI, catalog number: TEST15-105NP)
Gel loading tip (Thermo Fisher Scientific, Thermo Scientific, catalog number: 010-Q)
Sample tube (1.5 ml) (INA•OPTIKA, catalog number: ST-0105F)
-
Micro cuvette (100 µl) (Beckman Coulter, catalog number: 523270)
Note: This product has been discontinued. Any micro cuvette (100 µl) that can be fixed in the spectrophotometer can be substituted.
Blender cup (100 ml) (Waring Lab, catalog number: MC2)
Glass pipette (10 ml) (Sansyo, catalog number: 73-0045)
Glass centrifuge tube (50 ml) (Sansyo, catalog number: 84-0182)
Orange-colored film (Kodak, Cinemoid 5A)
Filter paper (3MM CHR CHROMATOGRAPHY PAPER, GE Healthcare, catalog number: 3030-928)
Arabidopsis thaliana ecotype Col-0
Arabidopsis thaliana mutant aha1-10
Bradford protein assay dye reagent concentrate (Bio-Rad Laboratories, catalog number: 5000006JA)
Aprotinin (Merck, Calbiochem, catalog number: 616399)
Protease inhibitor cocktail set III (Merck, Calbiochem, catalog number: 539134)
MG132 (Sigma-Aldrich, catalog number: M8699-1MG)
Trichloroacetic acid (TCA) (NACALAI TESQUE, catalog number: 06275-24)
Anti-rabbit IgG HRP (Bio-Rad Laboratories, catalog number: 1706515)
Anti H+-ATPase antibodies (Kinoshita and Shimazaki, 1999) or Agrisera anti H+-ATPase antibodies (Agrisera, catalog number: AS07 260)
Clarity Western ECL substrate (Bio-Rad Laboratories, catalog number: 1705061)
Cellulase R-10 (Yakult, Pharmaceutical Industry, Tokyo, Japan)
Macerozyme R-10 (Yakult, Pharmaceutical Industry, Tokyo, Japan)
Polyvinylpyrrolidone K 30 (PVP-K30) (NACALAI TESQUE, catalog number: 28314-95)
Bovine serum albumin (BSA) (Thermo Fisher Scientific, GibcoTM, catalog number: 30036727)
Mannitol (Wako Pure Chemical Industries, catalog number: 130-00855)
Calcium chloride dihydrate (CaCl2·2H2O) (Wako Pure Chemical Industries, catalog number: 031-00435)
2-(N-morpholino) ethanesulfonic acid (MES) (NACALAI TESQUE, catalog number: 02442-44)
Cellulase RS (Yakult, Pharmaceutical Industry, Tokyo, Japan)
Hydrochloric acid (HCl) (Wako Pure Chemical Industries, catalog number: 081-03475)
Potassium chloride (KCl) (NACALAI TESQUE, catalog number: 28513-85)
Fusicoccin (Fc) (Sigma-Aldrich, catalog number: F0537-1MG)
DMSO (Wako Pure Chemical Industries, catalog number: 046-21981)
Tris (hydroxymethyl) aminomethane (Wako Pure Chemical Industries, catalog number: 514-98121)
Sodium chloride (NaCl) (Wako Pure Chemical Industries, catalog number: 191-01665)
Sodium dodecyl sulfate (SDS) (NACALAI TESQUE, catalog number: 31606-75)
Ammonium peroxodisulfate (Wako Pure Chemical Industries, catalog number: 012-20503)
30% (w/v) Acrylamide/Bis mixed solution (37.5:1) (Wako Pure Chemical Industries, catalog number: 018-25625)
N,N,N’,N’-tetramethylethylenediamine (NACALAI TESQUE, catalog number: 33401-72)
Dithiothreitol (DTT) (NACALAI TESQUE, catalog number: 14112-94)
Nα-Tosyl-Lys chloromethyl ketone (Merck, Calbiochem, catalog number: 616382)
Ponceau S (NACALAI TESQUE, Catalog number: 28322-72)
Acetic acid (Wako Pure Chemical Industries, catalog number: 017-00251)
Tween 20 (MP Biomedicals, catalog number: 0210316890)
Skim milk (Snow Brand Milk Products, Ltd.)
Glycine (Wako Pure Chemical Industries, catalog number: 077-00735)
Methanol (Wako Pure Chemical Industries, catalog number: 137-01823)
Ethylenediaminetetraacetate acid (EDTA) (Wako Pure Chemical Industries, catalog number: 343-01861)
Sucrose (Wako Pure Chemical Industries, catalog number: 196-00015)
Coomassie Brilliant Blue G-250 (NACALAI TESQUE, catalog number: 09409-42)
2-Mercaptoethanol (NACALAI TESQUE, catalog number: 21417-52)
1st digestion solution (see Recipes)
2nd digestion solution (see Recipes)
2x H+-pumping buffer (see Recipes)
Reaction mixture for H+ pumping (see Recipes)
Fc stock solution (see Recipes)
Reaction mixture for inhibitor treatment (see Recipes)
HCl stock solution (see Recipes)
10x TBS (see Recipes)
4x separation buffer (see Recipes)
4x stacking buffer (see Recipes)
Ammonium peroxodisulfate stock solution (see Recipes)
10% acrylamide gel (see Recipes)
DTT stock solution (see Recipes)
TLCK stock solution (see Recipes)
Ponceau S (see Recipes)
Tween 20 stock solution (see Recipes)
Blocking buffer (see Recipes)
T-TBS (see Recipes)
Transfer buffer (see Recipes)
3x SDS buffer (see Recipes)
1x SDS sample buffer (see Recipes)
Equipment
Metal shelf made by stainless steel (120 x 61 x 230cm) (Iris Oyama, MR-230P)
Blender (Waring Lab, model: 51BL31, catalog number: 7011BU)*
Funnel (TGK, catalog number: 416-09-24-04)*
Erlenmeyer flask (500 ml) (IWAKI, catalog number: 82-0088)
Erlenmeyer flask (300 ml) (IWAKI, catalog number: 82-0087)
Refrigerated centrifuge (TOMY, model: AX-310)*
Refrigerated centrifuge (TOMY, model: MX-100)*
Incubator with shaker (TAITEC, model: Personal Lt10)
Unit thermostat bath (TAITEC, THERMO MINDER model: JR 80)*
Spectrophotometer (Beckman Coulter, model: DU800)*
pH glass electrode (Beckman Coulter, catalog number: 39532)*
pH meter (Beckman Coulter, model: Φ71 pH meter)*
Chart recorder (YOKOGAWA ELECTRIC WORKS, model: 3066)*
Magnetic stirrer (RANK BROTHERS, model: Model 300)
Chiller bath circulator (Thermo Fisher Scientific, Thermo ScientificTM, model: RTE7)
-
LED panel (CCS, model: ISL 150X150 H4RRHB, Made by order)
Note: LEDs for both red and blue are fixed on the same panel, and each LED can be turned on and off by the power supply.
LED power supply (CCS, model: ISC-201-2)
Microscope (Nikon Instruments, model: Eclipse TS100)
Pipetman (P200)
Power supply (Bio-Rad Laboratories, model: PowerPacTM HC High-Current Power Supply)
Transfer Cell (Bio-Rad Laboratories, model: Trans-Blot® SD Semi-Dry Transfer Cell)
Electrophoresis vessel (ATTO, model: AE6200, catalog number: 2392385)*
Chemical Luminescence analyzer (Bio-Rad Laboratories, model: ChemiDocTM Touch Imaging System)
Gel cassette (ATTO, model: AE-6210)
*Note: This product has been discontinued.
Software
ImageJ
Procedure
-
Preparation of guard cell protoplasts from Arabidopsis leaves
Sow 200 Arabidopsis seeds per planter on soil and vermiculite mixture (1:1).
Grow Arabidopsis plants for 4- to 6-weeks under white light (60 µmol m-2 sec-1) with14/10 h light/dark cycle at 24 °C (see Figure 1).
Harvest the fully expanded rosette leaves from the 200 plants and remove the main petioles (~2 cm-length, see Figure 2) before bolting.
Place the leaves (25 g) in ice-cold water (see Figure 3).
Move the ice-cold leaves into the cup of Waring blender (see Figure 4A). Homogenize the leaves in the blender covered with two layers of cellophane (see Figure 4B) at full speed for 45 sec in 70 ml ice-cold distilled water. Pour the resulting homogenate onto the nylon mesh placed on a funnel (see Figure 5). Discard the filtrate (flow-through) throughout the protocol.
Transfer the epidermal tissues retained on the 58 µm mesh (see Figure 5) into the cup of Waring blender by pouring ice-cold distilled water (see Video 1) and subject them to homogenization again for 1 min in 70 ml water at full speed, and collect them by filtering through the 58 µm nylon mesh as above. The nylon mesh can be reused after cleaning with distilled water.
Transfer 12-13 g of the wet epidermal fragments on the mesh (see Figure 7) into a 500 ml Erlenmeyer flask by pouring the 1st digestion solution (see Recipes) using a wash bottle or a 10 ml Komagome pipette (see Figure 6 and Video 1). Adjust the total volume of the digestion solution to 100 ml by adding the same solution.
Pass the epidermal fragments gently into 100 ml of 1st digestion solution in the Erlenmeyer flask through the same Komagome pipette several times up and down to thoroughly mix the suspension and to ensure homogeneous digestion (see Video 2).
Incubate the suspension in the Erlenmeyer flask at 24 °C for 30 min, shaking at 70 strokes min-1.
Pippet the partially digested epidermal fragments in the 1st digestion solution 30 times up and down through Komagome pipette to remove the attached mesophyll cells (see Video 2). Inspect the mesophyll cells attached to the epidermal fragments on a micro slide glass using a microscope (150x).
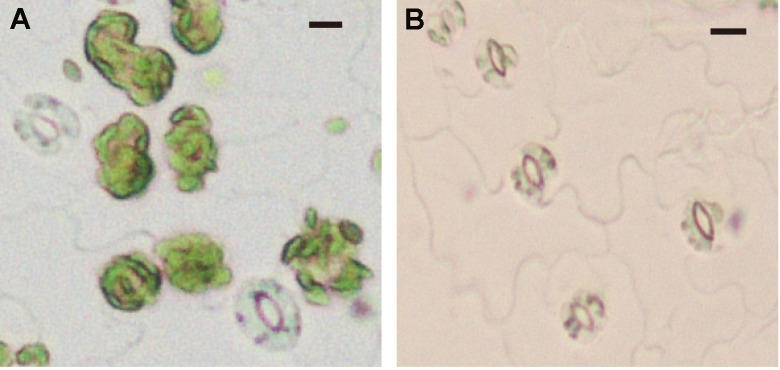
Repeat Step A9 until all mesophyll cells attached to the epidermis are removed (see Figure 7).
Pass the suspension through a 58 µm nylon mesh, and keep the epidermal fragments retained on the mesh.
Transfer the epidermal fragments into 0.3 M mannitol and 1 mM CaCl2 solution by pouring the solution onto the fragments on the mesh (see Video 1). Keep the fragments in the solution for 30 min to adapt them to the high osmotic pressure.
-
Pass the osmotically adapted epidermis through the 58 µm nylon mesh. Transfer the epidermis retained on the mesh into a 300 ml Erlenmeyer flask by pouring the 2nd digestion solution (see Recipes) on the epidermis using Komagome pipette (see Video 1). Adjust the total volume to 50 ml by adding the same 2nd digestion solution.
Note: Since the epidermal peels were partially digested and fragile, do not touch the epidermis in this step.
Incubate the epidermis in the 2nd digestion solution with 50 strokes min-1 for 50-60 min at 27 °C.
Using several epidermal fragments, inspect whether most of the guard cells have become spherical under a microscope (see Figure 8).
Place the Erlenmeyer flask containing the digested epidermis on ice, and pippet the suspension gently up and down 60 times through a Komagome pipette to detach guard cell protoplasts from the epidermis (see Video 2).
Pass the suspension through two layers of piled nylon meshes of 94 and 25 µm (the 94 µm mesh is on top of the 25 µm one) to separate guard cell protoplasts from the epidermal remnants.
Pass the separated guard cell protoplasts through two layers of 10 µm nylon mesh to remove contamination by other small tissues.
Centrifuge the suspension of guard cell protoplasts at 420 × g for 18 min at 4 °C to collect guard cell protoplasts as a pellet. Discard the supernatant.
Resuspend the pellet in a 50 ml solution of 0.4 M mannitol and 1 mM CaCl2.
Repeat Steps A19 and A20 twice (total three times) to remove the residual enzymes.
-
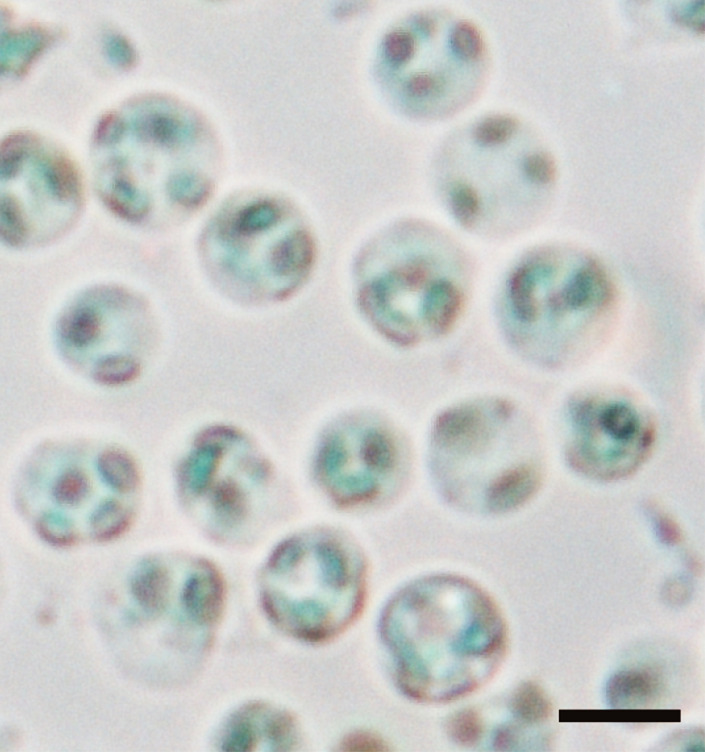
Resuspend the pellet of guard cell protoplasts (see Figure 9) in 200 to 500 µl of 0.4 M mannitol and 1 mM CaCl2 in 10 ml test tube and keep them on ice.
Note: It takes 6-8 h to prepare guard cell protoplasts from 25 g leaves. The protoplasts can be stored in the refrigerator overnight under darkness until measurement. Keep the protoplasts in the dark for at least 1 h on ice for immediate measurement. The time required for one measurement is 2-3 h because it takes 1-2 h until the pH of the protoplast suspension shows a constant value under red light (RL). The measurement time for Arabidopsis is longer than for Vicia faba (Shimazaki et al., 1986).
Determine protein concentration by Bradford method (Bradford, 1976) using 10 µl of the protoplast suspension.
-
Measurement of blue light- and fusicoccin-dependent H+-pumping
-
Blue light-dependent H+-pumping
Keep guard cell protoplasts in the dark at 4 °C for 2 h or overnight.
-
Circulate water at 24 °C in a Plexiglas water jacket to maintain the temperature. Mix X ml of guard cell protoplasts suspension (50 μg proteins) with 0.5-X ml of 0.4 M mannitol and 1 mM CaCl2 in an open glass vessel (see Figure 10A) enclosed in the water jacket. Add 0.5 ml of 2x H+-pumping buffer (see Recipes) to the suspension to give a final volume of 1 ml reaction mixture in the vessel. Stir the protoplasts in the reaction mixture by a small magnetic stirrer inside the vessel.
Note: Add the protoplasts in the absence of blue light. Remove blue portion of light by covering the fluorescent lamp with orange-colored film, which prevents blue light penetration.
Place a pH glass electrode in the reaction mixture, and record the signal from the electrode on a recorder via a pH meter (see Figure 10B).
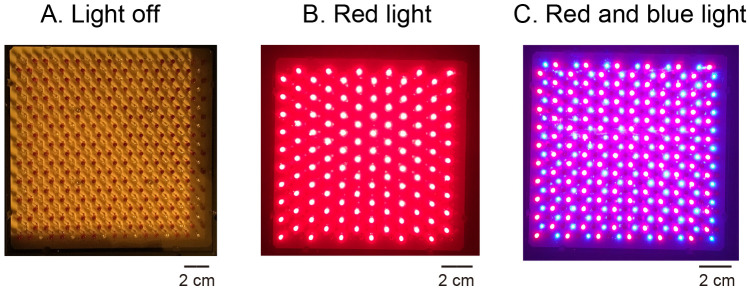
Use the LED illuminator (see Figure 11) to apply red light (600 µmol m-2 sec-1) to protoplasts for 2 h by turning on the switch for the red photodiode until the pH shows an almost constant value (see Figure 13). The distance from the illuminator to the sample is about 10 cm. Regulate light intensity at the sample by the voltage controller.
Use the LED illuminator (see Figure 11) to apply blue light pulse (100 µmol m-2 sec-1) to protoplasts for 30 sec by turning on the switch for the blue photodiode superimposed on red light. Incubate the protoplasts for about 20 min under red light to follow the pH change in the mixture (Figure 13).
Add 3 or 5 µl of 1 mM HCl to the mixture to calculate the magnitude of H+-pumping in response to the blue light.
-
Fusicoccin (Fc)-dependent H+-pumping
Steps from B1a-B1f follow the same procedure as above. Use the same samples used above.
Add 2.5 µl of 4 mM Fc in DMSO to the suspension (at 10 µM) through a gel loading tip instead of the usual tip and induce H+-pumping. Calculate the rate after the pumping becomes constant (5 min after the addition of Fc).
-
-
Determination of total H+-ATPase amount
Suspend 10 µg proteins of guard cell protoplasts in the reaction mixture (150 µl, see Recipes) in a 1.5 ml sampling tube. The concentration of guard cell proteins had been determined as per the measurement Steps A22-A23.
Mix the protoplasts suspension gently by pipetting up and down.
-
Add the inhibitors of protease or proteasome to the suspension and mix gently by pipetting up and down every 15 min.
Inhibitors as indicated below were separately administered to the protoplasts:
10 µM aprotinin (inhibitor for serine protease) and 2 mM DTT.
1 mM Nα-Tosyl-Lys Chloromethyl Ketone (TLCK; inhibitor for serine protease).
1% (v/v) protease inhibitor cocktail set III (contains various protease inhibitors).
50 µM MG132 (inhibitor of proteasome).
Incubate the protoplast suspension containing the inhibitors or without inhibitor as controls for 30 min at 24 °C with pipetting up and down every 15 min.
Add 10% trichloroacetic acid (TCA) to the suspension to cease the reaction and pipette the suspension up and down gently through PIPETMAN (P200) 10 times to denature the proteins.
Place the suspension on ice for 10 min to avoid excessive denaturalization.
Centrifuge the suspension at 17,800 × g for 10 min at 4 °C to collect the proteins.
Remove the supernatant and suspend the pellet with 200 µl of 50 mM Tris-HCl (pH 8.0). Repeat Steps C7-C8 twice to remove TCA.
Add 30 µl 1x SDS sample buffer (see Recipes) to the pellet and solubilize it.
-
Load 5 µg of the solubilized protein of guard cell protoplasts on SDS-PAGE.
Separate the proteins by SDS-PAGE using a 10% acrylamide gel (see Recipes).
-
Transfer the proteins onto a nitrocellulose membrane.
Immerse the nitrocellulose membrane, the acrylamide gel that contains separated proteins, and 6 filter papers of the same size as that of the gel in 200 ml transfer buffer for 15 min.
Stack them by placing 3 layers of filter papers on the bottom, the nitrocellulose membrane, the gel, and 3 layers of filter papers on the top in the Transfer Cell.
Transfer the proteins from the gel onto the nitrocellulose membrane electrically using the Trans blot transfer cell.
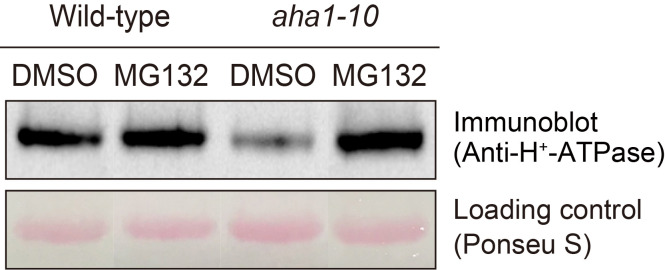
Stain the membrane by 0.5 % Ponceau S in 1 % acetic acid for 5 sEC (see Recipes) and use as the loading control of proteins by taking a picture (see Figure 12, lower panel).
Wash the membrane by distilled water and incubate it in the blocking buffer (see Recipes) for 30 min.
Incubate the membrane in the presence of anti-H+-ATPase antibodies (dilute 3,000x by blocking buffer) overnight at 4 °C without shaking.
-
Wash the membrane in T-TBS (see Recipes) for 10 min by incubation.
Note: Repeat this process three times.
Incubate the membranes in the presence of anti-rabbit IgG HRP (Bio-Rad; dilute 3,000x by blocking buffer) for 2 h at room temperature.
Wash the membrane by T-TBS for 10 min three times.
Incubate the membranes with Clarity Western ECL substrate (Bio-Rad) for 3min.
Detect the H+-ATPase by Chemical Luminescence analyzer (Bio-Rad)
-
Determine the band density on the membrane by ImageJ, and calculate the amount of the H+-ATPase.
Data analysis
Calculation of the magnitude and the maximum rate of H+-pumping (see Figure 13).
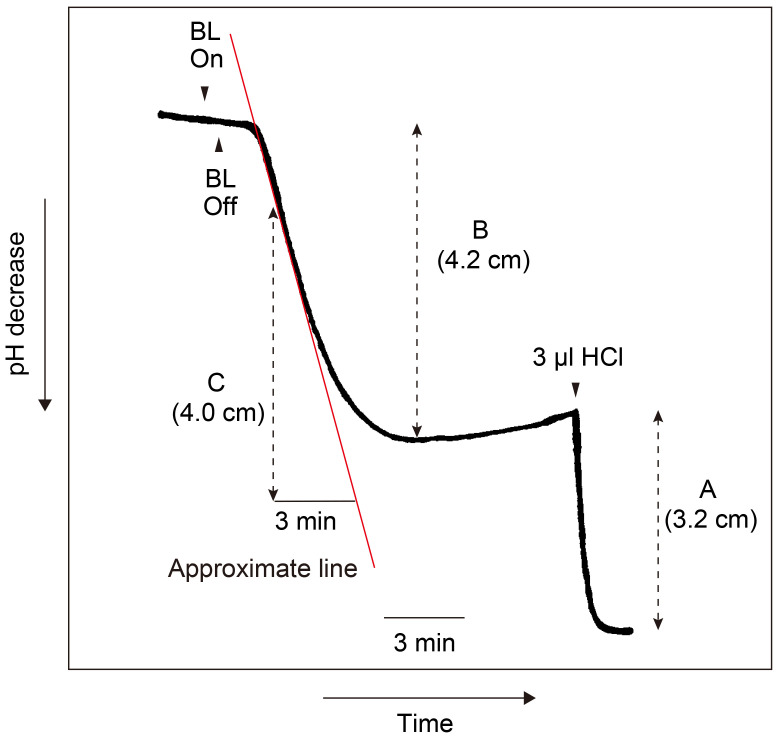
See Figure 13 that indicates H+-pumping (shown by decrease in pH over time) by guard cell protoplasts in response to a pulse of blue light (BL) under red light (RL).
Determine the amounts of acid equivalents by pH decrease caused by the addition of 3 nmol H+ (3 µl of 1 mM HCl) to the suspension at the end of each experiment (see A). 3 nmol H+ corresponds to 3.2 cm on the chart recorder. Thus, 1 nmol H+ corresponds to 1.07 cm pH decrease on the chart.
Calculate the magnitude of H+-pumping in response to the pulse. The pH decrease is 4.20 cm per pulse (see B). The magnitude is calculated to be 4.20/1.07 = 3.93 nmol H+ per pulse. Since the mixture contains 50 µg protein, the magnitude of H+-pumping was calculated to be 0.079 nmol H+ per pulse µg protein-1.
Draw an approximate line at the steepest slope of H+-pumping, which occurs around 2.5 min after the pulse, to calculate the maximum rate of H+-pumping (see red line).
Determine the pH decrease on a chart on the basis of this line. It exhibited 4.0 cm of pH decrease on the chart in 3 min (see C).
Calculate the maximum rate of H+ pumping on the basis guard cell proteins used. Since the pH decrease per pulse is 1.33 cm min-1 (4.0/3) and 1 nmol H+ corresponds to 1.07 cm of pH decrease, the maximum rate is calculated to be 1.33 cm/1.07 cm x 60 nmol h-1/50 µg protein is 1.49 nmol H+ h-1 µg protein-1.
Figure 1. Four weeks old Arabidopsis grown under white light.
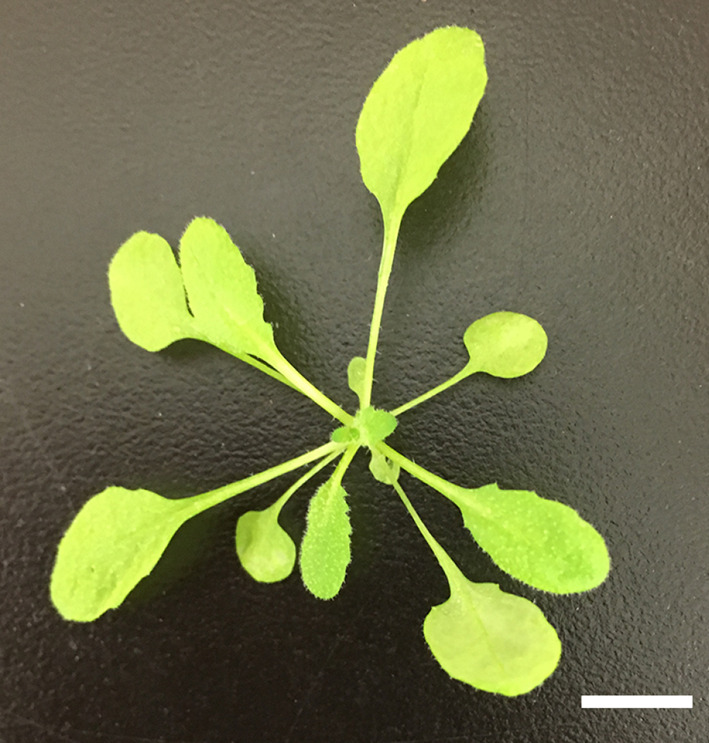
Arabidopsis plants were grown for 4-weeks under white light (60 µmol m-2 sec-1) with 14/10 h light/dark cycle at 24 °C. The bar represents 1 cm.
Figure 2. Fully expanded leaves from 4 weeks old Arabidopsis.
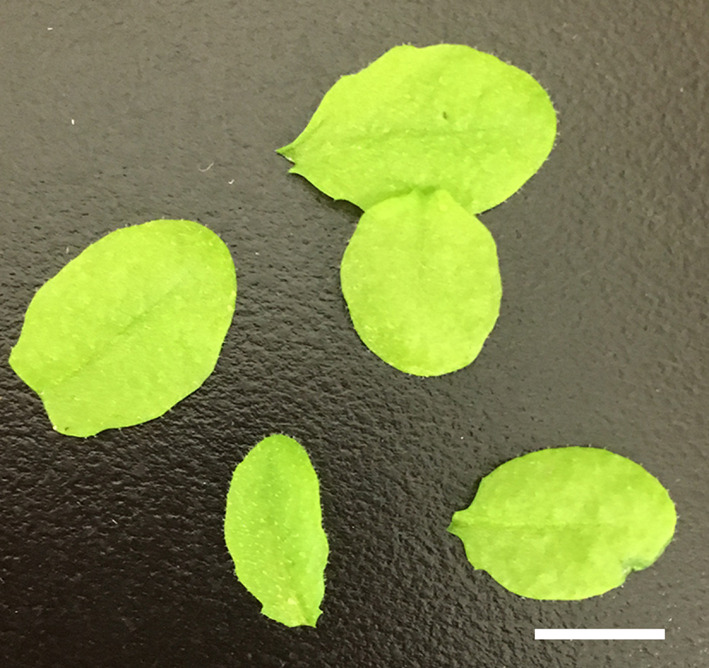
Fully expanded leaves were harvested from Arabidopsis and main petioles were removed before bolting. The bar represents 1 cm.
Figure 3. Leaves in ice-cold water.
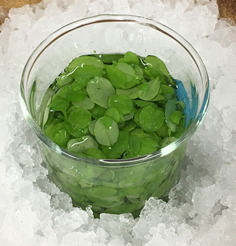
Harvested leaves were put into a glass beaker filled with ice-cold water.
Figure 4. Waring blender with blender cup.
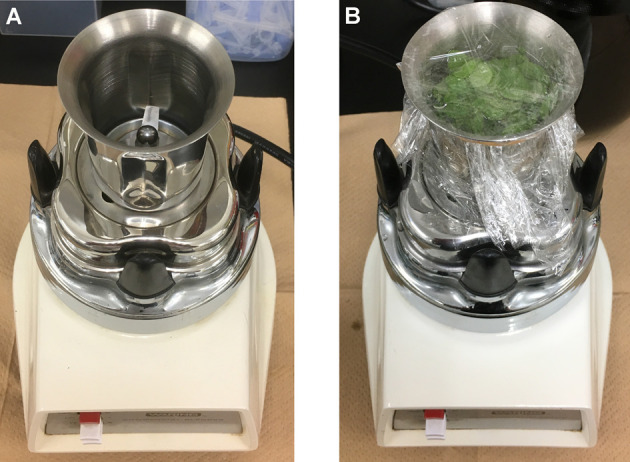
A. Picture of Waring blender with blender cup; B. Fully expanded rosette leaves were put into blender cup filled with ice-cold water. Blender cup was sealed with cellophane. Leaves were homogenized at maximum speed for 45 sec.
Figure 5. Epidermal tissues collected with layers of 58 µm nylon mesh.
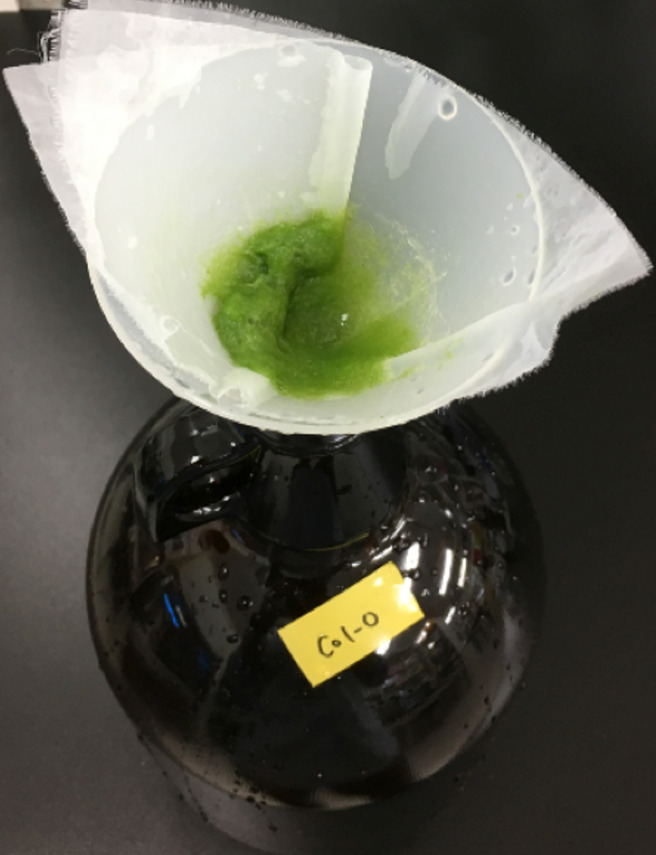
Homogenized epidermal tissues were collected with layers of 58 µm nylon mesh after 45 sec homogenization. Collected tissues were placed into the blender cup again and homogenized for 1 min (see Video 1). The epidermal tissues were collected again with the 58 µm nylon mesh and resuspended in the 1st digestion solution.
Video 1. Transfer the epidermal fragments by pouring the solution onto the fragments on the mesh using a wash bottle.
(or 10 ml Komagome pipette, not shown here)
Figure 7. Mesophyll cell removal by 1st digestion solution.
A. Epidermal fragment before 1st digestion solution treatment. Mesophyll cells adhered to epidermal tissue. B. Epidermal fragment after 1st digestion solution treatment. All mesophyll cells are detached from the epidermal cells. The bars represent 10 µm.
Figure 6. Komagome pipette (10 ml) with silicone rubber bulb.
Video 2. Pipetting the partially digested epidermal fragments to remove the mesophyll cells using Komagome pipette.
Figure 8. Guard cell spheroidization by 2nd digestion solution.
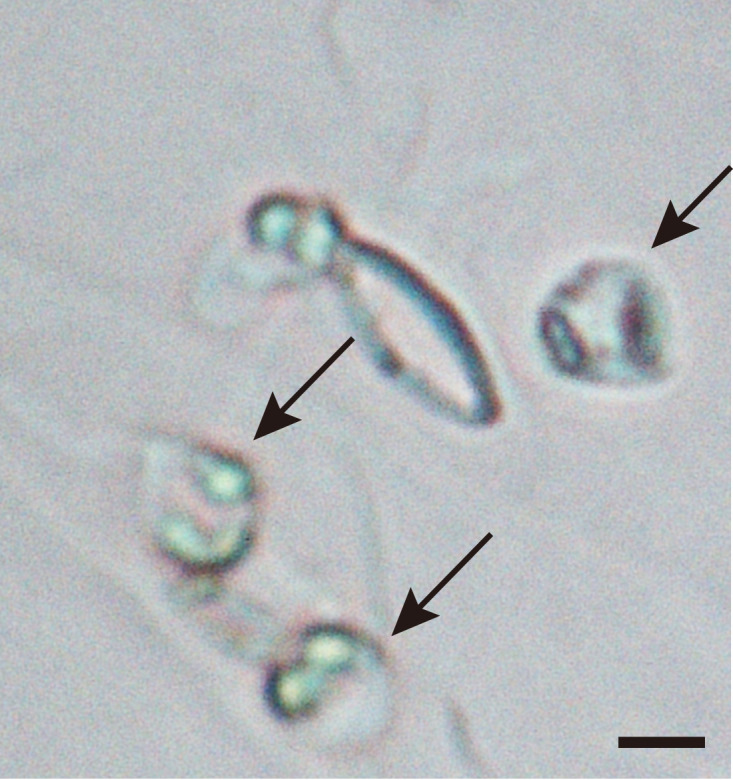
Epidermal fragments were incubated with 2nd digestion solution. The spherical nature of the guard cells was examined under the microscope (Black arrows). The bar represents 10 µm.
Figure 9. Guard cell protoplasts in 0.4 M mannitol and 1 mM CaCl2.
Guard cell protoplasts isolated from Arabidopsis. Guard cell protoplasts were resuspended in 200 to 500 µl 0.4 M mannitol and 1 mM CaCl2. The typical yield of guard cell protoplasts was 4.3 x 10⁷ cells per 5,000 leaves with a purity of 98%. The bar represents 10 µm.
Figure 10. Open glass vessel surrounded by water jacket.
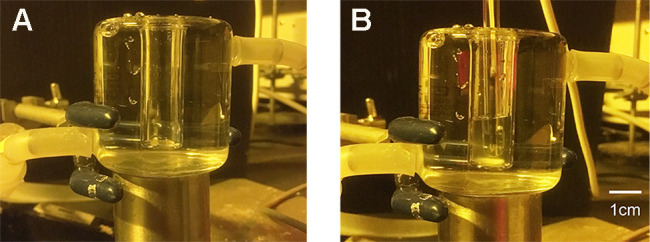
Water was circulated around the vessel in the water jacket through a nylon (or silicone) tube. A. Empty glass vessel; B. pH glass electrode and guard cell protoplasts in the vessel.
Figure 11. LED illuminator.
Both red and blue LEDs were fixed on a plate. When the LEDs were turned off, all LED bulbs were seen as 242-243 dark-brown spots (A. Light off). When red LED was turned on, red-colored light could be seen (B. Red light). When both red and blue LEDS were turned on, the pink-colored light could be seen (C. Red and blue light).
Figure 13. Time course of H+-pumping by guard cell protoplasts in response to blue light (BL).
Guard cell protoplasts in the reaction mixture containing 50 µg proteins were illuminated with a 30 sec pulse of BL (100 μmol m-2 sec-1) superimposed on RL (600 μmol m-2 sec-1). The vertical and horizontal axes indicate pH and time, respectively. The pumping initiated a pH decrease 30 sec after the pulse and reached the maximum rate around 2-3 min after the pulse. The pumping was recorded on a chart recorder at the speed of 20 cm h-1 (= 1 cm 3 min-1). A: Magnitude of pH decrease by the addition of 3 nmol H+. B: Magnitude of H+-pumping in response to a pulse of BL. C: Magnitude of H+-pumping in 3 min in response to BL.
Figure 12. Determination of H+-ATPase by the immunological method.
Immunodetection of H+-ATPase of guard cell after treatment with MG132 ( Yamauchi et al., 2016 ). Guard cell protoplasts from wild-type and aha1-10 mutant were incubated with 50 µM MG132 for 30 min at 24 °C. Upper panel shows immunoblot using H+-ATPase antibodies. Lower panel shows Ponceau S staining as loading control. Each lane contains 5 µg guard cell protein.
Notes
The H+-pumping activities vary with the viability of guard cell protoplasts. An important criterion to obtain viable guard cell protoplasts is enzyme quality (Cellulase RS and R-10). Activity and toxicity, which often cause reduction in protoplast recovery, vary with enzyme lot numbers. We usually check the enzyme activity on a small scale through preparation of the protoplasts and H+-pumping measurement. If the lot produces viable protoplasts, we purchase it in larger amounts.
Recipes
Note: Enzyme solutions for 1st and 2nd digestion should be prepared fresh.
-
1st digestion solution
0.5% (w/v) cellulase R-10
0.05% (w/v) macerozyme R-10
0.1% (w/v) polyvinyl pyrrolidone (PVP-K30)
0.2% (w/v) BSA
0.25 M mannitol
1 mM CaCl2·2H2O
10 mM MES-KOH (pH 5.4)
-
2nd digestion solution
1.5% (w/v) cellulase RS
0.5% (w/v) macerozyme R-10
0.2% (w/v) BSA
0.4 M mannitol
1 mM CaCl2·2H2O
10 mM MES-KOH (pH 5.4)
Adjust pH to 5.4 with 2 N HCl
-
2x H+-pumping buffer
0.25 mM MES-KOH (pH 6.0)
20 mM KCl
0.4 M mannitol
1 mM CaCl2·2H2O
Store at 4 °C
-
Reaction mixture for H+-pumping
500 µl 2x H+-pumping buffer
X µl guard cell protoplasts (50-100 µg protein)
500-X µl 0.4 M mannitol and 1 mM CaCl2
-
Fc stock solution
4 mM Fc in DMSO
Store at -20 °C
-
Reaction mixture for inhibitor treatment
75 µl 2x H+-pumping buffer
X µl guard cell protoplasts (10 µg protein)
75-X µl 0.4 M mannitol and 1 mM CaCl2
-
HCl stock solution
1 mM HCl
Store at room temperature
-
10x TBS
200 mM Tris-HCl (pH 7.4)
1400 mM NaCl
Store at room temperature
-
4x separation buffer
1.5 M Tris-HCl (pH 8.8)
4% (w/v) SDS
Store at room temperature
-
4x stacking buffer
1.0 M Tris-HCl (pH 6.8)
4% (w/v) SDS
Store at room temperature
-
Ammonium peroxodisulfate stock solution
10% (w/v) ammonium peroxodisulfate in distilled water
Store at 4 °C
-
10% acrylamide gel
-
Separation gel
6.7 ml Acrylamide/Bis mixed solution (30% [w/v], Wako Pure Chemical Industries)
5.0 ml 4x separation buffer
200 µl 1% (v/v) ammonium peroxodisulfate stock solution
20 µl 0.1% (v/v) N,N,N’,N’-tetramethylethylenediamine
Add distilled water to the solution until 20 ml
Prepare as required
-
Stacking gel
1.67 ml acrylamide/Bis mixed solution (30% [w/v], Wako Pure Chemical Industries)
2.5 ml 4x stack buffer
100 µl ammonium peroxodisulfate stock solution
10 µl N,N,N’,N’-tetramethylethylenediamine
Add distilled water to the solution until 10 ml
Prepare as required
-
-
DTT stock solution
1 M DTT in distilled water
Store at -20 °C
-
TLCK stock solution
100 mM TLCK in DMSO
Store at -20 °C
-
Ponceau S
0.5% (w/v) Ponceau S
1% (v/v) acetic acid
Store at room temperature
-
Tween 20 stock solution
25% (v/v) Tween 20 in 1x TBS buffer
Store at 4 °C
-
Blocking buffer
5% (w/v) skim milk in T-TBS
Prepare as required
-
T-TBS
0.5% (v/v) Tween 20 in 1x TBS
Store at room temperature
-
Transfer buffer
39 mM glycine
48 mM Tris
20% (v/v) methanol
Store at room temperature
-
3x SDS buffer
30 mM Tris-HCl (pH 8.0)
3 mM EDTA
3% (w/v) SDS
30% (w/v) sucrose
Store at -20 °C
-
1x SDS sample buffer
10 mM Tris-HCl (pH 8.0)
1 mM EDTA
10% (w/v) sucrose
1% (w/v) SDS
0.04% (v/v) 2-mercaptethanol
0.003% (w/v) Coomassie Brilliant Blue G-250
Prepare as required
Acknowledgments
This protocol is adapted from Shimazaki et al. (1986), Ueno et al. (2005), and Yamauchi et al. (2016). This work was supported by JSPS KAKENHI Grant Number 26251032 (to K.S.). There is no conflict of interest.
Citation
Readers should cite both the Bio-protocol article and the original research article where this protocol was used.
References
- 1.Assmann S. M., Simoncini L., and Schroeder J. I.(1985). Blue light activates electrogenic ion pumping in guard cell protoplasts of Vicia faba . Nature 318: 285-287. [Google Scholar]
- 2.Bradford M. M.(1976). A rapid and sensitive method for the quantitation of microgram quantities of protein utilizing the principle of protein-dye binding. Anal Biochem 72: 248-254. [DOI] [PubMed] [Google Scholar]
- 3.Kinoshita T. and Shimazaki K.(1999). Blue light activates the plasma membrane H+-ATPase by phosphorylation of the C-terminus in stomatal guard cells . EMBO J 18(20): 5548-5558. [DOI] [PMC free article] [PubMed] [Google Scholar]
- 4.Shimazaki K., Iino M. and Zeiger E.(1986). Blue light-dependent proton extrusion by guard-cell protoplasts of Vicia faba . Nature 319, 324-326. [Google Scholar]
- 5.Ueno K., Kinoshita T., Inoue S., Emi T. and Shimazaki K.(2005). Biochemical characterization of plasma membrane H+-ATPase activation in guard cell protoplasts of Arabidopsis thaliana in response to blue light . Plant Cell Physiol 46(6): 955-963. [DOI] [PubMed] [Google Scholar]
- 6.Yamauchi S., Takemiya A., Sakamoto T., Kurata T., Tsutsumi T., Kinoshita T. and Shimazaki K.(2016). The plasma membrane H+-ATPase AHA1 plays a major role in stomatal opening in response to blue light . Plant Physiol 171(4): 2731-2743. [DOI] [PMC free article] [PubMed] [Google Scholar]


