Abstract
Neuronal electrical properties are often aberrant in neurological disorders. Human induced pluripotent stem cells (hiPSCs)-derived neurons represent a useful platform for neurological disease modeling, drug discovery and toxicity screening in vitro. Multi-electrode array (MEA) systems offer a non-invasive and label-free platform to record neuronal evoked-responses concurrently from multiple electrodes. To better detect the neural network changes, we used the Axion Maestro MEA platform to assess neuronal activity and bursting behaviors in hiPSC-derived neuronal cultures. Here we describe the detailed protocol for neuronal culture preparation, MEA recording, and data analysis, which we hope will benefit other researchers in the field.
Keywords: Multi-electrode array, Human induced pluripotent stem cells, Neurological diseases, Disease modeling
Background
Human induced pluripotent stem cell (hiPSC) technology is currently being used to model neurological and psychiatric diseases in vitro. Recent studies have demonstrated that certain cellular phenotypes associated with particular disorders can be recapitulated in the dish. Neural electrical activity is at the essence of nervous system function, representing a key form of communication whose normal functioning is essential for emotion, memory, sensory modalities, and behavior in vivo. In disease conditions, the electrical properties can be affected, so it is important to understand neuronal circuit connectivity, physiology, and pathology in hiPSC-based models of neurological disease.
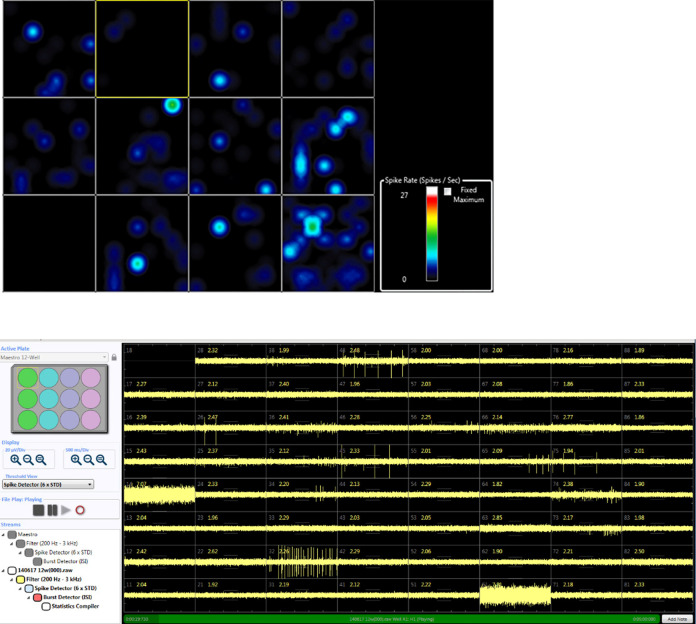
Patch-clamp and multi-electrode array (MEA) technology are the prevailing techniques used to assess electrophysiological activity, and thus neuronal function. While patch-clamp is a powerful intracellular method to investigate the activity and function of a single cell ( Neher et al., 1978 ), an MEA plate has the ability to record extracellular action potentials (or spikes) and local field potentials simultaneously from thousands of different cells in the same plate over time, thus offering a better understanding of neuronal activity at a network level ( Hutzler et al., 2006 ; Obien et al., 2014 ). MEAs are grids of tightly spaced electrodes that are capable of directly sensing changes in extracellular membrane potential in excitable cells and produce real-time trace of neuronal activity. The transparent CytoView 12-well MEA plate contains 64 recording electrodes per well, whereas the 48-well MEA plate contains 12 electrodes per well. The MEA system then parses these voltage traces for action potential waveforms, time-stamps the waveforms, and calculates action potential firing rates on-line for each electrode. This on-line firing rate is represented by color-coded heat-maps that depict real-time and simultaneous indications of network activity, and experimental effects (Figure 1).
Figure 1. Example plate activity heat map, and spike detector.
Top: Heat map of MEA reading visualized using Axion BioSystems Integrated Studio (AxIS). Each box represents one well. Active channels represented by bright light blue dots on the map. Bottom: Offline spiking activity illustrated on AxIS data display.
Materials and Reagents
6-well cell culture plate (Corning, Costar®, catalog number: 3516)
Plastic pipette tips (Corning, Axygen®, catalog number: T-1000-B)
Sterile 1.5 ml centrifuge tubes (Corning, Axygen®, catalog number: MCT-175-C)
15 ml and 50 ml centrifuge tubes (Corning, Falcon®, catalog numbers: 352096 and 352070)
Petri dish (Corning, Falcon®, catalog number: 351029)
Cell lifter (Corning, catalog number: 3008)
12-well MEA plate (Axion BioSystem, catalog number: M768-GL1-30Pt200)
0.22 µm filter (Corning, catalog number: 431097)
Kimwipes (KCWW, Kimberly-Clark, catalog number: 34155)
Sterile water (Thermo Fisher Scientific, GibcoTM, catalog number: 15230162)
Dispase (STEMCELL Technologies, catalog number: 07923)
Y-27632 (STEMCELL Technologies, catalog number: 72302)
Laminin (Thermo Fisher Scientific, GibcoTM, catalog number: 23017015)
LDN-193819 (Stemgent, catalog number: 04-0074)
SB431542 (Sigma-Aldrich, catalog number: S4317)
XAV939 (Stemgent, catalog number: 04-0046)
Recombinant Human Sonic Hedgehog (SHH) (R&D Systems, catalog number: 464-SH-025)
Brain-derived neurotrophic factor (BDNF) (R&D Systems, catalog number: 248-BD-025)
Glial-derived neurotrophic factor (GDNF) (R&D Systems, catalog number: 212-GD-050)
L-Ascorbic acid (Sigma-Aldrich, catalog number: A4403)
N6,2’-O-Dibutyryladenosine 3’,5’-cyclic monophosphate sodium salt (dbcAMP) (Sigma-Aldrich, catalog number: D0260)
50% poly(ethyleneimine) (PEI) solution (Sigma-Aldrich, catalog number: P3143)
Accutase (STEMCELL Technologies, catalog number: 07920)
Tetrodotoxin (TTX) (Alomone Labs, catalog number: T-500)
N2 (Thermo Fisher Scientific, GibcoTM, catalog number: 17502048)
B27 (Thermo Fisher Scientific, GibcoTM, catalog number: 17504044)
Modified Eagle’s Medium-Non Essential Amino Acid (MEM-NEAA) (Thermo Fisher Scientific, GibcoTM, catalog number: 11140050)
L-Glutamine (Thermo Fisher Scientific, GibcoTM, catalog number: 25030081)
Penicillin-streptomycin (Pen-Strep) (Thermo Fisher Scientific, GibcoTM, catalog number: 15140122)
Dulbecco’s modified Eagle’s medium: Nutrient Mixture F-12 (DMEM/F12) (Thermo Fisher Scientific, GibcoTM, catalog number: 11320082)
Neurobasal medium (Thermo Fisher Scientific, GibcoTM, catalog number: 21103049)
N2 Supplement-A (STEMCELL Technologies, catalog number: 07152)
NeuroCultTM SM1 (STEMCELL Technologies, catalog number: 05711)
BrainPhysTM neuronal medium (STEMCELL Technologies, catalog number: 05790)
Boric acid (Sigma-Aldrich, catalog number: B6768)
Sodium tetraborate (Sigma-Aldrich, catalog number: 221732)
Hydrochloric acid fuming 37% (Merck, catalog number: 100317)
N2B27 medium (see Recipe 1)
BrainPhys medium (see Recipe 2)
Borate buffer (see Recipe 3)
Equipment
-
Pipettes
P10 (Gilson, catalog number: F144802)
P200 (Gilson, catalog number: F123601)
P1000 (Gilson, catalog number: F123602)
Tissue culture hood (Gelman, model: BH Class II Type A2 series)
37 °C water bath (Thermo Fisher Scientific, Thermo ScientificTM, model: Labline 183, catalog number: 2835)
Cell culture incubator (Thermo Fisher Scientific, Thermo ScientificTM, model: HeracellTM I50i CO2, catalog number: 50116047)
Centrifuge (Eppendorf, model: 5810, catalog number: 5810000424)
Cell counter Countess II (Thermo Fisher Scientific, model: CountessTM II, catalog number: AMQAX1000)
Phase contrast microscope (Leica DMIL LED Inverted Fluorescence microscope) (Leica Microsystems, model: Leica DM IL LED)
Maestro MEA system (Axion Biosystem)
Software
Axion Biosystems Integrated Studio (AxIS, Axion Biosystem)
Neural Metric tool (Axion Biosystem)
Neuroexplorer (NEX, Plexon)
MATLAB (R2016a)
Excel (Microsoft Office)
Procedure
-
Preparation of hiPSC-derived neurons
Forebrain neurons were differentiated from hiPSCs as described previously ( Xu et al., 2017 ).
Aspirate old medium from wells of hiPSCs maintained in a 6-well plate.
Add 1 ml dispase (1 mg/ml) into wells and incubate for 5 min at 37 °C.
Add 2 ml DMEM/F12 into wells and transfer the lifted cell clumps into a 15 ml centrifuge tube using a 5 ml plastic pipette.
Spin down cells at 160 × g for 3 min at room temperature.
Remove and discard the supernatant.
-
Re-suspend and rinse the cell clumps twice with 10 ml of DMEM/F12 to remove the remaining dispase.
Note: It is important to completely remove dispase via multiple washes. Failure to remove dispase will affect cell reattachment when plated.
Re-suspend cell clumps using 10 ml N2B27 medium (see Recipe 1) supplemented with 10 μM Y-27632, and culture them on uncoated 10 cm Petri dishes for 8 h at 37 °C.
Collect cell aggregates and plate them on dishes pre-coated with 10 μg/ml poly-L-ornithine and 10 μg/ml laminin in N2B27 medium supplemented with 100 nM LDN193189, 10 μM SB431542, and 2 µM XAV939.
From Day 5, 200 ng/ml SHH is added to the differentiated cells.
Change medium every other day.
-
On Day 15, passage cells with a cell lifter at a split ratio of 1:1.
Note: These cells will be referred to as neural progenitor cells (NPCs).
Expand the NPCs in N2B27 medium supplemented with 20 ng/ml BDNF, 2 µM XAV939, and 200 ng/ml SHH for five days.
For neuronal differentiation, the NPCs are cultured in N2B27 medium supplemented with 20 ng/ml BDNF and 20 ng/ml GDNF, 0.2 mM ascorbic acid, and 0.5 mM dbcAMP.
-
Exchange 50% medium every three days.
Note: Neurons at days of 46 to 50 were dissociated and re-plated on MEA plate.
-
MEA plate coating
Coat MEA plate with PEI solution just before the day of seeding neurons according to Axion’s cell culture protocol on MEA plate.
(https://www.axionbiosystems.com/sites/default/files/resources/icell_neuron_culture_protocol.pdf).
Prepare 0.1% PEI solution by diluting 50% PEI solution in borate buffer (see Recipe 3).
-
Filter the 0.1% PEI solution through a 0.22 µm filter.
Note: 0.1% PEI solution can be stored at 4 °C for up to 1 month.
Add 200 µl of 0.1% PEI solution to each well of the MEA plate and incubate plate at room temperature for 1 h.
Aspirate the PEI solution from the MEA plate.
Rinse each well 4 times with 500 μl sterile water.
-
Air-dry the MEA plate with the lid off in tissue culture hood overnight.
Note: It is essential to allow the MEA plate to air-dry overnight to achieve optimal cell adhesion.
-
Seeding neurons
Aspirate medium from neurons, and add 1 ml DMEM/F12 to wash neurons once at room temperature.
Aspirate DMEM/F12, add 0.5 ml accutase into neurons, and incubate for 5 min in a 37 °C incubator.
Add 2 ml DMEM/F12 into cells, and gently pipette up and down several times.
Transfer cell suspension into a 15 ml centrifuge tube, and wash plate once using 2 ml DMEM/F12 to transfer all cells into 15 ml centrifuge tube.
-
Re-suspend cells and take 10 µl for viable cell counting using a cell counter.
Note: Gentle pipetting is essential to increase cell viability.
Spin cells at 201 × g for 4 min at room temperature.
Aspirate the supernatant above the cell pellet without disturbing the pellet.
-
Dilute the laminin solution in complete N2B27 medium to a final concentration of 10 µg/ml.
Note: Thaw laminin stock at 4 °C and don’t vortex laminin solution.
Re-suspend the cell pellet using 10 µg/ml laminin solution to a final concentration of 28,000 viable cells/µl.
-
Seed a 5 µl droplet of the suspension (140,000 cells) directly on the center of each PEI coated well over the recording electrode area.
Note: Do not let the tips to touch the MEA plate bottom.
-
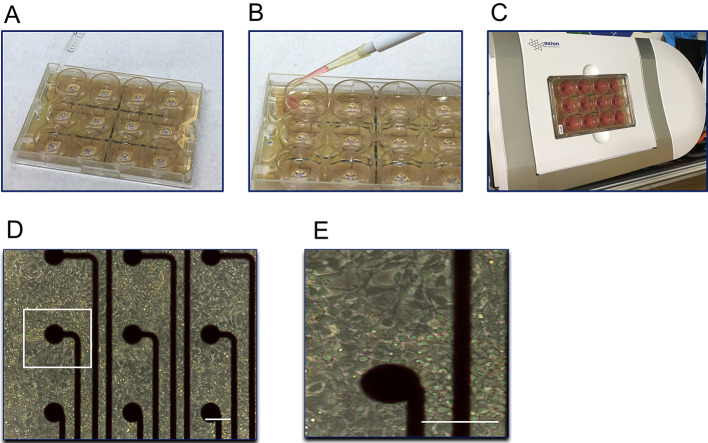
Add sterile water to the area surrounding the wells of MEA plate to prevent substrate evaporation (Figure 2A).
Note: MEA reservoir water is no longer required following the media addition in step C13.
-
Incubate the MEA plate with the seeded neurons at a 37 °C incubator for 1 h.
Note: Do not allow the cell suspension droplets to dry before adding additional complete N2B27 medium.
Gently add 100 µl complete N2B27 medium down the side of each well of the MEA plate (Figure 2B).
Repeat step C13 four more times to reach a final volume of 500 µl/well.
Incubate MEA plate at a 37 °C incubator with 5% CO2.
-
Next day, aspirate spent medium and add 1 ml fresh N2B27 medium or Brainphys medium (see Recipe 2) supplemented with 20 ng/ml BDNF, 20 ng/ml GDNF, 0.5 mM dbcAMP, and 0.2 mM ascorbic acid.
Note: The neurons can be viewed using a phase contrast microscope (Figures 2D-2E).
-
Exchange 50% medium every 2-3 days by aspirating 500 µl of spent medium from each well and adding 500 µl of fresh complete medium.
Note: To avoid any influence of immediate medium change on neuronal activity, start recording not earlier than 1 h after the last media change.
-
MEA recordings and data acquisition
Turn on the Maestro MEA system using the power switch on the back of the Middleman.
Power on AxIS software and click on the temperature icon to 37 °C.
-
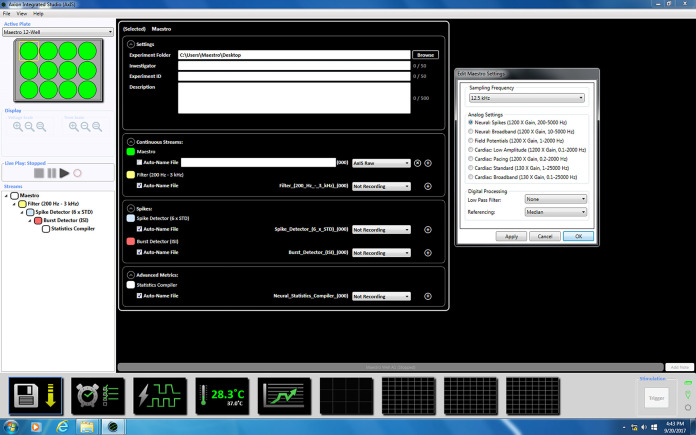
Set up experiment in AxIS (Figure 3):
Adjust Maestro acquisition settings by selecting neural mode from the configuration.
Set analog settings, choose ‘Neural: spikes (1,200 x Gain, 200-5,000 Hz).
Use ‘Median’ Referencing to reduce noise in neural mode.
Select data streams for recording.
-
Choose recording duration.
Note: Neuronal activity is very variable and typically needs at least 5 min for adequate statistics.
Add experiment descriptions, notes, and plate maps.
-
Place the MEA plate in the plate cavity (Figure 2C).
Note: Do not touch the metal bottom part of MEA plate.
Equilibrate the plate on the Maestro for 5-10 min.
Click ‘play’ to start the voltage offset and wait until it is complete.
Press ‘Start Schedule’ to record data.
Data will be automatically saved once the recording is done.
-
TTX treatment
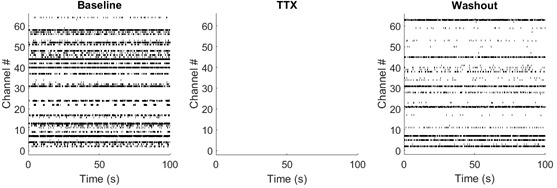
Tetrodotoxin (TTX), a potent neurotoxin, inhibits the firing of action potentials in neurons by binding to the voltage-gated sodium channels in nerve cell membranes and blocking the passage of sodium ions into the neuron. Here, we test whether hiPSC-derived neurons can respond to TTX treatment (Figures 4 and 5).
Dissolve TTX at a pH of 7.4 in sodium acetate buffer to get 1 mM stock solution.
Record baseline for MEA plate before adding TTX.
Add 0.5 µl TTX into MEA wells to get a final concentration of 1 µM TTX.
Incubate cells for 5 min.
Record data after TTX treatment.
Wash out TTX using BrainPhys medium and incubate plate overnight.
Record neuronal activity after TTX washout.
-
Data filtering and data extraction
Since raw data was sampled at 12.5 kHz, it can be analyzed offline both in the low-frequency band (10-300 Hz), representative of local field potential (LFP) signal ( Buzsáki et al., 2012 ), as well as high-frequency band, representative of action potential (AP) (Quian Quiroga and Panzeri, 2009). For our current study, we chose to focus on the extracellular AP quantification and high-pass filter the data. Filtering of data and spike detection (as timestamps) was performed using AxIS, according to the following steps:
Recorded raw data files (.csv) were opened in AxIS. Data were band-pass filtered in the range 200 Hz-3 kHz using the AxIS digital filter to yield multi-unit data. Neuronal spikes were detected using a threshold set to 6 times standard deviation (6SD) above the mean noise level ( Pouzat et al., 2002 ; Obien et al., 2014 ). A new file (.spk) was obtained for each recording day containing information such as spike timestamps and waveforms, as well as electrode (channel) and well indices.
Multiunit spike data were subsequently imported into NEX, which contains a toolbox to identify AxIS .spk data formats. From NEX, spike data was exported into MATLAB as timestamps, and grouped per channel per well.
In MATLAB, each individual recording was saved as .mat file, and later loaded for analysis.
Figure 2. Representative images of MEA plate handling.
MEA plate with sterile water surrounding the wells to prevent the evaporation (A). Recommended method of pipetting medium into MEA wells to avoid damaging the cells (B). MEA plate placed in the plate cavity (C). hiPSC-derived neurons plated around recording electrodes (D). A zoomed-in view of the marked white square in panel (D), showing neurons surrounding one of the recording electrodes (E). Scale bars = 100 μm.
Figure 3. A snapshot of experiment setup in AxIS.
Figure 4. Representative raster plots of individual channel spiking activity from baseline, TTX treatment, and TTX washout.

Raster plots showing high spiking activity during baseline (A), which is completely abolished by application of 1 µM TTX (B), and is recovered after washout of TTX (C); x-axis corresponds to time, y-axis corresponds to channel.
Figure 5. TTX effects on hiPSC-derived neurons.

Mean spike frequency (A), maximum spike frequency (B), and the average number of channels without spiking activity (C) for representative hiPSC-derived neurons. Bar graphs show mean ± SEM.
Data analysis
Inbuilt and custom written MATLAB functions were employed to generate raster plots and illustrate spike activity for the investigated conditions.
Raster plots across experiments were used to visually examine wells whose overall spiking activity was different from control wells over time. Any unusual activity, or pattern, was further investigated using inter-stimulus interval, burst analysis or spike frequency analysis (see below). Each well was illustrated in a separate raster plot, and labeled with its corresponding condition name. For every individual channel, the timestamp of each spike detected was graphically plotted. In the raster plot, each column (y-axis) represents the channel number corresponding to each electrode, whereas the column (x-axis) represents the time each spike was detected (Figure 4).
Spike activity analysis included calculating the total number of spikes, the mean and maximum spike frequency, and the total number of unresponsive channels (or channels with no spiking activity) for each experimental condition. In this case, each condition was represented by three wells.
Several parameters were initialized, including date of experiment, experimental conditions (i.e., control, treatment, media etc.), and well labels.
As recording time varied slightly across experiments, data were truncated to the first 300 sec of recordings, and only relevant timestamps included for further analysis.
Wells or channels with no spiking activity, or where only one spike for the whole recording was detected, were excluded from frequency analysis.
The total number of channels with no spiking activity was counted for each well. The average number of channels per experimental condition was averaged.
The total number of occurring spikes was counted for each channel within each well.
Spike frequency was calculated for each channel as the total number of spikes divided by the recording duration.
Wells containing the same cell type in the same experimental condition were pooled together for descriptive statistics analysis.
Outliers were removed using a custom-written function by Brett Shoelson in 2009 based on an iterative implementation of the Grubbs Test (Grubbs, 1950).
Descriptive statistics for the spike frequency, such as mean, maximum and standard error of the mean (SEM), were calculated for each well (or wells, if one condition included more than one wells).
Data were plotted in a bar plot format to illustrate the differences in mean and maximum spiking frequency between conditions (Figures 5A and 5B), as well as the number of channels with no spiking activity (Figure 5C).
Recipes
-
N2B27 medium (500 ml)
5 ml N2
10 ml B27
5 ml MEM-NEAA
2.5 ml L-glutamine
5 ml Pen-Strep
236.25 ml DMEM/F12
236.25 ml neurobasal medium
-
BrainPhys medium (500 ml)
10 ml NeuroCultTM SM1 neuronal supplement
5 ml N2 Supplement-A
485 ml BrainPhysTM neuronal medium
-
Borate buffer (500 ml)
1.55 g of boric acid
2.375 g of sodium tetraborate
500 ml distilled water
Adjust to a final pH of 8.4
Acknowledgments
The described methods were previously published in Xu et al. (2017). The work was partly funded by a Strategic Positioning Fund for Genetic Orphan Diseases (SPF2012/005) and a Joint Council Office Project grant (1431AFG122) from the Agency for Science Technology and Research (Singapore), and a Tier 1 grant R-172-000-297-112 from the Ministry of Education (Singapore) to M.A.P. C.R. is supported by the A*STAR Research Attachment Programme (ARAP). The authors declare that there are no conflicts of interests or competing interests.
Citation
Readers should cite both the Bio-protocol article and the original research article where this protocol was used.
References
- 1.Buzsáki G., Anastassiou C. A. and Koch C.(2012). The origin of extracellular fields and currents--EEG, ECoG, LFP and spikes. Nat Rev Neurosci 13(6): 407-420. [DOI] [PMC free article] [PubMed] [Google Scholar]
- 2.Grubbs F. E.(1950). Sample criteria for testing outlying observations. The Annals of Mathematical Statistics 21(1): 27-58. [Google Scholar]
- 3.Hutzler M., Lambacher A., Eversmann B., Jenkner M., Thewes R. and Fromherz P.(2006). High-resolution multitransistor array recording of electrical field potentials in cultured brain slices. J Neurophysiol 96(3): 1638-1645. [DOI] [PubMed] [Google Scholar]
- 4.Neher E., Sakmann B. and Steinbach J. H.(1978). The extracellular patch clamp: a method for resolving currents through individual open channels in biological membranes. Pflugers Arch 375(2): 219-228. [DOI] [PubMed] [Google Scholar]
- 5.Obien M. E., Deligkaris K., Bullmann T., Bakkum D. J. and Frey U.(2014). Revealing neuronal function through microelectrode array recordings. Front Neurosci 8: 423. [DOI] [PMC free article] [PubMed] [Google Scholar]
- 6.Pouzat C., Mazor O. and Laurent G.(2002). Using noise signature to optimize spike-sorting and to assess neuronal classification quality. J Neurosci Methods 122(1): 43-57. [DOI] [PubMed] [Google Scholar]
- 7.Quian Quiroga R. and Panzeri S.(2009). Extracting information from neuronal populations: information theory and decoding approaches. Nat Rev Neurosci 10(3): 173-185. [DOI] [PubMed] [Google Scholar]
- 8.Xu X., Tay Y., Sim B., Yoon S. I., Huang Y., Ooi J., Utami K. H., Ziaei A., Ng B., Radulescu C., Low D., Ng A. Y., Loh M., Venkatesh B., Ginhoux F., Augustine G. J. and Pouladi M. A.(2017). Reversal of phenotypic abnormalities by CRISPR/Cas9-mediated gene correction in Huntington disease patient-derived induced pluripotent stem cells. Stem Cell Reports 8(3): 619-633. [DOI] [PMC free article] [PubMed] [Google Scholar]


